Article

Insights on the Evolutionary History and Genetic Patterns of Octopus vulgaris Cuvier, 1797 in the Northeastern Atlantic Using Mitochondrial DNA

by
Trinidad Pérez
1,*,†,
Andrea Romero-Bascones
1,†,
Negin Pirhadi
1,
Ruth Coya
1,
María del Pino Fernández-Rueda
2,
Isabel Márquez
3,
Lucía García-Flórez
2 and
Yaisel J. Borrell
1
1
Department of Functional Biology, Genetics, University of Oviedo, 33006 Oviedo, Spain
2
CEP Fisheries Experimentation Centre, Directorate General of Maritime Fisheries (DGPM), Regional Ministry of Rural Development and Natural Resources from the Principality of Asturias, 33212 Gijón, Spain
3
Animal Health Area, SERIDA, 33394 Gijón/Xixón, Spain
*
Author to whom correspondence should be addressed.
These authors contributed equally to this work.
Animals 2023, 13(17), 2708; https://doi.org/10.3390/ani13172708
Submission received: 27 July 2023 / Revised: 20 August 2023 / Accepted: 24 August 2023 / Published: 25 August 2023
(This article belongs to the Special Issue Assessment and Management of Cephalopod Fisheries and Ecosystems)

Abstract

:

Simple Summary

The artisanal octopus fishery is a great tradition and has a large economic impact in Northern Spain. Despite its importance, there is scarce genetic information for this exploited population. The uniqueness of an exploited population and the effects that exploitation may have on its long-term survival is essential information that can be obtained by studying the past and current spatial and temporal genetic patterns. The mitochondrial DNA is used here as a genetic tool to gain insight into Northeast Atlantic octopus populations and their evolutionary history. Although it is not sensitive enough to detect differences in nearby populations, it allows us to differentiate the two main lineages that originated during the Quaternary glaciations. One of the lineages is present exclusively in northern latitudes and the other mainly in the south, although, for the first time, its presence is demonstrated also in the north of the Iberian Peninsula. This implies a more continuous distribution than previously thought for this lineage. We also detect temporal changes in the distribution of the two lineages in contact zones. These changes seem to be associated with the effect of changing oceanographic conditions. Future studies on these associations could be of interest for fisheries in the scenario of global climate change.

Abstract

Octopus vulgaris is one of the most harvested octopus species in the world. In the Iberian Peninsula, there are several small-scale fisheries that have a long-term tradition of harvesting octopus. The Asturias fleet (in Northern Spain) has an internationally recognized MSC label for its exploitation. Of concern, genetic assessments of exploited stocks are currently scarce, which could prevent the implementation of adequate managing strategies. We use two mitochondrial regions (cytochrome oxidase subunit 1 and control region) to analyze the genetic status and evolutionary events that conditioned octopus populations’ characteristics in the Northeastern Atlantic. A total of 90 individuals were sampled from three different localities in the Iberian Peninsula as well as a location in Macaronesia. Temporal genetic analyses on Asturias and Algarve populations were also performed. Results indicated the absence of fine spatial genetic structuring but showed the Canary Islands (in Macaronesia) as the most distinct population. Our analyses detected two distinct clades, already described in the literature, but, for the first time, we confirmed the presence of the α-southern haplogroup in the Northern Iberian Peninsula. This result indicates a more continuous cline for the distribution of these two haplogroups than previously reported. Temporal changes in the distribution of both haplogroups in contact zones were also detected.

1. Introduction

Artisanal fisheries represent a source of employment and economic income for many regions around the world. Overall, 90% of all fishers recorded worldwide belong to this sector [1]. Especially in the Cantabrian Sea, Northern Spain, there are many representative small-scale fisheries with a long-term fishing tradition [2]. Targeted species of these small-scale fisheries are several commercial fish (hake, mackerel, sardine) but also marine invertebrates [2,3]. For instance, the Asturian and Galician fleets in Northern Spain have a long-term tradition involving cephalopods and crustaceans [3]. Despite the economic and social importance of traditional fisheries, they are under vulnerable conditions, mainly due to political or economic interests, the overexploitation of species by industrial fisheries and the effects of environmental changes [4]. Therefore, there is a need for the social and global protection of this sector in different areas to achieve sustainable fishing that allows the survival of artisanal fisheries [5].
One of the main issues hindering the protection of traditional fisheries is a reported lack of biological data about the fish stocks, including the absence of any type of sustainability assessment [6,7]. The problem is even more serious in the case of invertebrates, where the stock situation is often more difficult to evaluate than for other vertebrates due to the lack of adequate models able to capture the biological features of the species [8]. This situation, together with the lack of fisheries’ independent data for some species and/or scientific campaigns that validate these data, highlights the need for an efficient stock evaluation for this marine group [9].
The common octopus, Octopus vulgaris Cuvier, 1797, is one of the most commercially valuable species of cephalopods, mainly fished in the Northern Atlantic, the Mediterranean and Western Africa [10]. Spain is one of the countries with the highest demand for octopus and it is also one of the main contributors to European landings of cephalopods [11]. Artisanal octopus fishing with traps in Western Asturias (northwest of Spain) achieved the Marine Stewardship Council’s (MSC) eco-certification in 2016 and was recertificated in 2021. This ecolabel validated the fishery as sustainable and environmentally friendly, since it has a minimal impact on the marine ecosystem [12], making this artisanal fishery the world’s first cephalopod fishery with this accreditation. However, a lack of biological information was then reported by the BUREAU VERITAS IBERIA, which is the certifying body, and they recommended that “information on the knowledge of octopus populations need to be improved” [13]. From this point, several research projects and studies were undertaken around this fishery: octopus stock assessment model development [8], octopus genetic structure assessments using microsatellites [14] and also octopus juvenile survival after catch-and-release experiments, studies on possible bycatch species, such as the knobbed triton (Charonia lampas (Linnaeus, 1758)), bait types and socioeconomic studies [15]. These efforts have allowed the recertification of the fishery as sustainable by the MSC recently [15].
DNA analysis using molecular markers is a powerful tool to improve the knowledge of the species dynamics and to help in its sustainable exploitation. From the different molecular markers in use, two of the most frequently adopted are nuclear microsatellites and mitochondrial DNA (mtDNA) [16]. The former allow us to infer precise genetic structuring patterns [17], while mtDNA helps to interpret the history of a species as it gives information about past events. For instance, it can help to clarify how the last glaciation and interglaciation periods affected the distribution of a marine species and identify phylogeographic breaks or barriers [18]. In addition, the distinct rates of mutation of different regions of mtDNA allow us to identify and characterize organisms at the species or population levels [19].
Historically, O. vulgaris was considered a globally distributed species. However, during the past twenty years, research based mainly on mtDNA markers [20,21,22,23,24,25] has suggested that populations previously treated as O. vulgaris are in fact a species complex of morphologically similar but genetically distinct vulgaris-like species. Within this complex, O. vulgaris sensu stricto is described as a widely distributed species that occurs from the Northeastern Atlantic down to Midwestern Africa, including the Mediterranean [25,26]. However, some authors argue that there is a substructure within this species in some areas that should be carefully analyzed and may harbor different managing populations [9]. Supporting this, some studies have observed significant genetic structures of O. vulgaris within the Mediterranean and between the Atlantic and Mediterranean, suggesting independent management for each basin [27]. The management of the Eastern Atlantic populations is more controversial and still ambiguous. Using mtDNA markers, some studies [28,29] have reported a single-clade compelling population in the Northern Iberian Peninsula and the western coasts of Africa. Meanwhile, others [30,31] observe a clear break between Northern Iberia and Senegal and the presence of two distinct clades, one along the Northeastern Atlantic and another from southern latitudes, both present in Atlantic Macaronesia.
These contrasting findings suggest the need to implement efforts to investigate the genetic units of O. vulgaris in the Northeastern Atlantic. This is especially relevant for O. vulgaris active fisheries in Northwestern Africa [26,32] and for the long-time harvesters in the Northern Iberian Peninsula [2]. African populations have been previously analyzed in several studies [31,33,34], but we still lack a complete genetic study on exploited octopus populations in the southern area of the Bay of Biscay. Available studies in the Cantabrian Sea are few and only involve nuclear markers [14,35]. In the case of Asturian fisheries, the determination of the management units and the present status of the populations of octopus in the area has been crucial to achieve the objectives demanded for an internationally certified fishery. Moreover, the annual catches and recruitment of this fishery have fluctuated over the years and may have affected population dynamics [8]. This study performed, for the first time, an mtDNA analysis across the Northern Iberian populations as well as a temporal analysis of the harvested populations, something that, until now, has not been previously documented.
The objectives of the present study were (1) to address, for the first time, the presence of spatial and/or temporal genetic structures of O. vulgaris within the Northeastern Atlantic using two mitochondrial markers (cytochrome c oxidase subunit I (cox1) and control region (CR)) and give insights into whether the mtDNA is a useful tool to implement scientifically based management strategies for the sustainable exploitation of this species; (2) to unravel demographic past events that may have conditioned the current genetic patterns of this valuable species.

2. Materials and Methods
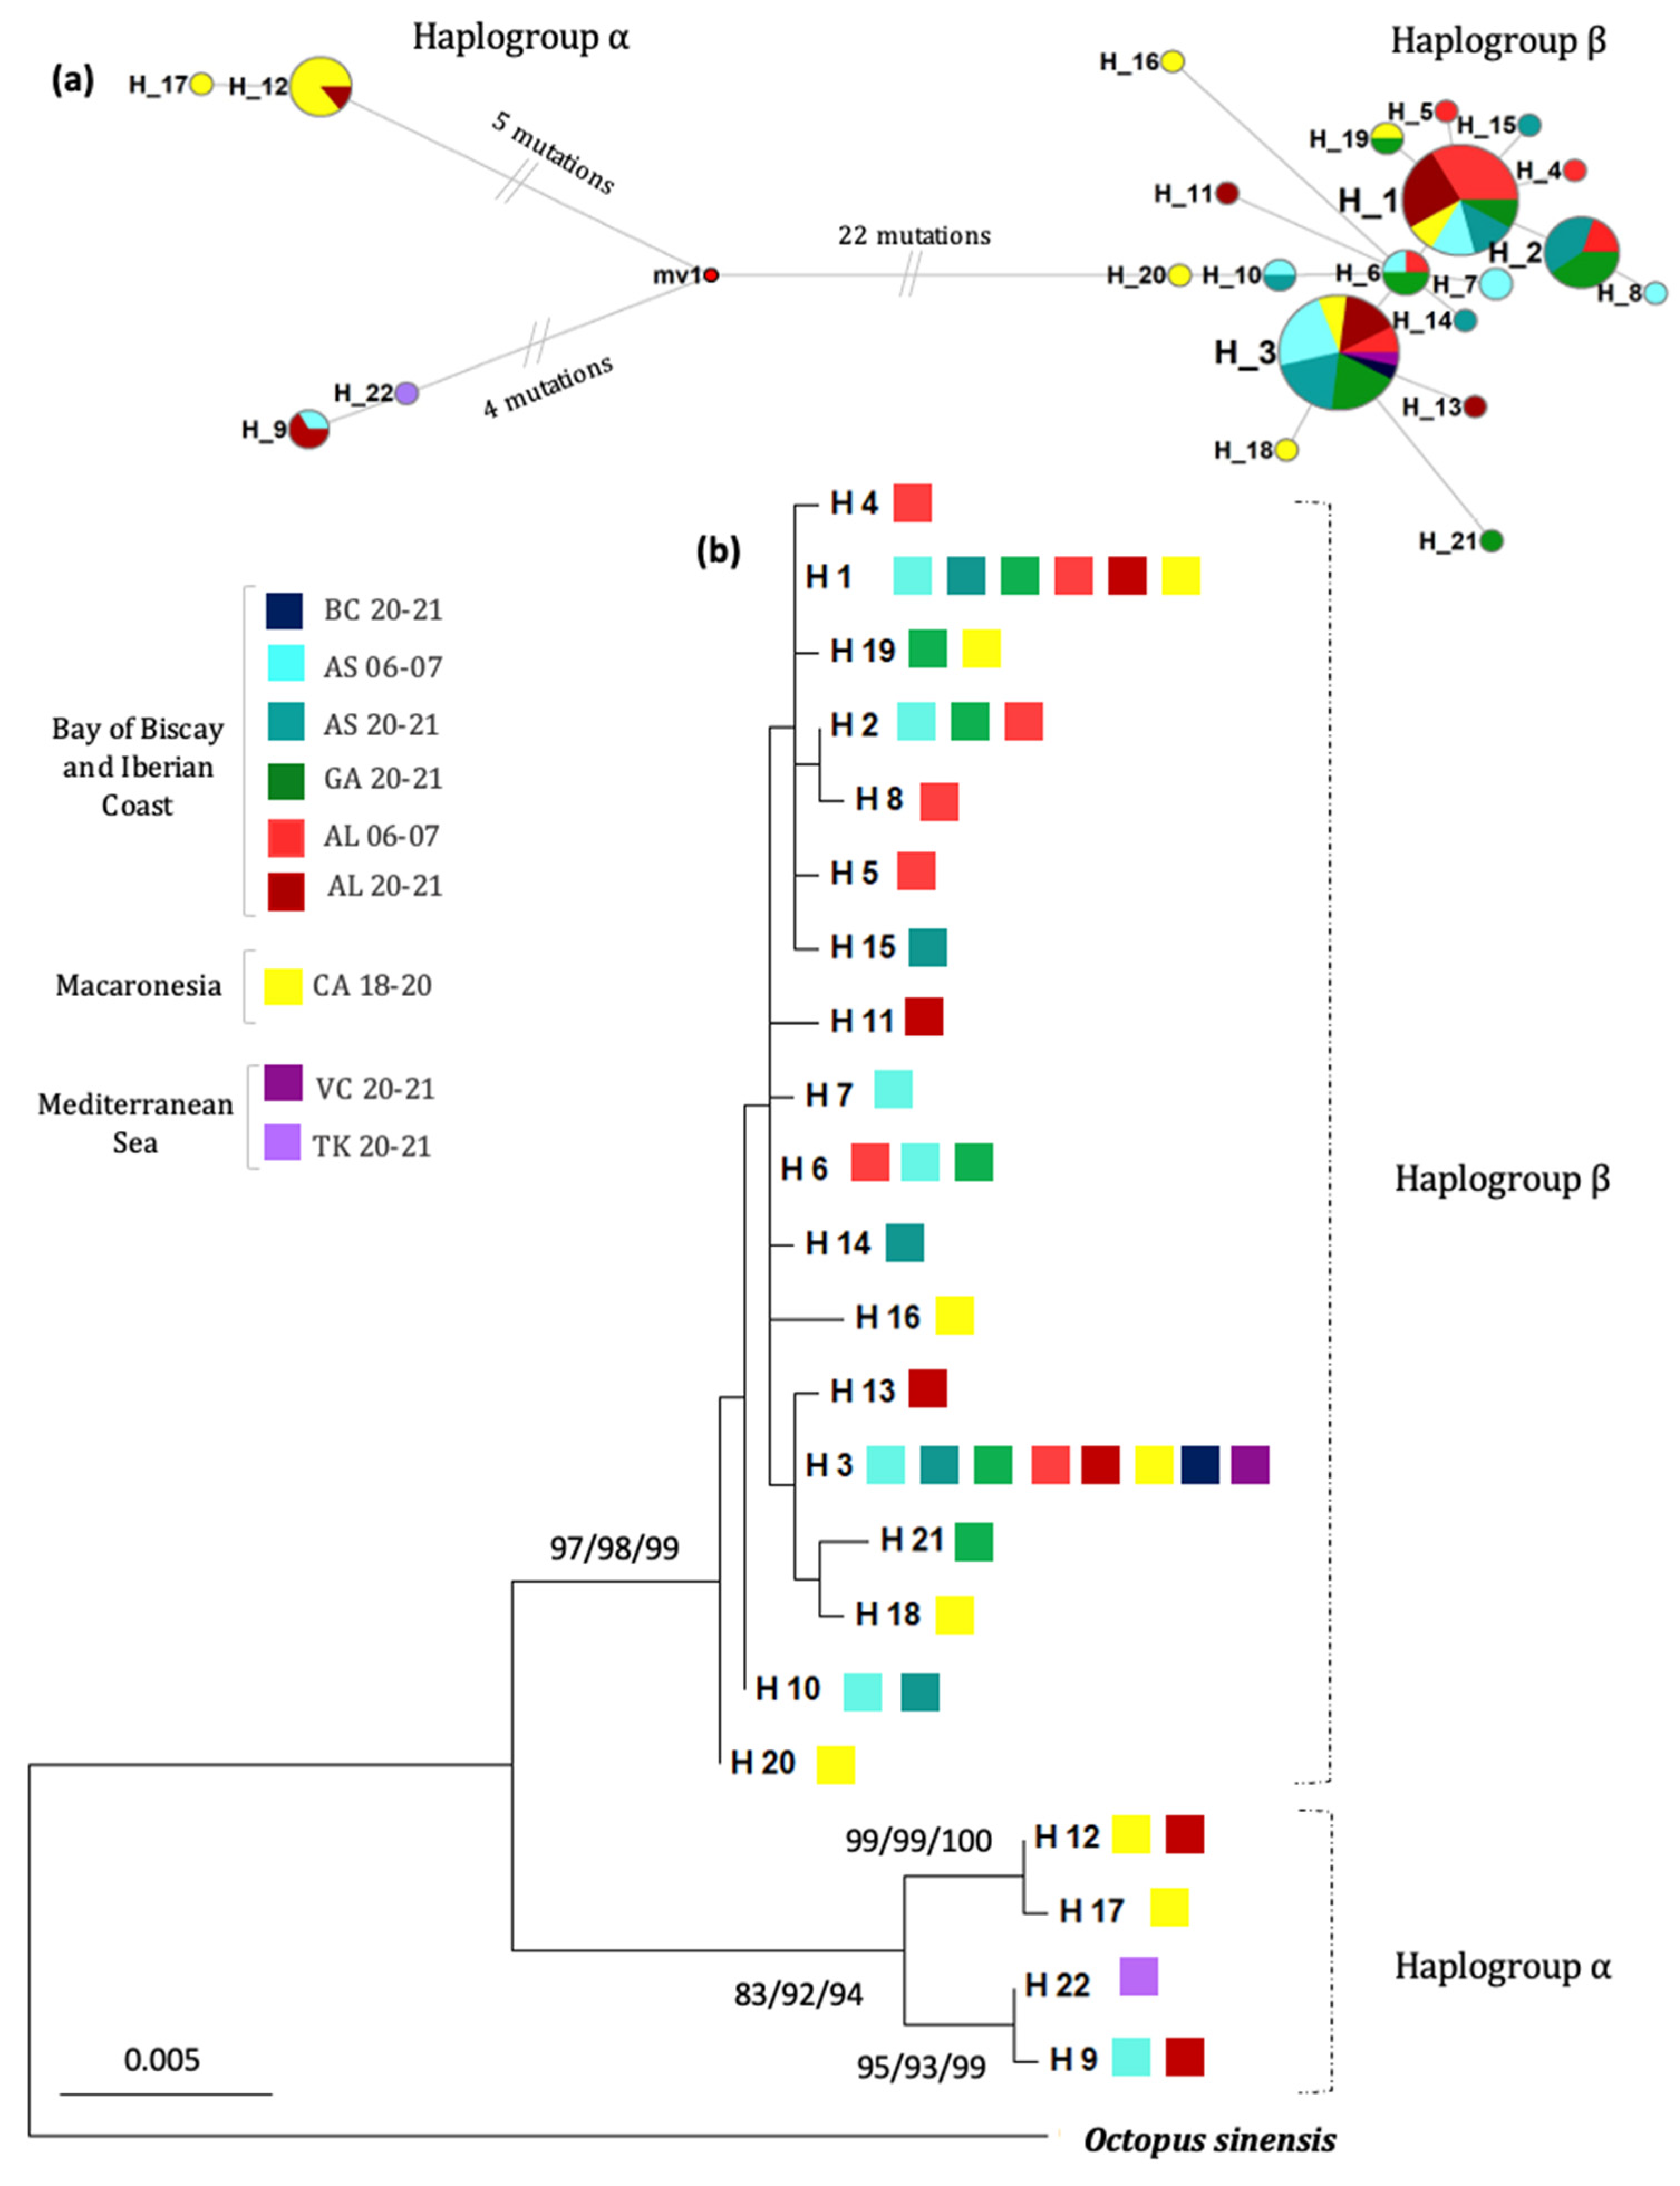
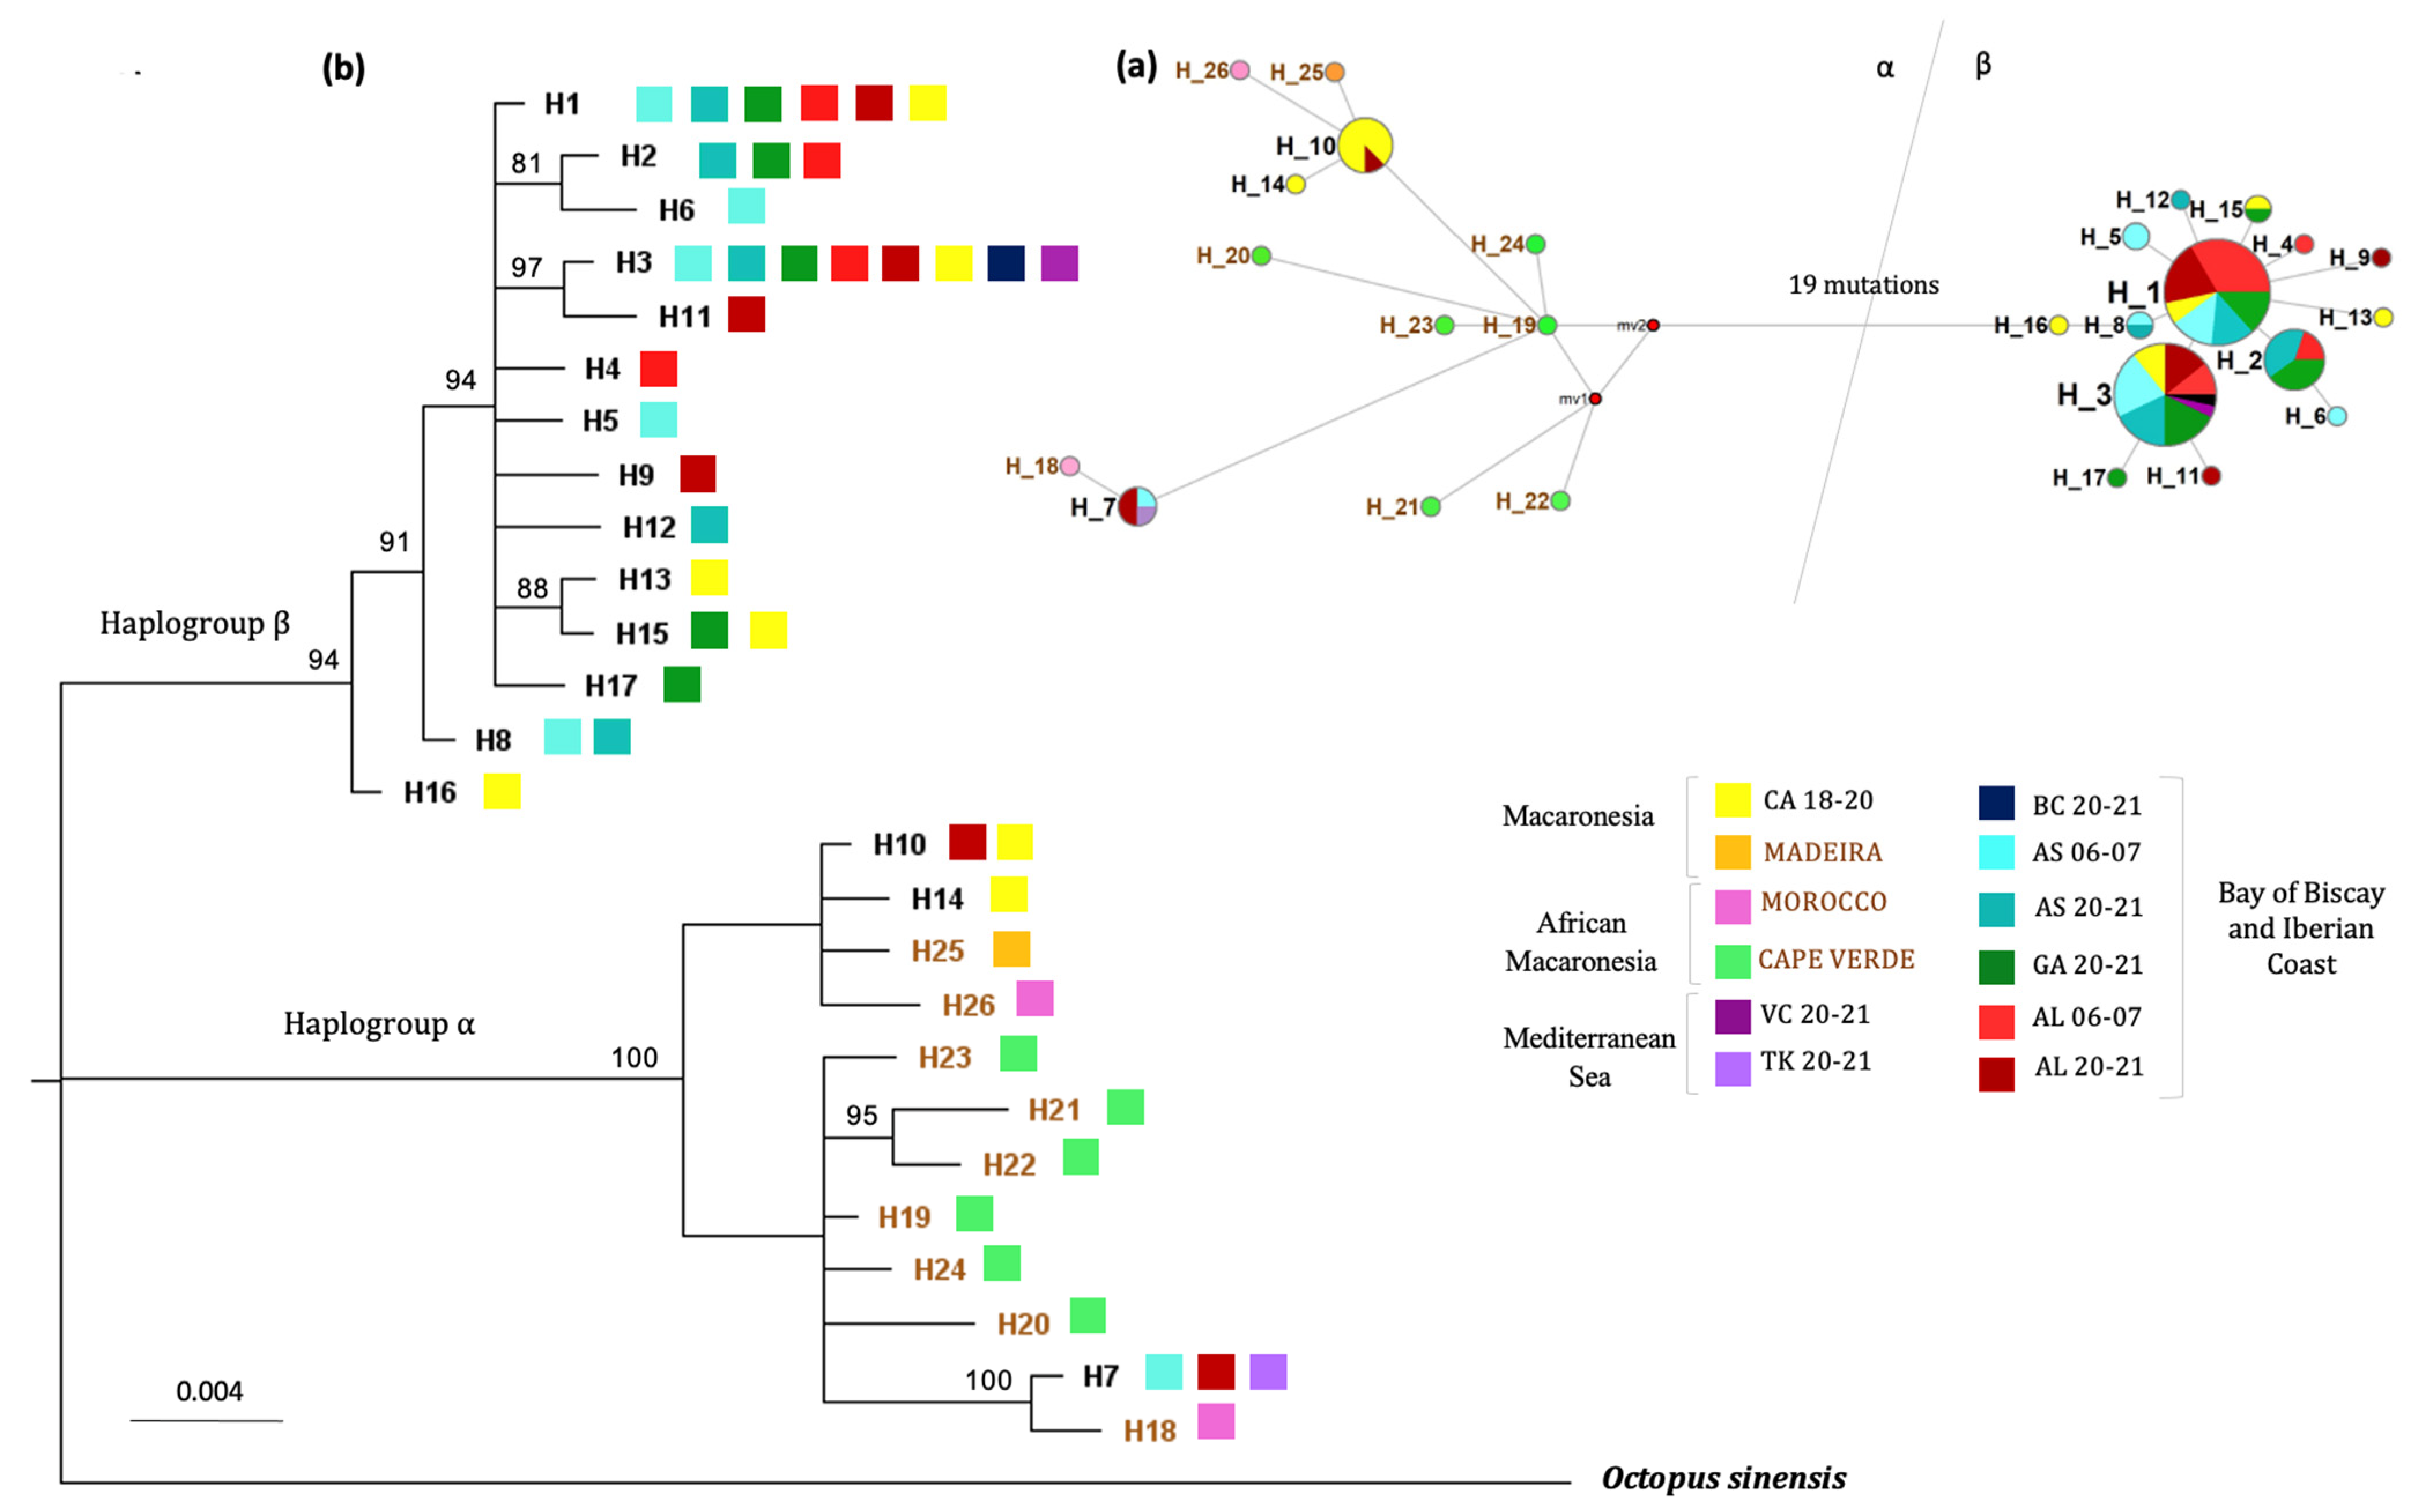
Samples of Octopus vulgaris were collected from four different localities in the Northern Atlantic Ocean: two in the Northern Spanish Iberian Peninsula (Asturias, Galicia), one in a continental locality in Algarve, Southern Portugal, and one in the archipelago of the Canary Islands (Macaronesia). All samples (n = 15 per site) were collected by artisanal fisheries during the 2020–2021 fishing season, except those from the Canary Islands, which were collected during the 2018–2020 period. Another 30 samples from the 2006–2007 fishing season from two of the previous localities (Asturias and Algarve, 15 samples each) were available, allowing us to test for the existence of genetic changes on a temporal scale (see Table 1 and Figure 1). All 90 samples were collected in tubes with ethanol 70% and stored at 4 °C until needed. Additionally, three samples (one from Basque Country (BC), one from West Mediterranean (VC) and one from East Mediterranean (TK)) were included in some analyses (haplotype networks and phylogenetic trees). DNA was extracted using the E.Z.N.A. Mollusk DNA extraction kit (Omega Bio-tek; Norcross, GA, USA) according to the manufacturer’s instructions and stored at 4 °C until use.
Two mitochondrial loci were analyzed: the cytochrome c oxidase subunit I (cox1) and the hypervariable and non-coding mitochondrial control region (CR). Primers used for each locus were OvulCOX11F (5′-TGAATATTYTCAACAAATCAYAAAGAYATTGG-3′) and OvulCOX12R (5′ GGGTGACCAAARAATCAAAATARRTGTTG-3´) for cox1 and OvulCR3F (5′-GAAAATCTTTCGTGCAAATTACACCACA-3′) and OvulCR4R (5′ TGTTAATGGTCAGGGTCTAAATTCAACTAAAT-3′) for the CR [30]. PCR reactions were carried out following Quinteiro et al. [30], with slight modifications (larger final volume and a fixed MgCl2 concentration). They were performed in a final volume of 40 µL containing 2.5 mM of MgCl2, 200 μM of dNTP, 0.5 μM of each primer (forward and reverse), 10X Buffer (MgCl2 free), 0.5 units of Taq Polymerase (BioTools, Madrid, Spain) and 2.5 µL of a 1:50 DNA dilution. Amplification was carried out in a PE GeneAMP PCR 9700 thermal cycler (Applied Biosystems, Foster City, CA, USA) with an initial step of 3 min at 95 °C followed by 35 cycles (95 °C for 40 s, 60 °C 40 s, 72 °C 40 s) and a final elongation step of 72 °C for 7 min. Products of amplification were checked in a 1% agarose gel and sent to Macrogen Spain for purification and posterior sequencing using the Sanger method (both strands for each amplicon were sequenced). Sequences were analyzed and assembled using Sequencher 4.9 (Gene Codes Corp., Ann Arbor, MI, USA) and manually checked and edited. Cox1 sequences were checked for species identity in the BOLD database [36,37]. The alignment of the sequences was carried out using the ClustalW program embedded in MEGA X [38].
Basic genetic parameters such as the number of polymorphic sites, haplotype (h) and nucleotide (π) diversity estimates, for each loci separately and for the concatenated sequence, were calculated using DNASP 6.0. [39]. Diverse population parameters such as Tajima´s D and Fu´s F and other genetic differentiation parameters, ϕST for population comparisons (10,000 permutations) and AMOVA tests (10,000 permutations), were inferred for the concatenate region in ARLEQUIN 3.5 [40]. One haplotype network was built for the combined dataset using the median joining algorithm in the NETWORK 4 software [41]. The Mantel test was performed to detect isolation by distance with the IBD software v1.52 [42].
We investigated the phylogenetic relationships of these sequences using the sequence of the East Asian common octopus (Octopus sinensis d’Orbigny, 1841) as an outgroup (NC052881.1). Neighbor joining (NJ), maximum parsimony (MP), maximum likelihood (ML) or Bayesian approaches were used to construct phylogenetic trees. An NJ tree based on the Jukes–Cantor distance was constructed with MEGA X. The topology of the tree was further investigated by model-free maximum parsimony (MP) as implemented in MEGA X. The MP tree was obtained using the tree-bisection-reconnection algorithm with search level 3, in which the initial trees were obtained with the random addition of sequences (10 replicates). The optimal substitution model for all datasets was estimated using the MODELS tool in MEGA X, where the Hasegawa Kishino Yano (HKY) model [43] showed the highest probability of fitting with the data under analysis. The HKY substitution model was therefore used to obtain a maximum likelihood (ML) tree with the heuristic method of the nearest-neighbor interchange. The reliability of the nodes was assessed by 1000 bootstrap replicates under NJ, MP and ML [44].
To obtain a better representation of the α haplogroup in order to gain better knowledge about the phylogenetic relationships between the two different haplogroups detected, extra data for the CR locus from a previous work by Quinteiro et al. [30] were added. Sequences added to the ones detected in this study represented the most frequent haplotypes, from haplogroup α, in Quinteiro’s work [30]. A haplotype network, based on CR sequences and the full dataset, was built in NETWORK and a Bayesian tree was estimated in MrBayes 3.2 [45]. We executed two independent runs in parallel for each analysis, each consisting of four Metropolis-coupled MCMC chains (one cold, three heated). The tree was performed using 10 million generations, with sampling every 1000 generations, with the first 25% samples discarded as burn-in, and using the HKY model that showed the highest probability of fitting with the data under analysis (lset nst = 2; rates = gamma). Convergence was assessed by the estimated effective sample size (ESS; target value 200). All parameters had ESS values far above the target value (range 6525–7501). The accession numbers for additional haplotypes included in our analyses were MN705218.1, MN705213.1 from Morocco; MN 705258.1, MN705233.1MN 705239.1, MN 705275.1, MN 705266.1, MN705233.1 from Cape Verde; and MN705201.1 from Madeira.

3. Results

We amplified and sequenced fragments of cox1 and CR from 90 individuals (15 per population/fishing season). Three different alignments were created: one for the coding sequence cox1 of 646 bp length, one for the non-coding sequence CR of 653 bp length (646 bp, indels excluded) and the combined dataset that contained 1299 bp (1292 indels excluded). All samples were unambiguously identified as O. vulgaris sensu stricto after cox1 analysis. The sequences for the different haplotypes detected for CR and cox1 loci were submitted to GenBank and are available with the submission numbers OR351990-OR352006 and OR346370-OR346378, respectively.
Cox1 alignment of the 90 individuals resulted in eight different haplotypes defined by 12 variable sites (three of them singletons) and all of them corresponded to synonymous substitutions. The haplotype diversity (h) was 0.659 and the nucleotide diversity (π) was 0.00298. CR displayed a total of 17 different haplotypes defined by 37 polymorphic sites. This region was a non-coding site so higher values of diversity than the coding cox1 sequence were expected. The global haplotype diversity was h = 0.793 and the nucleotide diversity detected was π = 0.00866. For the concatenated dataset (cox1 + CR), we found 21 different haplotypes (49 variable sites). Haplotype diversity was h = 0.843 and nucleotide diversity π = 0.00605. All three datasets showed concordant results; the Canary Islands sample had the highest haplotype and nucleotide diversities, and the Algarve 2006–2007 sample showed the lowest values. For the CR and concatenated dataset, the samples from Galicia showed the same haplotype diversity as the Canary Islands samples but lower nucleotide diversity (Table 2).
The haplotype network built on the concatenated dataset showed two highly divergent haplogroups separated by at least 26 mutations (sequence divergence of 2.01%) (Figure 2a). Haplogroup β was the most common in our samples, representing 87.1% of the individuals studied, whereas haplogroup α showed a lower frequency (12.9%). This haplogroup structure was also observed in the CR sequences (Figure 3a) and, at a lower resolution, the cox1 sequences (Supplementary Materials, Figure S1). A summary of the sequence differences between haplotypes from the concatenated dataset is available in the Supplementary Materials, Table S1.
A reticulate pattern with several dominant haplotypes showing a star-contraction-like shape was identified for haplogroup β along the Northeastern Atlantic. The two main haplotypes within this group were H1 and H3, present at 25.80% and 27.95 of all individuals (Figure 2a). The parameters for population expansion or neutrality tests (Tajima D and Fu) showed negative values for all the populations when only individuals from this haplogroup were included. Although the majority were not significant, this could suggest a population expansion in this group or clade. The only significant value was the Fu’s Fs statistic for Algarve 2006–2007 (Fu’s Fs = −2.50279; p = 0.017). Calculations for the α haplogroup were not performed since this haplogroup was present at a very low proportion or not present at all for the locations examined, except the Canary Islands. Haplogroup α was present in one individual from Asturias 2006–2007, three from Algarve 2020–2021 and eight from the Canary Islands (Macaronesia). Within this group, two small subclades seemed to be present, separated by at least nine mutations (sequence divergence of 0.69%); the first subclade included all the individuals from Macaronesia and one sample from Algarve 2020–2021, and the second subclade included one individual from Asturias 2006–2007, two individuals from Algarve 2020–2021 and the individual from Turkey, Mediterranean (Figure 2a). Remarkably, and for the very first time, an individual from the Northern Iberian Peninsula was clustered in the southern haplogroup α, something not documented before (Figure 2a).
The phylogenetic relationships between the different haplotypes were investigated using the maximum likelihood, maximum parsimony or neighbor joining approaches (Figure 2b). The different methods of tree construction all led to identical topologies, supporting the robust separation of the two main clades. Within group β, there was not any clear clustering or grouping of individuals, with all bootstrap values lower than 70. In contrast, within haplogroup α, the two observed subclades already detected in the haplotype network (one mainly with an individual from Macaronesia and the other including individuals of the Northeastern Atlantic and Mediterranean) were supported by high bootstrap values.
In order to obtain a better understanding of the α haplogroup, a new analysis including more samples belonging to this haplogroup was performed. The new analysis using data obtained by Quinteiro et al. [30] was focused on the control region, because the cox1 resolution was very low within haplogroup α. Published sequences [30] were from lower latitudinal locations, including Macaronesia (Canarias, Madeira), Morocco and Cape Verde, where this α haplogroup is more frequent.
The new haplotype network (Figure 3a) showed once more the two haplogroups (α and β), separated with at least 20 mutations (sequence divergence of 3.08%). Samples from Cape Verde belonged exclusively to haplogroup α; meanwhile, both haplogroups were present in Macaronesia and the Iberian Peninsula (and Morocco, although no samples from haplogroup β with this origin were included in this analysis). The inclusion of the Cape Verde samples made the differences between haplotypes within haplogroup α more gradual. The number of differences between some Cape Verde haplotypes was similar to the number of differences between individuals of the two subclades previously detected, although they fell somewhere in between both subclades. However, no haplotype was shared between Cape Verde and any of the other locations sampled, either in this study or the one by Quinteiro et al. [30].
Once again, the phylogenetic relationships between the different haplotypes (Figure 3b) supported the separation of the α and β clades and the differences within the α haplogroup. Samples from northern latitudes grouped together with high support and close to Cape Verde samples; in the other group, we had the samples from Macaronesia. Interestingly, samples from Algarve and Morocco could be found in both groups.
Regarding the patterns of genetic differentiation between samples, the ϕST values calculated for the concatenated sequence showed that the only population exhibiting significant differences, after Bonferroni correction, was the sample from the Canary Islands 2018–2020 (Table 3). The same result was found when cox1 and CR sequences were analyzed independently (Supplementary Materials, Tables S2 and S3). The most significant values in all cases were those from the comparison between Canary Islands 2018–2020 and Asturias 2020–2021, Galicia 2020–2021 and Algarve 2006–2007 (Table 3). Although not significant after Bonferroni correction, the differences seen between Algarve 2006–2007 and Algarve 2020–2021 could reflect certain temporal variations within the Algarve locality. Up to three individuals from Algarve 2020–2021 showed an α haplotype; meanwhile, none were detected in the sample from Algarve 2006–2007.
To study the presence of a potential genetic structure within the sampled populations, an AMOVA test was performed using the combined region of both loci (cox1 + CR). Overall, results revealed global significant genetic differentiation among all the populations studied (Global ϕST = 0.21997; p = 0.0001). Moreover, the Mantel test revealed a significant positive correlation between the genetic and geographic distance (r = 0.7830, p value ≤ 0.0190 by 1000 randomizations). However, there was not a defined population structuring pattern. For instance, clustering groups by aggrupation suggested by pairwise ϕST values (Canary Islands population vs. the rest) revealed non-significant differences among groups (ϕCT: 0.43188; p = 0.16277), but significant differences were found among populations within groups (ϕSC =0.02231; p = 0.02236). Most of the genetic differentiation was explained between individuals, giving significant differences (ϕST: 0.44455; p = 0.000). When the same analysis was repeated but removing the Algarve 2006–2007 sample (since it had previously shown significant pairwise differentiation with some other samples, although the significance disappeared after Bonferroni correction), no within-groups differences were detected (ϕSC =0.00864; p= 0.13703) and, once again, the ϕCT values were not significantly different from zero among the groups.

4. Discussion

Studying the status of populations is especially relevant in marine species that represent an important social and economic income source and are under intense exploitation by fisheries [6]. In this study, we attempted to assess the genetic patterns (past and present) of populations of O. vulgaris within the Northeastern Atlantic using mitochondrial DNA data, including populations that have been scarcely investigated before. The main goal was to gain a better understanding of the origin and distribution of the genetic variability of the species, which can be used to improve the management of the species in this area.

4.1. Demography, Phylogenetic and Phylogeography of O. vulgaris Sensu Stricto

Mitochondrial markers are reference markers used to infer the evolutionary history of organisms and give insights into their distribution in the past [19]. Previous works on O. vulgaris phylogeography [30,31] have reported two distinct mitochondrial clades along the Northeastern Atlantic with different geographical distributions. Although the two studies did not sample the same localities, they found the presence of two different haplogroups, one in northern areas (Northwestern Iberian coast to Macaronesia) and the other in more southern areas, such as Cape Verde and Senegal. In some cases, an overlap between the two haplogroups was detected in areas such as Macaronesia [30]. Other authors, however, have reported just one haplogroup for all the Eastern Atlantic octopus [29]. Although they detected differences within the haplogroup, they did not recognize it as a different clade. This is probably related to different reasons. For example, their sampling area was wider, including the Western Atlantic and Indian Ocean, and perhaps the variability within each region (i.e., the Northeastern Atlantic) was underestimated due to greater divergence among regions. Most importantly, the use of cox1 as the only marker [29], which is reported to have a low resolution for the detection of distinct clades, may have been responsible for their subestimation of the groups [30].
In our study, the mitochondrial concatenated region of cox1 and CR revealed the presence of two distinct clades, as already has been proposed [30,31]. Nevertheless, some interesting differences in the distribution of the two haplogroups were detected in this work. Haplogroup β was again the most frequent along the Northern Iberian coast (87.1% of all individuals analyzed in the present study), with its frequency decreasing in southern latitudes until it completely disappeared in Southern Macaronesia. However, one individual from Asturias (the northern population sampled) was surprisingly clustered within haplogroup α (Figure 1). All the remaining samples within haplogroup α in this study were from southern areas such as Algarve and the Canary Islands, which serve as potential contact areas between both haplogroups. The analysis of the individual from Asturias was repeated twice (starting from DNA extraction) to eliminate genotyping errors, and the same sequence was recovered. In light of this new information, we revisited some previous works and we found that Roura et al. [46], using cox1 in O. vulgaris paralarvae, found one haplotype from Galicia, in the Western Iberian Peninsula, compatible with belonging to the α haplogroup. However, the authors did not highlight this fact, probably for different reasons, the first and most important being the low resolution of cox1 in differentiating both haplogroups and the second being the low number of samples that could potentially belong to the α haplogroup; the third was that mainly samples from Galicia and, to a lesser extent, from Morocco were analyzed, and, lastly, the authors were focused on other types of questions. Therefore, this is the first time that the presence of this haplogroup α has been confirmed in northern latitudes using cox1 and CR markers, leading to more questions about the evolutionary theory of the origin of both groups. According to Quinteiro et al. [30], haplogroup α originated in an ancestral refugia on the northwestern coast of Africa, when glaciated periods forced organisms to move towards southern latitudes. Haplogroup β, on the other hand, probably originated from the evolution of variants separated in glaciation periods, showing recent population expansion under favorable conditions.
In this work, the higher genetic variation (especially nucleotide diversity) found in populations within clade α matched with the hypothesis of glaciation refugia suggested by Quinteiro et al. [30]. However, the finding of clade α in samples from the Iberian Peninsula and the Mediterranean, clearly differentiated from those found in areas further south or east, such as Cape Verde, the Azores and Madeira, questioned the hypothesis of a unique glacial refugia in southern latitudes. In fact, previous data indicated the presence of another refugia in the Mediterranean and periods of isolation and subsequent re-connection with the Atlantic [47]. The presence of the same α haplotype in individuals from Asturias, the Azores and the Mediterranean (see H_7 in Figure 3a) supports the idea of these events of secondary contact between the Atlantic and Mediterranean. Whether the presence of these α haplotype individuals in the north of Spain is anecdotal, due to specific weather conditions that allow individuals from southern areas to reach northern latitudes every now and then, or whether there is a small proportion of α haplogroup individuals permanently established in the area, cannot be clarified at this point with just one individual. It would be necessary, therefore, to perform a greater sampling project in this area to elucidate this issue.
For haplogroup β, our data matched with previous studies [30]. Although not significant in our study, populations of this haplogroup all showed negative Tajima D and Fu values, supporting the idea of recent population expansion. Population expansion of one of the lineages is also a common pattern for other northeastern Atlantic marine taxa [48]. The haplotype diversity values for populations within this clade were high, whereas the nucleotide diversity was very low (Table 2), indicating a lack of genetic variation, typical for recolonization areas [49]. On the origin of this clade, it may be that potential small, ancient groups of individuals that found refugia in the north stayed isolated and evolved into new variants, leading to the distinction of both haplogroups. Then, favorable conditions may have allowed the recolonization (along the Western Iberian coast) of this β haplogroup.

4.2. Current Genetic Structuring Patterns in the O. vulgaris Northeastern Atlantic Populations

Previous works showed a robust genetic structure within the Northeastern Atlantic associated with the distinct distribution of the two different haplogroups detected [30,31]. Haplogroup α was present in southern locations (i.e., Cape Verde); meanwhile, haplogroup β was present in northeastern sites. In our study, however, such an abrupt cut was not detected. The AMOVA test did not detect any significant structure separating northern and southern latitudes. Instead, our data showed a decline or decrease in the southern clade (α) when moving to northern latitudes and the opposite for haplogroup β (which decreased in frequency from north to south) (Figure 1). These contrasting findings were probably due to sampling differences between works, since previous works based on mtDNA focused on southern populations and just one population from the Northern Iberian coast (Galicia) was sampled. However, our study showed a more continuous sampling range within northern latitudes, which have been poorly studied before. Our results could indicate that the cline or distribution of the haplogroups may have been more continuous than reported in previous studies for the Northeastern Atlantic. Further studies, including more populations in the area, should be carried out to confirm these observations.
Although the absence of fine spatial genetic structuring was observed, we found the Canary Islands population to be significantly different from most of the other populations, with ϕST values statistically different from zero. Former studies including the use of microsatellites [14,30,35] have found a genetically distinct group in the Macaronesia region (comprising the Canary Islands, Madeira and the Azores). This finding was also reported in studies with other cephalopods in this region, such as the common cuttlefish (Sepia officinalis Linnaeus, 1758) [50]. We found the Canary Islands to have the highest haplotype and nucleotide diversities, associated with the balanced presence of both clades (Table 2). The observed differentiation with respect to other populations of the Peninsula was probably associated with the distance (supported by a significative Mantel test), as reported in previous studies [29], but also to the specific oceanographic conditions, currents and ocean isolation of this geographical area. In fact, the differentiation of O. vulgaris in other geographic sites was found to be more related to oceanographic patterns and not necessarily to geographic distance [27,28,47]. The larvae of O. vulgaris spend an average 47–54 days in the water current until becoming adults, and even less time in tropical waters, as larvae feed faster and hatch earlier [29]. During this time, they may have limited dispersal, susceptible to oceanographic conditions [51]. The Canaries’ current upwelling region is characterized by the effect of small currents or eddies, which makes it a complex circulatory system that may restrict gene flow or dispersal [52,53]. In addition, the region of Macaronesia is recognized by the European Marine Strategy Framework Directive (MSFD) of the European Commission as a distinct marine subregion (Figure 1), meaning that it harbors specific oceanographic and biogeographical conditions and should then be managed independently. Our findings of genetic differentiation within this area reinforce the distinction of this subregion and support that it should be managed independently.
Finally, we did not find significant differentiation between continental harvested populations (p > 0.05) within the Iberian Peninsula. This could be related to the reported higher larvae dispersal in temperate waters, where they spend more time in the water current, which may homogenize populations [29]. However, using microsatellites, Cabranes et al. [35] reported genetic differentiation but only for populations in the Iberian Peninsula located more than 200 km apart. Moreover, Pirhadi et al. [14] did find genetic differentiation between the northern populations (Asturias, Galicia) and the Southern Atlantic area (Algarve). These results show once more how microsatellites are more informative for recent events and may be able to detect more precisely the impact of fishery pressure or other environmental forces on populations than when working with mtDNA [19].

4.3. Assessing Temporal Genetic Variation in Exploited Asturian and Algarve O. vulgaris Stocks

Temporal analyses of species under exploitation are another useful tool to evaluate the status of fishing stocks. Most cephalopod harvesters in the Northeastern Atlantic do not regularly assess the status of the populations. This is surprising as octopod species can present highly variable mortality rates and a short life cycle of 1–2 years [9], conditioning the annual abundance of the species that directly depends on the recruitment or successful paralarvae that reach adulthood and enter the population the year before [54,55]. Furthermore, octopus paralarvae are reported to be highly influenced by environmental fluctuations and oceanographic conditions (i.e., changes in sea surface temperature, rainfall and upwelling processes), which may affect the annual variation of the species [55,56]. All these factors necessitate a continuous assessment of the status of octopus populations, especially for artisanal fisheries.
In small-scale fisheries from the Northern Iberian Peninsula, studies on the genetic status of octopus populations are scarce and mainly focused on spatial structure, but Pirhadi et al. [14] recently studied the temporal variation of Asturian populations using microsatellites. The data revealed no significant temporal genetic changes in samples from Olhão (Portugal) within the period of 14 years (approximately nine generations considering O. vulgaris life span). No significant temporal differences were found between 2018 and 2021 (two generations) for the rest of the locations, except for the samples from Puerto de Vega (Asturias) collected between 2007 and 2018, with respect to the last sampling collected during 2020–2021 in the same locality [14]. In our study, we did not find significant differences between the two fishing seasons. The haplotype diversity remained the same from 2006–2007 to 2020–2021 (h = 0.819). However, in Asturias 2006–2007, an individual from the ancestral lineage α was found, whereas, in 2020–2021, no haplotype representing this group was present. A larger sampling size may be needed to give insights into whether the ancestral haplotype may have suffered a loss or reduction in Northern Iberia due to intense fishing efforts.
In the Southern Iberian Peninsula, the region of Algarve is reported to be the main Portuguese recruitment region of O. vulgaris, where the greatest abundance and representatives of this species are concentrated [57]. Although we did not detect statistically significant differences between seasons for this location, neither in this study using mitochondrial DNA nor in previous studies using microsatellites [14], we detected changes in the distribution of the haplogroups depending on the season. For example, we did not detect any individual from haplogroup α in the 2006–2007 fishing year, in contrast to 2020–2021, where both lineages (α and β) were found. The presence of haplotypes from the α haplogroup in the Algarve 2020–2021 season could be associated with oceanographic conditions (currents, sea surface temperature), which can vary over time and can influence the movement of individuals from certain areas (southern latitudes, Mediterranean) to this area [58]. For instance, the sea surface temperature has shown an increasing trend over the last few years in the region of Algarve [59,60] and it is well known that the paralarvae of O. vulgaris are characterized by a preference for warmer temperatures [61]. Regarding the currents, the southern region of Portugal represents a well-known upwelling area. The Portugal current shows a northward direction or southward direction depending on the season and, therefore, could be an important factor in promoting gene flow between Portugal and other, southernmost areas such as the Canarian and North African coasts [62]. The hydrodynamic setting of this area is dominated by the water exchange between the Atlantic Ocean and the Mediterranean Sea (with saltier, warmer and denser water) through the Strait of Gibraltar. The simulated eastward volume flow (Atlantic Ocean to Mediterranean Sea) is generally larger than the westward flow but switches sign during the spring and shows significant interannual variability [63]. The same simulation work showed that a small part of this westward flow can move along the Western Iberian coast and reach the Bay of Biscay [63]. The circulatory pattern of the Gulf of Cádiz’s water masses has traditionally been explained based on the action of prevailing winds in the area: western winds during the winter and eastern component winds for summer (May to September) [55]. It is known that octopus egg laying, in the Gulf of Cadiz, takes place between the spring and summer months and recruitment between October and November [64].

5. Conclusions

This study allowed us to estimate the genetic variation and differentiation patterns of populations from the Northeastern Atlantic using mtDNA and it gives insights into the distribution and legacy of the two reported lineages of O. vulgaris (α and β) in the past. The use of two mitochondrial markers together proved to be useful to detect the different lineages and to infer the presence of the reported ancestral clade α in northern latitudes, identifying for the first time the presence of this clade in the Iberian Peninsula and supporting the idea of a second glacial refugia in the Mediterranean Sea for this valuable species. However, further studies are needed, increasing the sampling size and number of locations, to further elucidate the evolutionary history of the species.
Regarding the present status of the populations, we did not detect fine spatial genetic structuring using mtDNA but we found differences, probably associated with the distinct distributions of the two clades. The Canary Islands population (showing the greatest frequency of the southern clade among the rest of the sites) was significantly distinct, matching with the hypothesis of isolation by distance and supporting the key role that the oceanographic conditions may have in the restriction of gene flow and the singularity of the Macaronesia area. Nevertheless, the observed lack of differentiation when including all the sampled locations differed from the significant genetic structuring found when studying the same populations but using nuclear markers (microsatellites), suggesting that mitochondrial DNA may not be sensitive enough to update a continuous fishery strategy since it may fail to detect spatially different managing stocks if they are not very distant. Instead, it may be useful to detect temporal changes in the distribution of the two clades in areas of contact—for instance, the Atlantic and Mediterranean (reflected in the frequency of each clade in specific populations)—and associate them with the effect of changing oceanographic conditions or other specific events related to global climate change.

Supplementary Materials

The following supporting information can be downloaded at: https://www.mdpi.com/article/10.3390/ani13172708/s1, Figure S1: Cox1 haplotype network; Table S1: Summary of sequences differences between haplotypes for the concatenated dataset; Table S2: Population pairwise ϕST values from cox1 in octopus’ samples; Table S3: Population pairwise ϕST values from CR in octopus’ samples.

Author Contributions

T.P.: conceptualization, methodology, formal analysis, investigation, writing—original draft and writing—review and editing; A.R.-B.: methodology, formal analysis, investigation and writing—review and editing; N.P.: methodology and writing—review and editing; R.C.: methodology and writing—review and editing; M.d.P.F.-R.: conceptualization and writing—review and editing; I.M.: conceptualization and writing—review and editing; L.G.-F.: conceptualization and writing—review and editing; Y.J.B.: conceptualization, methodology, formal analysis, supervision, funding acquisition and writing—review and editing. All authors have read and agreed to the published version of the manuscript.

Funding

This research was funded by the projects ECOSIFOOD (MCI-20-PID2019-108481RB-I00/AEI/10.13039/501100011033) and GRUPIN-AYUD/2021/50967. Andrea Romero-Bascones was funded by the FPU program of the Spanish Ministry of Science, Innovation and Universities (MU-21-FPU20/06628). This work was partially developed in a Master’s thesis presented by Romero-Bascones A. This is a contribution of the Marine Observatory of Asturias (OMA) and the Biotechnology Institute of Asturias (IUBA).

Institutional Review Board Statement

Not applicable. The samples obtained for analysis came from fisheries and were collected from dead animals brought to the port by fishermen, which were then placed for sale at the fish market. The work on which the article was based was financed by the Spanish “Ministerio de Ciencia e Innovación” and did not require the approval of the ethics committee because of the type of work to be carried out.

Informed Consent Statement

Not applicable.

Data Availability Statement

All sequences generated during this study have been deposited in GenBank (https://www.ncbi.nlm.nih.gov/genbank/).

Acknowledgments

The authors would like to thank all the Asturian anonymous fishers who helped during the fieldwork. They would like also to thank Aitor Ibabe Arrieta from UniOvi (Asturias, Spain) and Unai Cotano Basabe from AZTI (Basque Country, Spain); Adriana García Rellán and Rosana Solla Pazos from Cofradía de Pescadores “San Martiño” de Bueu (Galicia, Spain); Eduardo Almansa Berro and Beatriz C. Felipe Paramio from IEO-CSIC, C. O. Canarias (Tenerife, Spain); Karim Erzini and Monika J. Szynaka from CCMAR-UAlg (Faro, Portugal) and Alberto Martín (MSC-Spain) and Oscar Escolar Sánchez from ICM-CSIC (Barcelona, Spain) for their significant and generous help with sample acquisition.

Conflicts of Interest

The authors declare no conflict of interest.

References

  1. World Bank The Hidden Harvest. The Global Contribution of Capture Fisheries; World Bank: Washington, DC, USA, 2012. [Google Scholar]
  2. Villasante, S.; Sumaila, R.; García-Negro, M.; Rodriguez, G. Beijer Discussion Paper Series No. 223; The Beijer Institute of Ecological Economics: Stockholm, Sweden, 2010. [Google Scholar]
  3. García-de-la-Fuente, L. The Artisanal Fishing Fleet in Asturias: Characterization and Quantitative Analysis of Its Economic and Social Importance; University of Oviedo: Oviedo, Spain, 2020. [Google Scholar]
  4. FAO. Social Protection for Small-Scale Fisheries in the Mediterranean Region: A Review; FAO: Rome, Italy, 2019; ISBN 978-92-5-131479-1. [Google Scholar]
  5. Harley, C.D.G.; Randall Hughes, A.; Hultgren, K.M.; Miner, B.G.; Sorte, C.J.B.; Thornber, C.S.; Rodriguez, L.F.; Tomanek, L.; Williams, S.L. The Impacts of Climate Change in Coastal Marine Systems. Ecol. Lett. 2006, 9, 228–241. [Google Scholar] [CrossRef] [PubMed]
  6. Costello, C.; Ovando, D.; Hilborn, R.; Gaines, S.D.; Deschenes, O.; Lester, S.E. Status and Solutions for the World’s Unassessed Fisheries. Science 2012, 338, 517–520. [Google Scholar] [CrossRef] [PubMed]
  7. Worm, B.; Hilborn, R.; Baum, J.K.; Branch, T.A.; Collie, J.S.; Costello, C.; Fogarty, M.J.; Fulton, E.A.; Hutchings, J.A.; Jennings, S.; et al. Rebuilding Global Fisheries. Science 2009, 325, 578–585. [Google Scholar] [CrossRef] [PubMed]
  8. Roa-Ureta, R.H.; del Fernández-Rueda, M.P.; Acuña, J.L.; Rivera, A.; González-Gil, R.; García-Flórez, L. Estimation of the Spawning Stock and Recruitment Relationship of Octopus vulgaris in Asturias (Bay of Biscay) with Generalized Depletion Models: Implications for the Applicability of MSY. ICES J. Mar. Sci. 2021, 78, 2256–2270. [Google Scholar] [CrossRef]
  9. Arkhipkin, A.I.; Hendrickson, L.C.; Payá, I.; Pierce, G.J.; Roa-Ureta, R.H.; Robin, J.-P.; Winter, A. Stock Assessment and Management of Cephalopods: Advances and Challenges for Short-Lived Fishery Resources. ICES J. Mar. Sci. 2021, 78, 714–730. [Google Scholar] [CrossRef]
  10. Sánchez, P.; Villanueva, R.; Jereb, P.; Guerra, A.; González, A.F.; Sobrino, I.; Balguerias, E.; Pereira, J.; Moreno, A.; Allcock, A.L.; et al. Octopus Vulgaris Cuvier, 1797. In Cephalopod Biology and Fisheries in Europe: II: Species Accounts; ICES Cooperative Researh, Report; Jereb, P., Allcock, A.L., Lefkaditou, E., Piatkowski, U., Hastie, L.C., Pierce, G.J., Eds.; International Council for the Exploration of the Sea: Copenhagen, Denmark, 2015; pp. 14–28. ISBN 978-87-7482-155-7. [Google Scholar]
  11. Pita, C.; Roumbedakis, K.; Fonseca, T.; Matos, F.L.; Pereira, J.; Villasante, S.; Pita, P.; Bellido, J.M.; Gonzalez, A.F.; García-Tasende, M.; et al. Fisheries for Common Octopus in Europe: Socioeconomic Importance and Management. Fish. Res. 2021, 235, 105820. [Google Scholar] [CrossRef]
  12. Fernández Sánchez, J.L.; Fernández Polanco, J.M.; Llorente García, I. Evidence of Price Premium for MSC-Certified Products at Fishers’ Level: The Case of the Artisanal Fleet of Common Octopus from Asturias (Spain). Mar. Policy 2020, 119, 104098. [Google Scholar] [CrossRef]
  13. González, A.F.; Macho, G.; De Novoa, J.; García, M. Western Asturias Octopus Traps Fishery of Artisanal Cofradias; CAB: BUREAU VERITAS IBERIA: Madrid, Spain, 2016. [Google Scholar]
  14. Pirhadi, N.; Parrondo, M.; Romero-Bascones, A.; Thoppil, R.; Martínez, J.L.; Fernández-Rueda, M.P.; Márquez, I.; García-Flórez, L.; Dopico, E.; Pérez, T.; et al. Genetic Monitoring on the World’s First MSC Eco-Labeled Common Octopus (O. Vulgaris) Fishery in Western Asturias, Spain. Sci. Rep. 2023, 13, 2730. [Google Scholar] [CrossRef]
  15. Rios, J.; Macho, G. Western Asturias Octopus Traps Fishery of Artisanal Cofradías; CAB: BUREAU VERITAS IBERIA: Madrid, Spain, 2023; p. 37. [Google Scholar]
  16. Bhaskar, R.; Sharon, E.A. Molecular Genetic Approaches in Wildlife Conservation. In Genetic Diversity—Recent Advances and Applications; IntechOpen: London, UK, 2022; ISBN 978-1-80356-945-1. [Google Scholar]
  17. Wright, J.M.; Bentzen, P. Microsatellites: Genetic Markers for the Future. Rev. Fish Biol. Fish. 1994, 4, 384–388. [Google Scholar] [CrossRef]
  18. Patarnello, T.; Volckaert, F.M.J.; Castilho, R. Pillars of Hercules: Is the Atlantic–Mediterranean Transition a Phylogeographical Break? Mol. Ecol. 2007, 16, 4426–4444. [Google Scholar] [CrossRef]
  19. Cuéllar-Pinzón, J.; Presa, P.; Hawkins, S.J.; Pita, A. Genetic Markers in Marine Fisheries: Types, Tasks and Trends. Fish. Res. 2016, 173, 194–205. [Google Scholar] [CrossRef]
  20. Amor, M.D.; Norman, M.D.; Cameron, H.E.; Strugnell, J.M. Allopatric Speciation within a Cryptic Species Complex of Australasian Octopuses. PLoS ONE 2014, 9, e98982. [Google Scholar] [CrossRef]
  21. Leite, T.S.; Haimovici, M.; Molina, W.; Warnke, K. Morphological and Genetic Description of Octopus Insularis, a New Cryptic Species in the Octopus Vulgaris Complex (Cephalopoda: Octopodidae) from the Tropical Southwestern Atlantic. J. Molluscan Stud. 2008, 74, 63–74. [Google Scholar] [CrossRef]
  22. Söller, R.; Warnke, K.; Saint-Paul, U.; Blohm, D. Sequence Divergence of Mitochondrial DNA Indicates Cryptic Biodiversity in Octopus vulgaris and Supports the Taxonomic Distinctiveness of Octopus mimus (Cephalopoda: Octopodidae). Mar. Biol. 2000, 136, 29–35. [Google Scholar] [CrossRef]
  23. Warnke, K.; Söller, R.; Blohm, D.; Saint-Paul, U. A New Look at Geographic and Phylogenetic Relationships within the Species Group Surrounding Octopus vulgaris (Mollusca, Cephalopoda): Indications of Very Wide Distribution from Mitochondrial DNA Sequences. J. Zool. Syst. Evol. Res. 2004, 42, 306–312. [Google Scholar] [CrossRef]
  24. Sales, J.B.D.L.; Rego, P.S.D.; Hilsdorf, A.W.S.; Moreira, A.A.; Haimovici, M.; Tomás, A.R.; Batista, B.B.; Marinho, R.A.; Markaida, U.; Schneider, H.; et al. Phylogeographical Features of Octopus Vulgaris and Octopus Insularis in the Southeastern Atlantic Based on the Analysis of Mitochondrial Markers. J. Shellfish. Res. 2013, 32, 325–339. [Google Scholar] [CrossRef]
  25. Avendaño, O.; Roura, Á.; Cedillo-Robles, C.E.; González, Á.F.; Rodríguez-Canul, R.; Velázquez-Abunader, I.; Guerra, Á. Octopus Americanus: A Cryptic Species of the O. Vulgaris Species Complex Redescribed from the Caribbean. Aquat. Ecol. 2020, 54, 909–925. [Google Scholar] [CrossRef]
  26. Norman, M.D.; Finn, J.K. World octopod fisheries. In Cephalopods of the World. An Annotated and Illustrated Catalogue of Cephalopod Species Known to Date. Octopods and Vampire Squids; FAO Species Catalogue for Fishery Purposes; Jereb, P., Roper, C.F.E., Norman, M.D., Finn, J.K., Eds.; FAO: Rome, Italy, 2016; Volume 3, pp. 9–14. ISSN 1020-8682. [Google Scholar]
  27. Fadhlaoui-Zid, K.; Knittweis, L.; Aurelle, D.; Nafkha, C.; Ezzeddine, S.; Fiorentino, F.; Ghmati, H.; Ceriola, L.; Jarboui, O.; Maltagliati, F. Genetic Structure of Octopus vulgaris (Cephalopoda, Octopodidae) in the Central Mediterranean Sea Inferred from the Mitochondrial COIII Gene. Comptes Rendus Biol. 2012, 335, 625–636. [Google Scholar] [CrossRef] [PubMed]
  28. De Luca, D.; Catanese, G.; Procaccini, G.; Fiorito, G. Octopus vulgaris (Cuvier, 1797) in the Mediterranean Sea: Genetic Diversity and Population Structure. PLoS ONE 2016, 11, e0149496. [Google Scholar] [CrossRef]
  29. Van Nieuwenhove, A.H.M.; Ratsimbazafy, H.A.; Kochzius, M. Cryptic Diversity and Limited Connectivity in Octopuses: Recommendations for Fisheries Management. PLoS ONE 2019, 14, e0214748. [Google Scholar] [CrossRef]
  30. Quinteiro, J.; Rodríguez-Castro, J.; Rey-Méndez, M.; González-Henríquez, N. Phylogeography of the Insular Populations of Common Octopus, Octopus vulgaris Cuvier, 1797, in the Atlantic Macaronesia. PLoS ONE 2020, 15, e0230294. [Google Scholar] [CrossRef] [PubMed]
  31. Teske, P.R.; Oosthuizen, A.; Papadopoulos, I.; Barker, N.P. Phylogeographic Structure of Octopus vulgaris in South Africa Revisited: Identification of a Second Lineage near Durban Harbour. Mar. Biol. 2007, 151, 2119–2122. [Google Scholar] [CrossRef]
  32. Gleadall, I.G. Octopus sinensis d’Orbigny, 1841 (Cephalopoda: Octopodidae): Valid Species Name for the Commercially Valuable East Asian Common Octopus. Species Divers. 2016, 21, 31–42. [Google Scholar] [CrossRef]
  33. Murphy, J.; Balguerias, E.; Key, L.N.; Boyle, P.R. Microsatellite DNA Markers Discriminate between Two Octopus Vulgaris (Cephalopoda: Octopoda) Fisheries along the Northwest African Coast. Bull. Mar. Sci. 2002, 71, 545–553. [Google Scholar]
  34. Oosthuizen, A.; Jiwaji, M.; Shaw, P. Genetic Analysis of the Octopus vulgaris Population on the Coast of South Africa. S. Afr. J. Sci. 2004, 100, 603–607. [Google Scholar]
  35. Cabranes, C.; Fernandez-Rueda, P.; Martínez, J.L. Genetic Structure of Octopus Vulgaris around the Iberian Peninsula and Canary Islands as Indicated by Microsatellite DNA Variation. ICES J. Mar. Sci. 2008, 65, 12–16. [Google Scholar] [CrossRef]
  36. Ratnasingham, S.; Hebert, P.D.N. Bold: The Barcode of Life Data System (http://www.barcodinglife.org). Mol. Ecol. Notes 2007, 7, 355–364. [Google Scholar] [CrossRef]
  37. Ratnasingham, S.; Hebert, P.D.N. A DNA-Based Registry for All Animal Species: The Barcode Index Number (BIN) System. PLoS ONE 2013, 8, e66213. [Google Scholar] [CrossRef]
  38. Kumar, S.; Stecher, G.; Li, M.; Knyaz, C.; Tamura, K. MEGA X: Molecular Evolutionary Genetics Analysis across Computing Platforms. Mol. Biol. Evol. 2018, 35, 1547–1549. [Google Scholar] [CrossRef]
  39. Rozas, J.; Ferrer-Mata, A.; Sánchez-DelBarrio, J.C.; Guirao-Rico, S.; Librado, P.; Ramos-Onsins, S.E.; Sánchez-Gracia, A. DnaSP 6: DNA Sequence Polymorphism Analysis of Large Data Sets. Mol. Biol. Evol. 2017, 34, 3299–3302. [Google Scholar] [CrossRef]
  40. Excoffier, L.; Lischer, H.E.L. Arlequin Suite Ver 3.5: A New Series of Programs to Perform Population Genetics Analyses under Linux and Windows. Mol. Ecol. Resour. 2010, 10, 564–567. [Google Scholar] [CrossRef] [PubMed]
  41. Bandelt, H.J.; Forster, P.; Röhl, A. Median-Joining Networks for Inferring Intraspecific Phylogenies. Mol. Biol. Evol. 1999, 16, 37–48. [Google Scholar] [CrossRef] [PubMed]
  42. Bohonak, A.J. IBD (Isolation by Distance): A Program for Analyses of Isolation by Distance. J. Hered. 2002, 93, 153–154. [Google Scholar] [CrossRef]
  43. Hasegawa, M.; Yano, T.; Kishino, H. A New Molecular Clock of Mitochondrial DNA and the Evolution of Hominoids. Proc. Jpn. Acad. Ser. B 1984, 60, 95–98. [Google Scholar] [CrossRef]
  44. Felsenstein, J. Phylogenies and the Comparative Method. Am. Nat. 1985, 125, 1–15. [Google Scholar] [CrossRef]
  45. Huelsenbeck, J.P.; Ronquist, F. MRBAYES: Bayesian Inference of Phylogenetic Trees. Bioinformatics 2001, 17, 754–755. [Google Scholar] [CrossRef] [PubMed]
  46. Roura, Á.; Amor, M.; González, Á.F.; Guerra, Á.; Barton, E.D.; Strugnell, J.M. Oceanographic Processes Shape Genetic Signatures of Planktonic Cephalopod Paralarvae in Two Upwelling Regions. Prog. Oceanogr. 2019, 170, 11–27. [Google Scholar] [CrossRef]
  47. Melis, R.; Vacca, L.; Cuccu, D.; Mereu, M.; Cau, A.; Follesa, M.C.; Cannas, R. Genetic Population Structure and Phylogeny of the Common Octopus Octopus vulgaris Cuvier, 1797 in the Western Mediterranean Sea through Nuclear and Mitochondrial Markers. Hydrobiologia 2018, 807, 277–296. [Google Scholar] [CrossRef]
  48. Jenkins, T.L.; Castilho, R.; Stevens, J.R. Meta-Analysis of Northeast Atlantic Marine Taxa Shows Contrasting Phylogeographic Patterns Following Post-LGM Expansions. PeerJ 2018, 6, e5684. [Google Scholar] [CrossRef]
  49. Maggs, C.A.; Castilho, R.; Foltz, D.; Henzler, C.; Jolly, M.T.; Kelly, J.; Olsen, J.; Perez, K.E.; Stam, W.; Väinölä, R.; et al. Evaluating Signatures of Glacial Refugia for North Atlantic Benthic Marine Taxa. Ecology 2008, 89, S108–S122. [Google Scholar] [CrossRef]
  50. Pérez-Losada, M.; Guerra, Á.; Sanjuan, A. Allozyme Differentiation in the Cuttlefish Sepia Officinalis (Mollusca: Cephalopoda) from the NE Atlantic and Mediterranean. Heredity 1999, 83, 280–289. [Google Scholar] [CrossRef] [PubMed]
  51. Villanueva, R.; Vidal, E.A.G.; Fernández-Álvarez, F.Á.; Nabhitabhata, J. Early Mode of Life and Hatchling Size in Cephalopod Molluscs: Influence on the Species Distributional Ranges. PLoS ONE 2016, 11, e0165334. [Google Scholar] [CrossRef] [PubMed]
  52. Barton, E.D.; Arístegui, J.; Tett, P.; Navarro-Pérez, E. Variability in the Canary Islands Area of Filament-Eddy Exchanges. Prog. Oceanogr. 2004, 62, 71–94. [Google Scholar] [CrossRef]
  53. Quinteiro, J.; Rodríguez-Castro, J.; Rey-Méndez, M. Population Genetic Structure of the Stalked Barnacle Pollicipes Pollicipes (Gmelin, 1789) in the Northeastern Atlantic: Influence of Coastal Currents and Mesoscale Hydrographic Structures. Mar. Biol. 2007, 153, 47–60. [Google Scholar] [CrossRef]
  54. Puerta, P.; Quetglas, A.; Hidalgo, M. Seasonal Variability of Cephalopod Populations: A Spatio-Temporal Approach in the Western Mediterranean Sea. Fish. Oceanogr. 2016, 25, 373–389. [Google Scholar] [CrossRef]
  55. Sobrino, I.; Rueda, L.; Tugores, M.P.; Burgos, C.; Cojan, M.; Pierce, G.J. Abundance Prediction and Influence of Environmental Parameters in the Abundance of Octopus (Octopus vulgaris Cuvier, 1797) in the Gulf of Cadiz. Fish. Res. 2020, 221, 105382. [Google Scholar] [CrossRef]
  56. Otero, J.; Álvarez-Salgado, X.A.; González, Á.F.; Miranda, A.; Groom, S.B.; Cabanas, J.M.; Casas, G.; Wheatley, B.; Guerra, Á. Bottom-up Control of Common Octopus Octopus vulgaris in the Galician Upwelling System, Northeast Atlantic Ocean. Mar. Ecol. Prog. Ser. 2008, 362, 181–192. [Google Scholar] [CrossRef]
  57. Moreno, A.; Lourenço, S.; Pereira, J.; Gaspar, M.B.; Cabral, H.N.; Pierce, G.J.; Santos, A.M.P. Essential habitats for pre-recruit Octopus vulgaris along the Portuguese coast. Fisheries Res. 2014, 152, 74–85. [Google Scholar] [CrossRef]
  58. Calderón, I.; Pita, L.; Brusciotti, S.; Palacín, C.; Turon, X. Time and Space: Genetic Structure of the Cohorts of the Common Sea Urchin Paracentrotuslividus in Western Mediterranean. Mar. Biol. 2012, 159, 187–197. [Google Scholar] [CrossRef]
  59. Baptista, V.; Silva, P.L.; Relvas, P.; Teodósio, M.A.; Leitão, F. Sea Surface Temperature Variability along the Portuguese Coast since 1950. Int. J. Climatol. 2018, 38, 1145–1160. [Google Scholar] [CrossRef]
  60. Leitão, F.; Maharaj, R.R.; Vieira, V.M.N.C.S.; Teodósio, A.; Cheung, W.W.L. The Effect of Regional Sea Surface Temperature Rise on Fisheries along the Portuguese Iberian Atlantic Coast. Aquat. Conserv. Mar. Freshw. Ecosyst. 2018, 28, 1351–1359. [Google Scholar] [CrossRef]
  61. Perales-Raya, C.; Nande, M.; Roura, A.; Bartolomé, A.; Gestal, C.; Otero, J.J.; García-Fernández, P.; Almansa, E. Comparative Study of Age Estimation in Wild and Cultured Octopus vulgaris Paralarvae: Effect of Temperature and Diet. Mar. Ecol. Prog. Ser. 2018, 598, 247–259. [Google Scholar] [CrossRef]
  62. Parrondo, M.; Morán, P.; Ballenghien, M.; Acuña, J.L.; Aguión, A.; Arrontes, J.; Chiss, J.; Cruz, T.; Fernandes, J.N.; García-Flórez, L.; et al. Chaotic Genetic Patchiness in the Highly Valued Atlantic Stalked Barnacle Pollicipes Pollicipes From the Iberian Peninsula: Implications for Fisheries Management. Front. Mar. Sci. 2022, 9, 801780. [Google Scholar] [CrossRef]
  63. Dietrich, D.E.; Tseng, Y.-H.; Medina, R.; Piacsek, S.A.; Liste, M.; Olabarrieta, M.; Bowman, M.J.; Mehra, A. Mediterranean Overflow Water (MOW) Simulation Using a Coupled Multiple-Grid Mediterranean Sea/North Atlantic Ocean Model. J. Geophys. Res. Ocean. 2008, 113. [Google Scholar] [CrossRef]
  64. Silva, L.; Sobrino, I.; Ramos, F. Reproductive Biology of the Common Octopus, Octopus vulgaris Cuvier, 1797 (Cephalopoda: Octopodidae) in the Gulf of Cádiz (SW Spain). Bull. Mar. Sci. 2002, 71, 837–850. [Google Scholar]
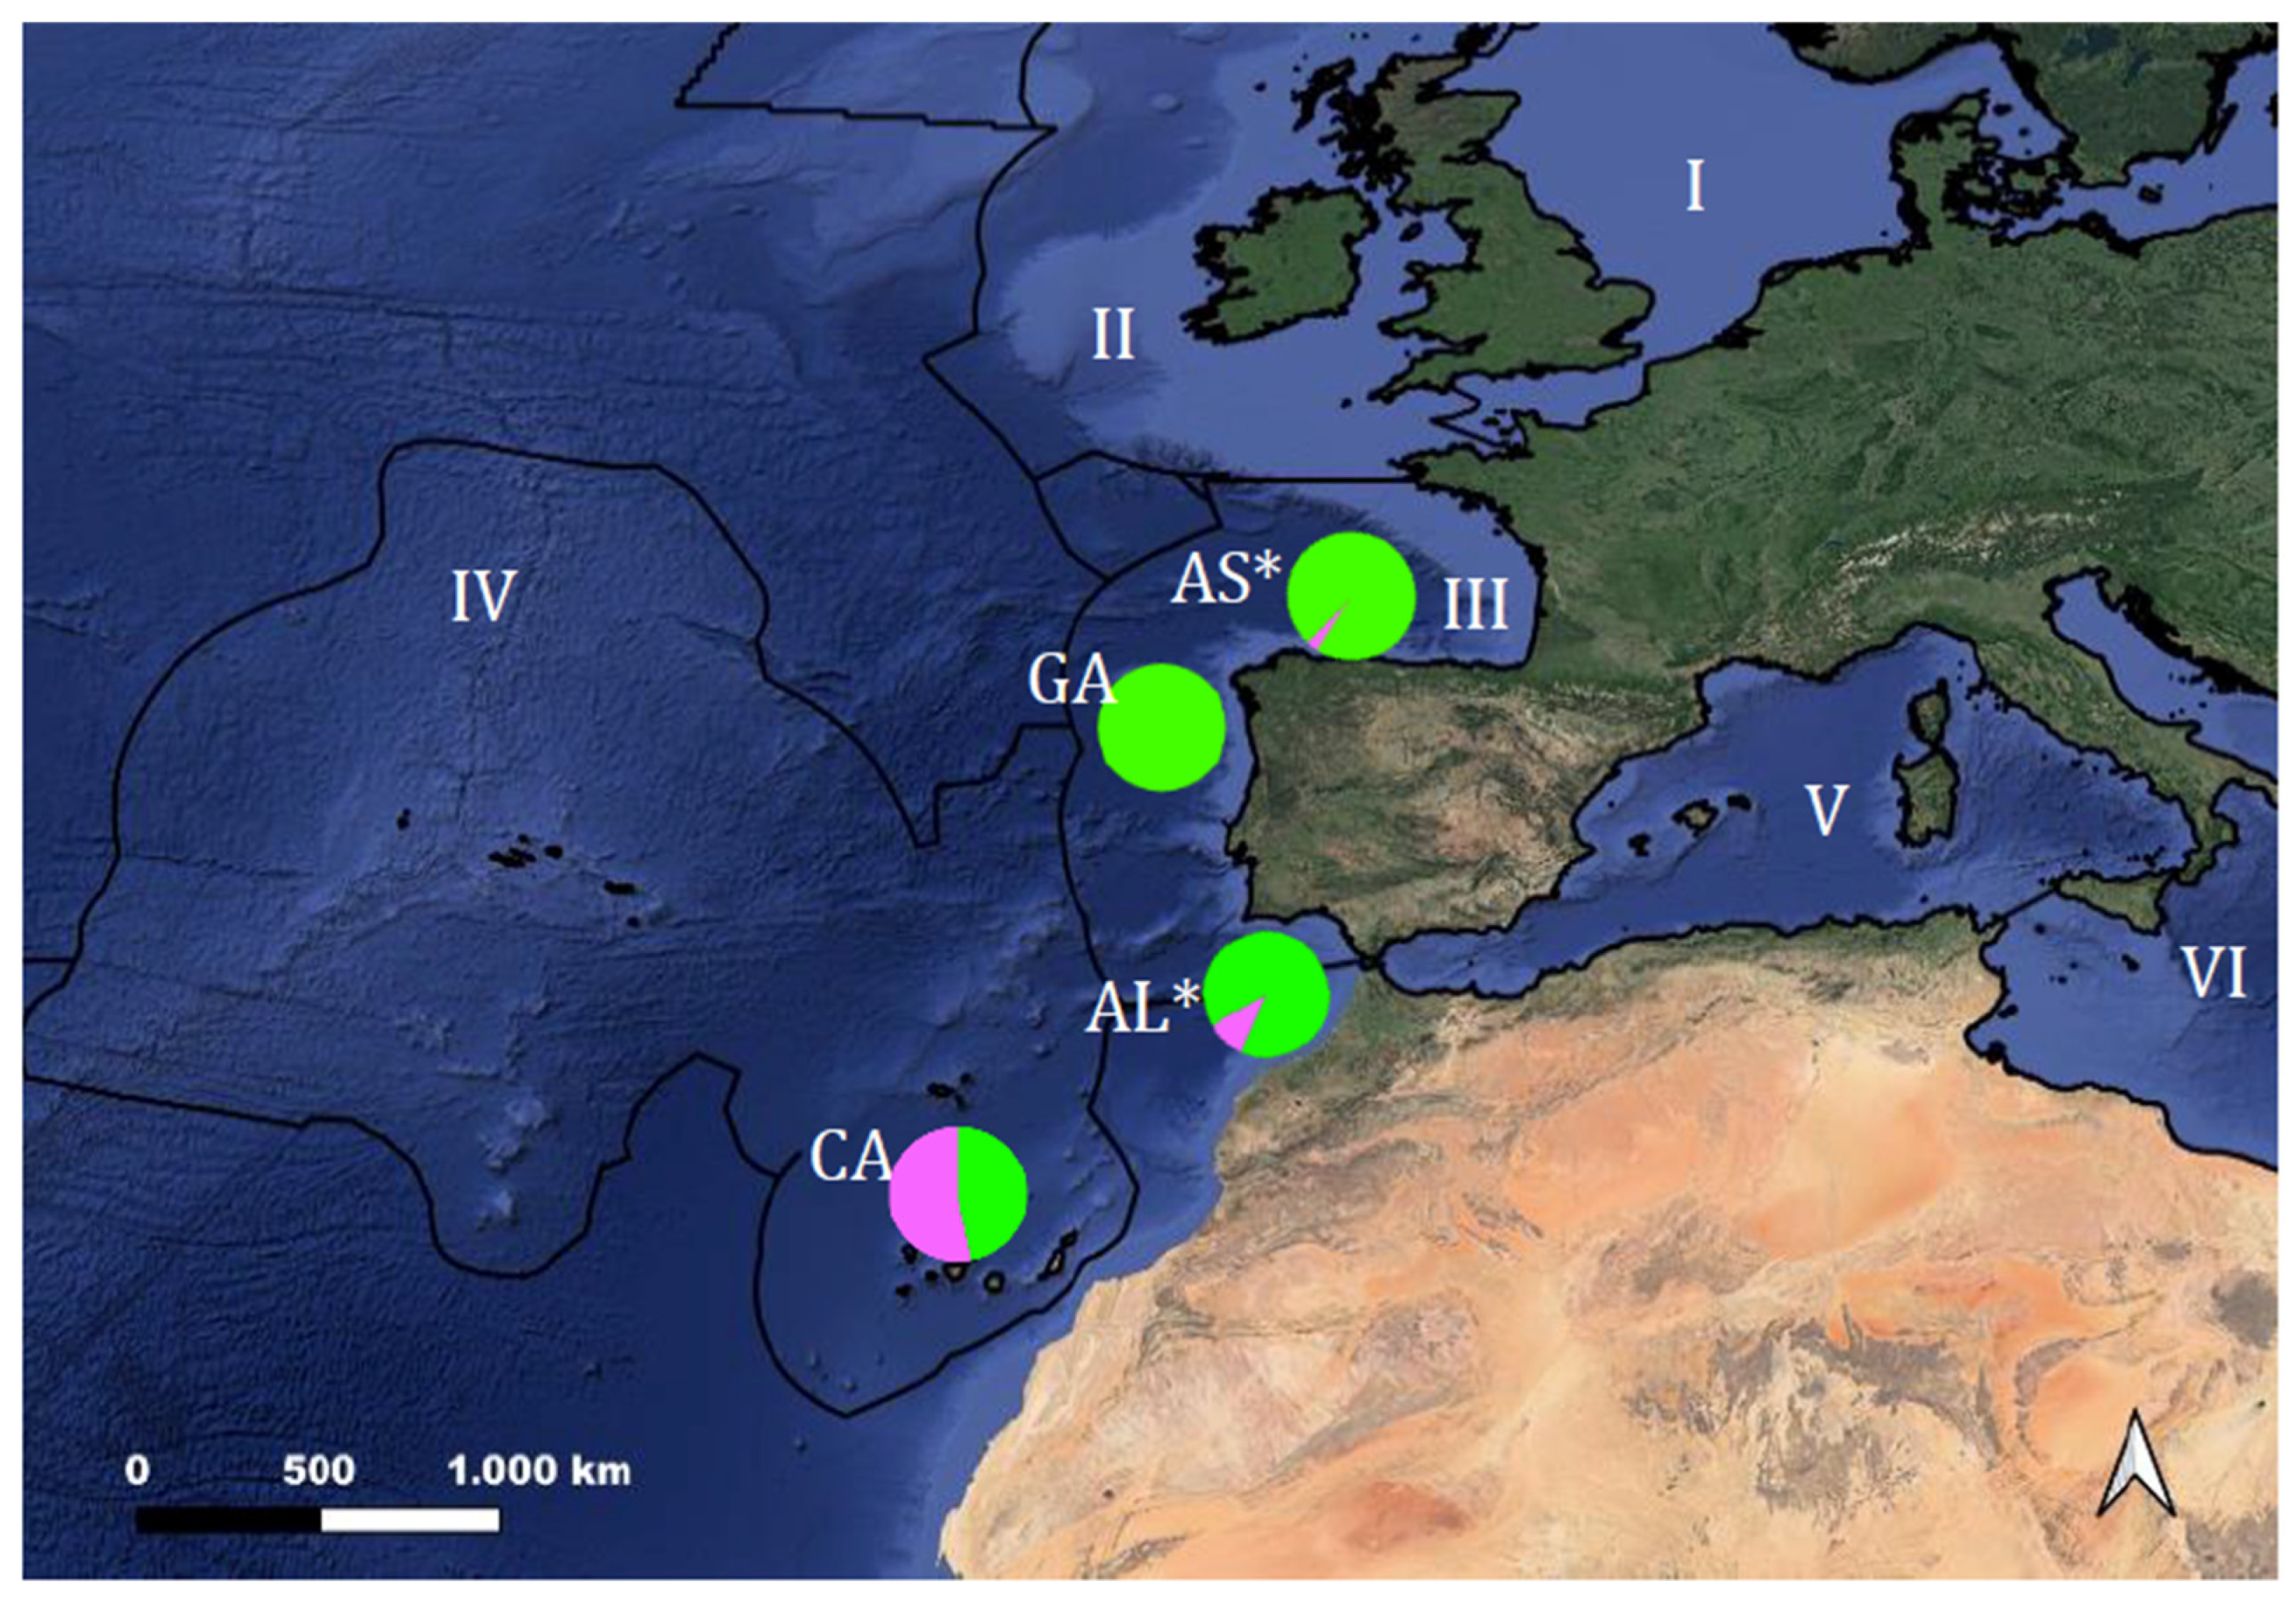
Figure 1. Geographical locations of octopus populations sampled in the present study for genetic analyses of mitochondrial DNA. Sampling sites are AS (Asturias), GA (Galicia), AL (Algarve) and CA (Canary Islands). Colors represents the two clades found for the mitochondrial DNA analysis (in green, haplogroup β, and in pink, haplogroup α, as in Quinteiro et al.’s [30] study). Numbers indicate different marine subregions following the Marine Strategy Framework Directive—MSFD (Directive 2008/56/EC of the European Parliament and of the Council of 17 June 2008, establishing a framework for community action in the field of marine environmental policy): I: North Sea, II: Celtic Sea, III: Bay of Biscay and the Iberian Coast, IV: Macaronesia, V: Western Mediterranean and VI: Ionian Sea. *: Populations sampled in two different fishing seasons. (Information available from the European Environment Agency).
Animals 13 02708 g001
Figure 2. (a) Haplotype network built using median joining algorithm for octopus haplotypes (22) from the Northeastern Atlantic using the concatenated mitochondrial region (cox1 + CR). Circles represent different haplotypes and size is proportional to its frequency. Colors indicate each population and marine subregions are also indicated. The distance for 1 mutation is indicated to be counted from the center of each circle to another. The mv red circles indicate ancestral, extinct or not found haplotypes. (b) Maximum likelihood tree for the same haplotypes and samples also using the combined region of cox1 + CR. Bootstrap support for ML, MP and NJ analysis, respectively, is shown at the nodes (only bootstrap values over 70% are displayed). Octopus sinensis is added as an outgroup. The letters in the legend represent the sampling sites (BC (Basque Country), AS (Asturias), GA (Galicia), AL (Algarve), CA (Canary Islands), VC (Valencian Country) and TK (Turkey)). The numbers represent the years in which sampling was performed.
Animals 13 02708 g002
Figure 3. (a) Haplotype network for the control region built using median joining algorithm in network for the same octopus haplotypes. Circles represent different haplotypes and size is proportional to its frequency. Colors indicate each population. The distance for 1 mutation is indicated to be counted from the center of each circle to another. Next to haplotypes from Quinteiro et al. [30] are the corresponding numbers in the network. The mv red circles indicate ancestral, extinct or not found haplotypes. (b) Bayesian tree inferred in Mr Bayes for the control region of the mitochondria for octopus haplotypes from the Northeastern Atlantic and Mediterranean. It includes individuals from the present study (haplotypes in black) and those from Quinteiro et al. [30] (haplotypes in brown). Octopus sinsensis is added as an outgroup. The letters in the legend represent the sampling sites (CA (Canary Islands), VC (Valencian Country) and TK (Turkey), BC (Basque Country), AS (Asturias), GA (Galicia), AL (Algarve)) and the numbers represent the years in which sampling was performed.
Animals 13 02708 g003
Table 1. Number of individuals analyzed in this study (n) by fishing season, sampling region and locality. Code, coordinates and FAO fishery division are also included.
Sampling RegionLocalityCodeCoordinatesFAO DivisionFishing Seasonn
Asturias 1
Cantabrian Sea
Puerto de VegaAS43.566/−6.63327.8. c2006–2007
2020–2021
15
15
Galicia 1
Northeastern Atlantic
BueuGA42.363/−8.85127.9. a2020–202115
Algarve 1
Northeastern Atlantic
OlhãoAL36.947/−7.95427.9. a2006–2007
2020–2021
15
15
Canary Islands 2
Northeastern Atlantic
San AndrésCA28.616/−16.33534.1.22018–202015
1 Bay of Biscay and the Iberian Coast, 2 Macaronesia.
Table 2. Population parameters for cox1 and CR mitochondrial loci and the concatenated sequences from both genes after genetic analyses using octopus samples from the Northeastern Atlantic. Sample size (N), nº of haplotypes (Nh), sample-specific haplotypes (hs), haplotype diversity (h), nucleotide diversity (π), average number of nucleotide differences (k).
Cytochrome Oxidase 1 (cox1)Control Region (CR)Concatenated (cox1 + CR)
PopulationNNhhshπkNhhshπkNhhshπk
Asturias
2006–2007
15300.5140.001681.086620.7900.006334.095720.8190.004015.181
Asturias
2020–2021
15310.6000.001030.667510.7900.001791.162620.8190.001411.829
Galicia
2020–2021
15300.6000.001030.667610.8190.002051.333610.8380.001542.000
Algarve
2006–2007
15310.4480.000740.476410.5520.000970.629620.7140.000851.105
Algarve
2020–2021
15300.7050.004042.610620.7900.013308.629620.7900.0086811.238
Canary Islands 2018–202015510.7430.005903.810730.8190.0196612.743840.8380.0127916.552
Table 3. Population pairwise ϕST values estimated from the mitochondrial concatenated region (cox1 + CR) in octopus samples from the Northeastern Atlantic. ϕST values, using pairwise comparisons as a distance method, are located below the diagonal and above the diagonal with their corresponding p values (italics). Significance (* p < 0.05). Significance after Bonferroni correction (cut-off value p < 0.0033) in bold.
Asturias 2006–2007Asturias 2020–2021Galicia 2020–2021Algarve 2006–2007Algarve 2020–2021Canary Islands 2018–2021
Asturias 2006–2007 0.253040.342540.008610.531630.00386
Asturias 2020–20210.01038 0.999900.211560.112560.00129
Galicia 2020–20210.00265−0.04978 0.100680.106920.00109
Algarve 2006–20070.09957 *0.035090.07656 0.013460.00000
Algarve 2020–2021−0.006020.096500.096080.13592 * 0.05148
Canary Islands 2018–20210.27796 *0.38857 *0.38857 *0.41558 *0.11231
Disclaimer/Publisher’s Note: The statements, opinions and data contained in all publications are solely those of the individual author(s) and contributor(s) and not of MDPI and/or the editor(s). MDPI and/or the editor(s) disclaim responsibility for any injury to people or property resulting from any ideas, methods, instructions or products referred to in the content.

