
Greenhouse Gas Emissions and Crossbred Cow Milk Production in a Silvopastoral System in Tropical Mexico
 , ,
, ,
Abstract
:Simple Summary
Abstract
1. Introduction
2. Materials and Methods
2.1. Milk Production and Nitrogen Excretion
2.1.1. Site Description
2.1.2. Milk Production
2.1.3. Estimation of Forage Intake
2.1.4. Fecal and Urinary Production
2.2. CH4 and N2O Emissions
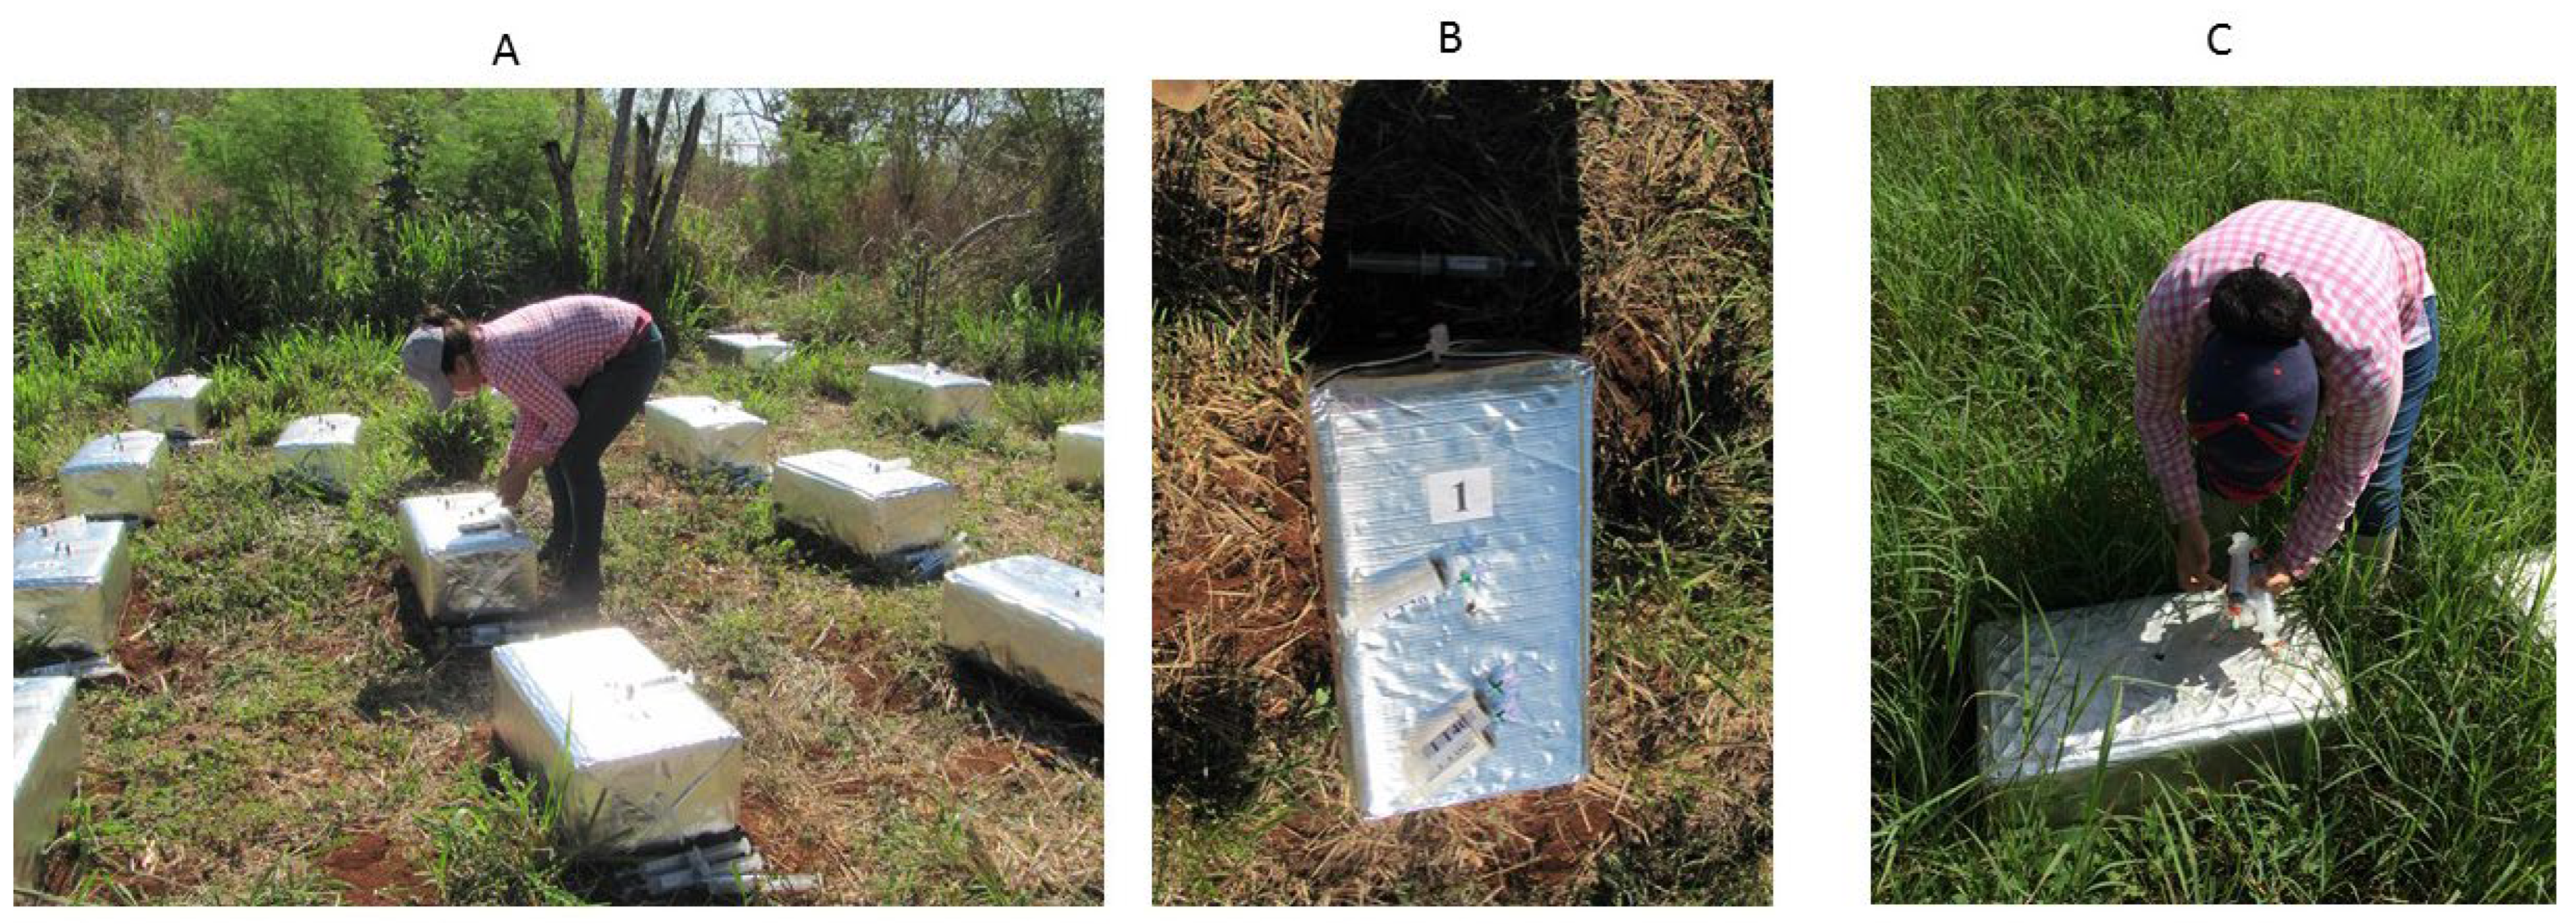
2.2.1. Experimental Design and Excreta Handling
2.2.2. Quantification of N2O and CH4 Emissions
2.2.3. Emission Factors
2.3. Statistical Analysis
3. Results
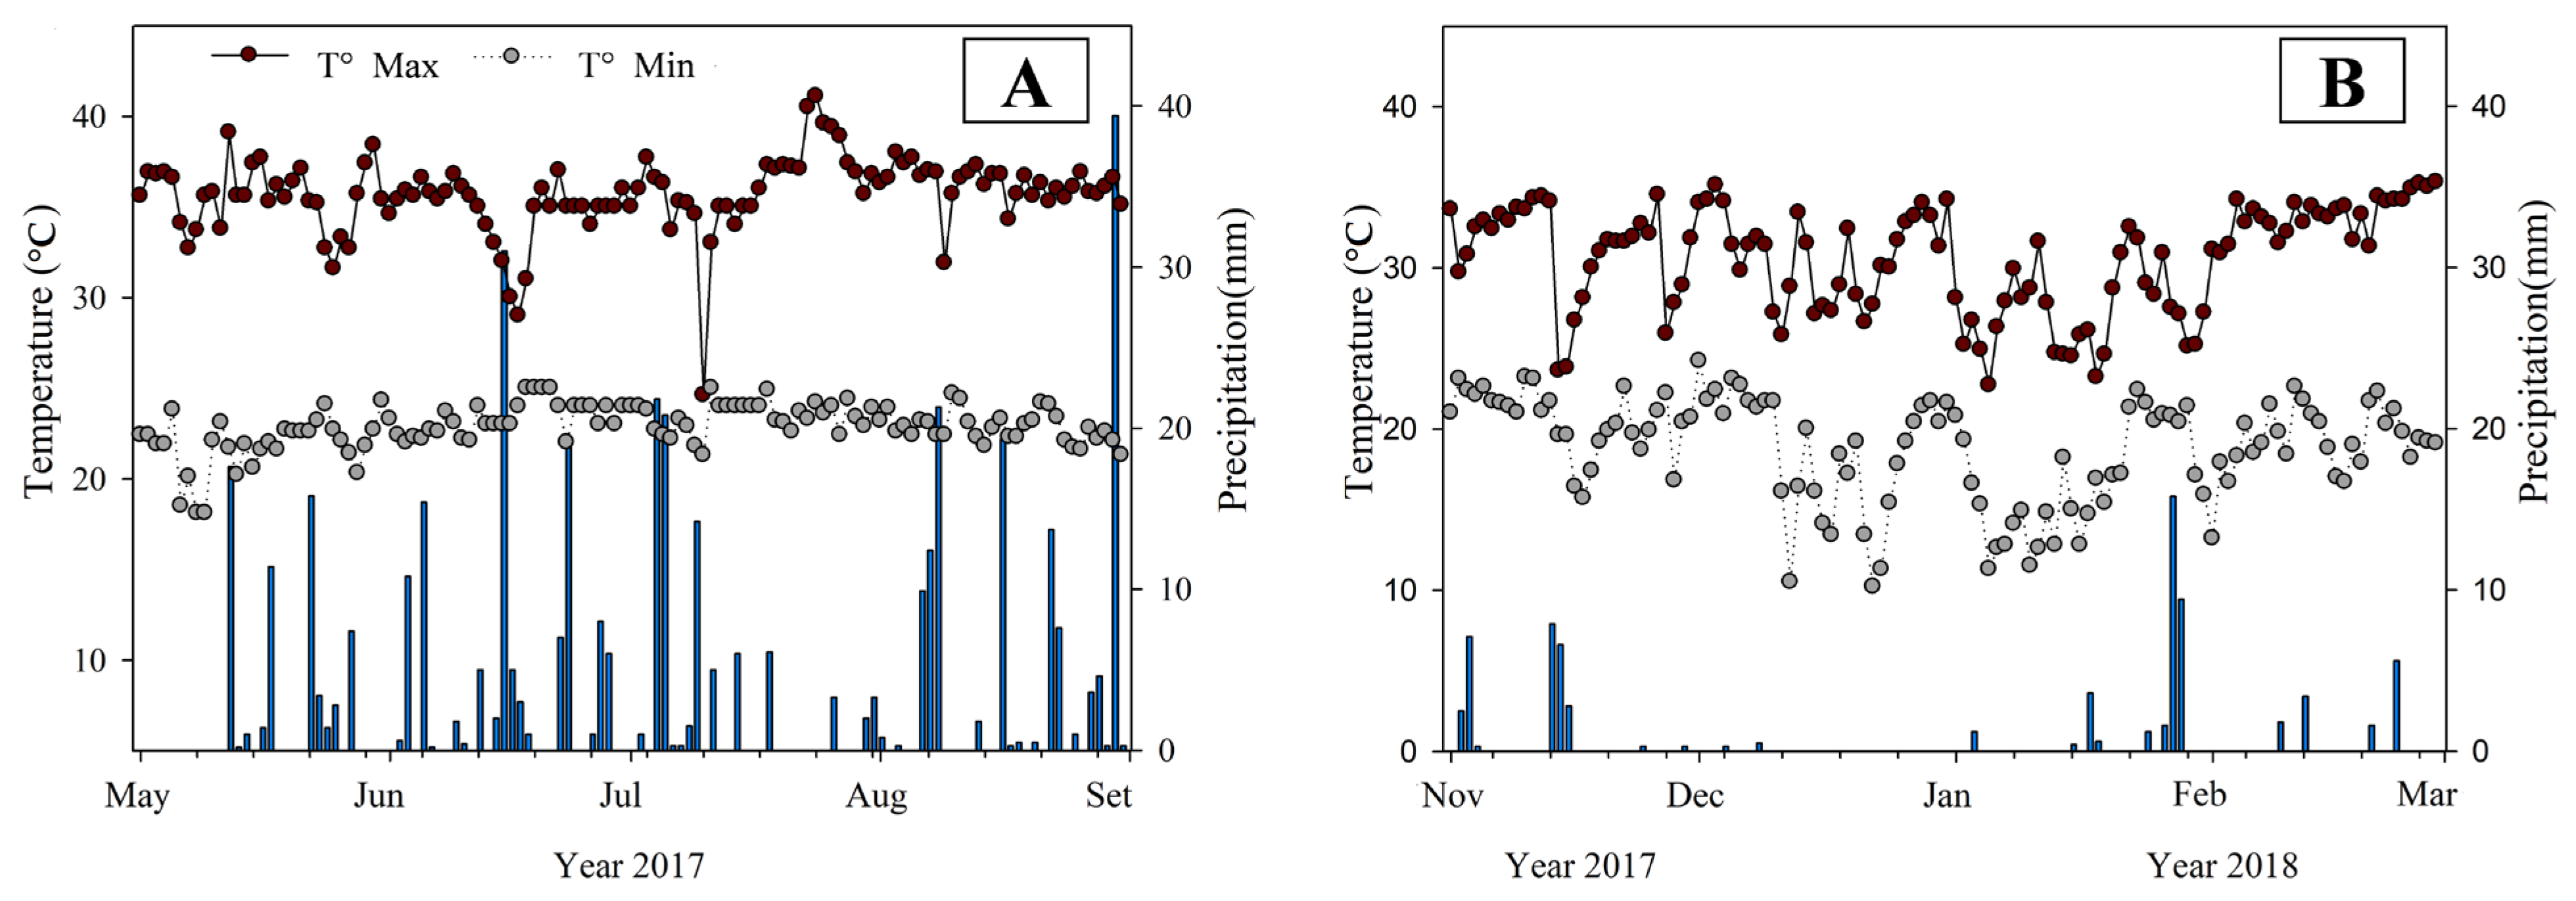
3.1. Weather Data
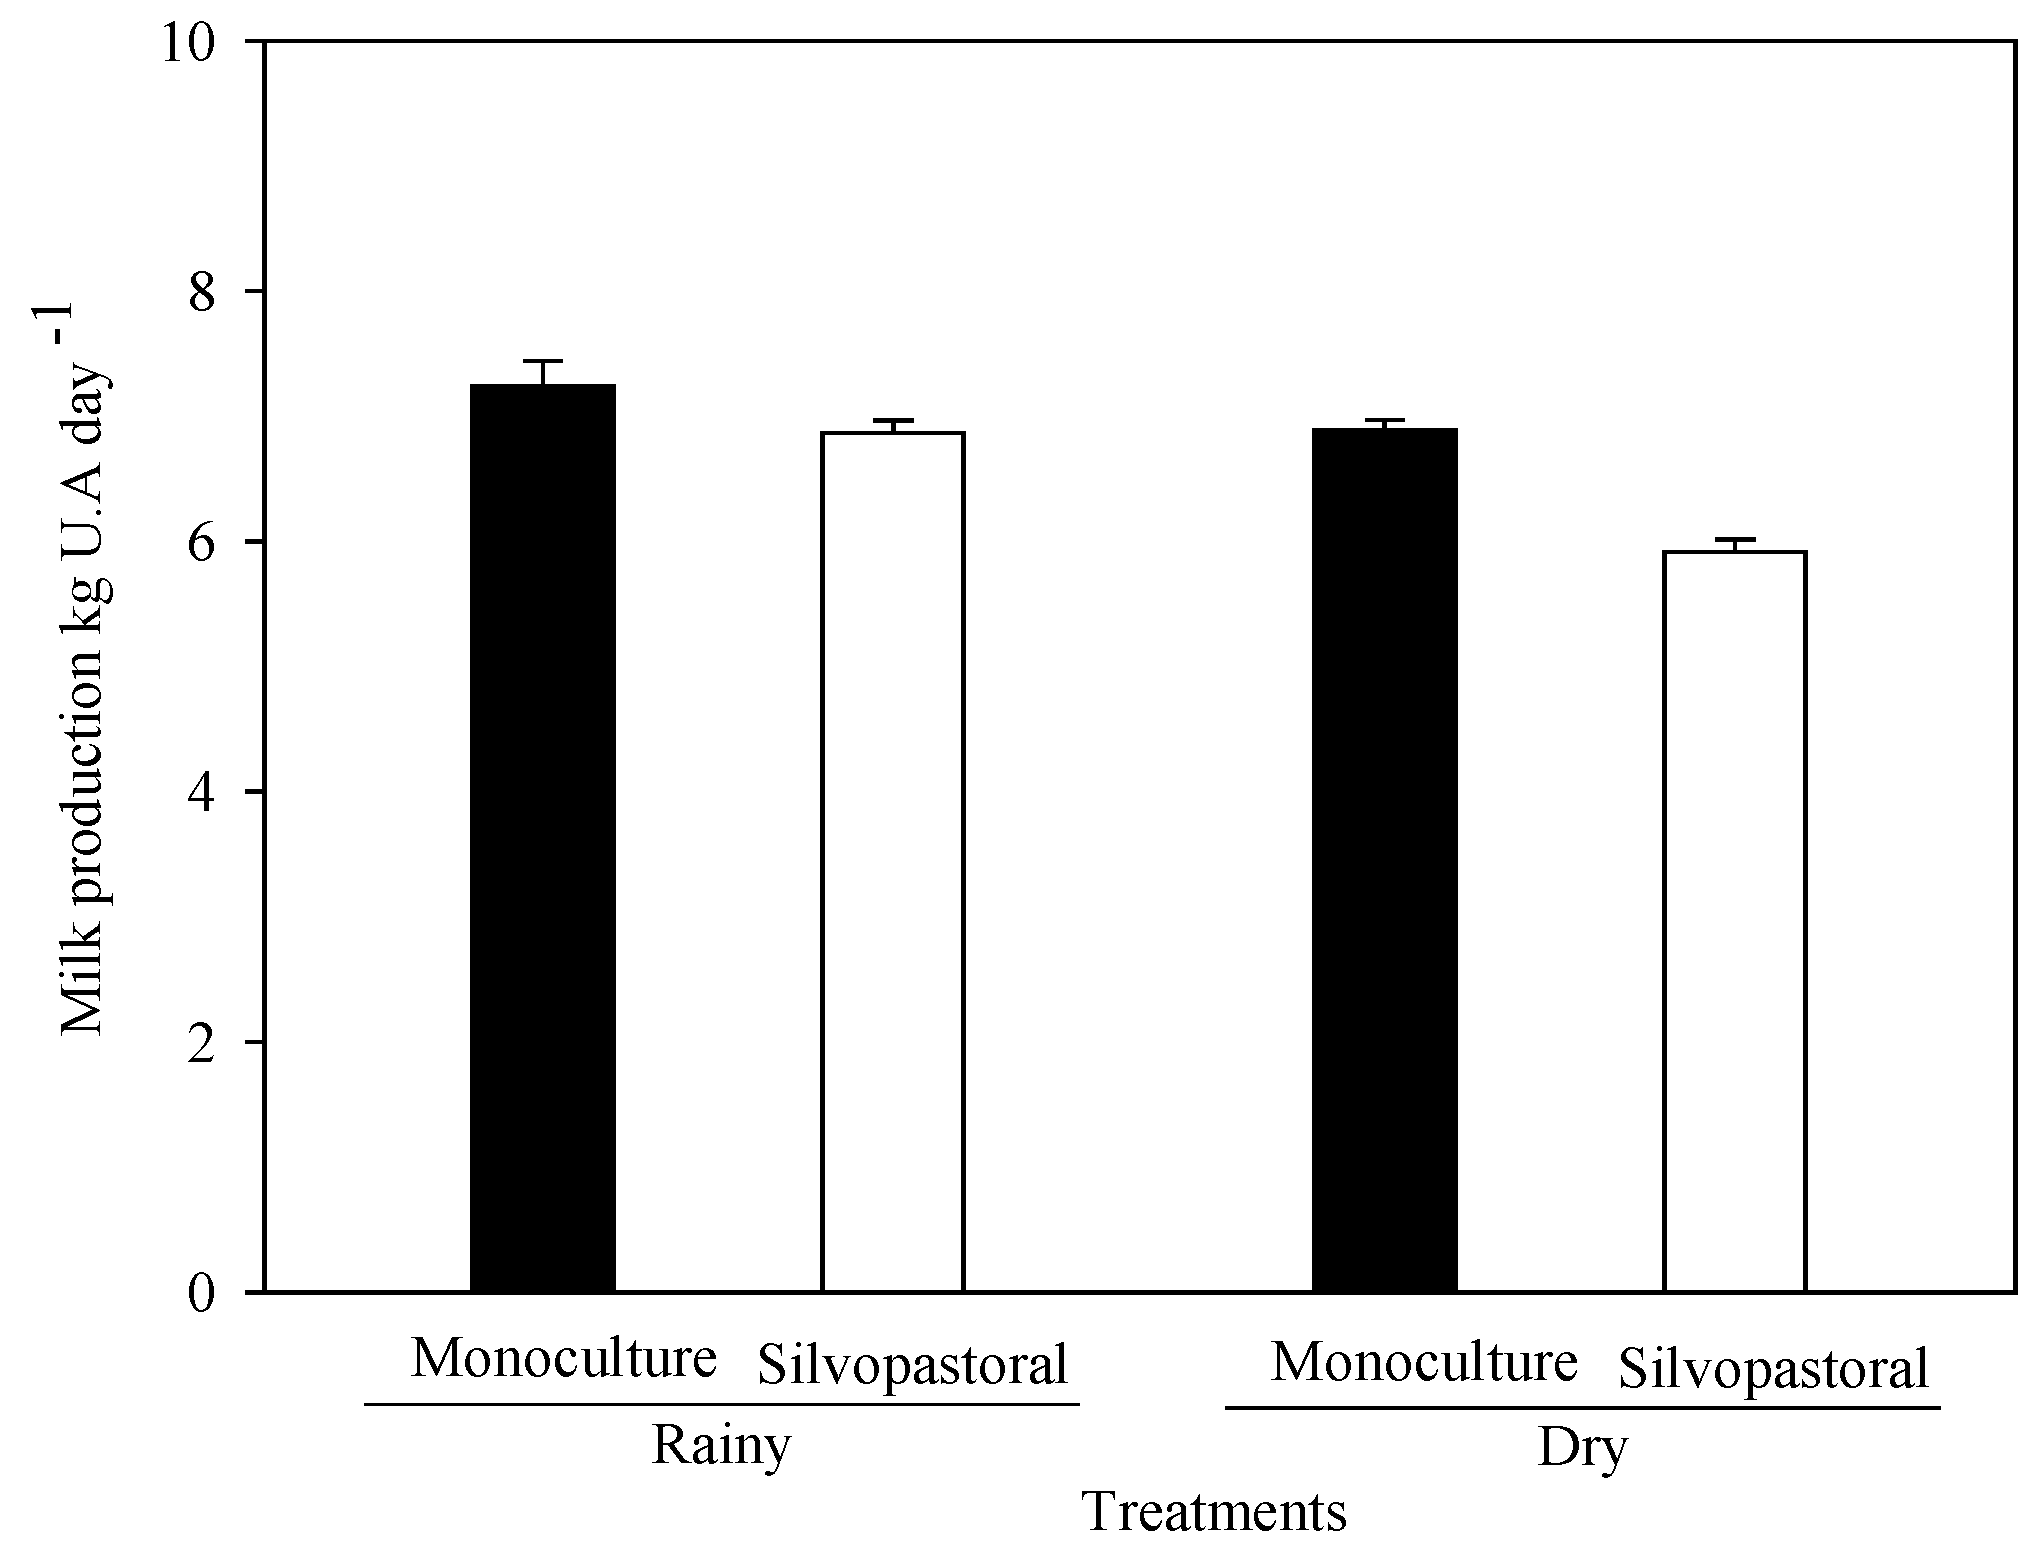
3.2. Influence of Diet on Milk Production
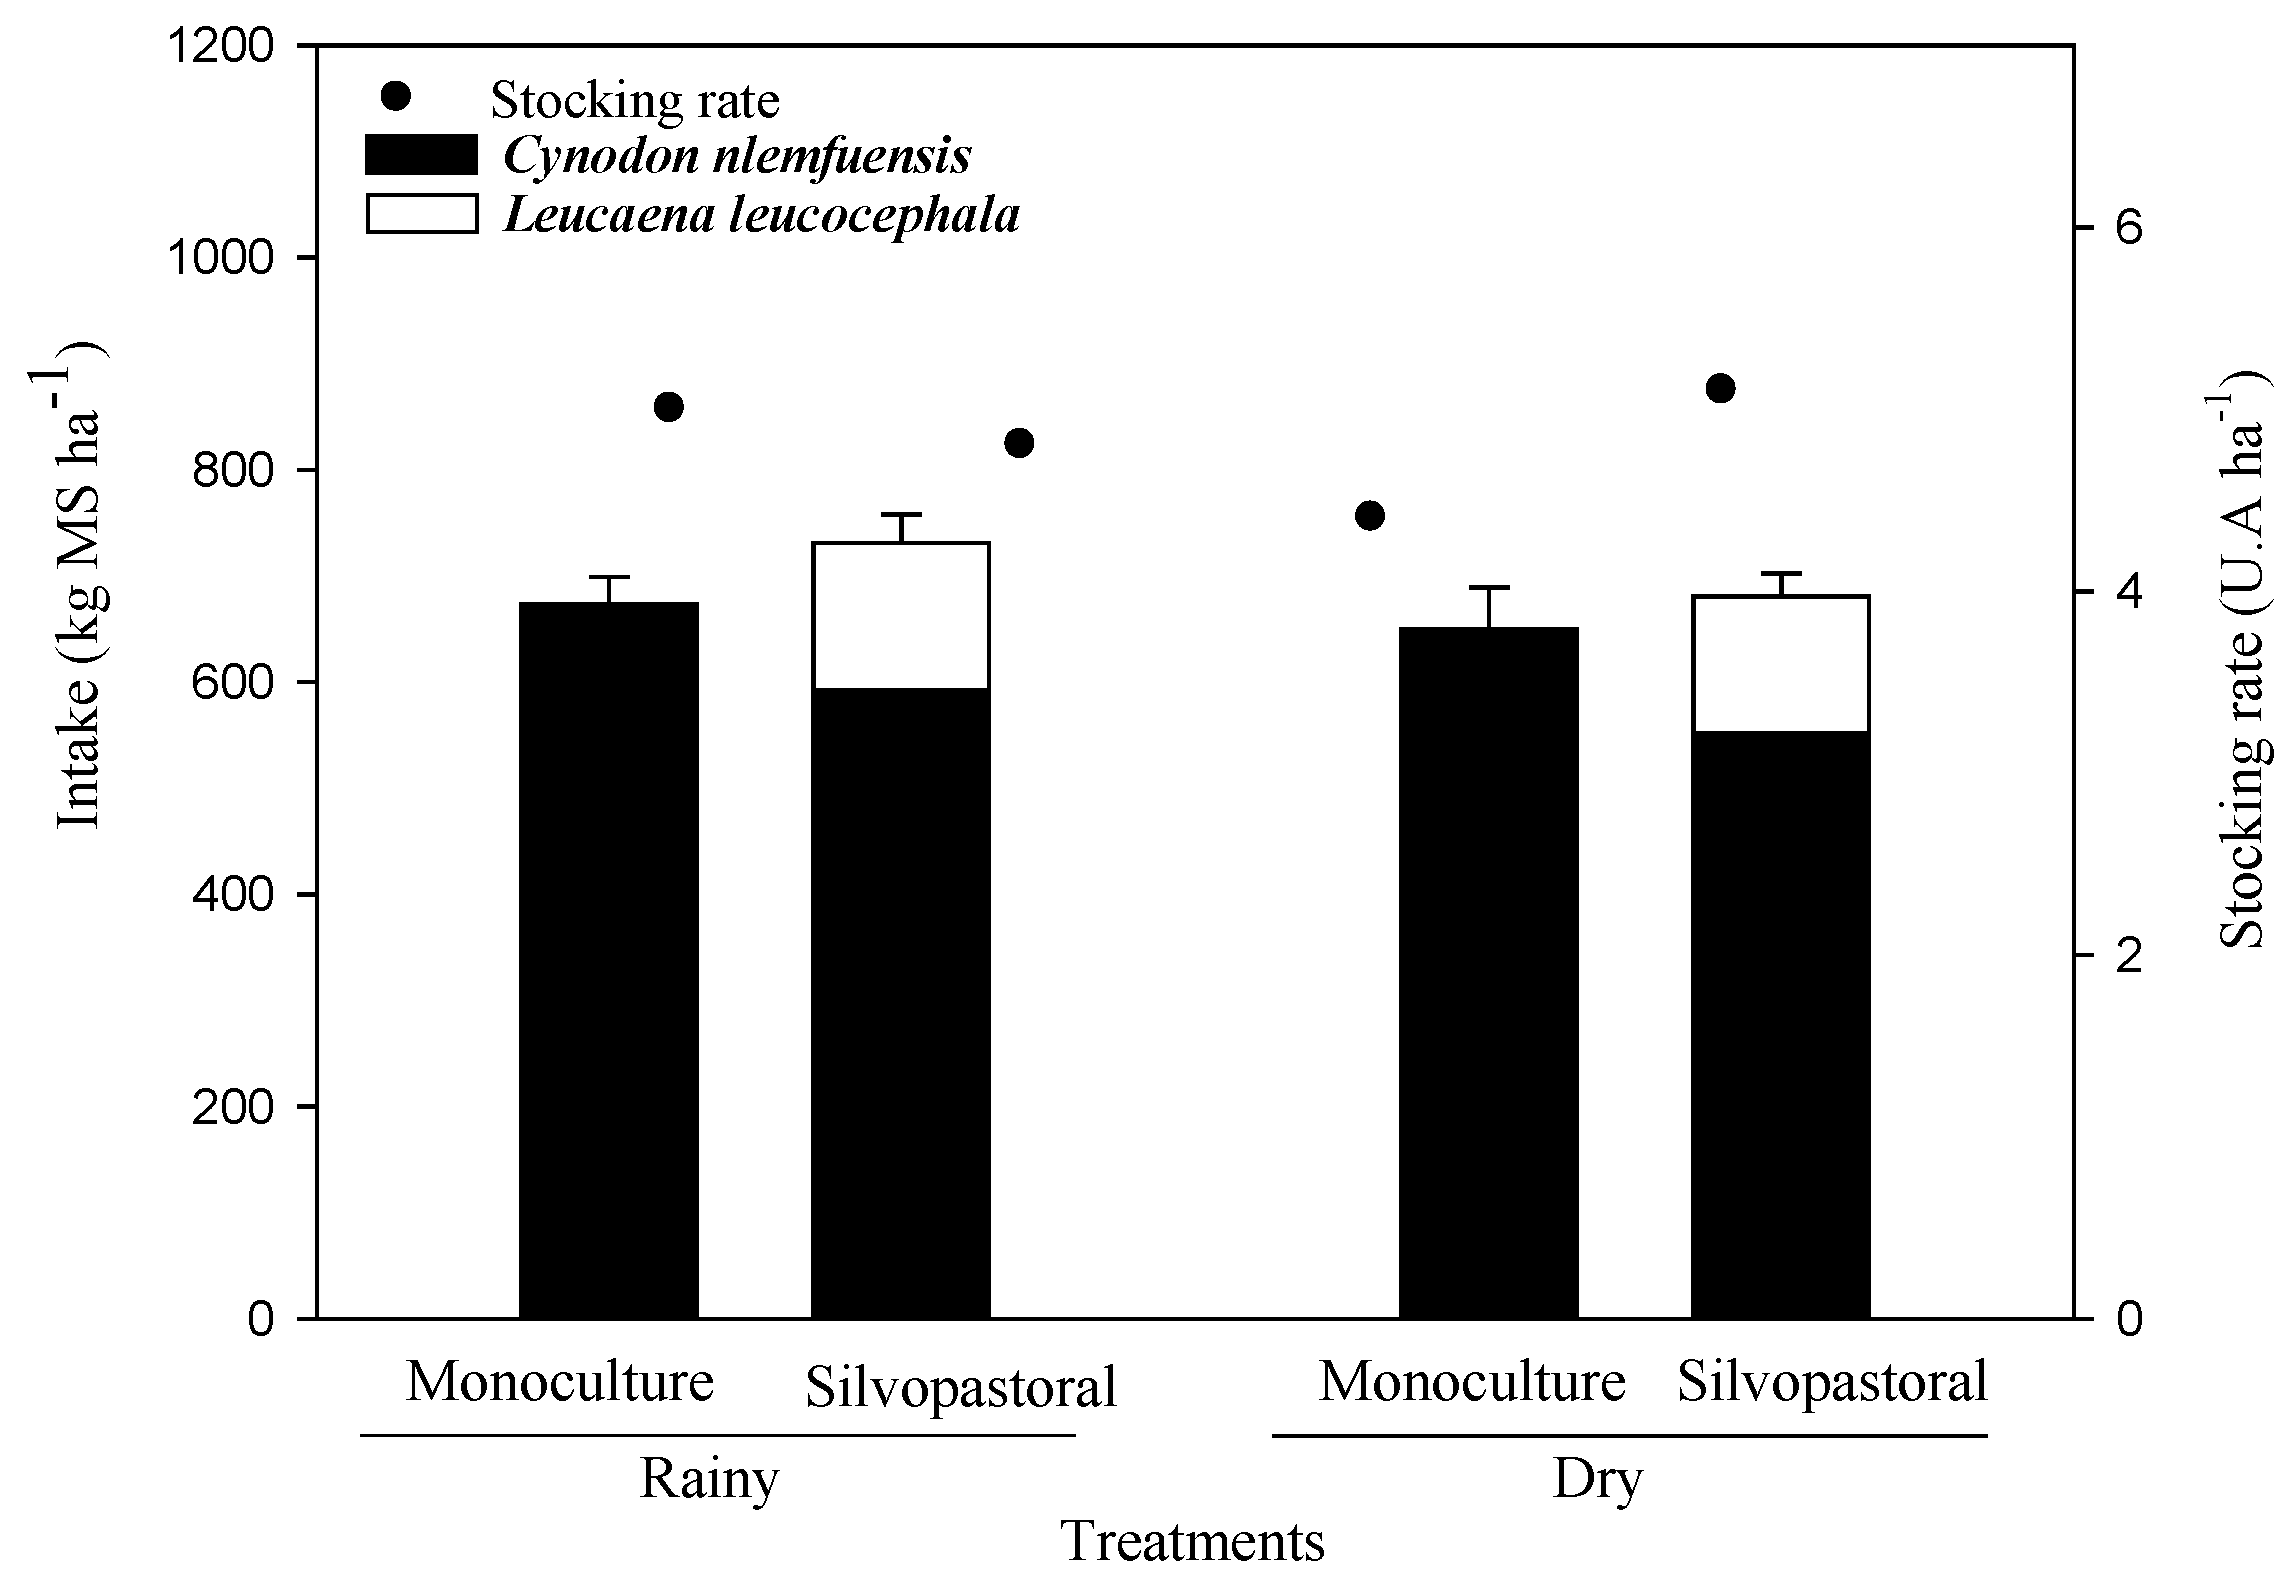
3.3. Forage Intake and N Content, and the Proportion of Legumes in the Forage Consumed
3.4. Quantification of Urinary Production, Fecal Production, and Nitrogen Balance
3.5. Nitrous Oxide and Methane Emissions from Bovine Excreta
3.6. Emission Factors
4. Discussion
4.1. Influence of Diet on Milk Production
4.2. Herbage Intake and Digestibility
4.3. Excretory Pattern and N Balance
4.4. Nitrous Oxide and Methane Emissions from Excreta
5. Conclusions
Author Contributions
Funding
Institutional Review Board Statement
Informed Consent Statement
Data Availability Statement
Acknowledgments
Conflicts of Interest
References
- Opio, C.; Gerber, P.; Mottet, A.; Falcucci, A.; Tempio, G.; MacLeod, M.; Vellinga, T.; Henderson, B.; Steinfeld, H. Greenhouse Gas Emissions from Ruminant Supply Chains–A Global Life Cycle Assessment; Food and Agriculture Organization of the United Nations: Rome, Italy, 2013. [Google Scholar]
- INEGI, Instituto Nacional de Estadística, Geografía e Informática. Temas, Agricultura, Ganadería y Pesca, Ganadería. 2019. Available online: https://www.inegi.org.mx/temas/ganaderia/ (accessed on 23 January 2019).
- Boddey, R.M.; Macedo, R.; Tarré, R.M.; Ferreira, E.; De Oliveira, O.C.; Rezende, C.D.P.; Cantarutti, R.B.; Pereira, J.M.; Alves, B.J.R.; Urquiaga, S. Nitrogen cycling in Brachiaria pastures: The key to understanding the process of pasture decline. Agric. Ecosyst. Environ. 2004, 103, 389–403. [Google Scholar] [CrossRef]
- De Oliveira, O.C.; De Oliveira, I.P.; Ferreira, E.; Alves, B.J.R.; Miranda, C.H.B.; Vilela, L.; Urquiaga, S.; Boddey, R.M. Response of degraded pastures in the Brazilian Cerrado to chemical fertilization. Pasturas Trop. 2011, 23, 14–18. [Google Scholar]
- Jantalia, C.P.; Terré, R.M.; Macedo, R.O.; Alves, B.J.R.; Urquiaga, S.; Boddey, R.M. Acumulação de carbono no solo em pastagens de Brachiaria. In Manejo de Sistemas Agrícolas: Impactos no Sequestro de C e Nas Emissões de Gases de Efeito Estufa; Alves, B.J.R., Urquiaga, S., Aita, C., Boddey, R.M., Jantalia, C.P., Camargo, F.A.O., Eds.; Genesis: Porto Alegre, Brazil, 2006; pp. 157–170. [Google Scholar]
- Crosson, P.; Shalloo, L.; O’brien, D.; Lanigan, G.J.; Foley, P.A.; Boland, T.M.; Kenny, D.A. A review of whole farm systems models of greenhouse gas emissions from beef and dairy cattle production systems. Anim. Feed Sci. Technol. 2011, 166, 29–45. [Google Scholar] [CrossRef]
- Congio, G.F.S.; Batalha, C.D.A.; Chiavegato, M.B.; Berndt, A.; Oliveira, P.P.A.; Frighetto, R.T.S.; Maxwell, T.M.R.; Gregorini, P.; Da Silva, S.C. Strategic grazing management towards sustainable intensification at tropical pasture-based dairy systems. Sci. Total Environ. 2018, 636, 872–880. [Google Scholar] [CrossRef]
- Braz, S.P.; Urquiaga, S.; Alves, B.J.R.; Jantalia, C.P.; Guimarães, A.P.; Dos Santos, C.A.; Dos Santos, S.C.; Machado-Pinheiro, E.F.; Boddey, R.M. Soil carbon stocks under productive and degraded pastures in the Brazilian Cerrado. Soil Sci. Soc. Am. J. 2013, 77, 914–928. [Google Scholar] [CrossRef]
- Alves, B.J.R.; Carvalho, A.M.; Jantalia, C.P.; Madari, B.; Urquiaga, S.; Dos Santos, J.C.F.; Dos Santos, H.P.; Carvalho, C.J.R. Emissões de óxido nitroso e óxido nítrico do solo em sistemas agrícolas. In Estoque de Carbono e Emissões de Gases de Efeito Estufa na Agropecuária Brasileira, 1st ed.; Lima, M.A., Boddey, R.M., Alves, B.J.R., Machado, P.L.O.d.A., Urquiaga, S., Eds.; Embrapa: Brasília, Brazil, 2012; pp. 159–191. [Google Scholar]
- Cardoso, A.S.; Berndt, A.; Leytem, A.; Alves, B.J.; De Carvalho, I.D.N.; De Barros Soares, L.H.; Boddey, R.M. Impact of the intensification of beef production in Brazil on greenhouse gas emissions and land use. Agric. Syst. 2016, 143, 86–96. [Google Scholar] [CrossRef] [Green Version]
- Balasubramanian, V.; Alves, B.; Aulakh, M.; Bekunda, M.; Cai, Z.; Drinkwater, L.; Mugendi, D.; Van Kessel, C.; Oenema, O. Crop, Environmental, and Management Factors Affecting Nitrogen Use Efficiency. In Agriculture and the Nitrogen Cycle: Assessing the Impacts of Fertilizer Use on Food Production and the Environment; Mosier, A.R., Syers, J.K., Freney, J.R., Eds.; Scope 65; Island Press: Washington, DC, USA, 2004; pp. 19–33. [Google Scholar]
- Robertson, G.P.; Grace, P.R. Greenhouse gas fluxes in tropical and temperate agriculture: The need for a full-cost accounting of global warming potentials. Environ. Dev. Sustain. 2004, 6, 51–63. [Google Scholar] [CrossRef]
- Intergovernmental Panel on Climate Change (IPCC). Guidelines for National Greenhouse Gas Inventories. Greenhouse Gas Inventory Reference Manual, 4. Intergovernmental Panel on Climate Change, 2006. Available online: http://www.ipccnggip.iges.or.jp/public/2006gl/vol4.html (accessed on 27 April 2021).
- Alves, B.J.R.; Urquiaga, S.; Jantalia, C.P.; Boddey, R.M. Influência de Fungos e Bactérias na Eficiência da Fertilização Nitrogenada e na Emissão de N2O para a Atmosfera. Fertilidade e Biologia do Solo: Integração e Tecnologia para Todos; Sociedade Brasileira de Ciência do Solo: Viçosa, Brazil, 2016; Volume 1, pp. 197–226. [Google Scholar]
- Broom, D.M.; Galindo, F.A.; Murgueitio, E. Sustainable, efficient livestock production with high biodiversity and good welfare for animals. Proc. R. Soc. B Biol. Sci. 2013, 280, 2013–2025. [Google Scholar] [CrossRef] [Green Version]
- Barneze, A.S.; Abdalla, M.; Whitaker, J.; McNamara, N.P.; Ostle, N.J. Predicted Soil Greenhouse Gas Emissions from Climate× Management Interactions in Temperate Grassland. Agronomy 2022, 12, 3055. [Google Scholar] [CrossRef]
- Sarabia-Salgado, L.; Solorio-Sánchez, F.; Ramírez-Avilés, L.; Rodrigues Alves, B.J.; Ku-Vera, J.; Aguilar-Pérez, C.; Urquiaga, S.; Boddey, R.M. Increase in milk yield from cows through improvement of forage production using the N2-fixing legume Leucaena leucocephala in a silvopastoral system. Animals 2020, 10, 734. [Google Scholar] [CrossRef] [Green Version]
- Rivera-Herrera, J.E.; Molina-Botero, I.; Chará-Orozco, J.; Restrepo, E.M.; Barahona-Rosales, R. Intensive silvopastoral systems with Leucaena leucocephala (Lam.) de Wit: Productive alternative in the tropic in view of the climate change. Pastos For. 2017, 40, 159–170. [Google Scholar]
- Bohlool, B.B.; Ladha, J.K.; Garrity, D.P.; George, T. Biological nitrogen fixation for sustainable agriculture: A perspective. Plant Soil 1992, 141, 1–11. [Google Scholar] [CrossRef]
- Montoya-Flores, M.D.; Molina-Botero, I.C.; Arango, J.; Romano-Muñoz, J.L.; Solorio-Sánchez, F.J.; Aguilar-Pérez, C.F.; Ku-Vera, J.C. Effect of dried leaves of Leucaena leucocephala on rumen fermentation, rumen microbial population, and enteric methane production in crossbred heifers. Animals 2020, 10, 300. [Google Scholar] [CrossRef] [PubMed] [Green Version]
- Longo, C.; Nozella, E.F.; Cabral Filho, S.L.S.; Lavorenti, N.; Vitti, D.M.S.S.; Abdalla, A.L. Voluntary intake, apparent digestibility and nitrogen balance by sheep supplemented with Leucaena leucocephala. Livest. Res. Rural Dev. 2008, 20, 1–11. [Google Scholar]
- Lessa, A.C.R.; Madari, B.E.; Paredes, D.S.; Boddey, R.M.; Urquiaga, S.; Jantalia, C.P.; Alves, B.J. Bovine urine and dung deposited on Brazilian savannah pastures contribute differently to direct and indirect soil nitrous oxide emissions. Agric. Ecosyst. Environ. 2014, 190, 104–111. [Google Scholar] [CrossRef]
- Jensen, E.S.; Peoples, M.B.; Boddey, R.M.; Gresshof, P.M.; Hauggaard-Nielsen, H.; Alves, B.J.R.; Morrison, M.J. Legumes for mitigation of climate change and the provision of feedstock for biofuels. Agron. Sustain. Dev. 2012, 32, 329–364. [Google Scholar] [CrossRef] [Green Version]
- García, E. Modificaciones al Sistema de Clasificación Climática de Köppen [Modifications to Köppen Climate Classification System]; Instituto de Geografía de la Universidad Nacional Autónoma de México: Mexico City, Mexico, 1988. [Google Scholar]
- Bautista-Zuñiga, F.; Palacio-Álvaro, G. Caracterización y Manejo de los Suelos de la Península de Yucatán: Implicaciones Agropecuarias, Forestales y Ambientales; Universidad Autonoma de Campeche: Campeche, Mexico; University Autonoma de Yucatán: Mérida, Mexico; Instituto Nacional de Ecologia: Mexico City, Mexico, 2005. [Google Scholar]
- Cox, G.W. Laboratory Manual of General Ecology, 3rd ed.; William C. Brown Co.: Dubuque, IA, USA, 1980. [Google Scholar]
- Bacab, P.H.; Solorio, S.F. Oferta y consumo de forraje y producción de leche en ganado de doble propósito manejado en sistemas silvopastoriles en Tepalcatepec, Michoacán. Trop. Subtrop. Agroecosyst. 2011, 13, 271–278. [Google Scholar]
- AOAC. Official Methods of Analysis, 15th ed.; Helrich, K., Ed.; Association of Official Analytical Chemist: Arlington, VA, USA, 1990. [Google Scholar]
- Jung, S.; Rickert, D.; Deak, N.; Aldin, E.; Recknor, J.; Johnson, L.; Murphy, P. Comparison of Kjeldahl and Dumas methods for determining protein contents of soybean products. J. Am. Oil Chem. Soc. 2003, 80, 1169–1173. [Google Scholar] [CrossRef]
- Contreras Lara, D.; Gutiérrez Chávez, L.; Valdicia Macedo, I.; Govea Casares, R.; Ramírez Carrillo, J.T. Two techniques for measuring neutral detergent (NDF) and acid detergent fibers (ADF) in forages and by-products. Arch. Zootec. 1999, 48, 351–354. Available online: http://goo.gl/B2rxaI (accessed on 29 June 2019).
- Van Soest, P.J.; Robertson, J.B.; Lewis, B.A. Methods for dietary fiber, neutral-detergent fiber and nonstarch polysaccharides in relation to animal nutrition. J. Dairy Sci 1991, 74, 3583–3597. [Google Scholar] [CrossRef]
- Pond, K.R.; Ellis, W.C.; Matis, J.H.; Deswysen, A.G. Passage of chromium-mordanted and rare-earth-labeled fiber: Time dosing kinetics. J. Anim. Sci. 1989, 67, 1020–1028. [Google Scholar] [CrossRef] [Green Version]
- Macedo, R.; Tarré, R.M.; Ferreira, E.; Rezende, C.D.P.; Pereira, J.M.; Cadisch, G.; Boddey, R.M. Forage intake and botanical composition of feed for cattle fed Brachiaria/legume mixtures. Sci. Agric. 2010, 67, 384–392. [Google Scholar] [CrossRef]
- Myers, W.D.; Ludden, P.A.; Nayigihugu, V.; Hess, B.W. A procedure for the preparation and quantitative analysis of samples for titanium dioxide. J. Anim. Sci. 2004, 82, 179–183. [Google Scholar] [CrossRef] [PubMed] [Green Version]
- Fenton, T.W.; Fenton, M. An improved procedure for the determination of chromic oxide in feed and feces. Can. J. Anim. Sci. 1979, 59, 631–634. [Google Scholar] [CrossRef]
- Chizzotti, M.L.; De Campos Valadares Filho, S.; Valadares, R.F.D.; Chizzotti, F.H.M.; Tedeschi, L.O. Determination of creatinine excretion and evaluation of spot urine sampling in Holstein cattle. Livest. Sci. 2008, 113, 218–225. [Google Scholar] [CrossRef]
- Haynes, R.J.; Williams, P.H. Nutrient cycling and soil fertility in the grazed pasture ecosystem. Adv. Agron. 1993, 49, 119–199. [Google Scholar]
- Whitehead, D.C. Consumption, digestion and excretion of nitrogen by ruminant livestock. In Grassland Nitrogen; Whitehead, D.C., Ed.; CAB International: Wallingford, UK, 1995; pp. 59–81. [Google Scholar]
- Tinoco-Magaña, J.C.; Aguilar-Pérez, C.F.; Delgado-León, R.; Magaña-Monforte, J.G.; Ku-Vera, J.C.; Herrera-Camacho, J. Effects of energy supplementation on productivity of dual-purpose cows grazing in a silvopastoral system in the tropics. Trop. Anim. Health Prod. 2012, 44, 1073–1078. [Google Scholar] [CrossRef]
- Razz, R.; Clavero, T.; Combellas, J.; Ruíz, T. Respuesta productiva y reproductiva de vacas doble propósito suplementadas con concentrado pastoreando Panicum maximum y Leucaena leucocephala. Rev. Científica Fac. Cienc. Vet. 2004, 14, 526–530. [Google Scholar]
- Faría, J.; Chirinos, Z.; Morill, D.E. Efecto de la sustitución parcial del alimento concentrado por pastoreo con Leucaena leucocephala sobre la producción y características de la leche y variación de peso de vacas mestizas. Zootec. Trop. 2007, 25, 245–251. [Google Scholar]
- García, M.; Sánchez, C. Leucaena Leucocephala Como Fuente Proteica Alimenticia en la Ganadería Bovina Doble Propósito [Leucaena Leucocephala as Proteic Source for Dual-Purpose Cattle]. Simposio-Taller: Experiencias en Agroforestería Ejecutadas o en Proceso por el INIA. [Internet]. 2006; pp. 82–88. Available online: http://www.ceniap.gov.ve/pbd/Congresos/agroforesteria/articulos%20pdf/garcia_mercedes.pdf (accessed on 22 June 2009).
- Dos Santos, R.S.M.; Alves, B.J.R.; Urquiaga, S.; Boddey, R.M. Avaliação da produtividade primária aérea líquida de três espécies de Brachiaria sob diferentes taxas de lotação. In Manejo de Sistemas Agrícolas: Impacto no Seqüestro de C e nas Emissões de Gases de Efeito Estufa; Alves, B.J.R., Urquiaga, S., Aita, C., Boddey, R.M., Jantalia, C.P., Camargo, F.A.O., Eds.; Genesis: Porto Alegre, Brazil, 2006; pp. 133–156. [Google Scholar]
- Poppi, D.P.; McLenan, S.R. Protein and energy utilization by ruminants at pasture. J. Anim. Sci. 1995, 73, 278–290. [Google Scholar] [CrossRef]
- National Research Council. Nutrient Requirements of Dairy Cattle; National Academies Press: Washington, DC, USA, 2001.
- Pordomingo, A.J.; Volpi Lagreca, G.; Pilar, G.; Grigioni, G. Efecto del agregado de taninos en dietas de distinto nivel de grano en vaquillonas para carne alimentadas en confinamiento sobre la calidad de la carne. Boletín Técnico 2004, 88, 72–82. [Google Scholar]
- Colombatto, D.; Moulda, F.L.; Bhat, M.K.; Owen, E. Influence of exogenous fibrolytic enzyme level and incubation pH on the in vitro ruminal fermentation of alfalfa stems. Anim. Feed Sci. Technol. 2007, 137, 150–162. [Google Scholar] [CrossRef]
- Frutos, P.; Hervas, G.; Giráldez, F.J.; Mantecón, A.R. Tannins and ruminant nutrition. Span. J. Agric. Res. 2004, 2, 191–202. [Google Scholar] [CrossRef] [Green Version]
- Foroughbakhch, R.; Hernández-Piñero, J.L.; Ramirez, R.; Alvarado, M.A.; Gonzalez De Leon, O.A.; Rocha, A.; Badii, M.H. Seasonal dynamics of the leaf nutrient profile of 20 native shrubs of Northeastern Mexico. J. Anim. Vet. Adv. 2007, 6, 1000–1005. [Google Scholar]
- Morales, R.; Ungerfeld, E.M. Use of tannins to improve fatty acids profile of meat and milk quality in ruminants: A review. Chil. J. Agric. Res. 2015, 75, 239–248. [Google Scholar] [CrossRef] [Green Version]
- Dschaak, C.M.; Williams, C.M.; Holt, M.S.; Eun, J.S.; Young, A.J.; Min, B.R. Effects of supplementing condensed tannin extract on intake, digestion, ruminal fermentation, and milk production of lactating dairy cows. J. Dairy Sci. 2011, 94, 2508–2519. [Google Scholar] [CrossRef] [Green Version]
- Anantasook, N.; Wanapat, M.; Cherdthong, A.; Gunun, P. Effect of tannins and saponins in Samanea saman on rumen environment, milk yield and milk composition in lactating dairy cows. J. Anim. Physiol. Anim. Nutr. 2015, 99, 335–344. [Google Scholar] [CrossRef]
- Johnson, C.R.; Reiling, B.A.; Mislevy, P.; Hall, M.B. Effects of nitrogen fertilization and harvest date on yield, digestibility, fiber, and protein fractions of tropical grasses. J. Anim. Sci. 2001, 79, 2439–2448. [Google Scholar] [CrossRef]
- Johnson, K.A.; Johnson, D.E. Methane emissions from cattle. J. Anim. Sci. 1995, 73, 2483–2492. [Google Scholar] [CrossRef]
- Gonzalez-Garcia, E.; Caceres, O.; Archimede, H.; Santana, H. Nutritive value of edible forage from two Leucaena leucocephala cultivars with different growth habit and morphology. Agrofor. Syst. 2009, 77, 131–141. [Google Scholar] [CrossRef]
- Barros-Rodríguez, M.; Sandoval-Castro, C.A.; Solorio-Sánchez, F.J.; Sarmiento-Franco, L.A.; Rojas-Herrera, R.; Klieve, A.V. Leucaena leucocephala in ruminant nutrition. Trop. Subtrop. Agroecosyst. 2014, 17, 173–183. [Google Scholar]
- Valdivia, S.V. Metabolismo del Nitrógeno y Función Ruminal en Vacas Cruzadas Bos taurus x Bos indicus en un Sistema Silvopastoril con Leucaena leucocephala. Ph.D. Thesis, Universidad Autónoma de Yucatán, Mérida, Mexico, 2006. [Google Scholar]
- Jennings, J.S.; Meyer, B.E.; Guiroy, P.J.; Cole, N.A. Energy costs of feeding excess protein from corn-based by-products to finishing cattle. J. Anim. Sci. 2018, 6, 653–669. [Google Scholar] [CrossRef]
- Gao, B.; Ju, X.; Su, F.; Meng, Q.; Oenema, O.; Christie, P.; Chen, X.; Zhang, F. Nitrous oxide and methane emissions from optimized and alternative cereal cropping systems on the North China Plain: A two-year field study. Sci. Total Environ. 2014, 472, 112–124. [Google Scholar] [CrossRef] [PubMed]
- Conrad, R. Methane production in soil environments—Anaerobic biogeochemistry and microbial life between flooding and desiccation. Microorganisms 2020, 8, 881. [Google Scholar] [CrossRef] [PubMed]


| Block | Soil–Rock Content % | pH | N | C | P | K | Ca | Mg | |
|---|---|---|---|---|---|---|---|---|---|
| Soil | Rocks | % | mg/kg | ||||||
| I | 22 | 78 | 7.8 | 0.89 | 6.4 | 28 | 530 | 872 | 352 |
| II | 40 | 60 | 7.8 | 0.98 | 5.0 | 45 | 565 | 824 | 328 |
| III | 21 | 79 | 7.9 | 0.99 | 7.2 | 81 | 457 | 1077 | 310 |
| IV | 19 | 79 | 7.9 | 0.96 | 6.1 | 111 | 517 | 1573 | 388 |
| Median | 26 | 74 | 7.8 | 0.95 | 6.2 | 66 | 517 | 1086 | 345 |
| Parameter | Rainy | Dry | ||
|---|---|---|---|---|
| MS | SPS | MS | SPS | |
| % of L. leucocephala a | 0.0 | 19.0 | 0.0 | 18.9 |
| Urine b (L/AU/day−1) | 13.48 ± 1.06 | 11.34 ± 1.53 | 13.16 ± 1.39 | 13.21 ± 1.53 |
| Feces c (kg DM/AU/day−1) | 1.55 ± 0.06 aA | 1.75 ± 0.06 bA | 1.7 ± 0.10 B | 1.53 ± 0.05 B |
| Item | Rainy | Dry | ||
|---|---|---|---|---|
| MS | SPS | MS | SPS | |
| Nitrogen Balance (g AU/day−1) | ||||
| N intake | 115.0 ± 4.3 bB | 172.0 ± 6.3 *aA | 144.9 ± 8.7 A | 142.7 ± 4.5 B |
| N total exported | 116.3 ± 4.4 B | 137.6 ± 8.0 | 138.4 ±13.5 A | 130.2 ± 11.1 |
| N urine | 46.8 ± 3.0 B | 62.4 ± 12.3 | 69.3 ± 8.8 A | 66.8 ± 5.3 |
| N feces | 32.5 ± 2.0 b | 43.9 ± 2.5 aA | 34.3 ± 2.4 | 34.4 ± 1.2 B |
| N milk | 37.0 ± 1.7 | 31.3 ± 1.4 | 34.8 ± 3.3 | 29.0 ± 1.3 |
| Balance | −1.3 ± 3.1 b | 34.4 ± 4.3 aA | 6.5 ± 13.6 | 12.5 ± 9.0B |
| Gas (EF Unit) | Rainy | Dry | ||||||
|---|---|---|---|---|---|---|---|---|
| MS | SPS | MS | SPS | |||||
| Feces | Urine | Feces | Urine | Feces | Urine | Feces | Urine | |
| N2O (%) | 0.05 | 0.52 a | 0.01 | 0.17 b | 0.02 | 0.05 | 0.00 | 0.05 |
| CH4 (kg CH4 AU−1 year−1) | 0.17a | - | 0.26 b | - | 0.17 aA | - | 0.14 a | - |
Disclaimer/Publisher’s Note: The statements, opinions and data contained in all publications are solely those of the individual author(s) and contributor(s) and not of MDPI and/or the editor(s). MDPI and/or the editor(s) disclaim responsibility for any injury to people or property resulting from any ideas, methods, instructions or products referred to in the content. |
© 2023 by the authors. Licensee MDPI, Basel, Switzerland. This article is an open access article distributed under the terms and conditions of the Creative Commons Attribution (CC BY) license (https://creativecommons.org/licenses/by/4.0/).
Share and Cite
Sarabia-Salgado, L.; Alves, B.J.R.; Boddey, R.; Urquiaga, S.; Galindo, F.; Flores-Coello, G.; Santos, C.A.d.; Jiménez-Ocampo, R.; Ku-Vera, J.; Solorio-Sánchez, F. Greenhouse Gas Emissions and Crossbred Cow Milk Production in a Silvopastoral System in Tropical Mexico. Animals 2023, 13, 1941. https://doi.org/10.3390/ani13121941
Sarabia-Salgado L, Alves BJR, Boddey R, Urquiaga S, Galindo F, Flores-Coello G, Santos CAd, Jiménez-Ocampo R, Ku-Vera J, Solorio-Sánchez F. Greenhouse Gas Emissions and Crossbred Cow Milk Production in a Silvopastoral System in Tropical Mexico. Animals. 2023; 13(12):1941. https://doi.org/10.3390/ani13121941
Chicago/Turabian StyleSarabia-Salgado, Lucero, Bruno J. R. Alves, Robert Boddey, Segundo Urquiaga, Francisco Galindo, Gustavo Flores-Coello, Camila Almeida dos Santos, Rafael Jiménez-Ocampo, Juan Ku-Vera, and Francisco Solorio-Sánchez. 2023. "Greenhouse Gas Emissions and Crossbred Cow Milk Production in a Silvopastoral System in Tropical Mexico" Animals 13, no. 12: 1941. https://doi.org/10.3390/ani13121941