
Feeding-Regime-Dependent Intestinal Response of Rainbow Trout after Administration of a Novel Probiotic Feed

 , , , and
Abstract
:Simple Summary
Abstract
1. Introduction
2. Materials and Methods
2.1. The Preparation of Probiotic Feed for Aquaculture
2.1.1. Cultivation of Probiotic Bacteria and Preparation of Bacterial-Starch Hydrogel
2.1.2. Coating of Commercial Aquafeed
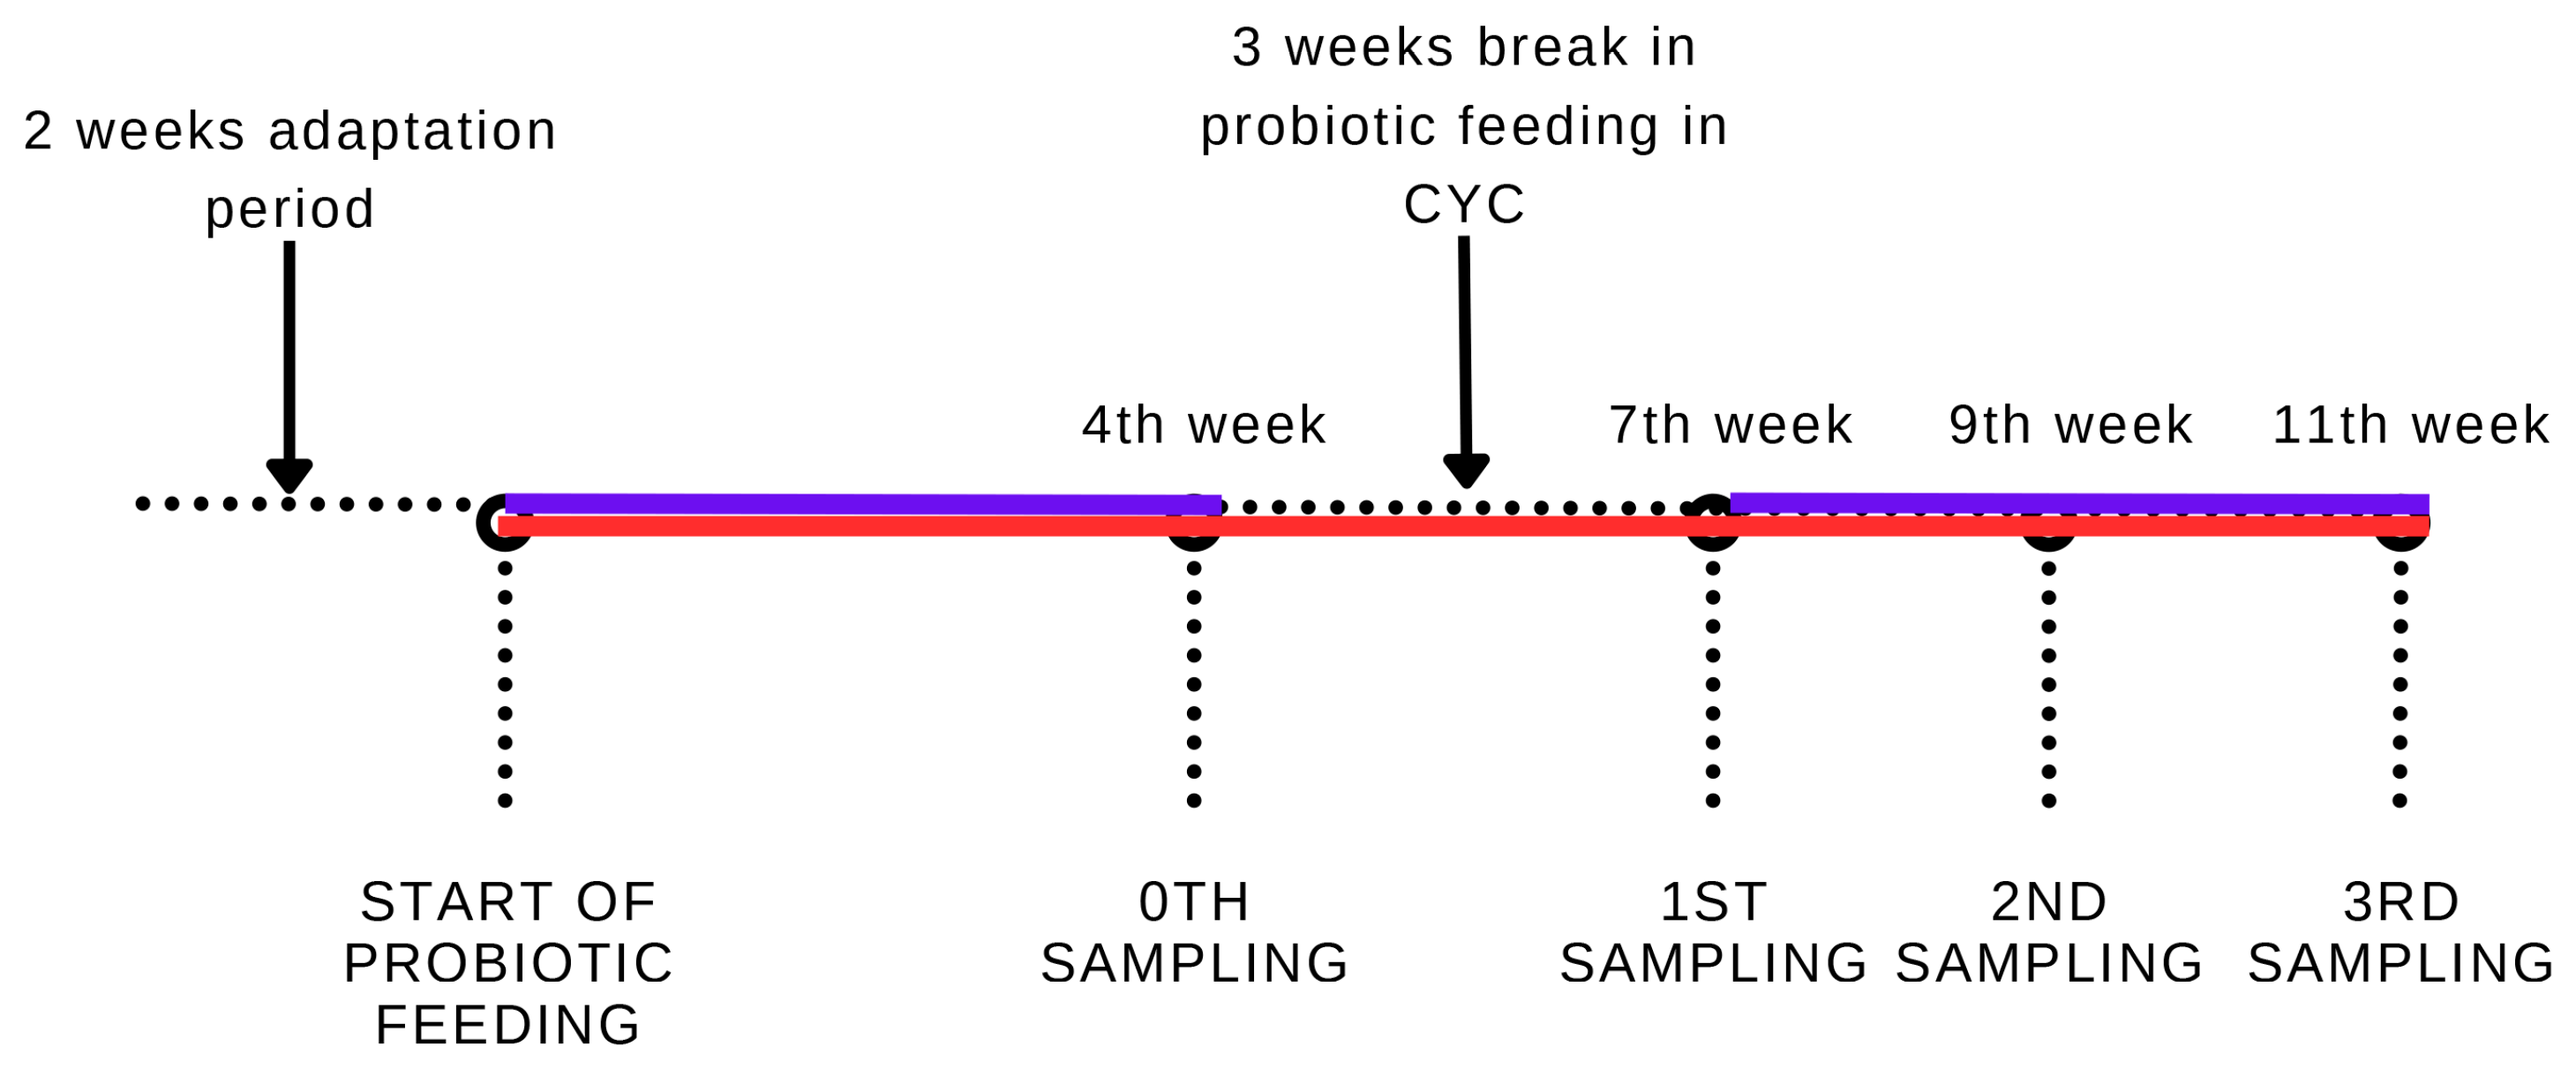
2.2. Experimental Animals and Sampling
Ethical Statement
2.3. Measurement of Relative Gene Expression
2.4. Microbiological Screening
2.5. Histo-Fluorescent In Situ Hybridization Analysis of L. plantarum in the Trout Intestines
2.6. Morphometry of Intestine
2.7. Statistical Analysis
3. Results
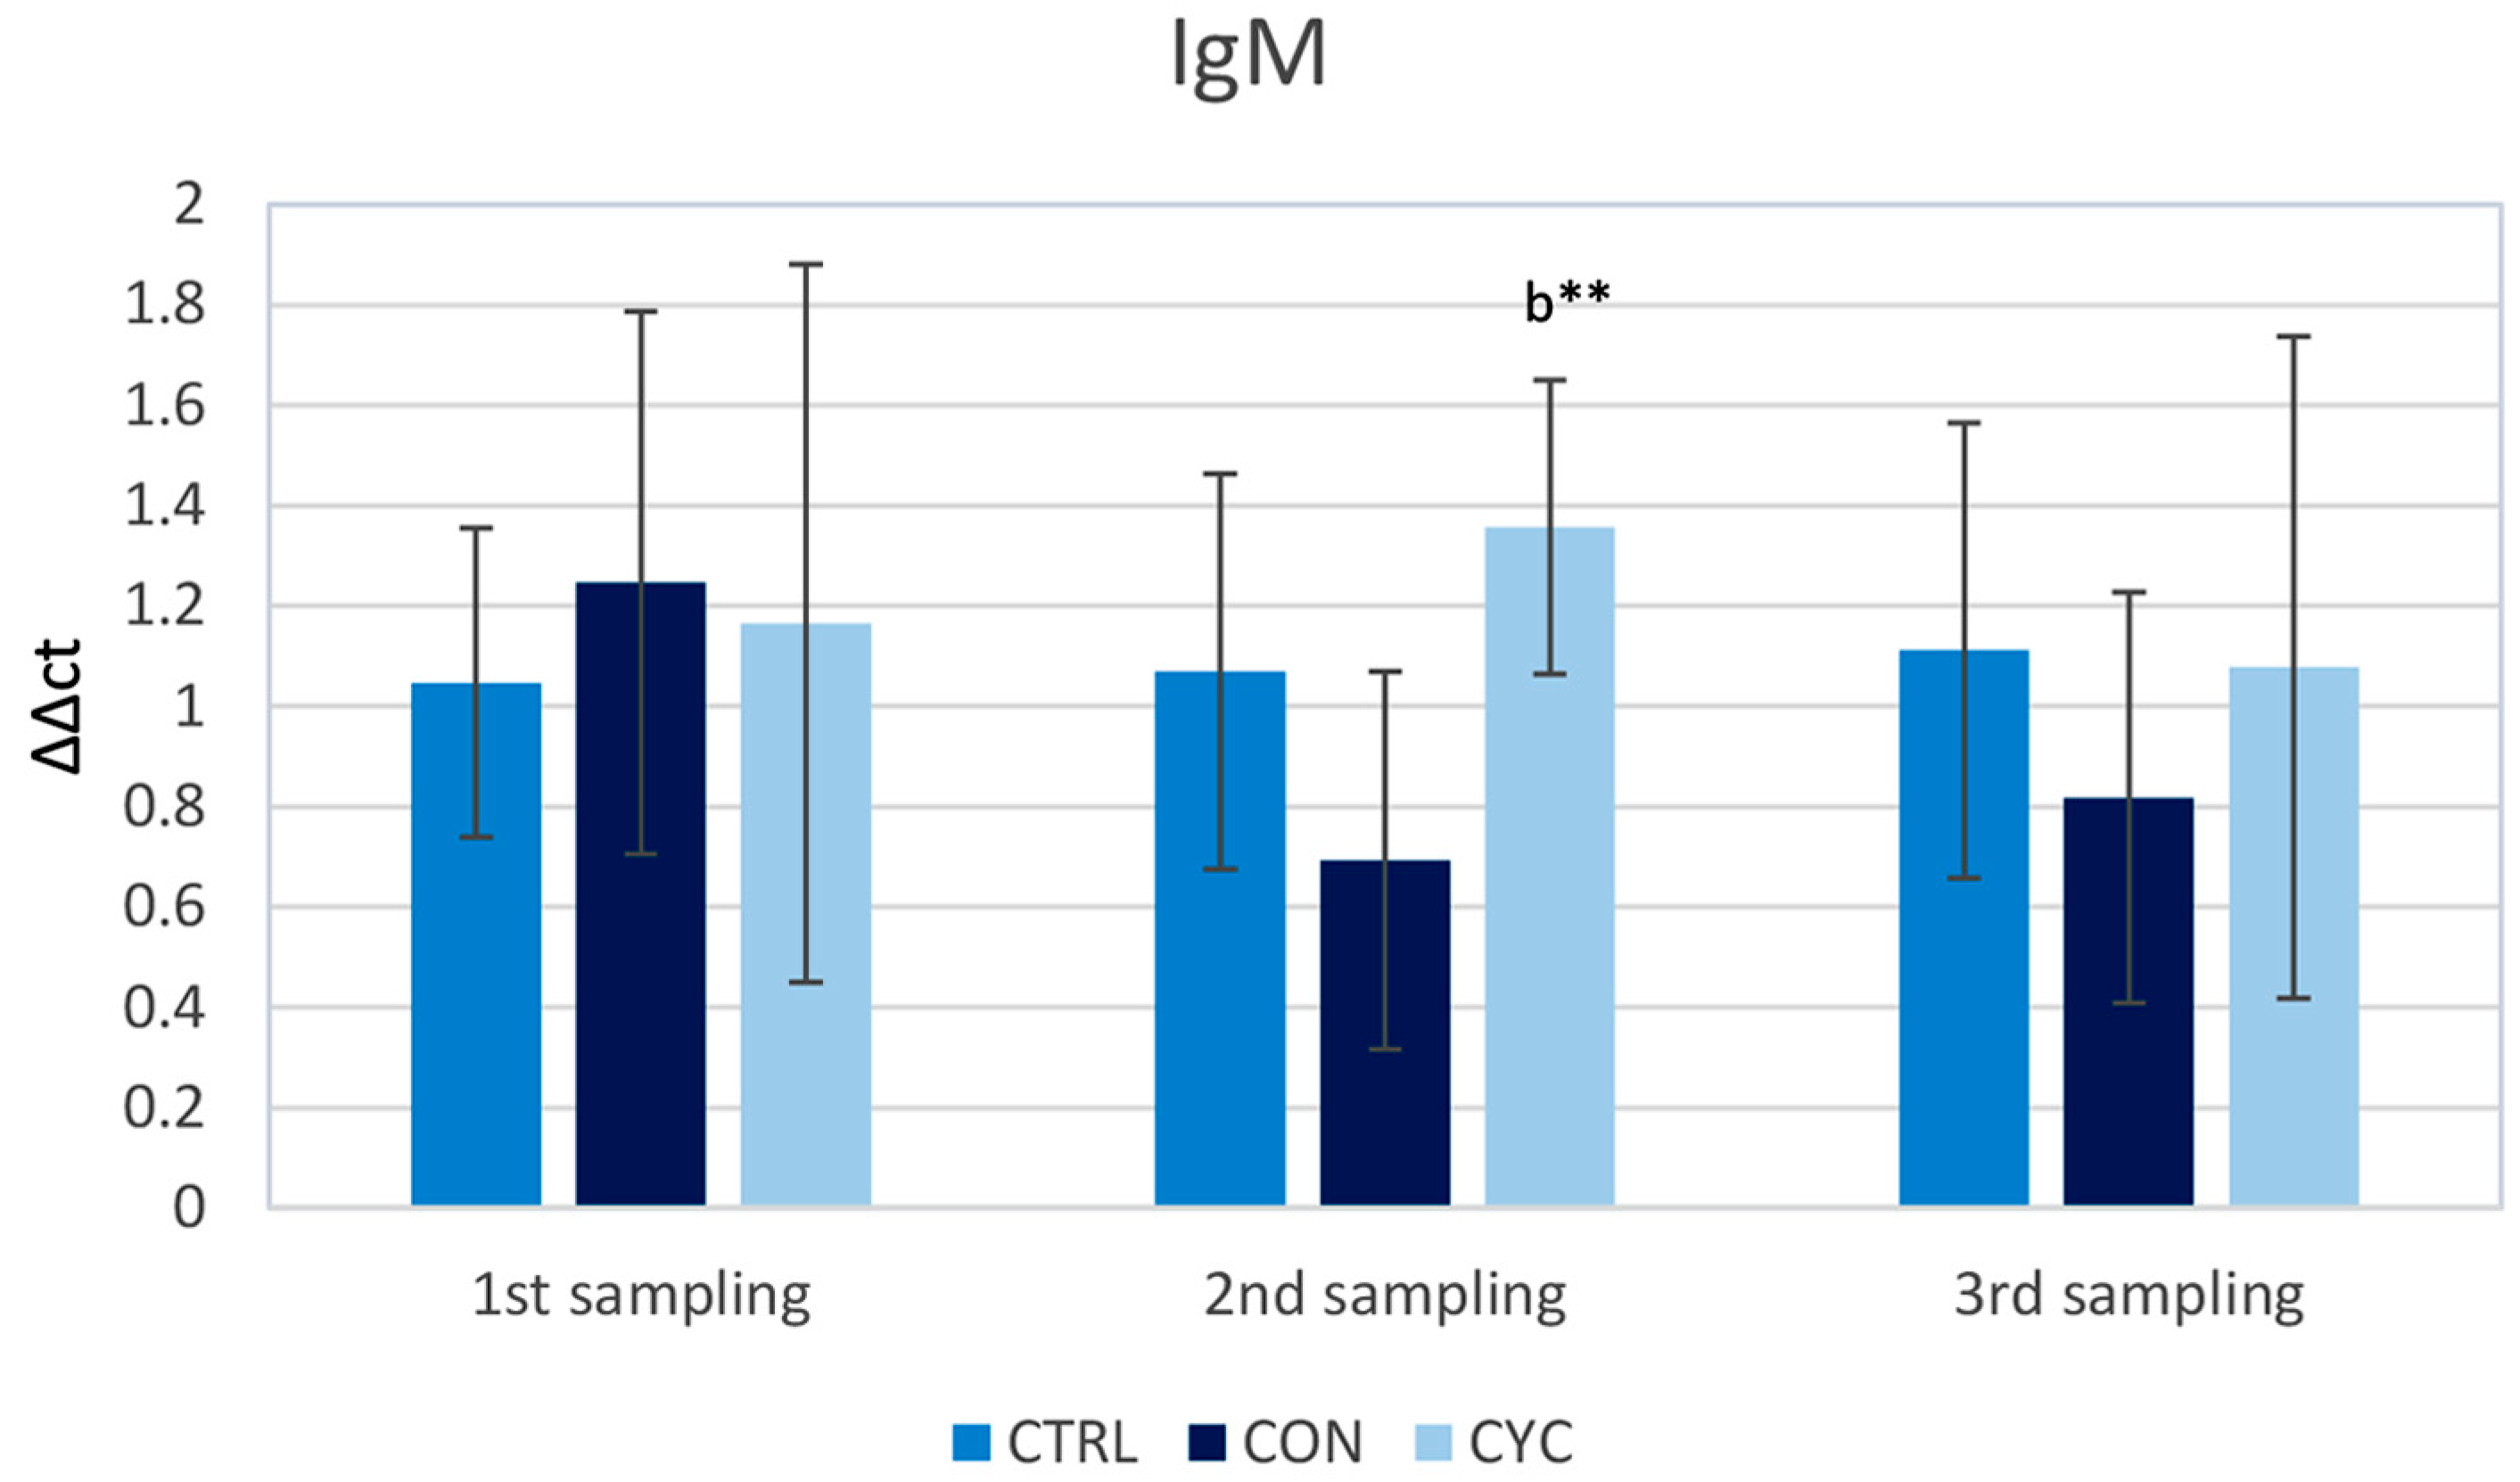
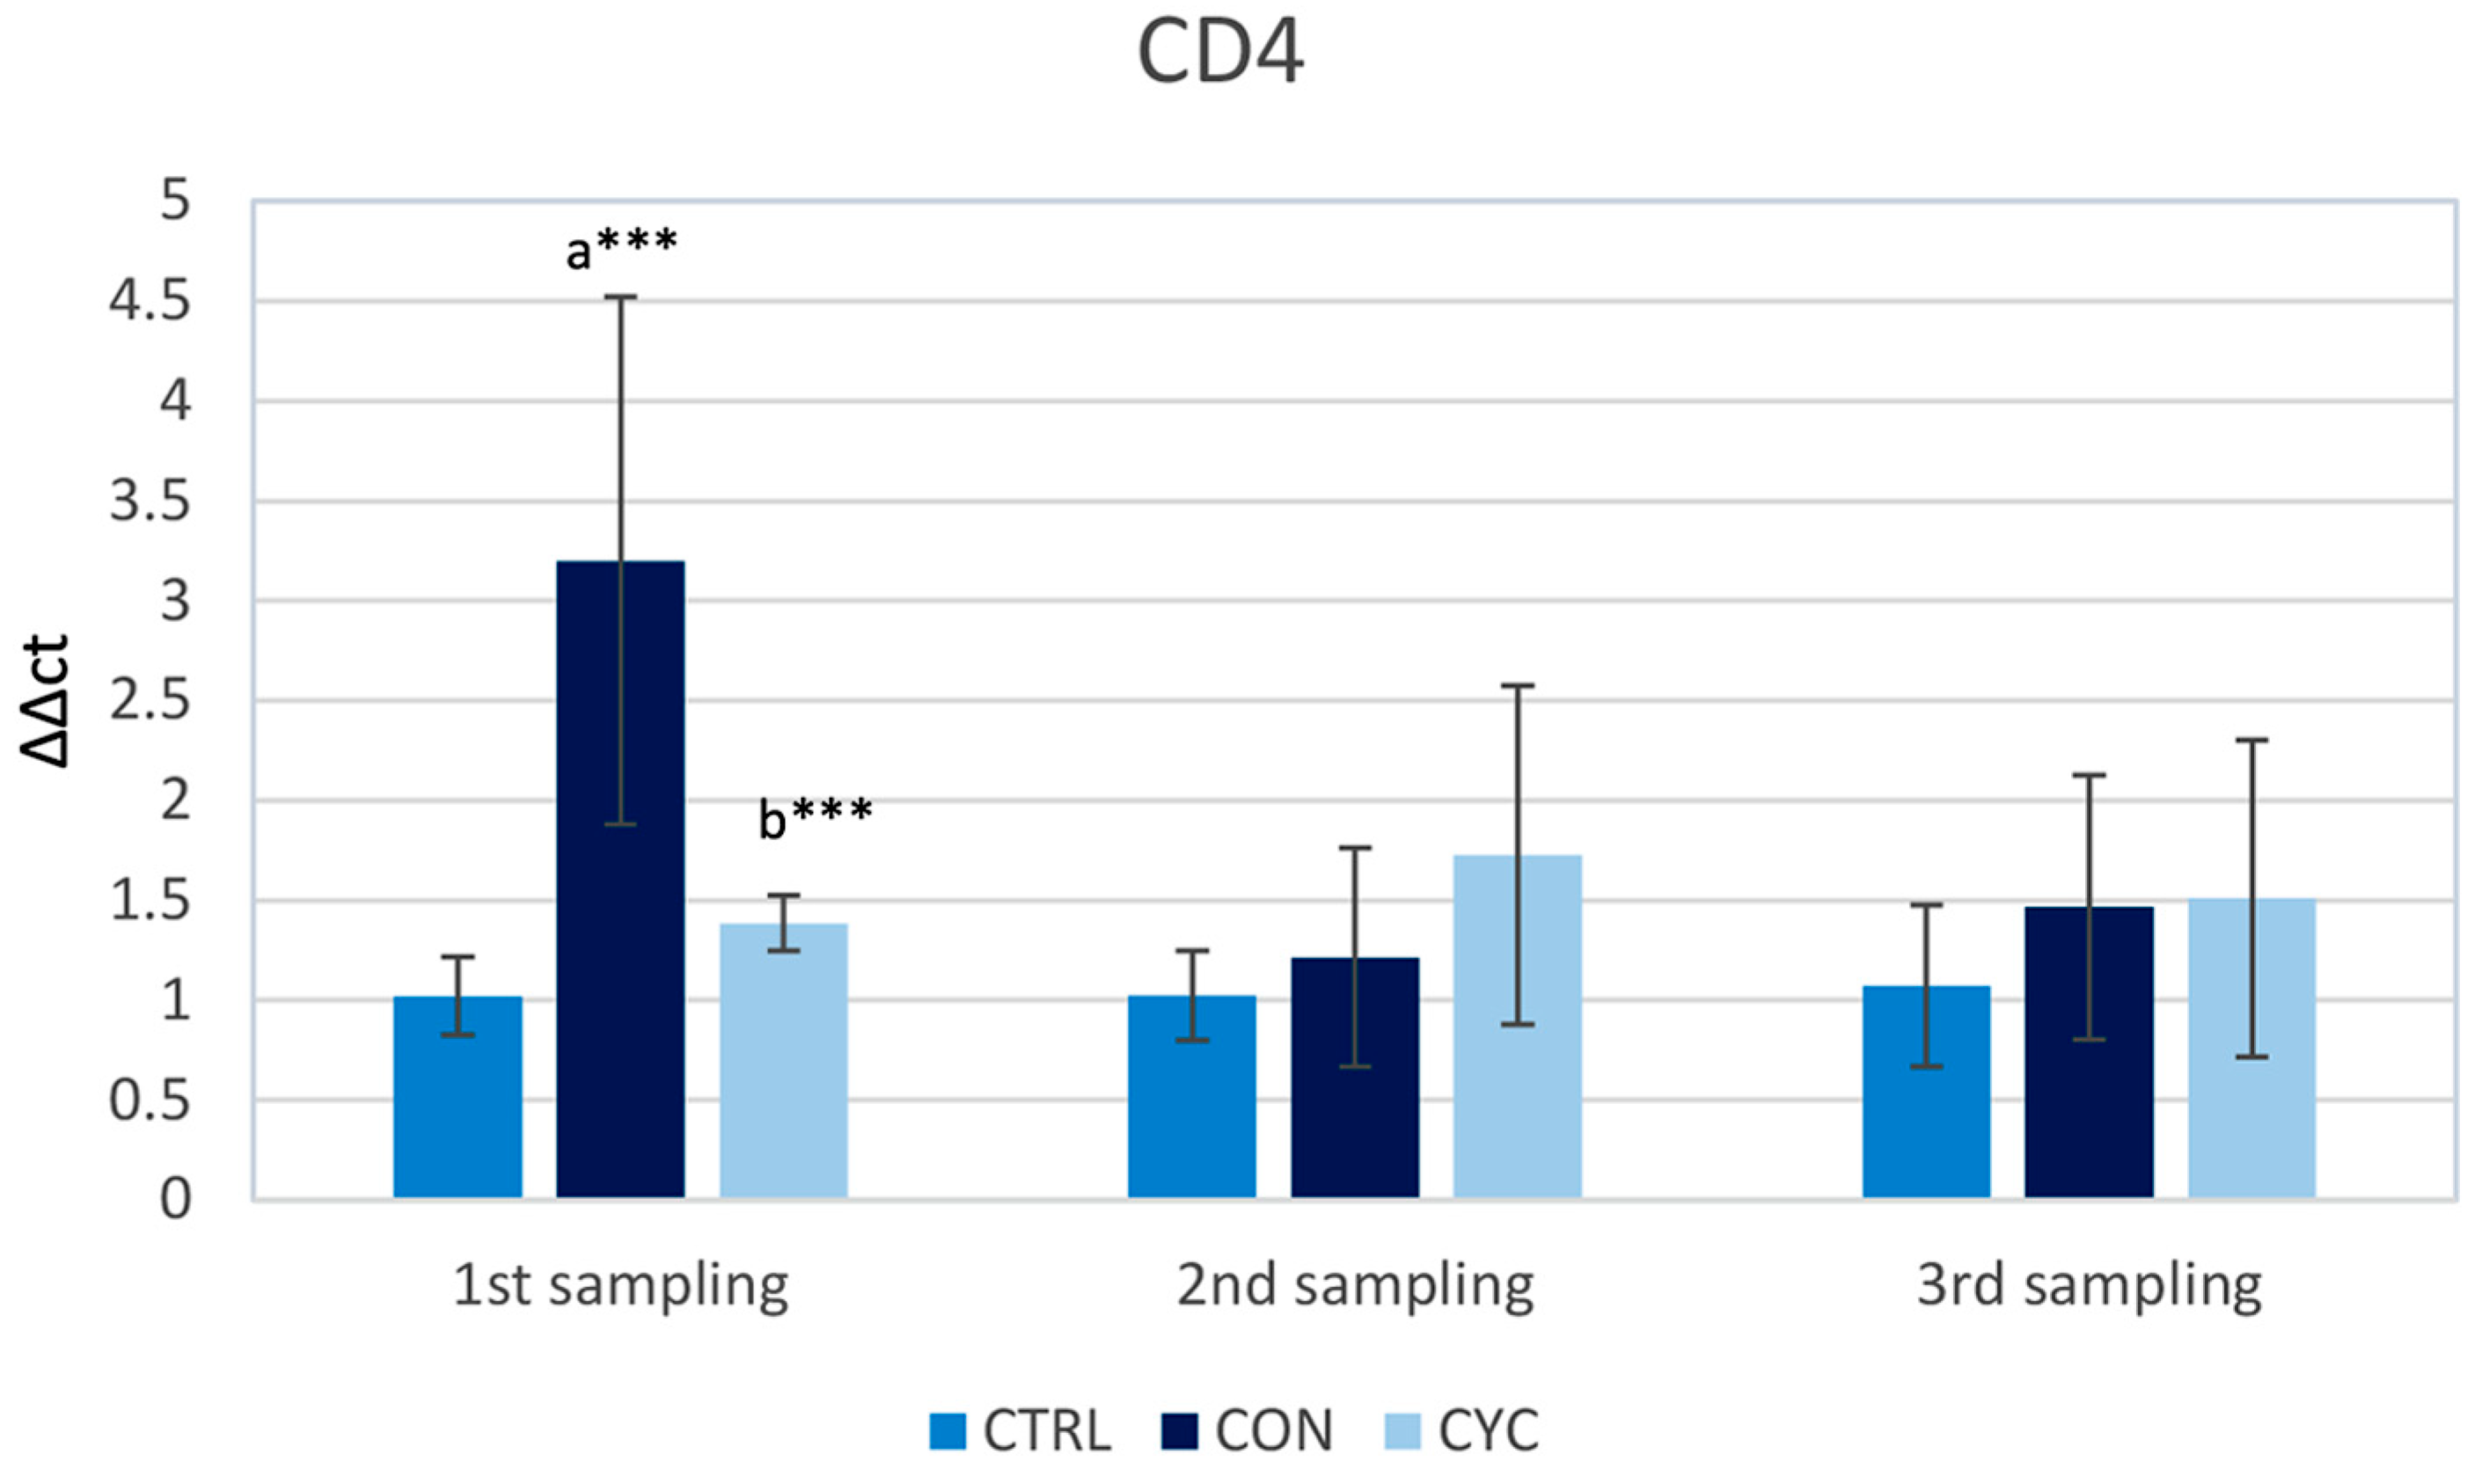
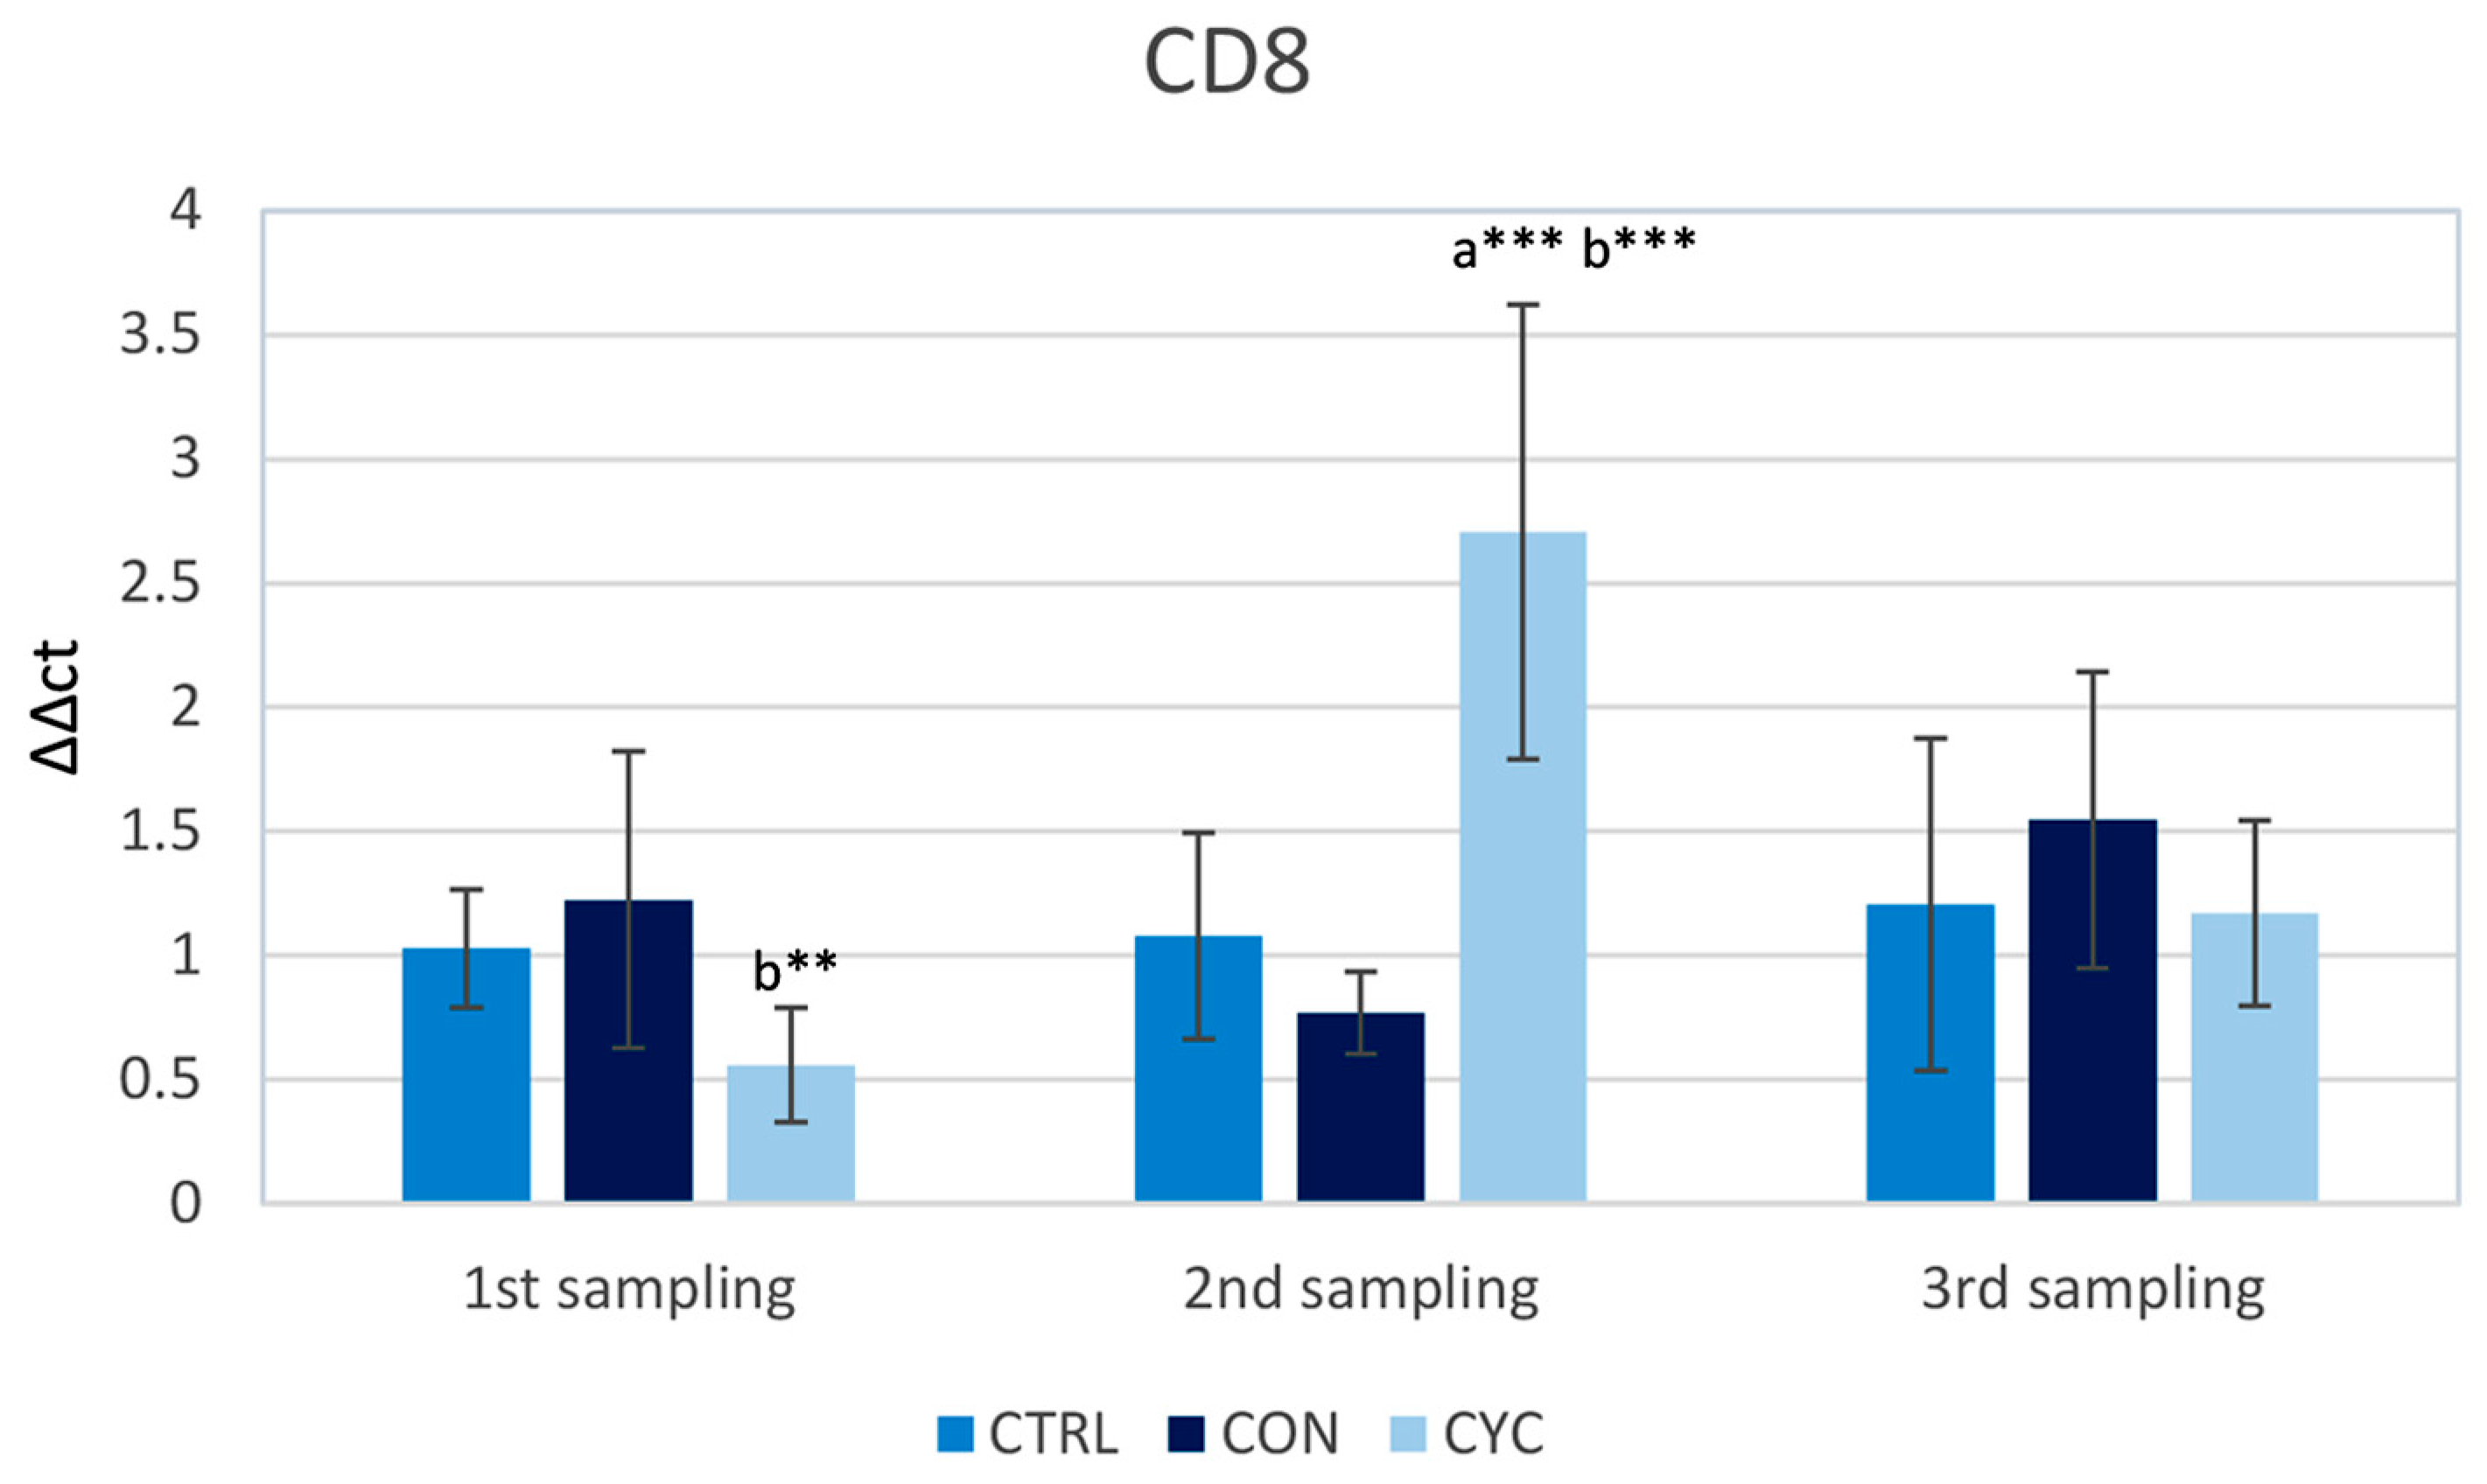
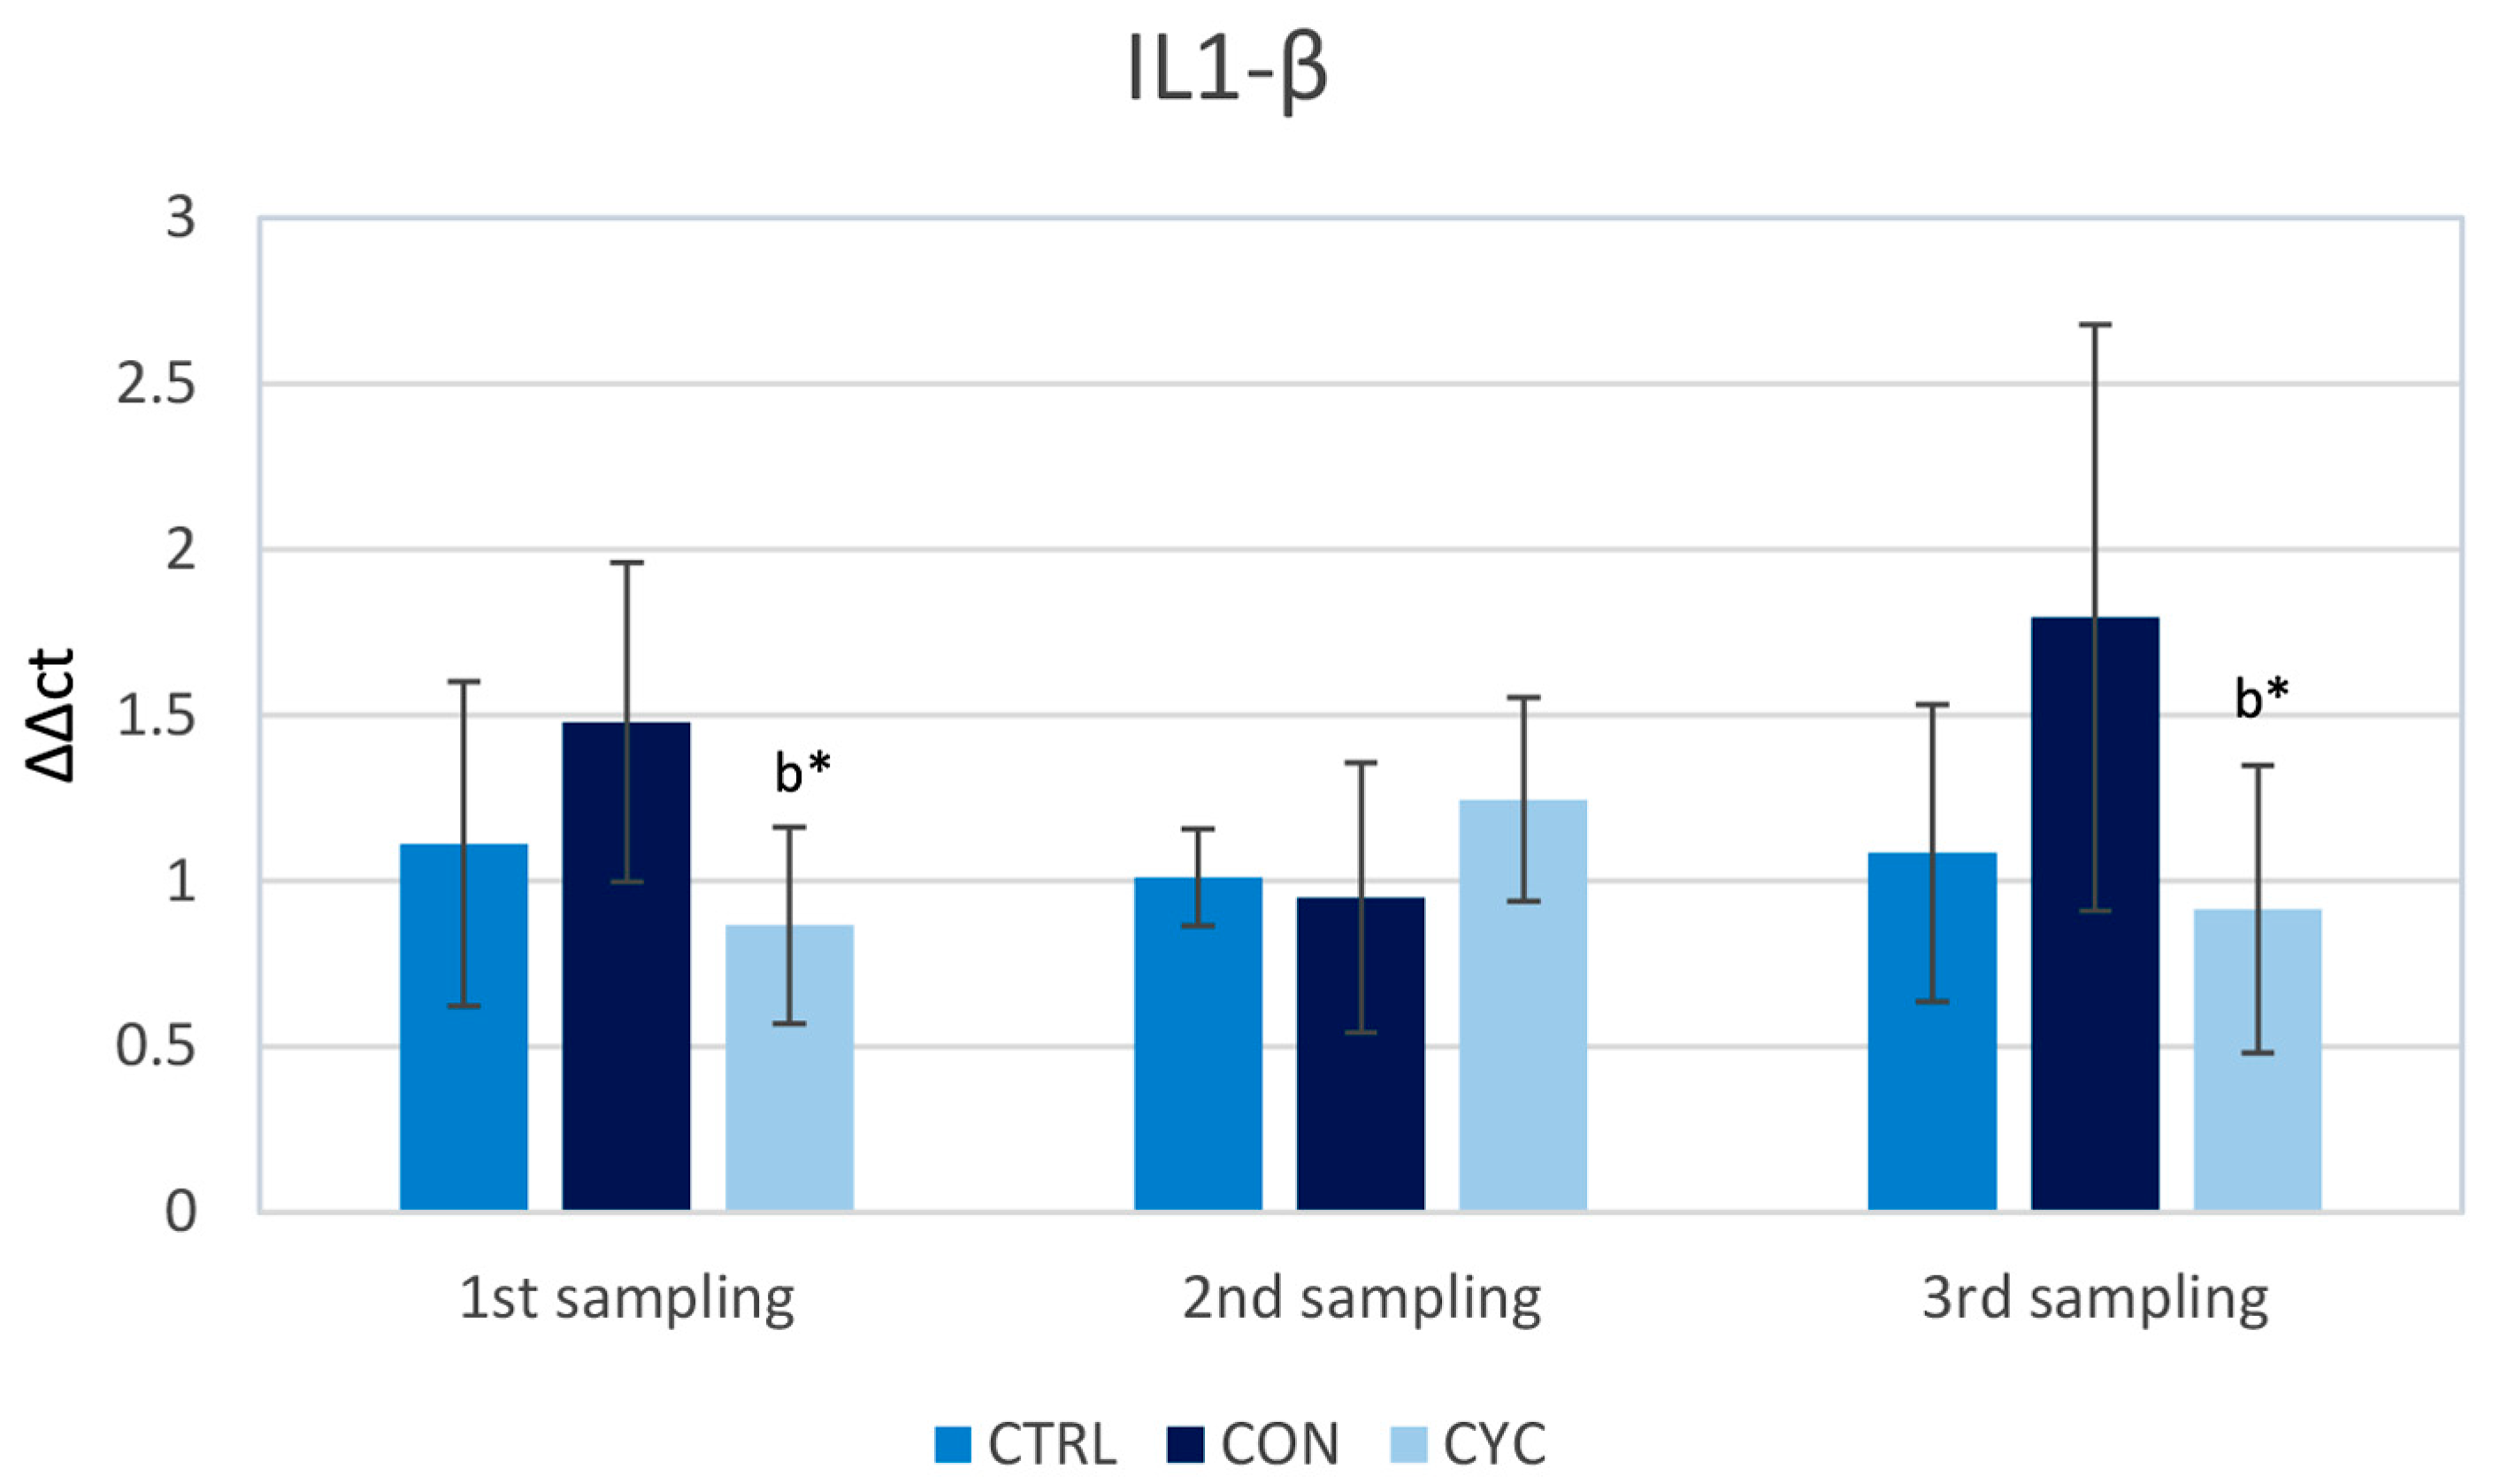
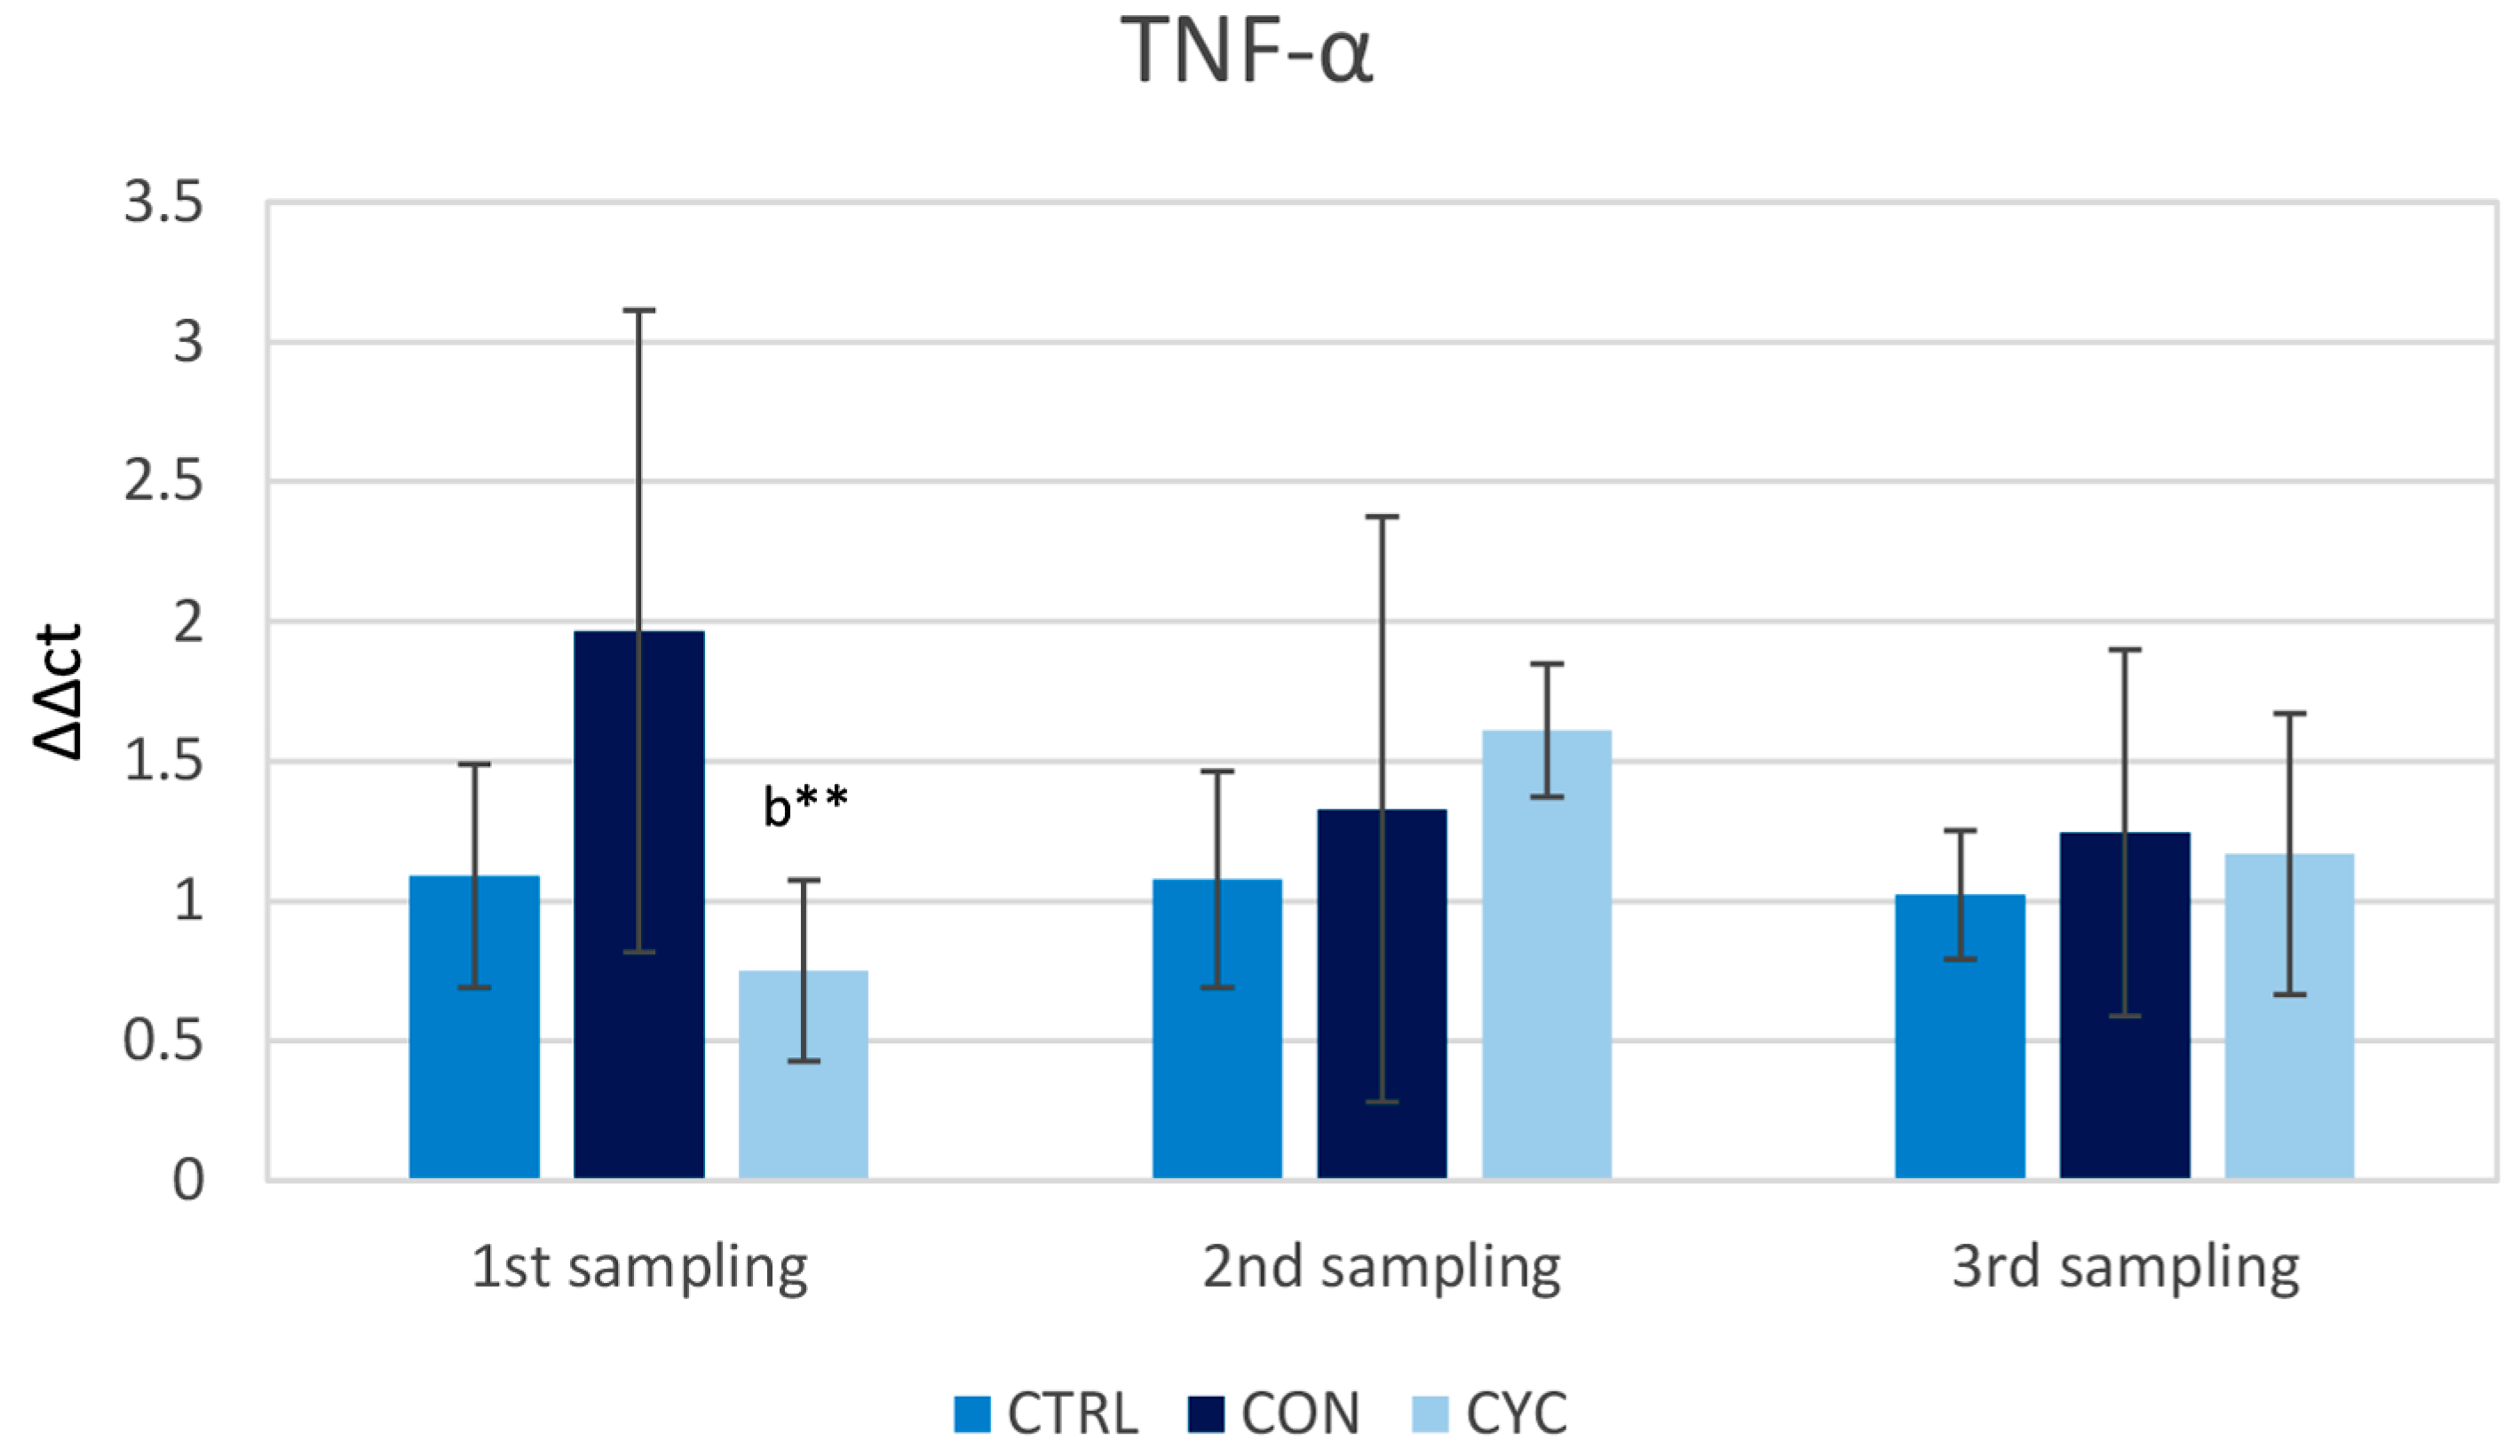
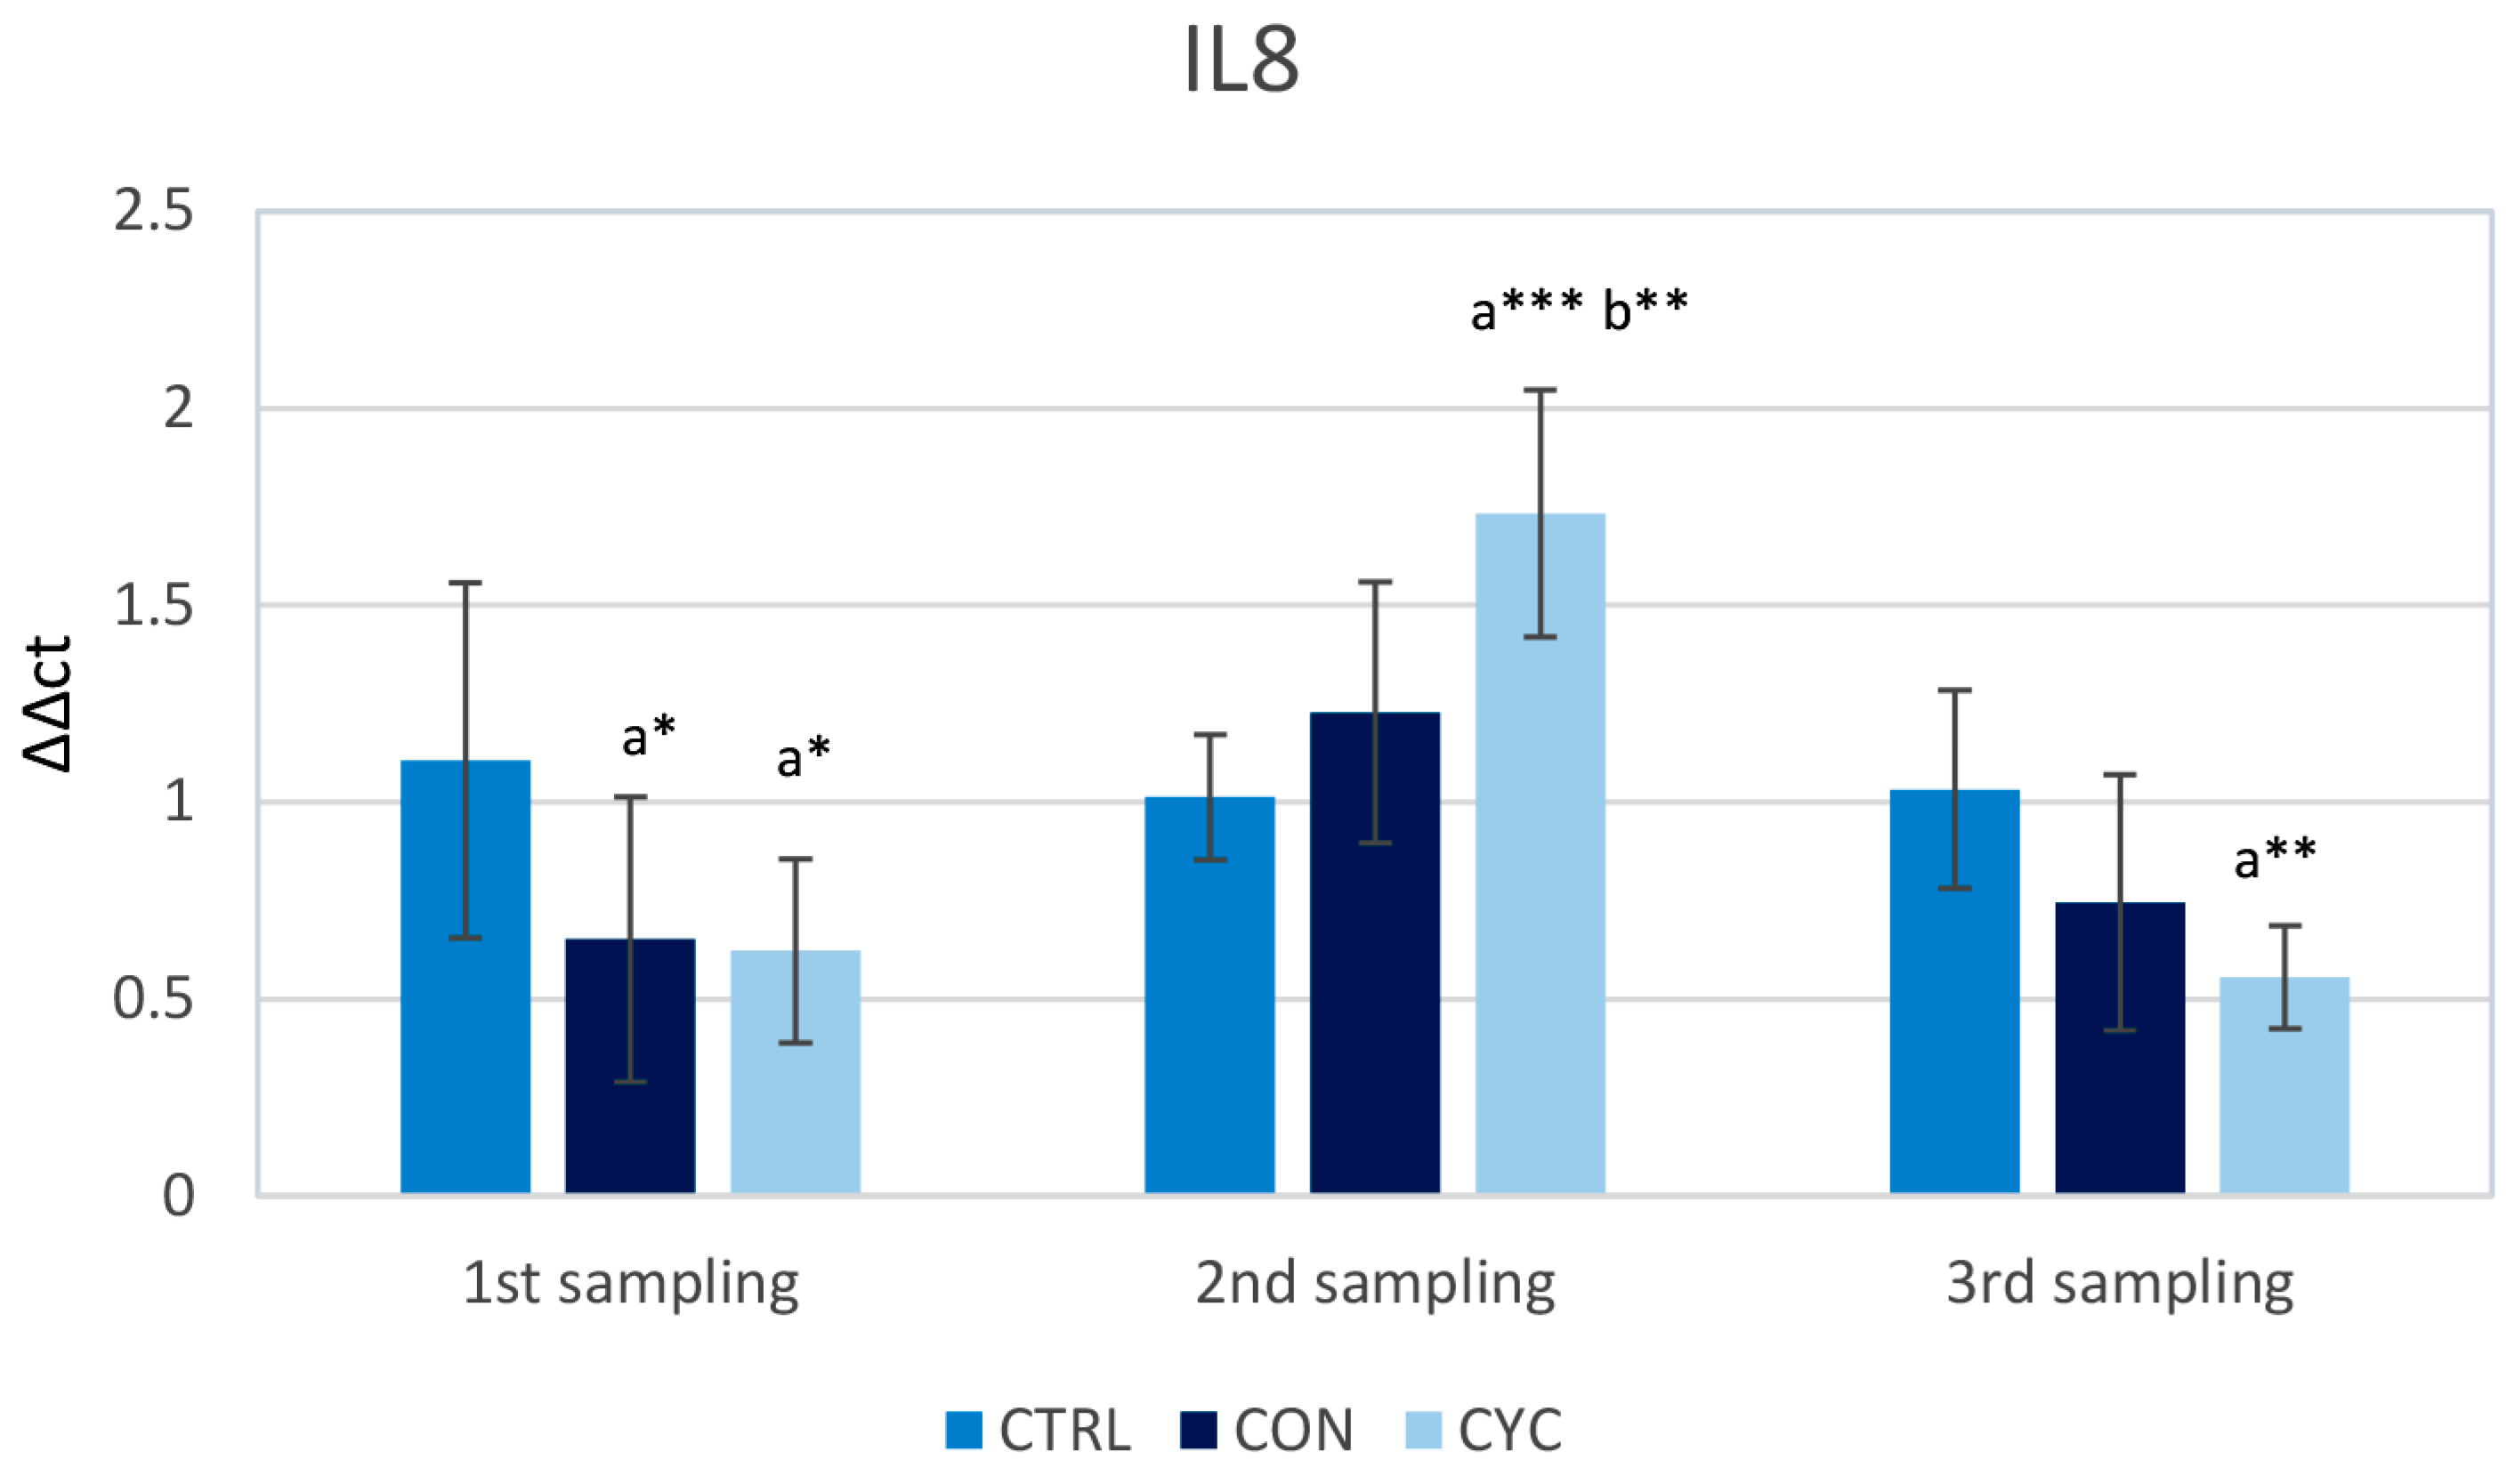
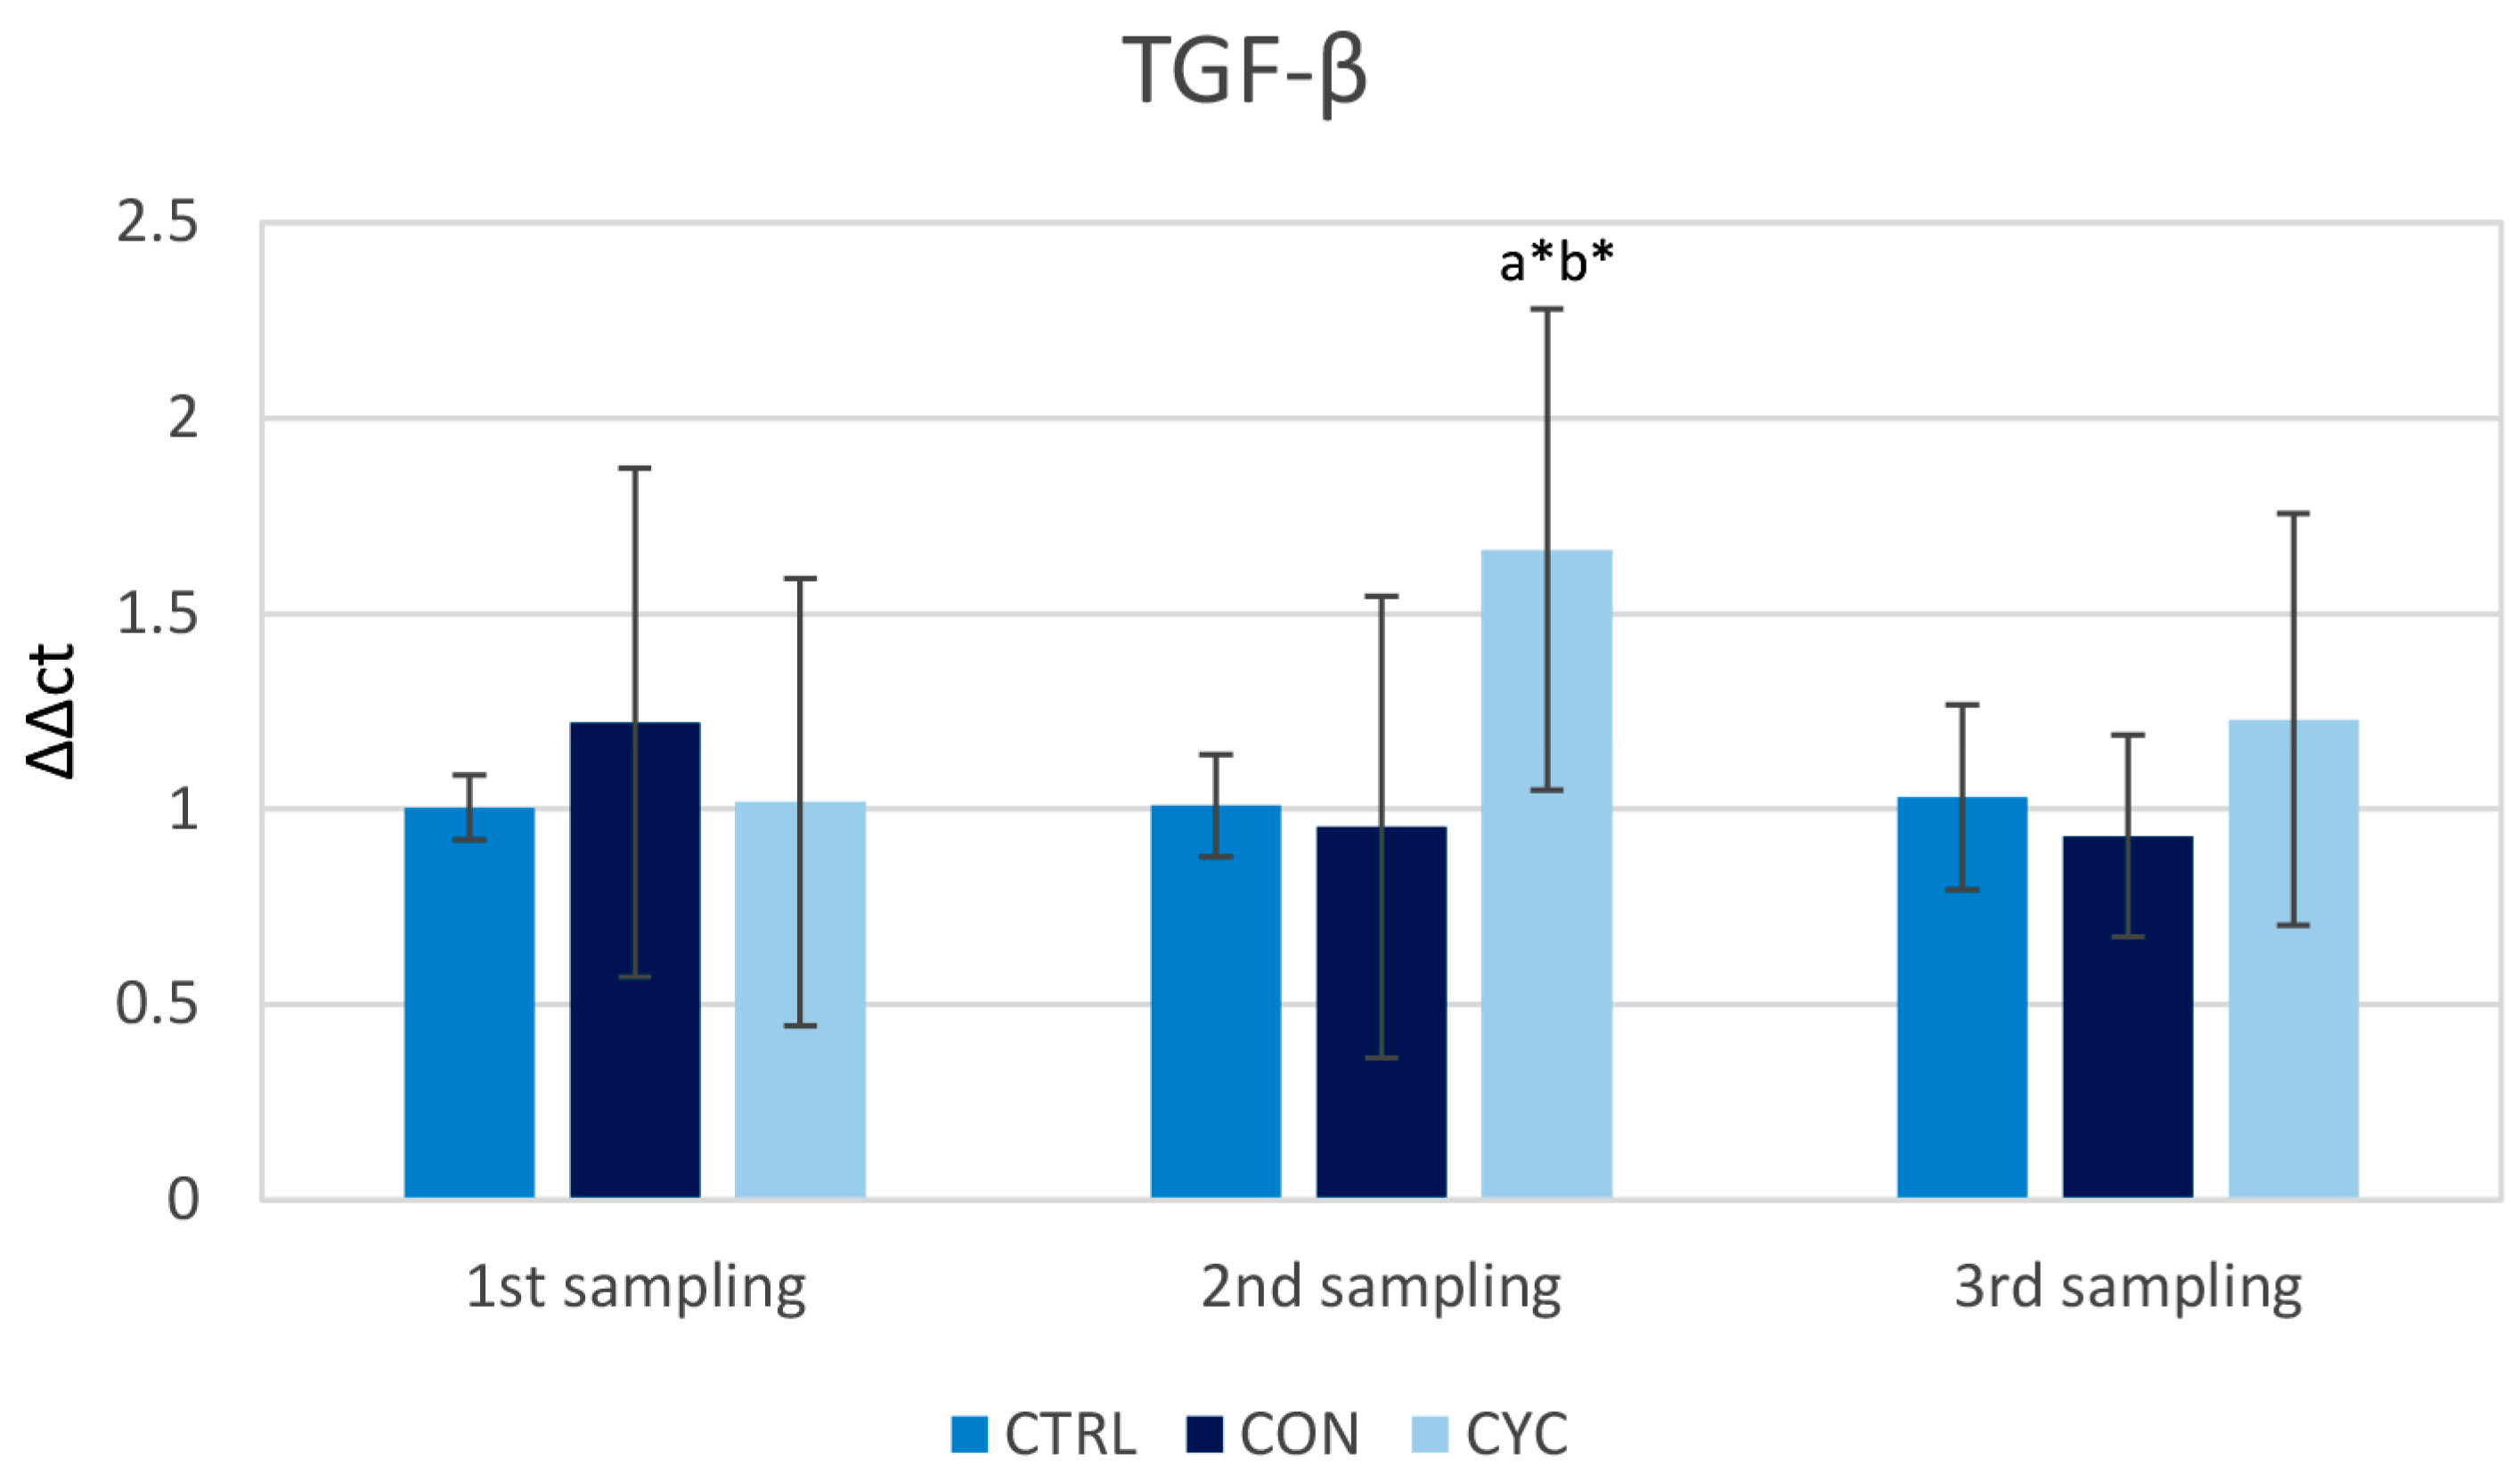
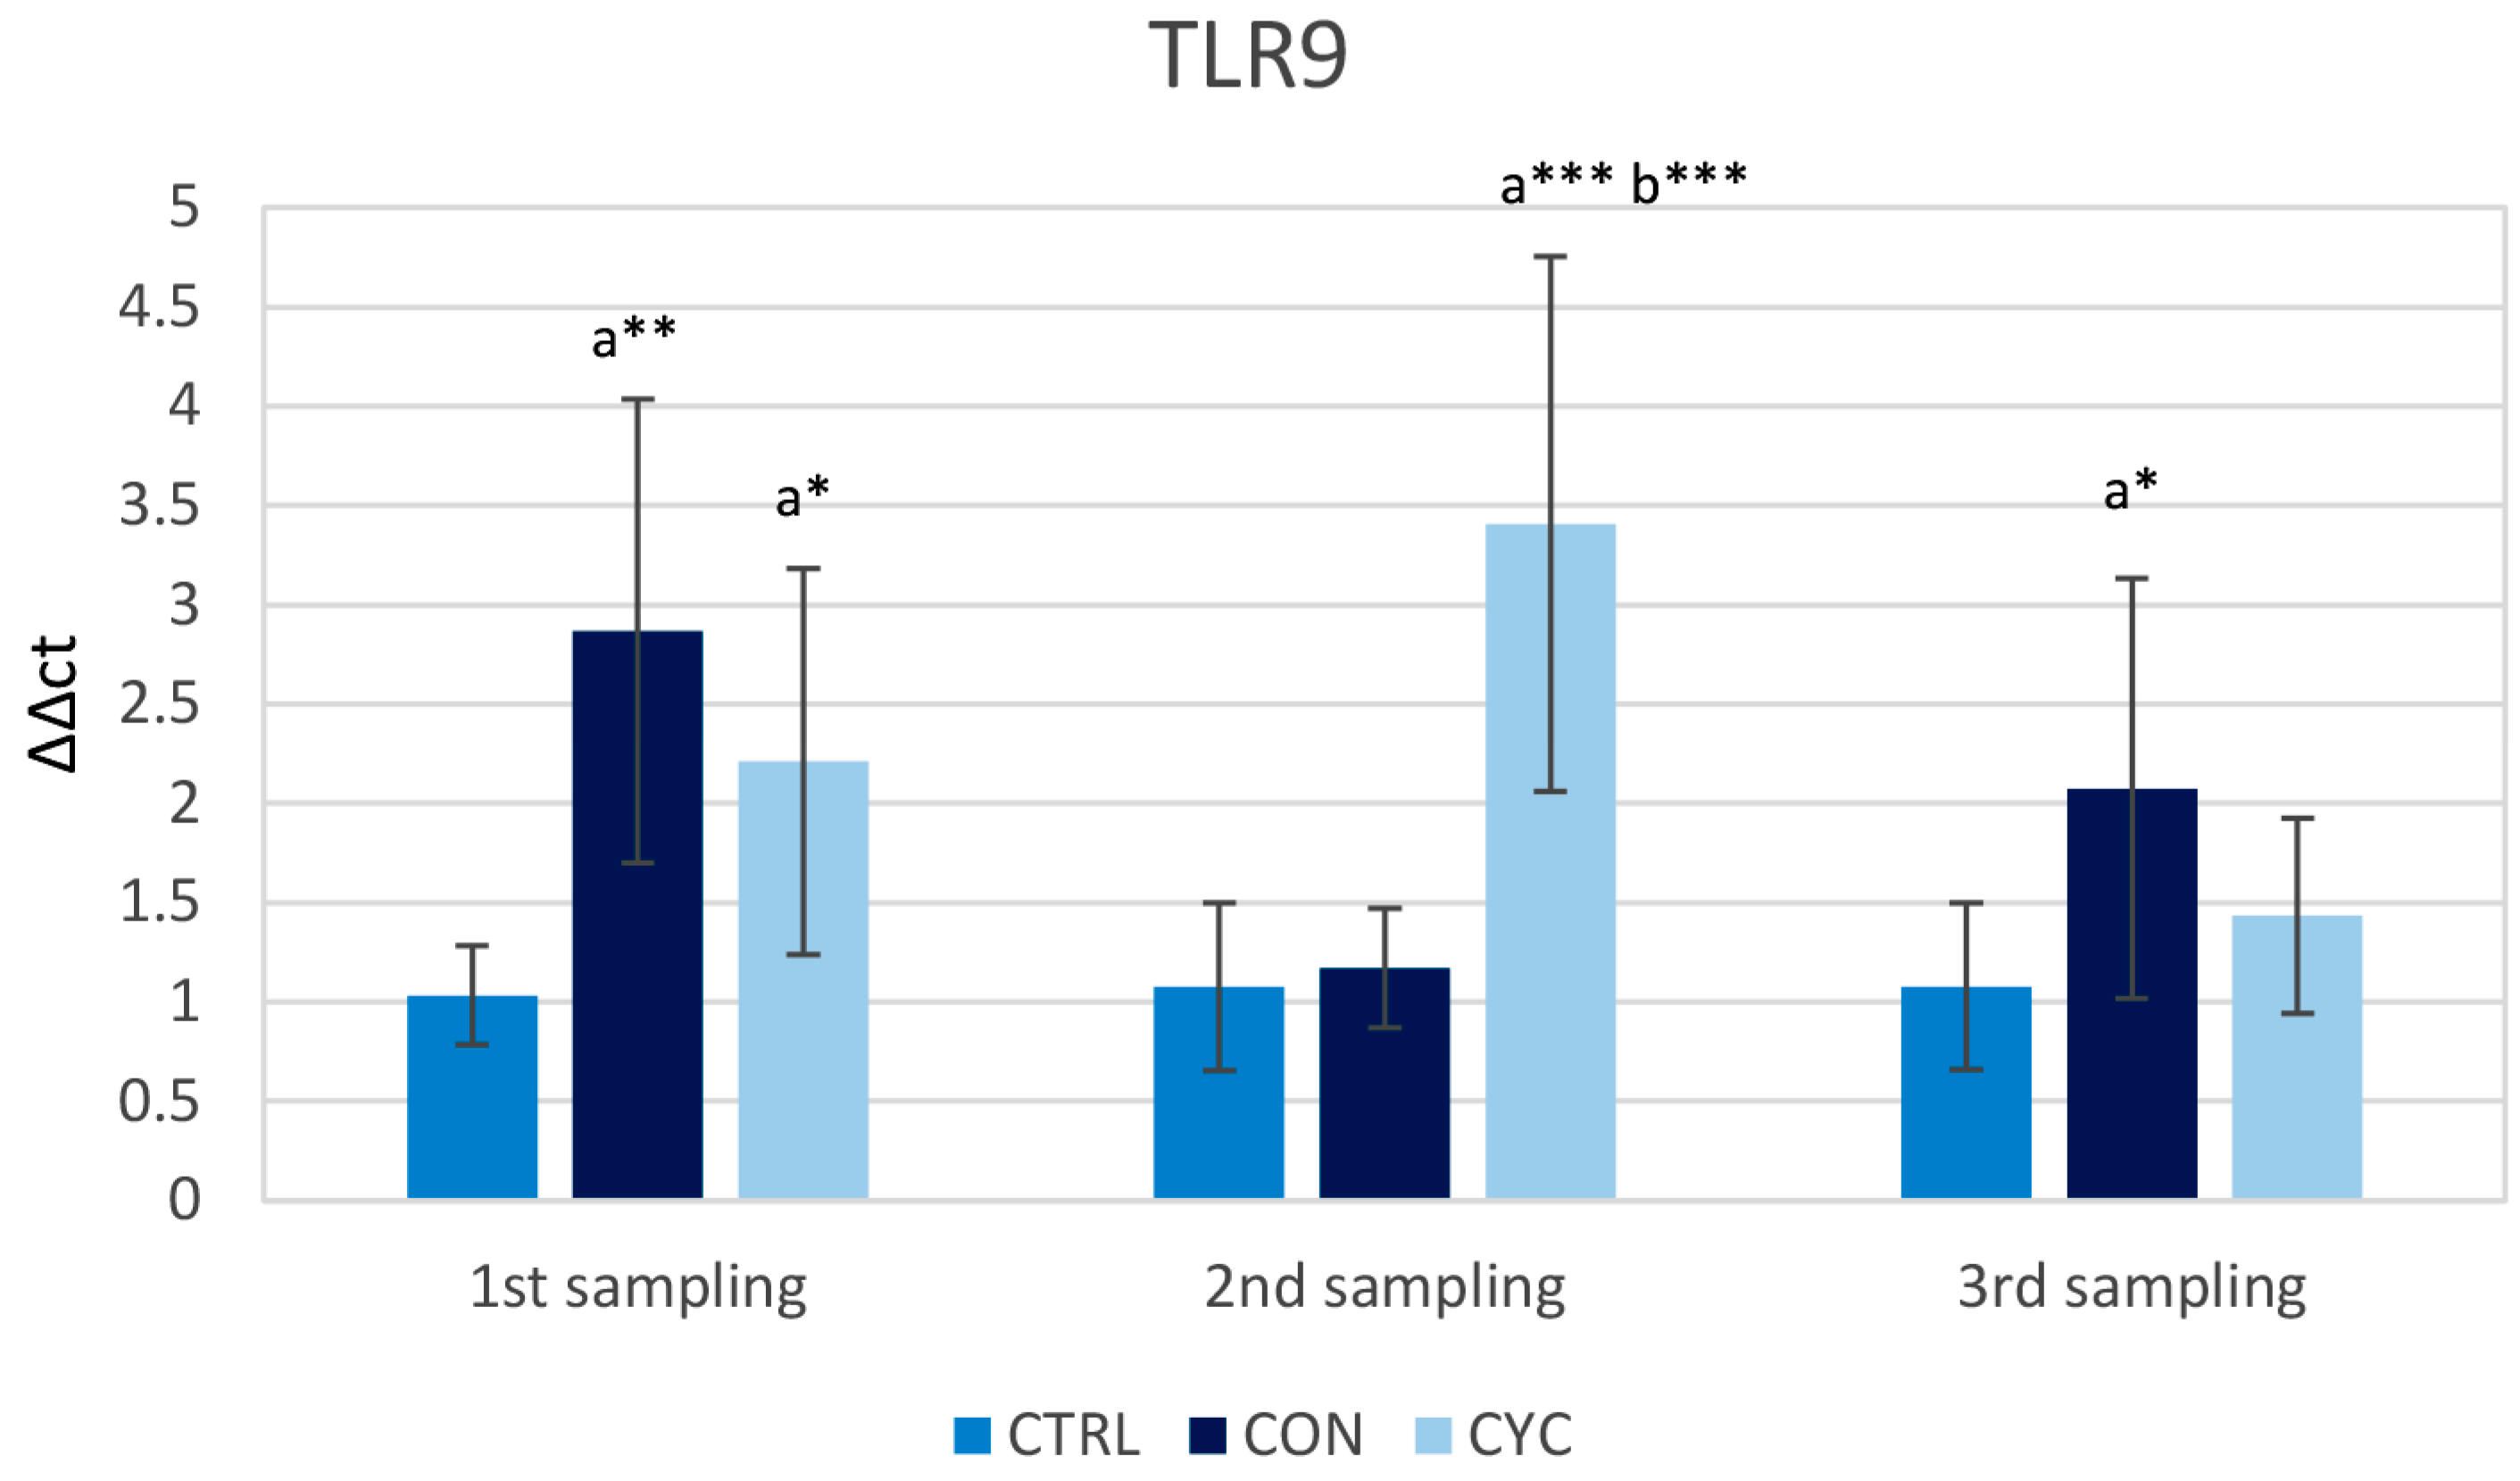
3.1. Intestinal Immune Response
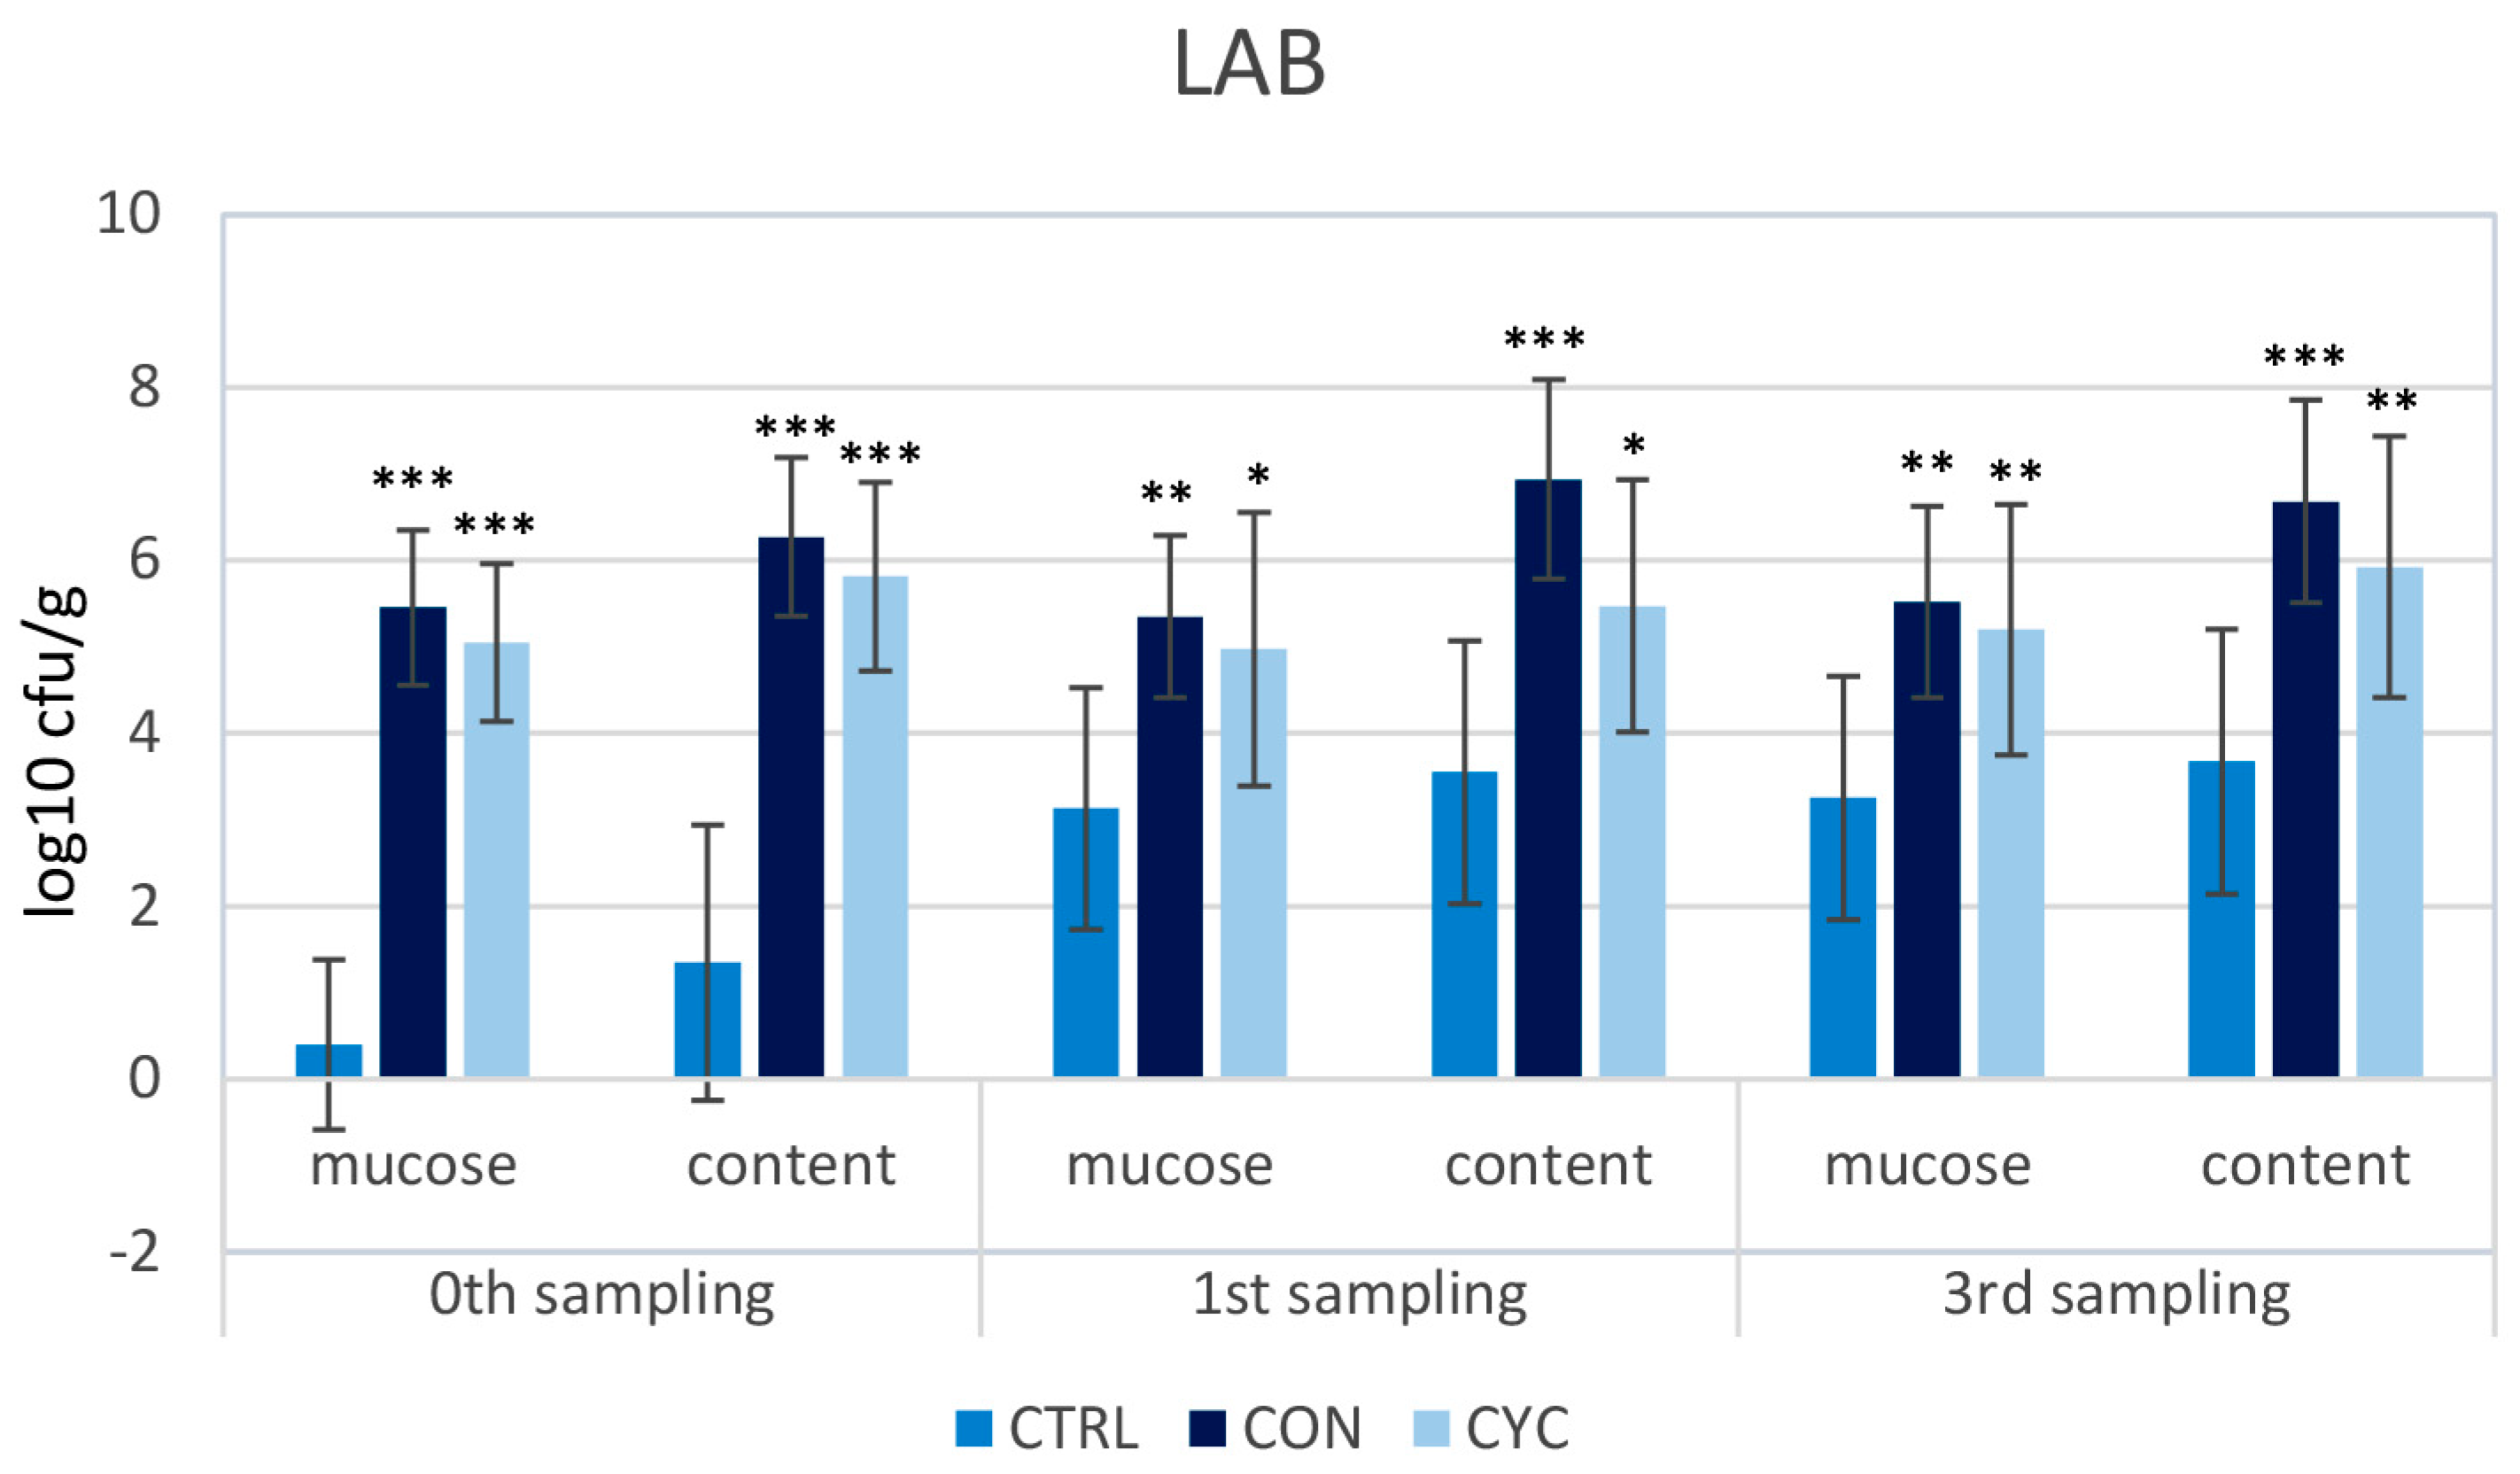
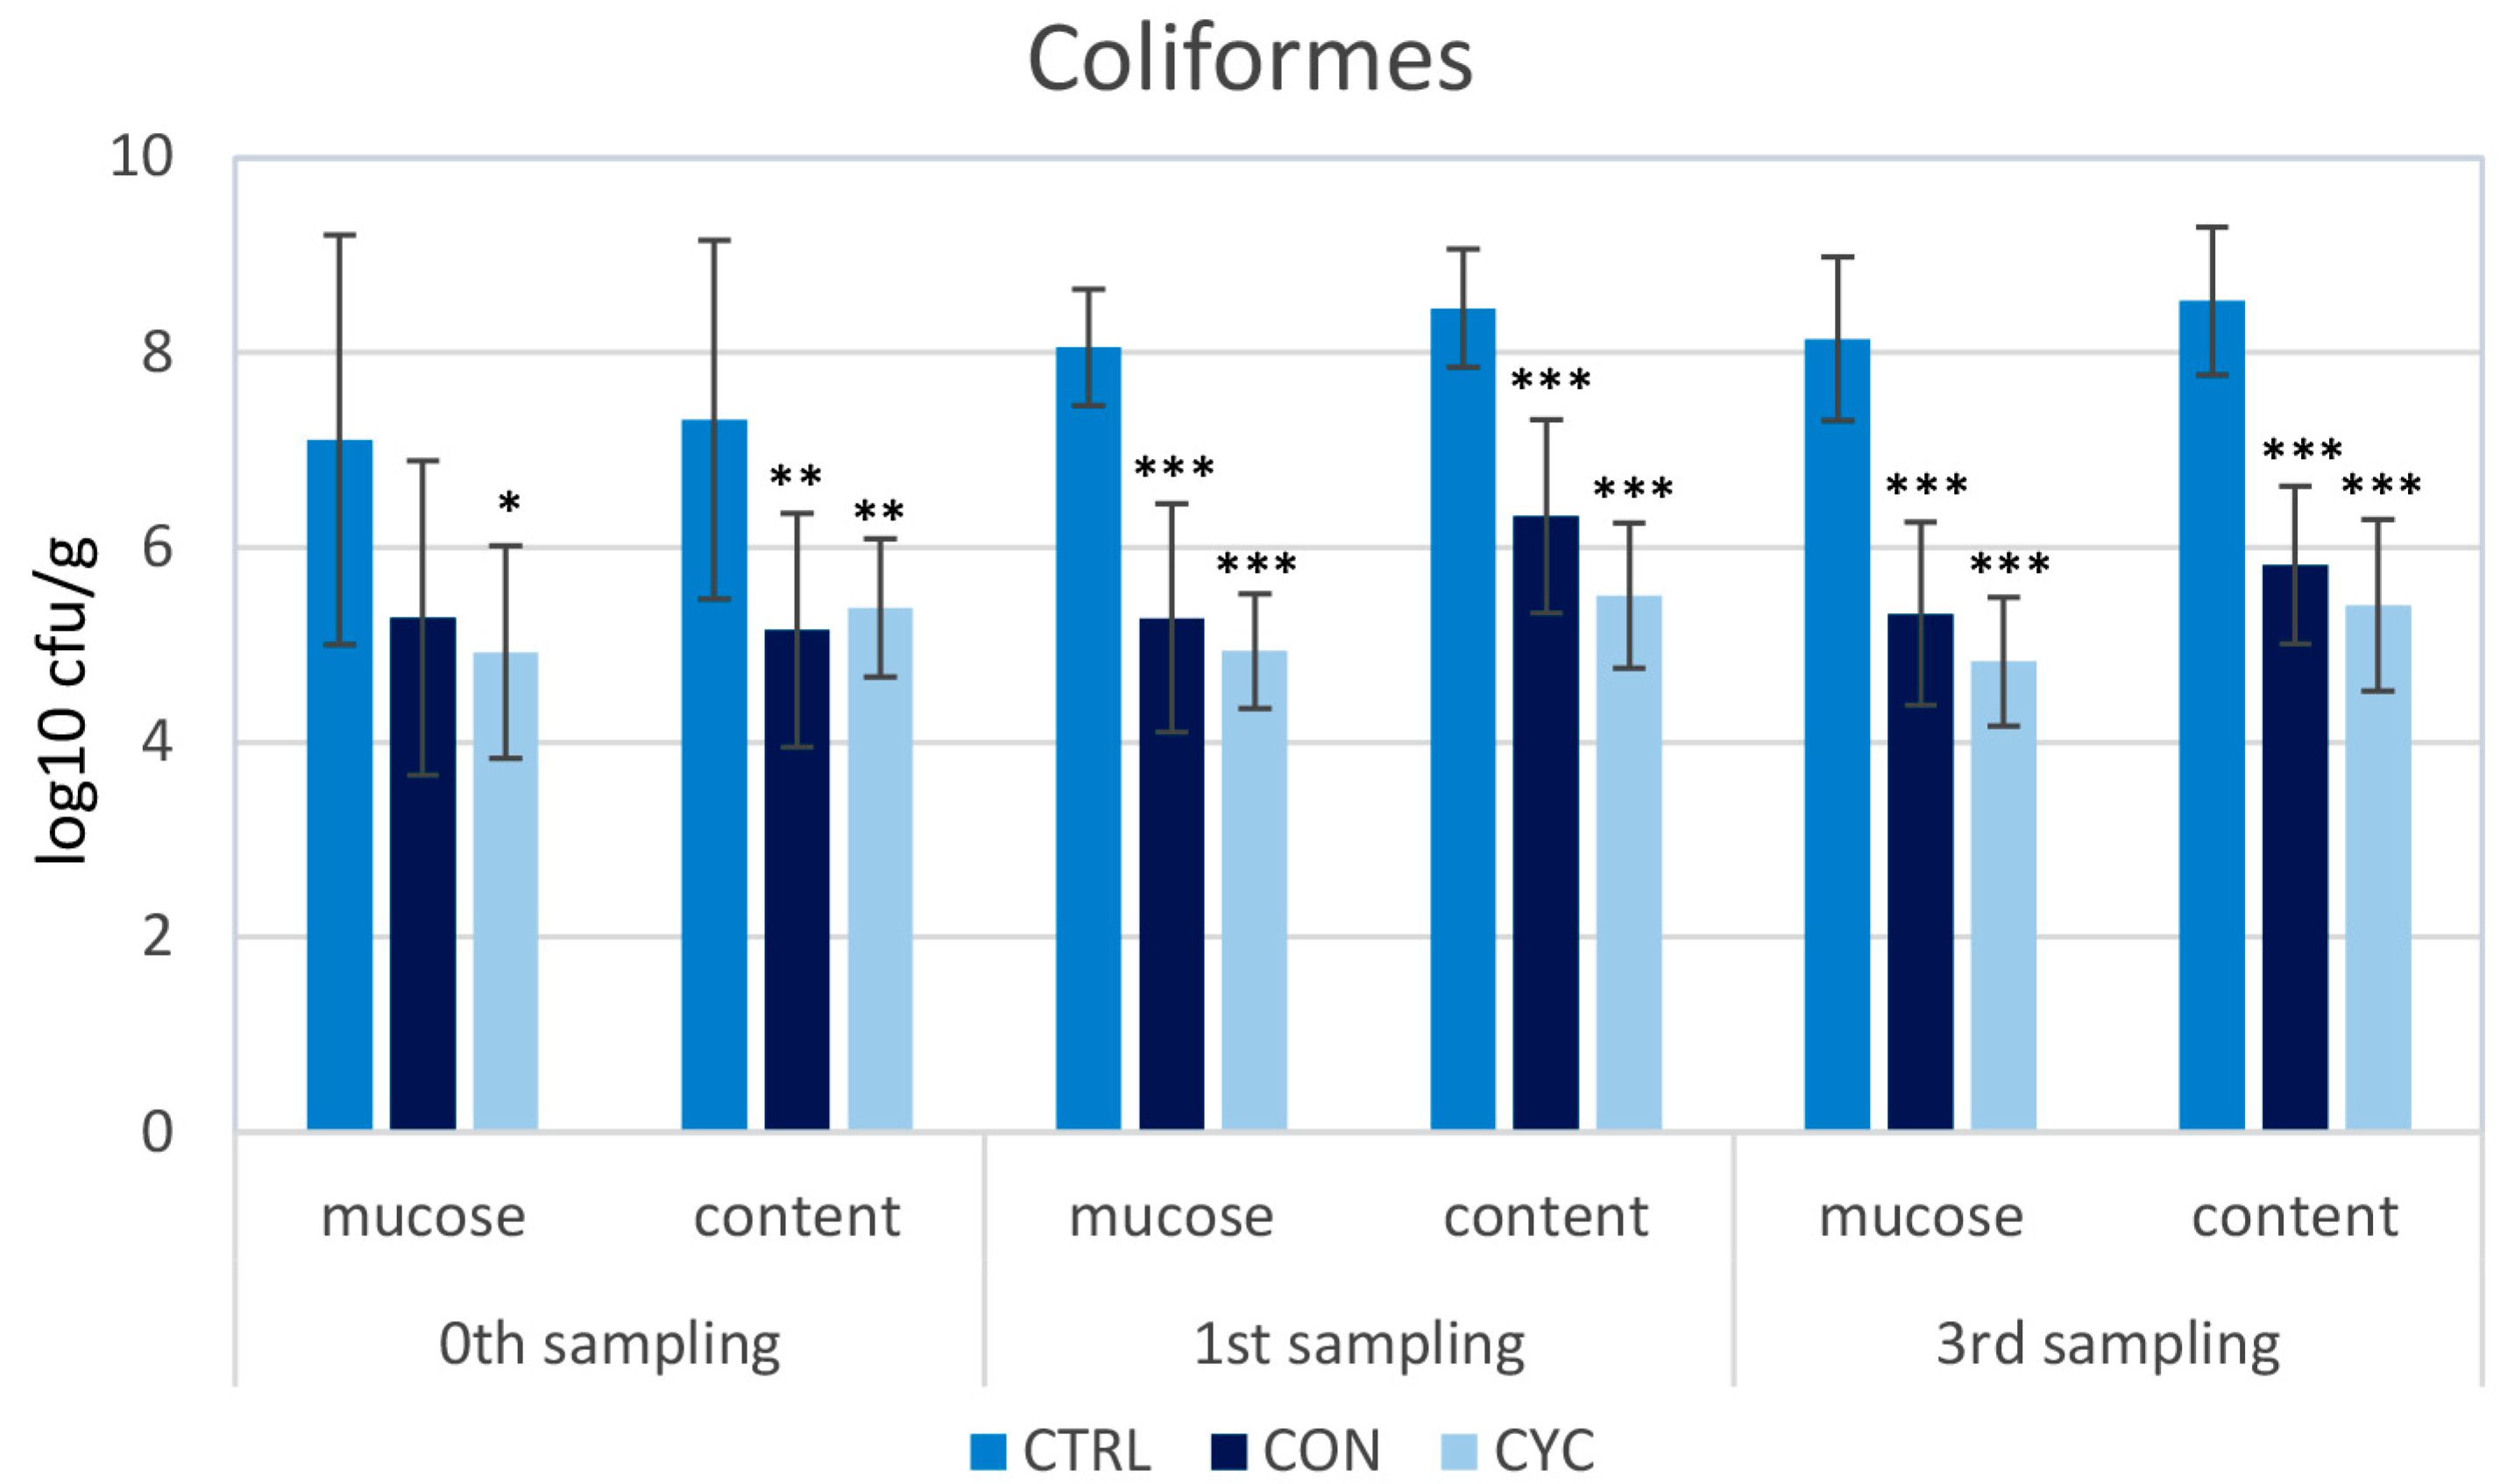
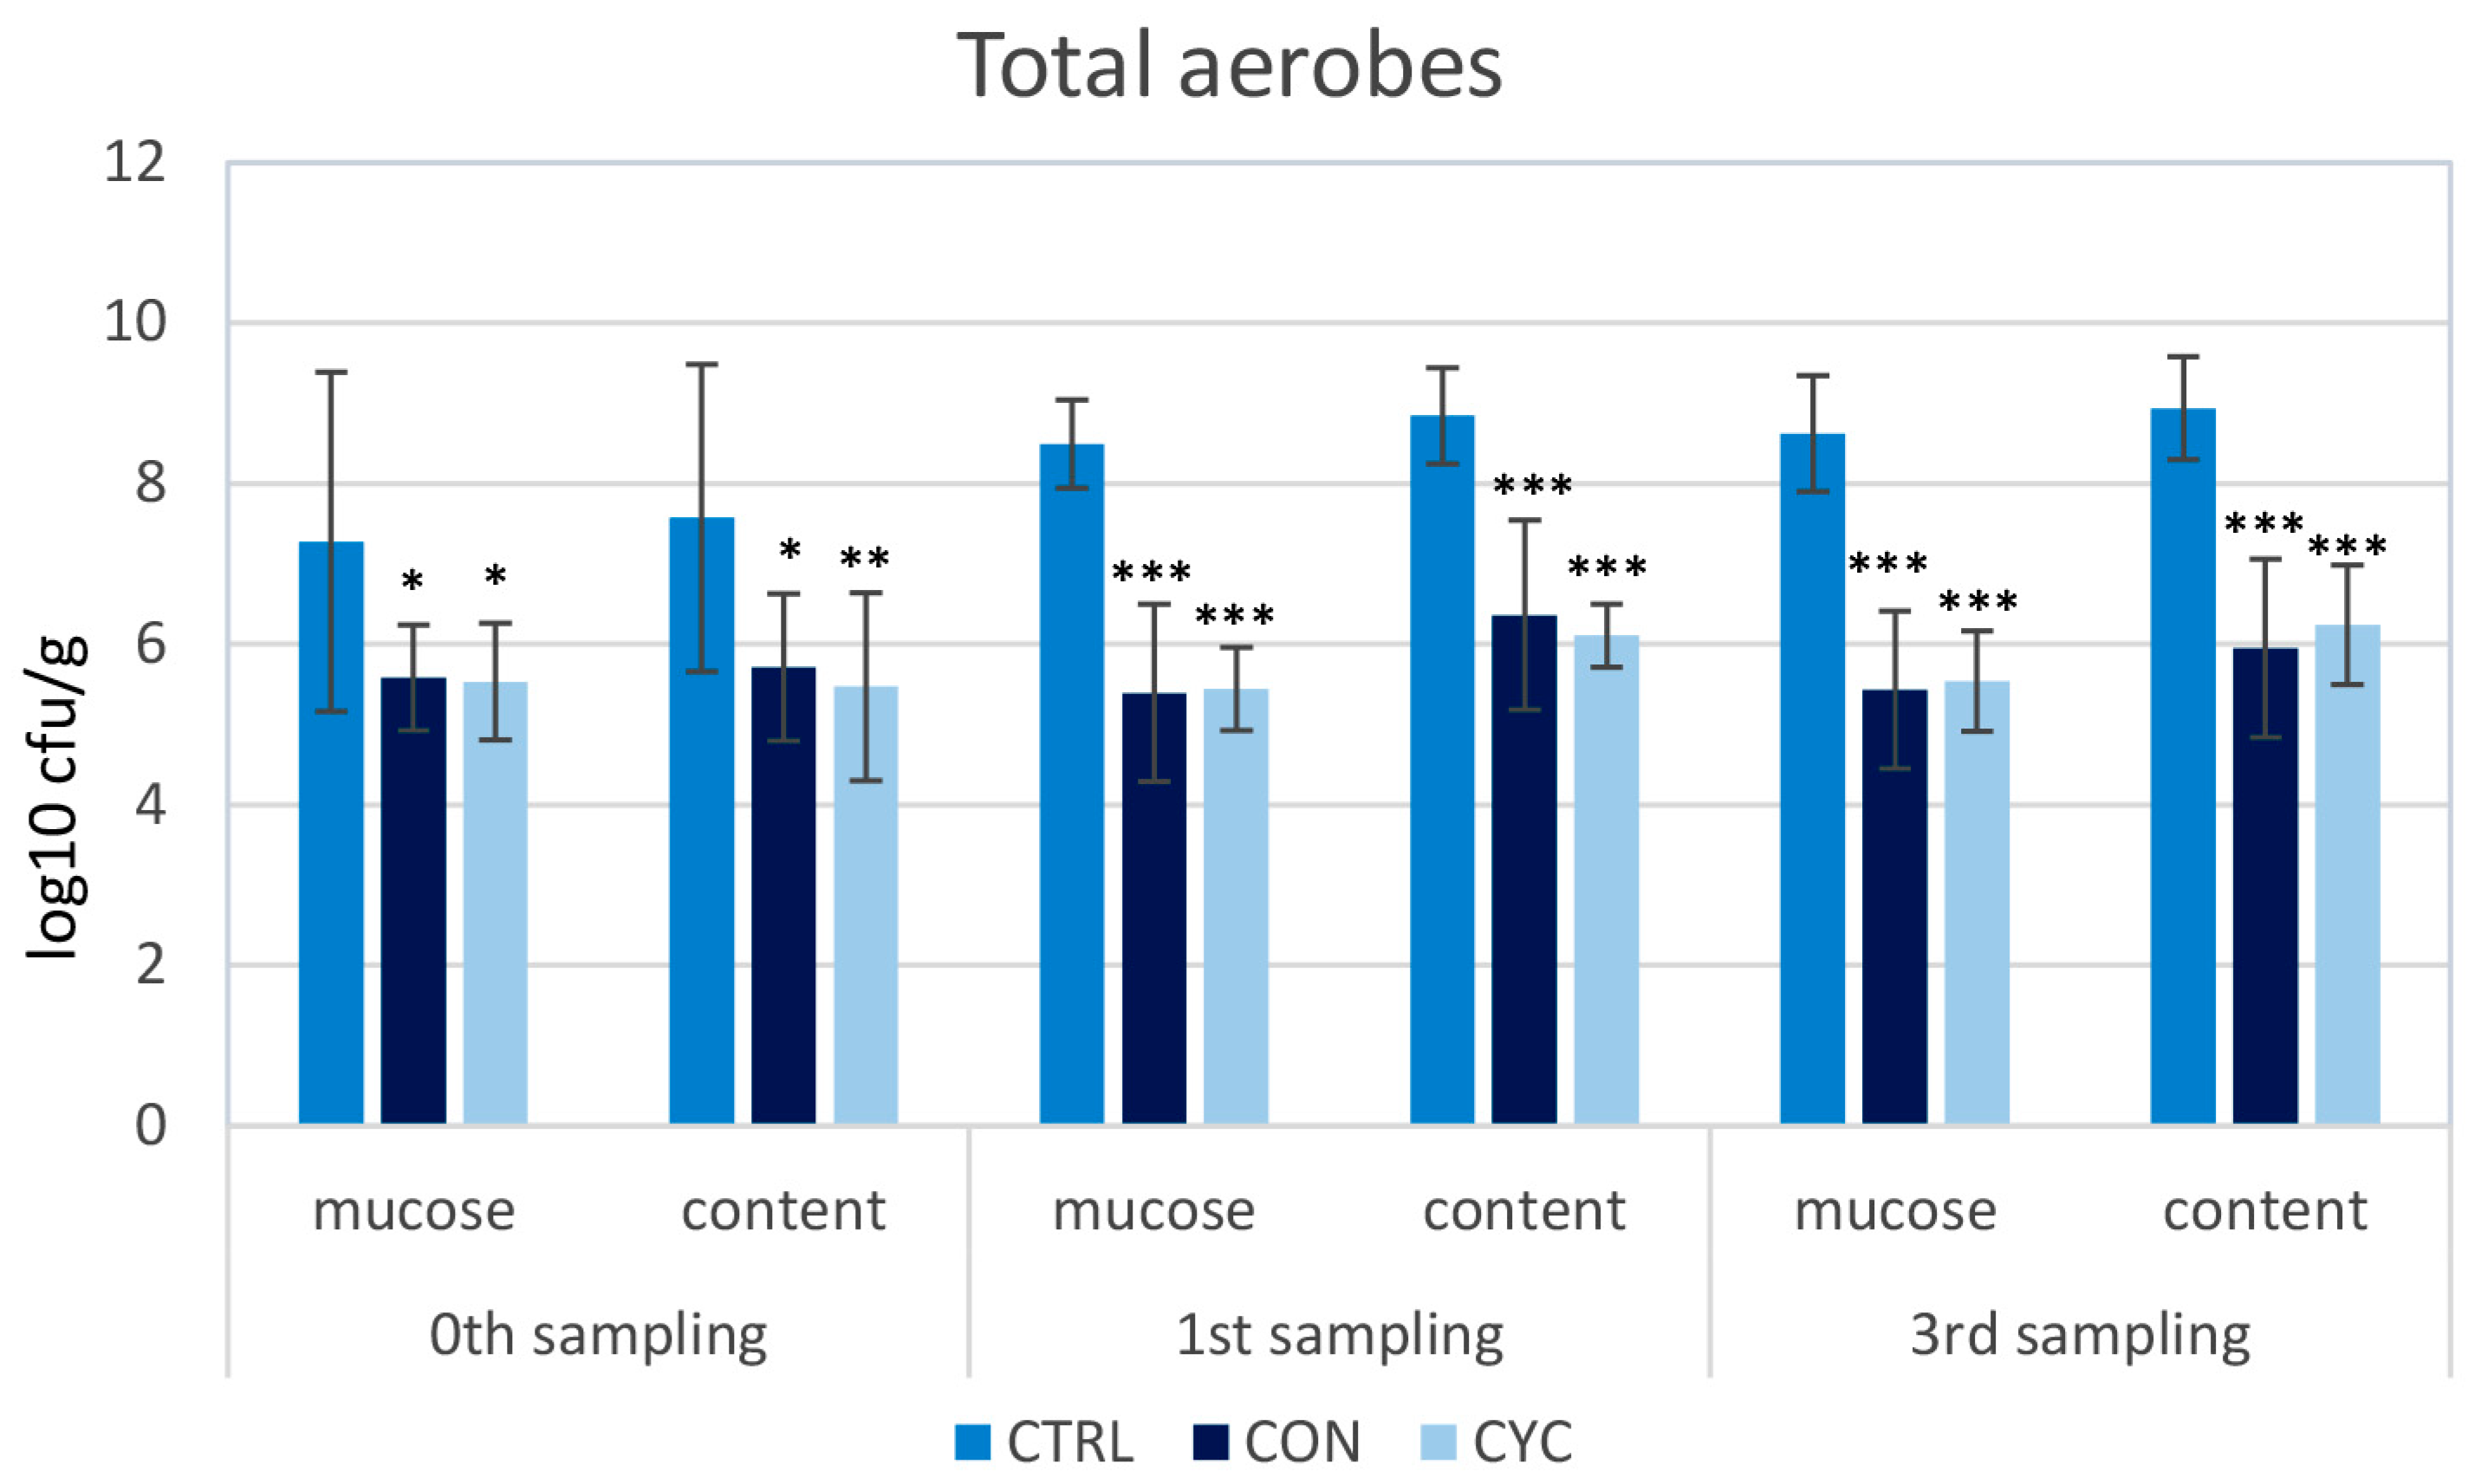
3.2. Microbiological Results
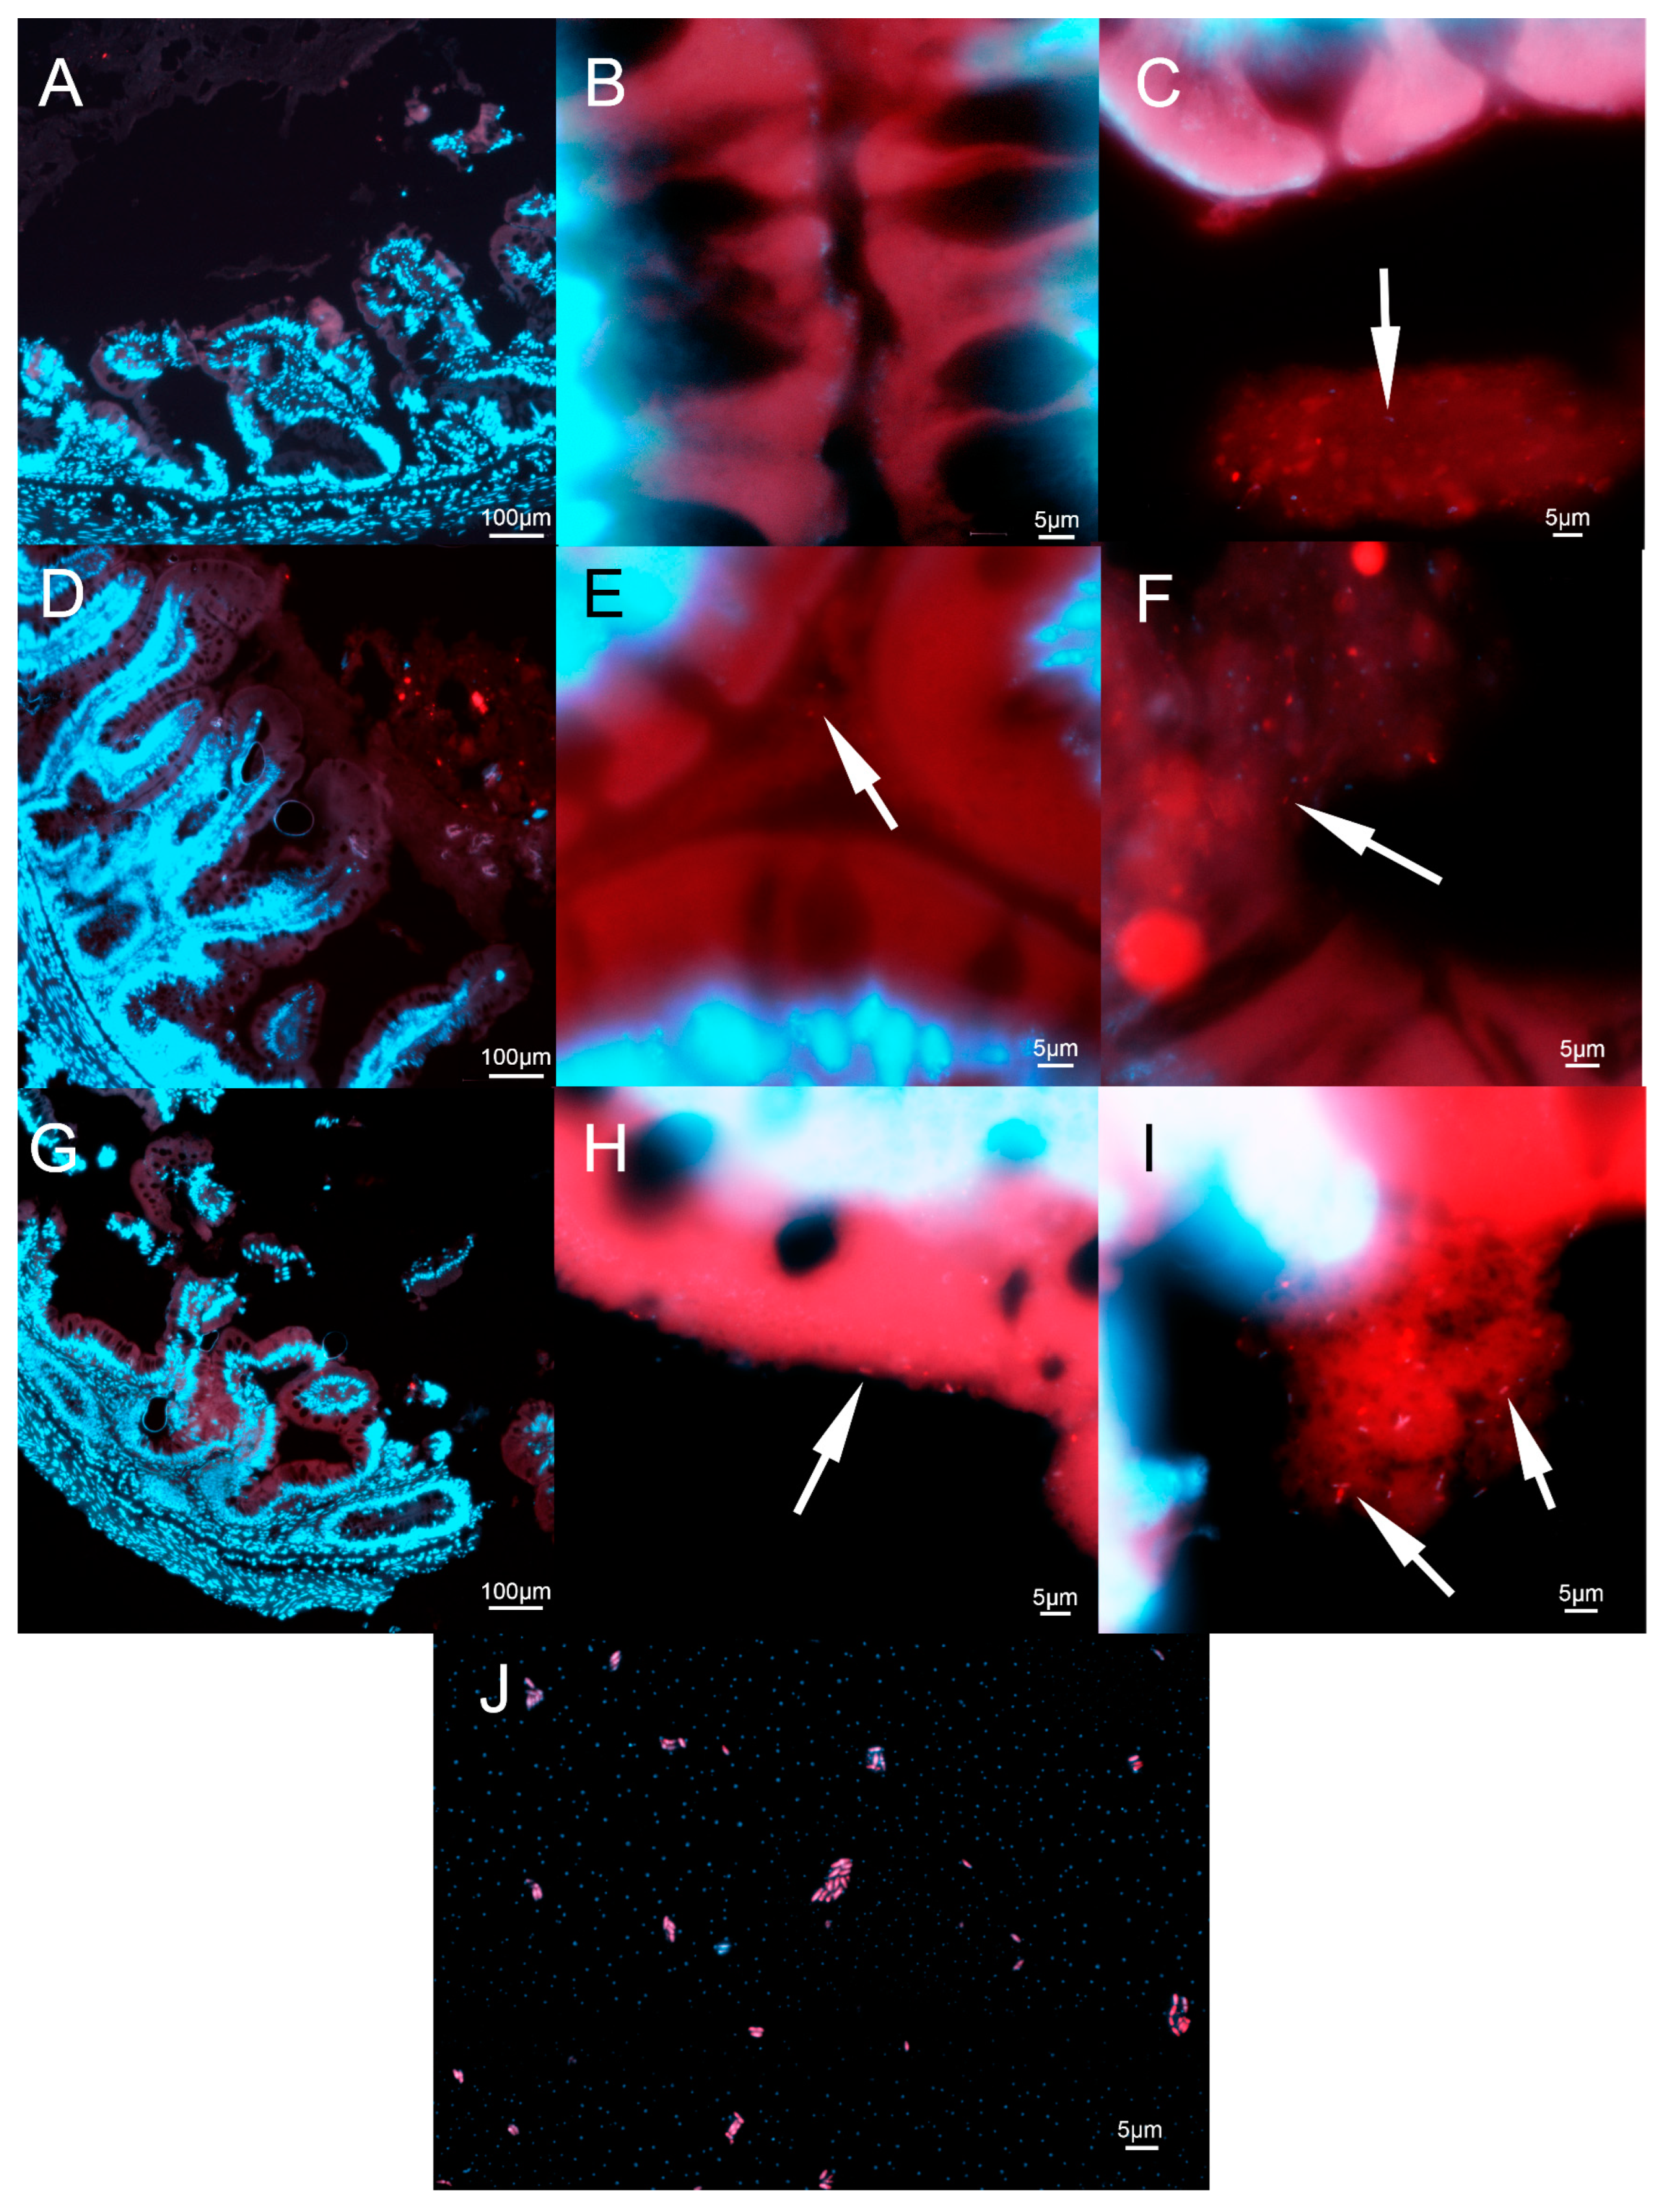
3.3. Histo-FISH Analysis
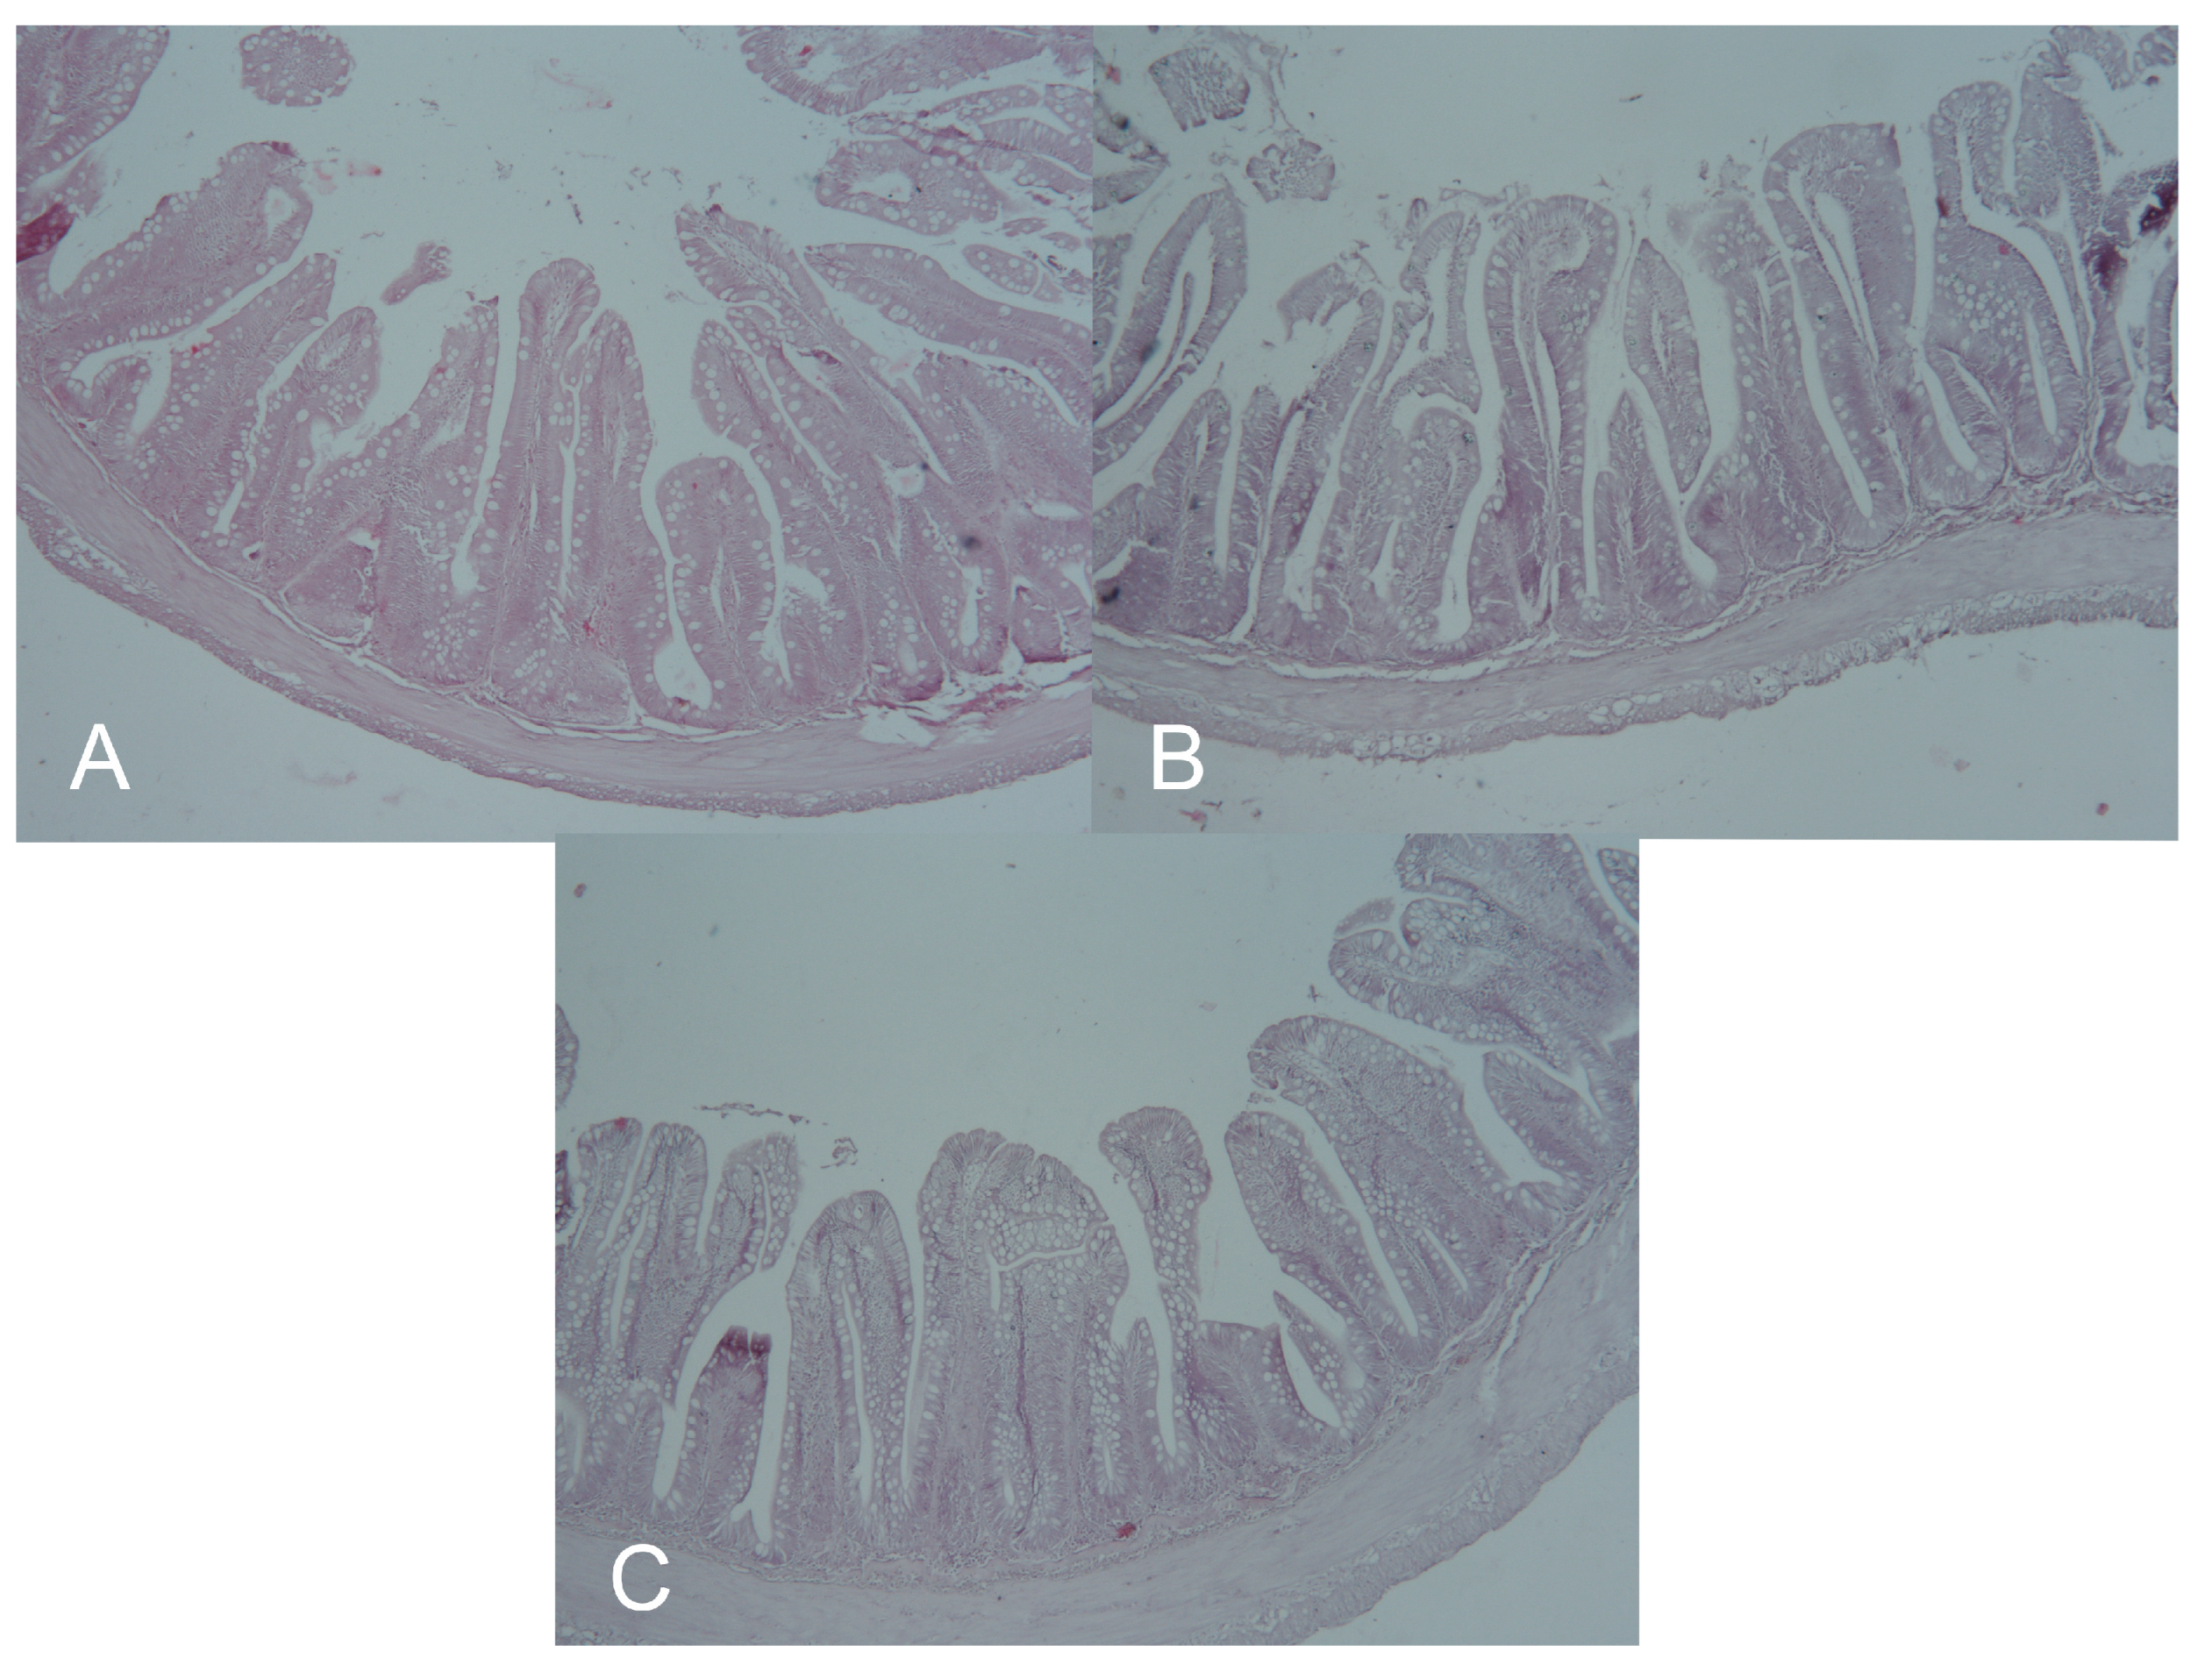
3.4. Morphometry of the Intestine
4. Discussion
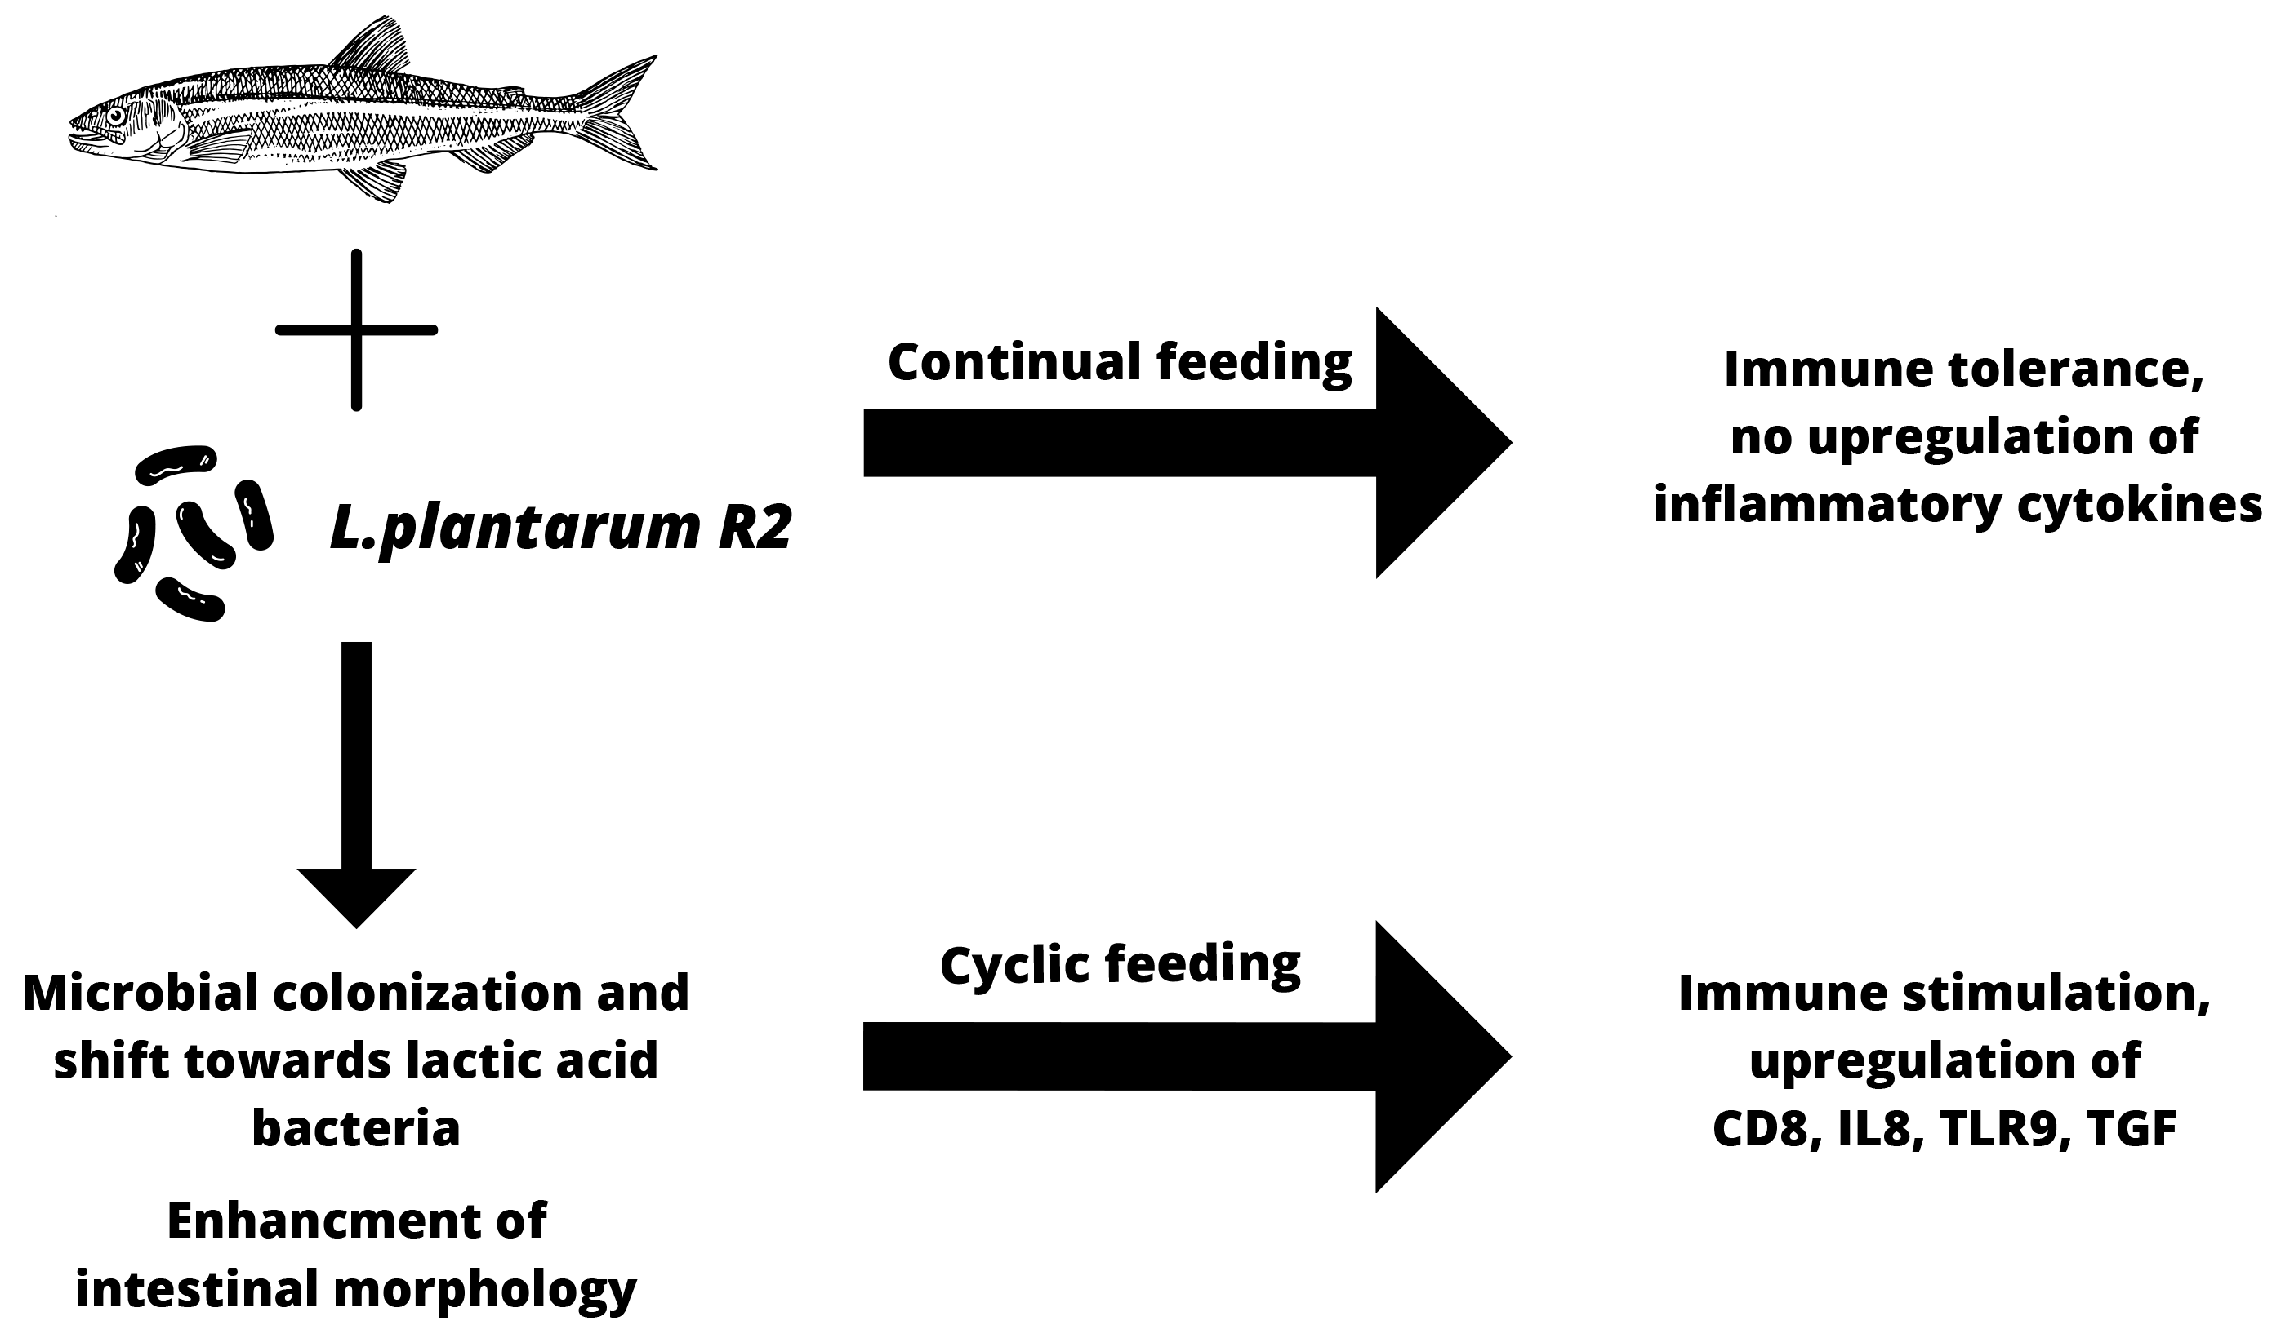
5. Conclusions
Author Contributions
Funding
Data Availability Statement
Acknowledgments
Conflicts of Interest
References
- FAO. The State of World Fisheries and Aquaculture 2020. Sustainability in Action; FAO: Rome, Italy, 2020; ISBN 978-92-5-132692-3. [Google Scholar]
- Billard, R.; Bry, C.; Gillet, C. Gillet Stress, Environment and Reproduction in Teleost Fish. Stress Fish 1981, 4, 185–201. [Google Scholar]
- Pickering, A.D.; Pottinger, T. Pottinger Stress Responses and Disease Resistance in Salmonid Fish: Effects of Chronic Elevation of Plasma Cortisol. Fish Physiol. Biochem. 1989, 7, 253–258. [Google Scholar] [CrossRef] [PubMed]
- Conde-Sieira, M.; Chivite, M.; Míguez, J.M.; Soengas, J.L. Soengas Stress Effects on the Mechanisms Regulating Appetite in Teleost Fish. Front. Endocrinol. 2018, 9, 631. [Google Scholar] [CrossRef] [PubMed] [Green Version]
- Merrifield, D.L.; Dimitroglou, A.; Foey, A.; Davies, S.J.; Baker, R.T.; Bøgwald, J.; Castex, M.; Ringø, E. The Current Status and Future Focus of Probiotic and Prebiotic Applications for Salmonids. Aquaculture 2010, 302, 1–18. [Google Scholar] [CrossRef]
- Chizhayeva, A.; Amangeldi, A.; Oleinikova, Y.; Alybaeva, A.; Sadanov, A. Lactic Acid Bacteria as Probiotics in Sustainable Development of Aquaculture. Aquat. Living Resour. 2022, 35, 10. [Google Scholar] [CrossRef]
- Van Doan, H.; Soltani, M.; Ringø, E. In Vitro Antagonistic Effect and in Vivo Protective Efficacy of Gram-Positive Probiotics versus Gram-Negative Bacterial Pathogens in Finfish and Shellfish. Aquaculture 2021, 540, 736581. [Google Scholar] [CrossRef]
- Vijayabaskar, P.; Somasundaram, S. Somasundaram Isolation of Bacteriocin Producing Lactic Acid Bacteria from Fish Gut and Probiotic Activity against Common Fresh Water Fish Pathogen Aeromonas Hydrophila. Biotechnology 2008, 7, 124–128. [Google Scholar] [CrossRef] [Green Version]
- Chabrillon, M.; Ouwehand, A.C.; Diaz-Rosales, P.; Arijo, S.; Martinez-Manzanares, E.; Balebona, M.C. Adhesion of Lactic Acid Bacteria to Mucus of Farmed Gilthead Seabream, and Interactions with Fish Pathogenic Microorganisms. Bull. Eur. Assoc. Fish Pathol. 2006, 26, 202–210. [Google Scholar]
- SNikoskelainen, S.; Ouwehand, A.; Bylund, G.; Salminen, S.; Lilius, E.-M. Immune Enhancement in Rainbow Trout (Oncorhynchus mykiss) by Potential Probiotic Bacteria (Lactobacillus rhamnosus). Fish Shellfish. Immunol. 2003, 15, 443–452. [Google Scholar] [CrossRef]
- Kosiewicz, M.M.; Zirnheld, A.L.; Alard, P. Gut Microbiota, Immunity, and Disease: A Complex Relationship. Front. Microbiol. 2011, 2, 180. [Google Scholar] [CrossRef] [Green Version]
- Tan, J.; McKenzie, C.; Potamitis, M.; Thorburn, A.N.; Mackay, C.R.; Macia, L. The Role of Short-Chain Fatty Acids in Health and Disease. Adv. Immunol. 2014, 121, 91–119. [Google Scholar] [CrossRef] [PubMed]
- Zhu, N.; Wang, J.; Yu, L.; Zhang, Q.; Chen, K.; Liu, B. Modulation of Growth Performance and Intestinal Microbiota in Chickens Fed Plant Extracts or Virginiamycin. Front. Microbiol. 2019, 10, 1333. [Google Scholar] [CrossRef] [PubMed] [Green Version]
- Sagaram, U.S.; Gaikwad, M.S.; Nandru, R.; Dasgupta, S. Dasgupta Microalgae as Feed Ingredients: Recent Developments on Their Role in Immunomodulation and Gut Microbiota of Aquaculture Species. FEMS Microbiol. Lett. 2021, 368, 71. [Google Scholar] [CrossRef]
- Nayak, S.K. Probiotics and Immunity: A Fish Perspective. Fish Shellfish. Immunol. 2010, 29, 2–14. [Google Scholar] [CrossRef]
- EFSA Panel on Additives and Products or Substances used in Animal Feed (FEEDAP); Guidance on the Assessment of Bacterial Susceptibility to Antimicrobials of Human and Veterinary Importance. EFSA J. 2012, 10, 2740. [CrossRef]
- Fečkaninová, A.; Koščová, J.; Mudroňová, D.; Schusterová, P.; Maruščáková, I.C.; Popelka, P. Characterization of Two Novel Lactic Acid Bacteria Isolated from the Intestine of Rainbow Trout (Oncorhynchus mykiss, Walbaum) in Slovakia. Aquaculture 2019, 506, 294–301. [Google Scholar] [CrossRef]
- Maruščáková, I.C.; Schusterová, P.; Popelka, P.; Gancarčíková, S.; Csank, T.; Fečkaninová, A.; Ratvaj, M.; Mudroňová, D. Effect of Autochthonous Lactobacilli on Immunologically Important Molecules of Rainbow Trout after Bacterial Infection Studied on Intestinal Primoculture. Fish Shellfish. Immunol. 2021, 119, 379–383. [Google Scholar] [CrossRef]
- Nemcová, R. Criteria for selection of lactobacilli for probiotic use. Vet. Med. 1997, 42, 19–27. [Google Scholar]
- Fečkaninová, A.; Koščová, J.; Franc, A.; Mudroňová, D.; Popelka, P. Surviving of Production Probiotic Strains in a Selected Application Form. Ceska Slov. Farm. 2022, 71, 27–33. [Google Scholar] [CrossRef] [PubMed]
- Zheng, J.; Wittouck, S.; Salvetti, E.; Franz, C.M.A.P.; Harris, H.M.B.; Mattarelli, P.; O’Toole, P.W.; Pot, B.; Vandamme, P.; Walter, J.; et al. A Taxonomic Note on the Genus Lactobacillus: Description of 23 Novel Genera, Emended Description of the Genus Lactobacillus Beijerinck 1901, and Union of Lactobacillaceae and Leuconostocaceae. Int. J. Syst. Evol. Microbiol. 2020, 70, 2782–2858. [Google Scholar] [CrossRef] [PubMed]
- European Commission COMMISSION REGULATION (EC) No 152/2009 of 27 January 2009 Laying down the Methods of Sampling and Analysis for the Official Control of Feed. 2009. Available online: https://eur-lex.europa.eu/legal-content/EN/ALL/?uri=CELEX:32009R0152 (accessed on 1 June 2023).
- Kim, D.-H.; Austin, B. Cytokine Expression in Leucocytes and Gut Cells of Rainbow Trout, Oncorhynchus Mykiss Walbaum, Induced by Probiotics. Vet. Immunol. Immunopathol. 2006, 114, 297–304. [Google Scholar] [CrossRef] [PubMed]
- Li, S.; Xie, H.; Yan, Z.; Li, B.; Wu, P.; Qian, X.; Zhang, X.; Wu, J.; Liu, J.; Zhao, X. Development of a Live Vector Vaccine against Infectious Hematopoietic Necrosis Virus in Rainbow Trout. Fish Shellfish. Immunol. 2019, 89, 516–524. [Google Scholar] [CrossRef]
- Yarahmadi, P.; Miandare, H.K.; Fayaz, S.; Caipang, C.M.A. Increased Stocking Density Causes Changes in Expression of Selected Stress- and Immune-Related Genes, Humoral Innate Immune Parameters and Stress Responses of Rainbow Trout (Oncorhynchus mykiss). Fish Shellfish. Immunol. 2016, 48, 43–53. [Google Scholar] [CrossRef] [PubMed]
- Jørgensen, T.R.; Raida, M.K.; Kania, P.W.; Buchmann, K. Response of Rainbow Trout (Oncorhynchus mykiss) in Skin and Fin Tissue during Infection with a Variant of Gyrodactylus salaris (Monogenea: Gyrodactylidae). Folia Parasitol. 2013, 56, 251–258. [Google Scholar] [CrossRef] [Green Version]
- Chettri, J.K.; Kuhn, J.; Jaafar, R.M.; Kania, P.W.; Møller, O.S.; Buchmann, K. Epidermal Response of Rainbow Trout to Ichthyobodo Necator: Immunohistochemical and Gene Expression Studies Indicate a Th1-/Th2-like Switch. J. Fish Dis. 2014, 37, 771–783. [Google Scholar] [CrossRef] [PubMed]
- Fierro-Castro, C.; Barrioluengo, L.; López-Fierro, P.; Razquin, B.; Villena, A. Fish Cell Cultures as in Vitro Models of Inflammatory Responses Elicited by Immunostimulants. Expression of Regulatory Genes of the Innate Immune Response. Fish Shellfish. Immunol. 2013, 35, 979–987. [Google Scholar] [CrossRef]
- Madar, M.; Slizova, M.; Czerwinski, J.; Hrckova, G.; Mudronova, D.; Gancarcikova, S.; Popper, M.; Pistl, J.; Soltys, J.; Nemcova, R. Histo-FISH Protocol to Detect Bacterial Compositions and Biofilms Formation in Vivo. Benef. Microbes 2015, 6, 899–907. [Google Scholar] [CrossRef]
- Ringø, E.; Gatesoupe, F.-J. Lactic Acid Bacteria in Fish: A Review. Aquaculture 1998, 160, 177–203. [Google Scholar] [CrossRef]
- Balcã¡Zar, J.L.; de Blas, I.; Ruiz-Zarzuela, I.; Vendrell, D.; Gironã©S, O.; Muzquiz, J.L. Enhancement of the Immune Response and Protection Induced by Probiotic Lactic Acid Bacteria against Furunculosis in Rainbow Trout (Oncorhynchus mykiss). FEMS Immunol. Med. Microbiol. 2007, 51, 185–193. [Google Scholar] [CrossRef] [Green Version]
- Vendrell, D.; Balcázar, J.L.; de Blas, I.; Ruiz-Zarzuela, I.; Gironés, O.; Múzquiz, J.L. Protection of Rainbow Trout (Oncorhynchus mykiss) from Lactococcosis by Probiotic Bacteria. Comp. Immunol. Microbiol. Infect. Dis. 2008, 31, 337–345. [Google Scholar] [CrossRef]
- Pérez-Sánchez, T.; Balcázar, J.L.; Merrifield, D.L.; Carnevali, O.; Gioacchini, G.; de Blas, I.; Ruiz-Zarzuela, I. Expression of Immune-Related Genes in Rainbow Trout (Oncorhynchus mykiss) Induced by Probiotic Bacteria during Lactococcus garvieae Infection. Fish Shellfish. Immunol. 2011, 31, 196–201. [Google Scholar] [CrossRef] [PubMed]
- Merrifield, D.; Dimitroglou, A.; Bradley, G.; Baker, R.; Davies, S. Probiotic Applications for Rainbow Trout (Oncorhynchus mykiss Walbaum) I. Effects on Growth Performance, Feed Utilization, Intestinal Microbiota and Related Health Criteria. Aquac. Nutr. 2010, 16, 504–510. [Google Scholar] [CrossRef]
- Merrifield, D.; Bradley, G.; Harper, G.; Baker, R.; Munn, C.; Davies, S. Assessment of the Effects of Vegetative and Lyophilized Pediococcus Acidilactici on Growth, Feed Utilization, Intestinal Colonization and Health Parameters of Rainbow Trout (Oncorhynchus mykiss Walbaum). Aquac. Nutr. 2011, 17, 73–79. [Google Scholar] [CrossRef]
- Gümüş, E.; Kubilay, A.; Guney, Z.; Guzel-Seydim, T.; Kok-Tas, S.; Ulukoy, M.G. Effect of Dietary Kefir on the Growth Performance, Feed Utilization and Fatty Acid Profile of Juvenile Rainbow Trout, Oncorhynchus Mykiss. Aquac. Nutr. 2017, 23, 964–972. [Google Scholar] [CrossRef]
- Hines, I.S.; Santiago-Morales, K.D.; Ferguson, C.S.; Clarington, J.; Thompson, M.; Rauschenbach, M.; Levine, U.; Drahos, D.; Aylward, F.O.; Smith, S.A.; et al. Steelhead Trout (Oncorhynchus mykiss) Fed Probiotic during the Earliest Developmental Stages Have Enhanced Growth Rates and Intestinal Microbiome Bacterial Diversity. Front. Mar. Sci. 2022, 9, 2291. [Google Scholar] [CrossRef]
- Nimalan, N.; Sørensen, S.L.; Fečkaninová, A.; Koščová, J.; Mudroňová, D.; Gancarčíková, S.; Vatsos, I.N.; Bisa, S.; Kiron, V.; Sørensen, M. Mucosal Barrier Status in Atlantic Salmon Fed Marine or Plant-Based Diets Supplemented with Probiotics. Aquaculture 2022, 547, 737516. [Google Scholar] [CrossRef]
- Mashoof, S.; Criscitiello, M.F. Criscitiello Fish Immunoglobulins. Biology 2016, 5, 45. [Google Scholar] [CrossRef] [Green Version]
- Solem, S.T.; Stenvik, J. Antibody Repertoire Development in Teleosts—A Review with Emphasis on Salmonids and Gadus morhua L. Dev. Comp. Immunol. 2006, 30, 57–76. [Google Scholar] [CrossRef]
- Costa, G.; Danz, H.; Kataria, P.; Bromage, E. A Holistic View of the Dynamisms of Teleost IgM: A Case Study of Streptococcus Iniae Vaccinated Rainbow Trout (Oncorhynchus mykiss). Dev. Comp. Immunol. 2012, 36, 298–305. [Google Scholar] [CrossRef]
- Vazirzadeh, A.; Roosta, H.; Masoumi, H.; Farhadi, A.; Jeffs, A. Long-Term Effects of Three Probiotics, Singular or Combined, on Serum Innate Immune Parameters and Expressions of Cytokine Genes in Rainbow Trout during Grow-Out. Fish Shellfish. Immunol. 2020, 98, 748–757. [Google Scholar] [CrossRef]
- Balcázar, J.L.; de Blas, I.; Ruiz-Zarzuela, I.; Vendrell, D.; Calvo, A.C.; Márquez, I.; Gironés, O.; Muzquiz, J.L. Changes in Intestinal Microbiota and Humoral Immune Response Following Probiotic Administration in Brown Trout (Salmo trutta). Br. J. Nutr. 2007, 97, 522–527. [Google Scholar] [CrossRef] [Green Version]
- IAas, I.B.; Austbø, L.; Falk, K.; Hordvik, I.; Koppang, E.O. The Interbranchial Lymphoid Tissue Likely Contributes to Immune Tolerance and Defense in the Gills of Atlantic Salmon. Dev. Comp. Immunol. 2017, 76, 247–254. [Google Scholar] [CrossRef] [PubMed]
- Ashfaq, H.; Soliman, H.; Saleh, M.; El-Matbouli, M. CD4: A Vital Player in the Teleost Fish Immune System. Vet. Res. 2019, 50, 1–11. [Google Scholar] [CrossRef] [Green Version]
- Picchietti, S.; Fausto, A.M.; Randelli, E.; Carnevali, O.; Taddei, A.R.; Buonocore, F.; Scapigliati, G.; Abelli, L. Early Treatment with Lactobacillus Delbrueckii Strain Induces an Increase in Intestinal T-Cells and Granulocytes and Modulates Immune-Related Genes of Larval dicentrarchus Labrax (L.). Fish Shellfish. Immunol. 2009, 26, 368–376. [Google Scholar] [CrossRef] [PubMed] [Green Version]
- Ashfaq, H.; Soliman, H.; Fajmann, S.; Sexl, V.; El-Matbouli, M.; Saleh, M. Kinetics of CD4-1+ Lymphocytes in Brown Trout after Exposure to Viral Haemorrhagic septicaemia Virus. J. Fish Dis. 2021, 44, 1553–1562. [Google Scholar] [CrossRef] [PubMed]
- Takizawa, F.; Dijkstra, J.M.; Kotterba, P.; Korytář, T.; Kock, H.; Köllner, B.; Jaureguiberry, B.; Nakanishi, T.; Fischer, U. The Expression of CD8α Discriminates Distinct T Cell Subsets in Teleost Fish. Dev. Comp. Immunol. 2011, 35, 752–763. [Google Scholar] [CrossRef]
- Utke, K.; Bergmann, S.; Lorenzen, N.; Köllner, B.; Ototake, M.; Fischer, U. Cell-Mediated Cytotoxicity in Rainbow Trout, Oncorhynchus mykiss, Infected with Viral Haemorrhagic septicaemia Virus. Fish Shellfish. Immunol. 2007, 22, 182–196. [Google Scholar] [CrossRef]
- Toda, H.; Shibasaki, Y.; Koike, T.; Ohtani, M.; Takizawa, F.; Ototake, M.; Moritomo, T.; Nakanishi, T. Alloantigen-Specific Killing Is Mediated by CD8-Positive T Cells in Fish. Dev. Comp. Immunol. 2009, 33, 646–652. [Google Scholar] [CrossRef]
- Granja, A.G.; Leal, E.; Pignatelli, J.; Castro, R.; Abós, B.; Kato, G.; Fischer, U.; Tafalla, C. Identification of Teleost Skin CD8α+ Dendritic-like Cells, Representing a Potential Common Ancestor for Mammalian Cross-Presenting Dendritic Cells. J. Immunol. 2015, 195, 1825–1837. [Google Scholar] [CrossRef] [Green Version]
- Skaggs, B.J.; Singh, R.P.; Hahn, B.H. Induction of Immune Tolerance by Activation of CD8+ T Suppressor/Regulatory Cells in Lupus-Prone Mice. Hum. Immunol. 2008, 69, 790–796. [Google Scholar] [CrossRef] [Green Version]
- Ogryzko, N.V.; Renshaw, S.A.; Wilson, H.L. The IL-1 Family in Fish: Swimming through the Muddy Waters of Inflammasome Evolution. Dev. Comp. Immunol. 2014, 46, 53–62. [Google Scholar] [CrossRef] [PubMed]
- Wu, Z.-Q.; Jiang, C.; Ling, F.; Wang, G.-X. Effects of Dietary Supplementation of Intestinal Autochthonous Bacteria on the Innate Immunity and Disease Resistance of Grass Carp (Ctenopharyngodon idellus). Aquaculture 2015, 438, 105–114. [Google Scholar] [CrossRef]
- He, S.; Zhang, Y.; Xu, L.; Yang, Y.; Marubashi, T.; Zhou, Z.; Yao, B. Effects of Dietary Bacillus Subtilis C-3102 on the Production, Intestinal Cytokine Expression and Autochthonous Bacteria of Hybrid Tilapia Oreochromis Niloticus ♀ × Oreochromis Aureus ♂. Aquaculture 2013, 412–413, 125–130. [Google Scholar] [CrossRef]
- Li, Y.; Xiao, T.; Zou, J. Fish TNF and TNF Receptors. Sci. China Life Sci. 2020, 64, 196–220. [Google Scholar] [CrossRef] [PubMed]
- Wangkahart, E.; Secombes, C.J.; Wang, T. Dissecting the Immune Pathways Stimulated Following Injection Vaccination of Rainbow Trout (Oncorhynchus mykiss) against Enteric Redmouth Disease (ERM). Fish Shellfish. Immunol. 2019, 85, 18–30. [Google Scholar] [CrossRef] [Green Version]
- Muñoz-Atienza, E.; Araújo, C.; Magadán, S.; Hernández, P.E.; Herranz, C.; Santos, Y.; Cintas, L.M. In Vitro and in Vivo Evaluation of Lactic Acid Bacteria of Aquatic Origin as Probiotics for Turbot (Scophthalmus maximus L.) Farming. Fish Shellfish. Immunol. 2014, 41, 570–580. [Google Scholar] [CrossRef]
- Saxena, V.; Lienesch, D.W.; Zhou, M.; Bommireddy, R.; Azhar, M.; Doetschman, T.; Singh, R.R. Dual Roles of Immunoregulatory Cytokine TGF-β in the Pathogenesis of Autoimmunity-Mediated Organ Damage. J. Immunol. 2008, 180, 1903–1912. [Google Scholar] [CrossRef] [Green Version]
- Yang, M.; Wang, X.; Chen, D.; Wang, Y.; Zhang, A.; Zhou, H. Tgf-Β1 Exerts Opposing Effects on Grass Carp Leukocytes: Implication in Teleost Immunity, Receptor Signaling and Potential Self-Regulatory Mechanisms. PLoS ONE 2012, 7, e35011. [Google Scholar] [CrossRef] [Green Version]
- Li, X.; Mu, P.; Teng, Y.; Wu, Y.; Chen, X. Identification of a TGF-Β1 Homologue in the Large Yellow Croaker (Larimichthys crocea) Revealed Its Role in Regulation of Immune Response. Water Biol. Secur. 2022, 1, 100006. [Google Scholar] [CrossRef]
- Tan, H.Y.; Chen, S.-W.; Hu, S.-Y. Improvements in the Growth Performance, Immunity, Disease Resistance, and Gut Microbiota by the Probiotic Rummeliibacillus Stabekisii in Nile Tilapia (Oreochromis niloticus). Fish Shellfish. Immunol. 2019, 92, 265–275. [Google Scholar] [CrossRef]
- Lilleeng, E.; Penn, M.H.; Haugland, O.; Xu, C.; Bakke, A.M.; Krogdahl, A.; Landsverk, T.; Frøystad-Saugen, M.K. Decreased Expression of TGF-β, GILT and T-Cell Markers in the Early Stages of Soybean Enteropathy in Atlantic Salmon (Salmo salar L.). Fish Shellfish Immunol. 2009, 27, 65–72. [Google Scholar] [CrossRef] [PubMed]
- Di Giacinto, C.; Marinaro, M.; Sanchez, M.; Strober, W.; Boirivant, M. Probiotics Ameliorate Recurrent Th1-Mediated Murine Colitis by Inducing IL-10 and IL-10-Dependent TGF-β-Bearing Regulatory Cells. J. Immunol. 2005, 174, 3237–3246. [Google Scholar] [CrossRef] [Green Version]
- Medzhitov, R.; Janeway, C.A., Jr. Decoding the Patterns of Self and Nonself by the Innate Immune System. Science 2002, 296, 298–300. [Google Scholar] [CrossRef] [PubMed] [Green Version]
- Iliev, D.B.; Skjæveland, I.; Jørgensen, J.B. CpG Oligonucleotides Bind TLR9 and RRM-Containing Proteins in Atlantic Salmon (Salmo salar). BMC Immunol. 2013, 14, 12. [Google Scholar] [CrossRef] [PubMed] [Green Version]
- Mielcarska, M.B.; Bossowska-Nowicka, M.; Toka, F.N. Cell Surface Expression of Endosomal Toll-Like Receptors—A Necessity or a Superfluous Duplication? Front. Immunol. 2021, 11, 3652. [Google Scholar] [CrossRef] [PubMed]
- Zhong, Y.; Huang, J.; Tang, W.; Chen, B.; Cai, W. Effects of Probiotics, Probiotic DNA and the CpG Oligodeoxynucleotides on Ovalbumin-Sensitized Brown-Norway Rats via TLR9/NF-ΚB Pathway. FEMS Immunol. Med. Microbiol. 2012, 66, 71–82. [Google Scholar] [CrossRef] [Green Version]
- Gupta, S.; Fečkaninová, A.; Lokesh, J.; Koščová, J.; Sørensen, M.; Fernandes, J.; Kiron, V. Erratum: Lactobacillus Dominate in the Intestine of Atlantic Salmon Fed Dietary Probiotics. Front. Microbiol. 2019, 10, 3247. [Google Scholar] [CrossRef] [Green Version]
- Rahimi, S.; Grimes, J.L.; Fletcher, O.; Oviedo, E.; Sheldon, B.W. Effect of a Direct-Fed Microbial (Primalac) on Structure and Ultrastructure of Small Intestine in Turkey Poults. Poult. Sci. 2009, 88, 491–503. [Google Scholar] [CrossRef]
- Mohammadian, T.; Monjezi, N.; Peyghan, R.; Mohammadian, B. Effects of Dietary Probiotic Supplements on Growth, Digestive Enzymes Activity, Intestinal Histomorphology and Innate Immunity of Common Carp (Cyprinus carpio): A Field Study. Aquaculture 2022, 549, 737787. [Google Scholar] [CrossRef]
- Sun, Y.; Duarte, M.E.; Kim, S.W. Dietary Inclusion of Multispecies Probiotics to Reduce the Severity of Post-Weaning Diarrhea Caused by Escherichia Coli F18+ in Pigs. Anim. Nutr. 2021, 7, 326–333. [Google Scholar] [CrossRef]


| Components | Weight (g) |
|---|---|
| Pellets (EFICO Enviro 921 3 mm) | 1000 |
| 25% suspension of L. plantarum R2 in sterile saline | 120 |
| Colloidal silicon dioxide (Aerosil® 200) | 10 |
| Pregelatinized maize starch (Starch 1500®) | 10 |
| Constituents | Control (Coated) | Probiotic |
|---|---|---|
| Dry matter (DM), g/kg | 850.7 | 858.3 |
| Nitrogenous compounds, g/kg | 439.8 | 439.4 |
| Crude fiber, g/kg | 21.9 | 20.3 |
| Fat, g/kg | 190.4 | 192.5 |
| Ash, g/kg | 74.1 | 75.1 |
| Organic matter, g/kg | 776.6 | 793.3 |
| Total calcium, g/kg | 10.4 | 10.4 |
| Total phosphorus, g/kg | 5.9 | 5.6 |
| Magnesium, g/kg | 2.2 | 2.2 |
| Sodium, g/kg | 3.5 | 3.5 |
| Potassium, g/kg | 6.2 | 6.3 |
| Iron, mg/kg | 232.9 | 244.9 |
| Manganese, mg/kg | 17.1 | 20.3 |
| Zinc, mg/kg | 85.8 | 90.7 |
| Copper, mg/kg | 70.0 | 78.4 |
| Aspartic acid, g/kg DM | 51.3 | 50.7 |
| Threonine, g/kg DM | 24.6 | 24.3 |
| Serine, g/kg DM | 25.8 | 25.9 |
| Glutamic acid, g/kg DM | 93.5 | 89.3 |
| Proline, g/kg DM | 26.7 | 25.4 |
| Glycine, g/kg DM | 27.8 | 26.6 |
| Alanine, g/kg DM | 30.9 | 28.6 |
| Valine, g/kg DM | 21.3 | 24.0 |
| Isoleucine, g/kg DM | 14.7 | 16.5 |
| Leucine, g/kg DM | 42.8 | 42.9 |
| Tyrosine, g/kg DM | 14.4 | 15.3 |
| Phenylalanine, g/kg DM | 23.7 | 24.4 |
| Histidine, g/kg DM | 19.8 | 18.7 |
| Lysine, g/kg DM | 35.9 | 36.4 |
| Arginine, g/kg DM | 30.8 | 31.1 |
| Methionine, g/kg DM | 10.5 | 9.5 |
| Cystine, g/kg DM | 5.9 | 5.7 |
| Gene | Primer Sequence | Reference |
|---|---|---|
| β-actin F | GGACTTTGAGCAGGAGATGG | [23] |
| β-actin R | ATGATGGAGTTGTAGGTGGTCT | |
| igm F | ACCTTAACCAGCCGAAAG | [24] |
| igm R | TGTCCCATTGCTCCAGTC | |
| cd4 F | CCTGCTCATCCACAGCCT | [24] |
| cd4 R | CTTCTCCTGGCTGTCTGA | |
| cd8 F | AGTCGTGCAAAGTGGGA | [24] |
| cd8 R | GGTTGCAATGGCATACAG | |
| il1-β F | ACATTGCCAACCTCATCATCG | [25] |
| il1-β R | TTGAGCAGGTCCTTGTCCTTG | |
| tnf-α F | GGGGACAAACTGTGGACTGA | [26] |
| tnf-α R | GAAGTTCTTGCCCTGCTCTG | |
| il8 F | CACAGACAGAGAAGGAAGGAAAG | [23] |
| il8 R | TGCTCATCTTGGGGTTACAGA | |
| tgf-β F | TCTGAATGAGTGGCTGCAAG | [27] |
| tgf-β R | GGTTTCCCACAATCACAAGG | |
| tlr9 F | GCAACCAGTCCTTCCACATT | [28] |
| tlr9 R | AAACCCAGGGTAAGGGTTTG |
| CTRL | CON | CYC | |
|---|---|---|---|
| Average cross-section surface (µm2) | 368,505.4 ± 235,495.5 | 533,749.5 ± 218,978.6 a *** | 706,911.7 ± 267,860.5 a *** b * |
| Average villus height (µm) | 1404.6 ± 289.3 | 1374.8 ± 296.4 | 1512.7 ± 396.6 b * |
| Average villus width (µm) | 460.9 ± 92.0 | 432.6307 ± 101.9 | 435.8 ± 93.2 |
Disclaimer/Publisher’s Note: The statements, opinions and data contained in all publications are solely those of the individual author(s) and contributor(s) and not of MDPI and/or the editor(s). MDPI and/or the editor(s) disclaim responsibility for any injury to people or property resulting from any ideas, methods, instructions or products referred to in the content. |
© 2023 by the authors. Licensee MDPI, Basel, Switzerland. This article is an open access article distributed under the terms and conditions of the Creative Commons Attribution (CC BY) license (https://creativecommons.org/licenses/by/4.0/).
Share and Cite
Ratvaj, M.; Maruščáková, I.C.; Popelka, P.; Fečkaninová, A.; Koščová, J.; Chomová, N.; Mareš, J.; Malý, O.; Žitňan, R.; Faldyna, M.; et al. Feeding-Regime-Dependent Intestinal Response of Rainbow Trout after Administration of a Novel Probiotic Feed. Animals 2023, 13, 1892. https://doi.org/10.3390/ani13121892
Ratvaj M, Maruščáková IC, Popelka P, Fečkaninová A, Koščová J, Chomová N, Mareš J, Malý O, Žitňan R, Faldyna M, et al. Feeding-Regime-Dependent Intestinal Response of Rainbow Trout after Administration of a Novel Probiotic Feed. Animals. 2023; 13(12):1892. https://doi.org/10.3390/ani13121892
Chicago/Turabian StyleRatvaj, Marek, Ivana Cingeľová Maruščáková, Peter Popelka, Adriána Fečkaninová, Jana Koščová, Natália Chomová, Jan Mareš, Ondřej Malý, Rudolf Žitňan, Martin Faldyna, and et al. 2023. "Feeding-Regime-Dependent Intestinal Response of Rainbow Trout after Administration of a Novel Probiotic Feed" Animals 13, no. 12: 1892. https://doi.org/10.3390/ani13121892