Black Grouse Hissing Calls Show Geographic Variability across the Distribution Area


Abstract
:Simple Summary
Abstract
1. Introduction
2. Materials and Methods
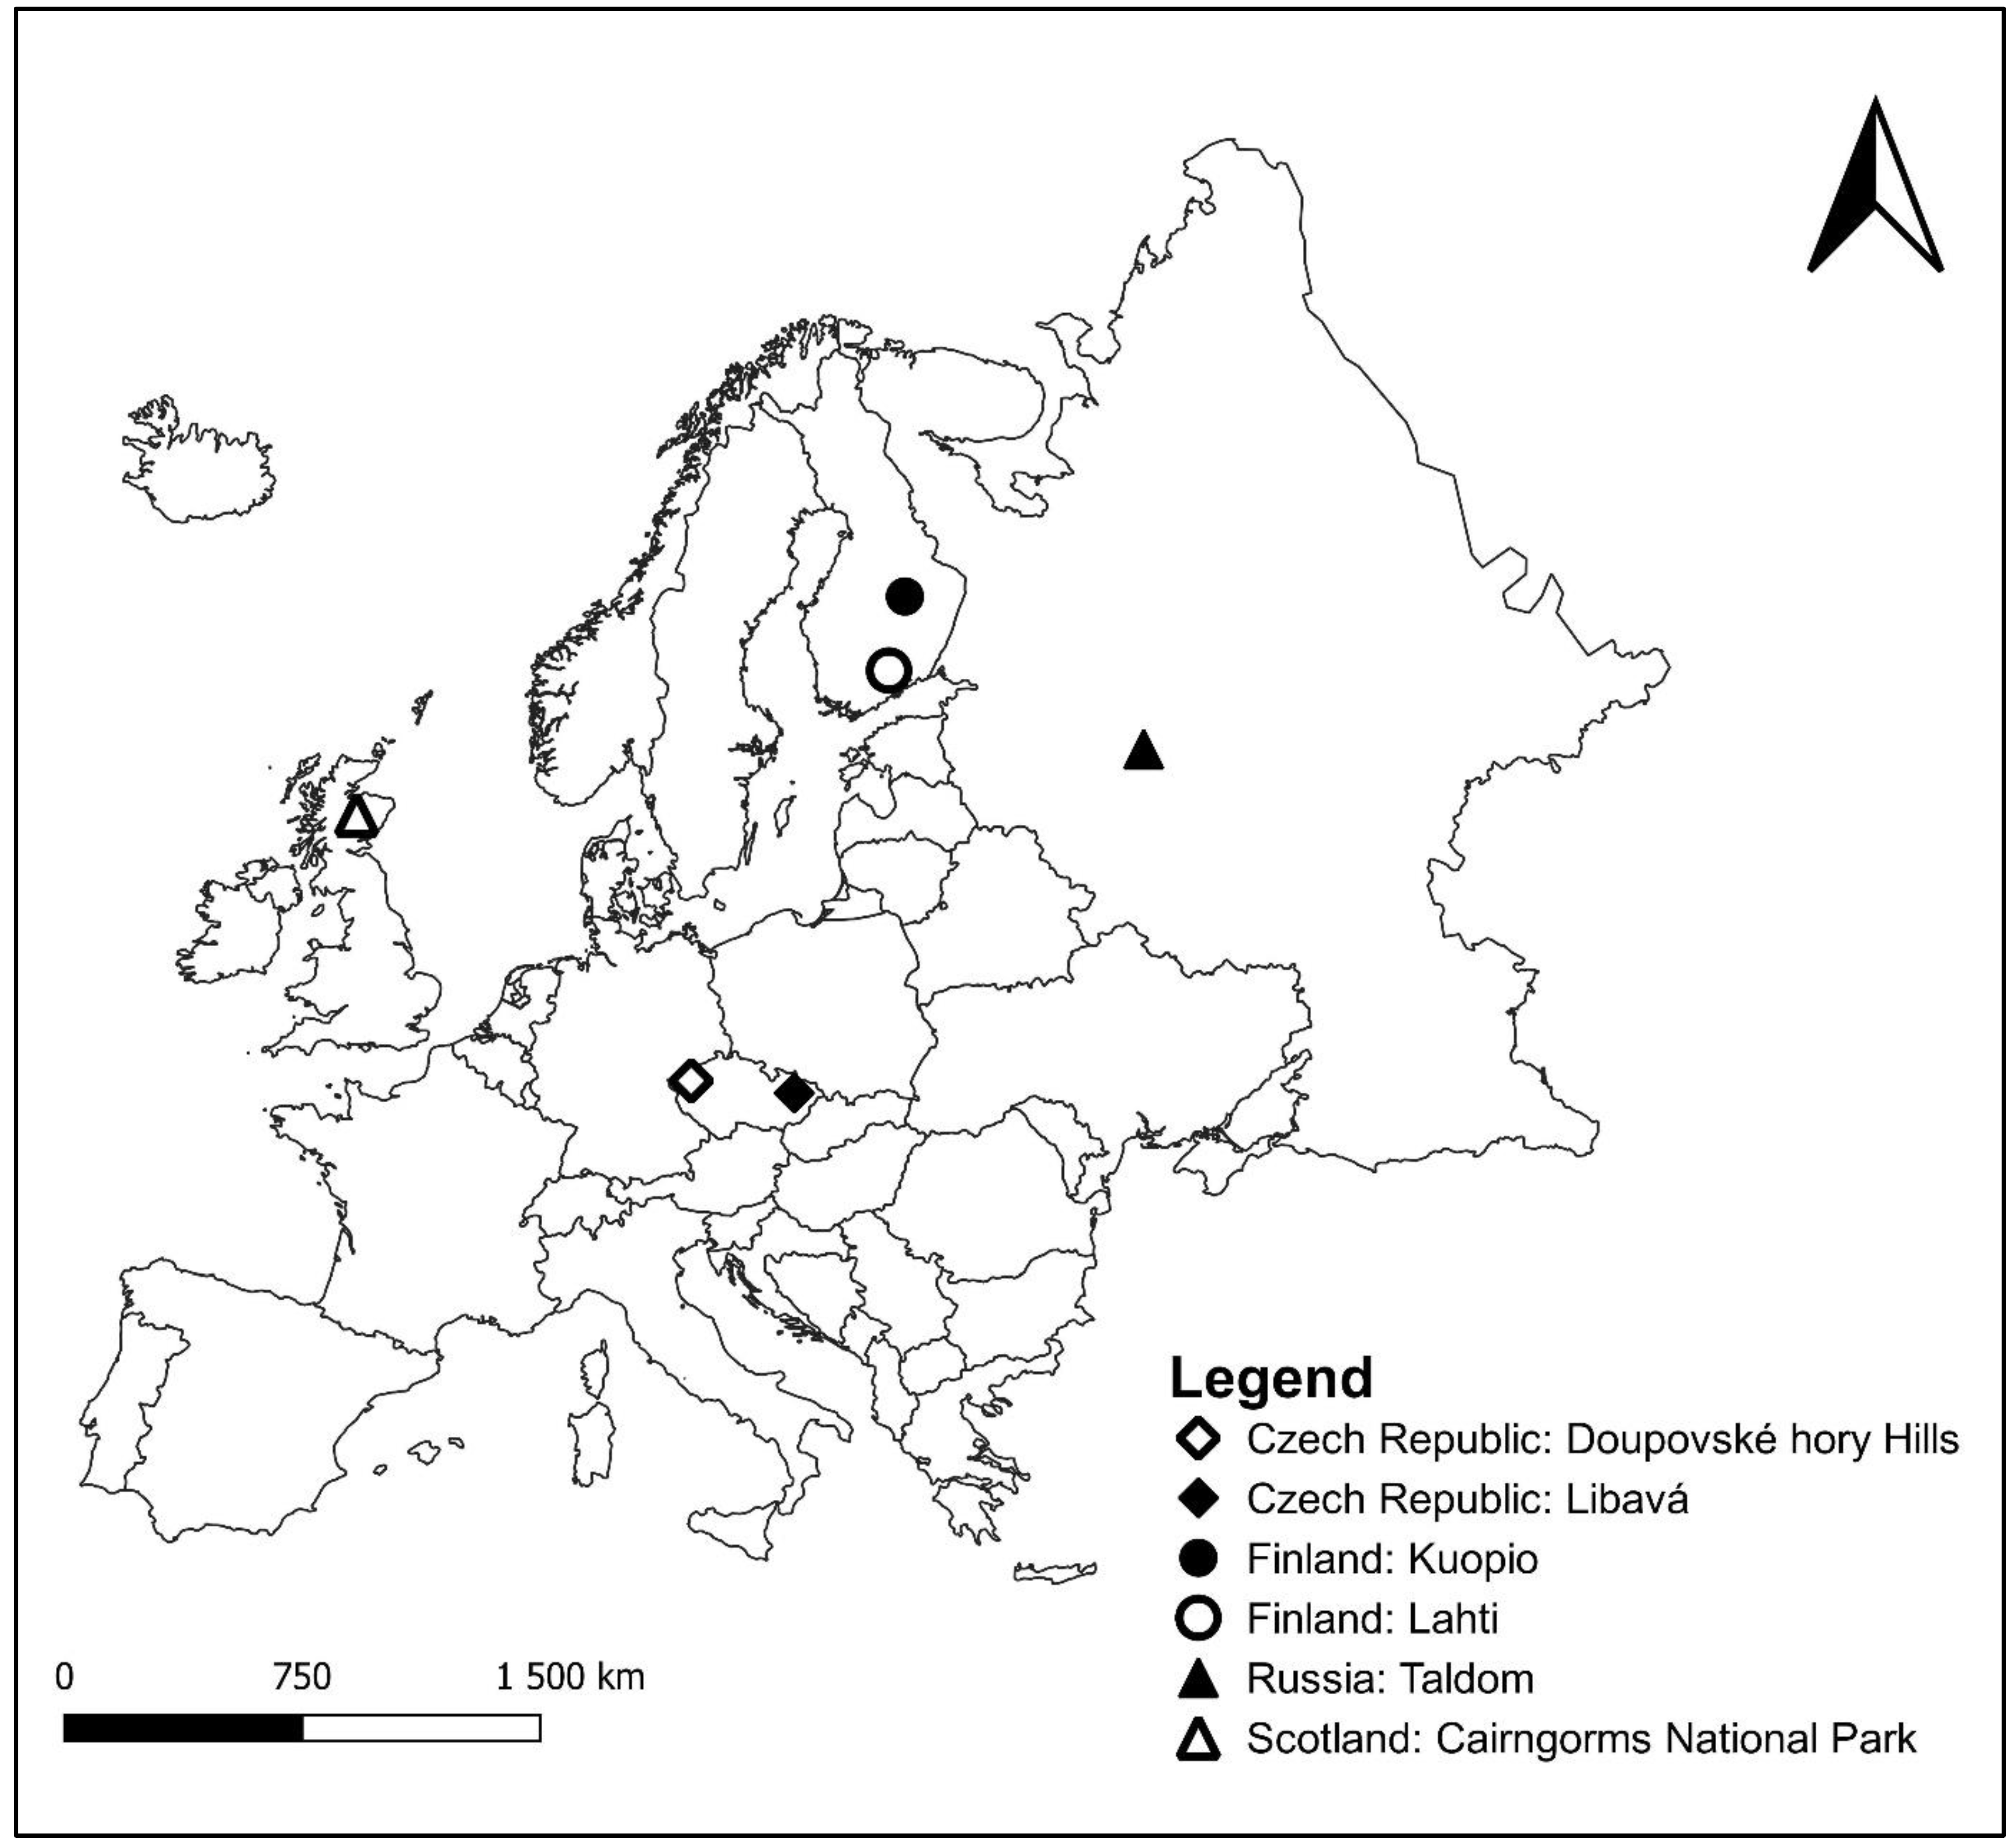
2.1. Study Areas and Recording
2.2. Acoustic Analyses
2.3. Statistical Analyses
3. Results
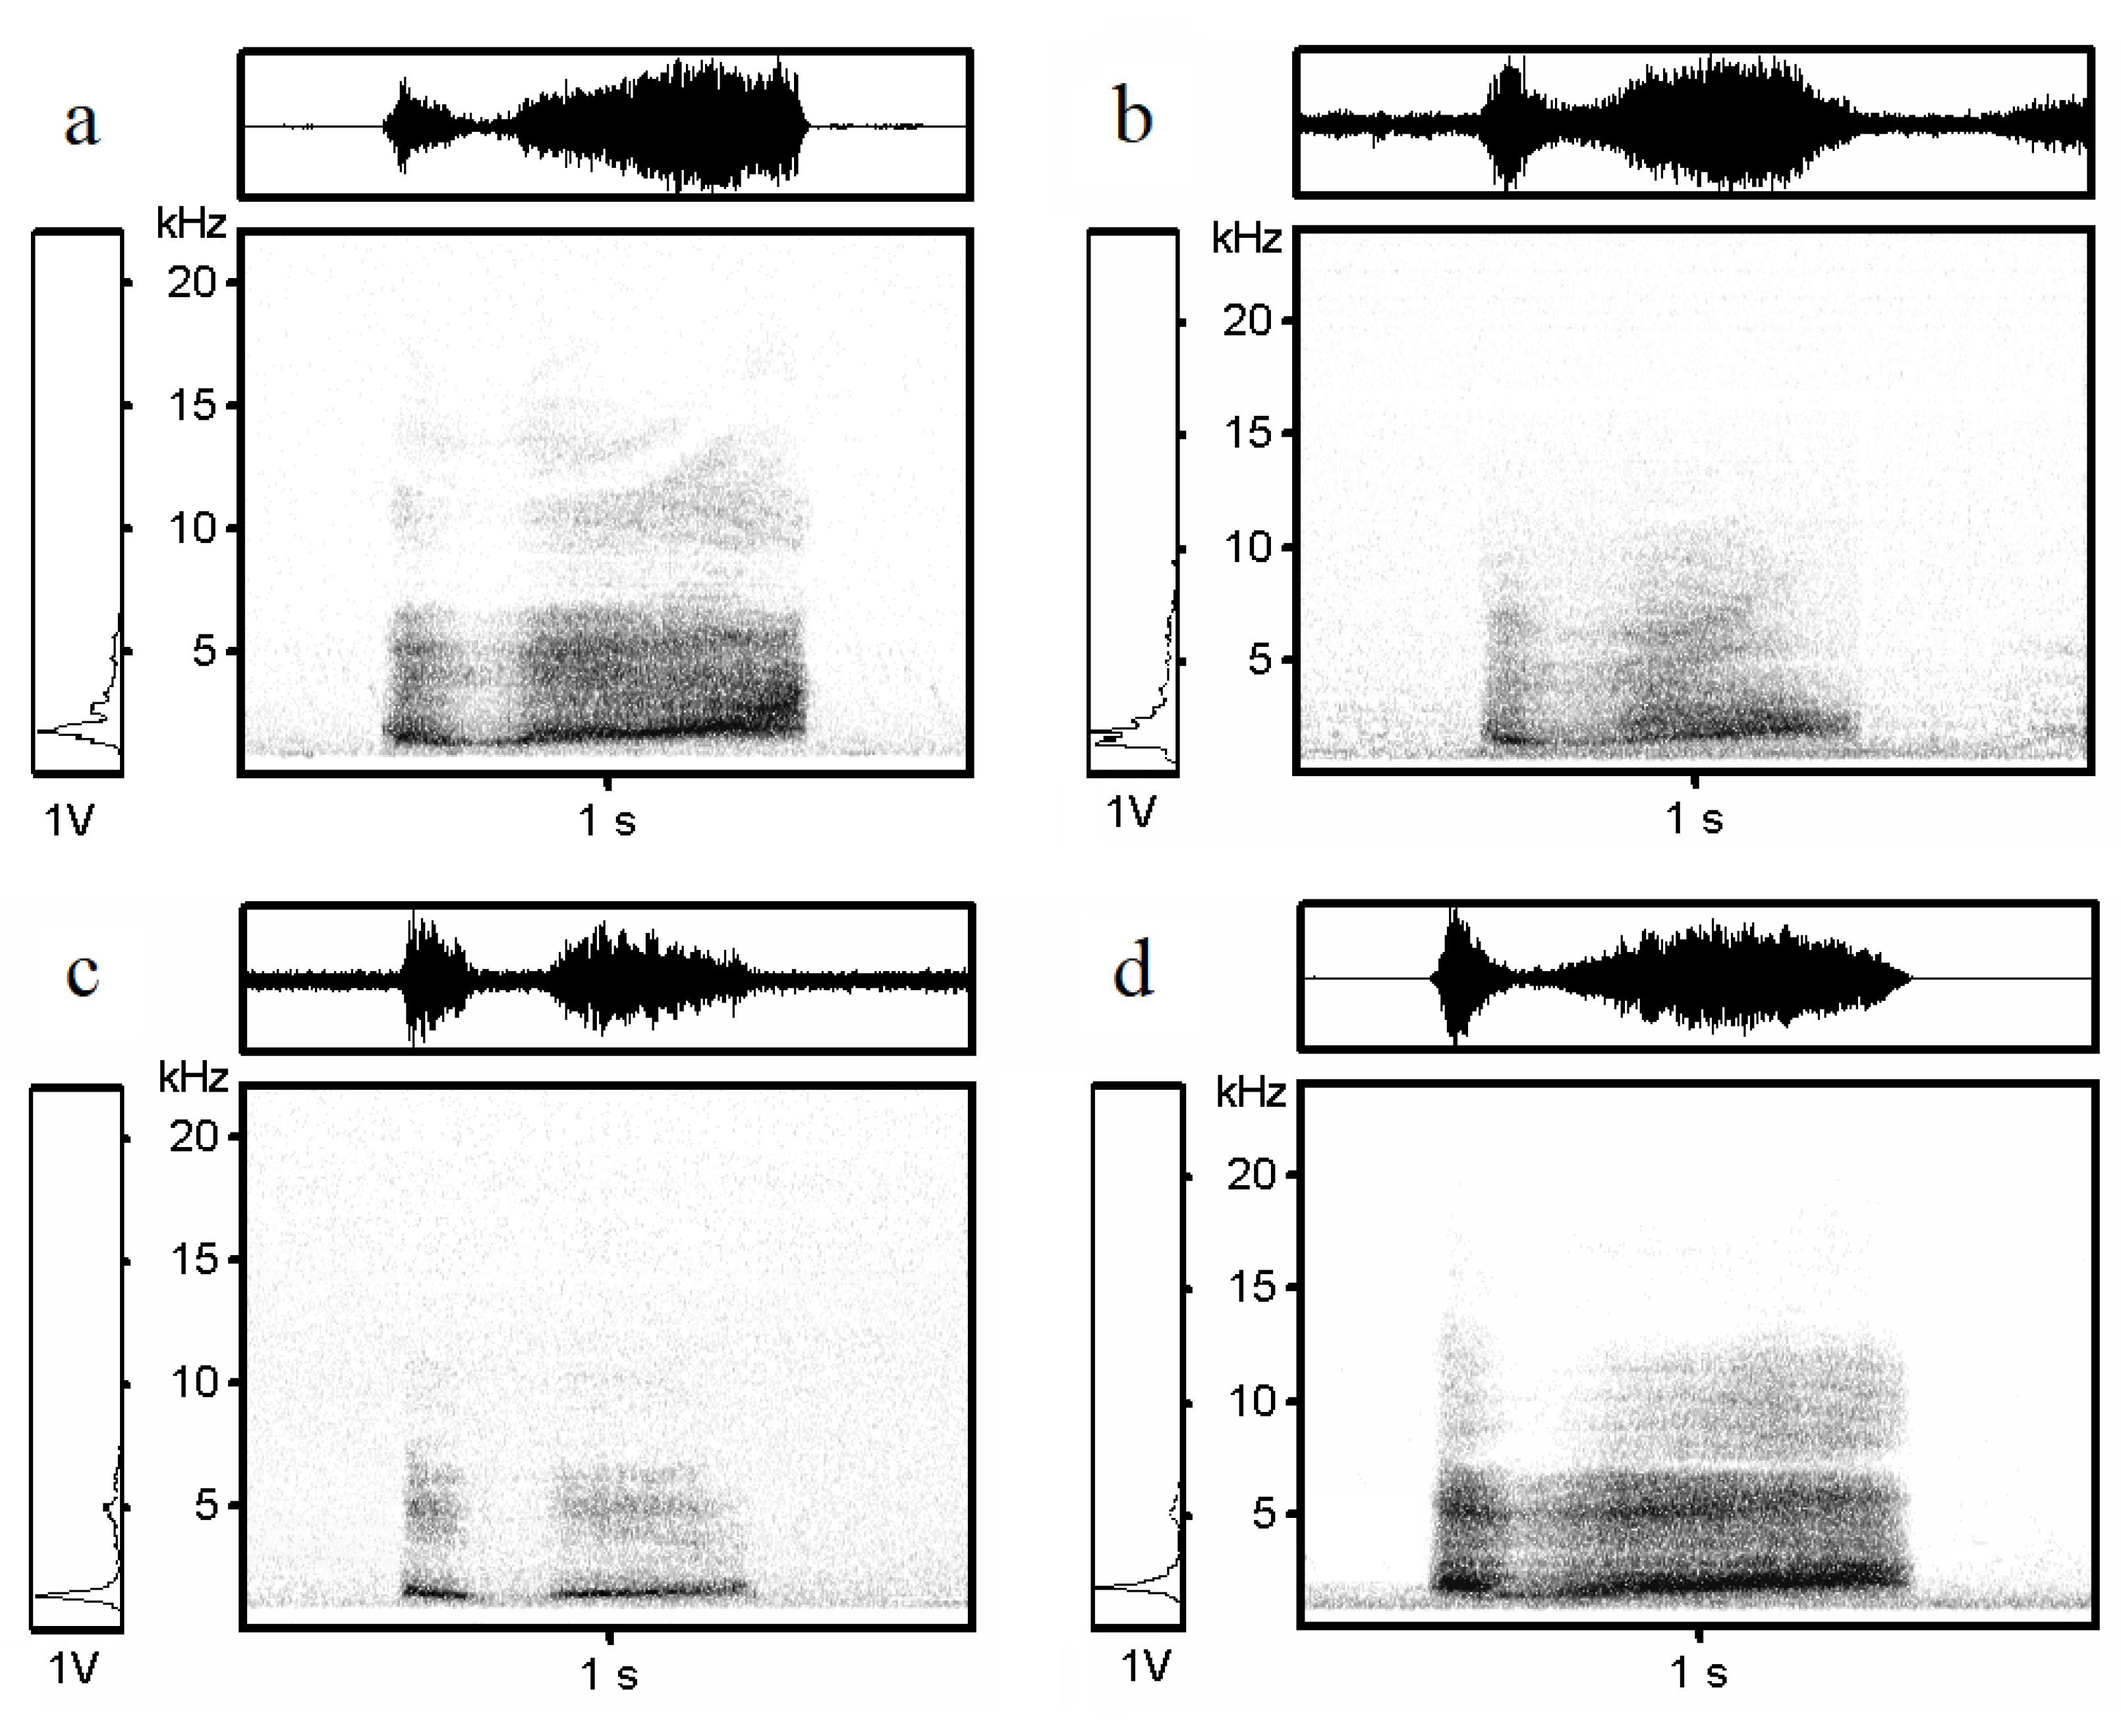
3.1. Hissing Call Description
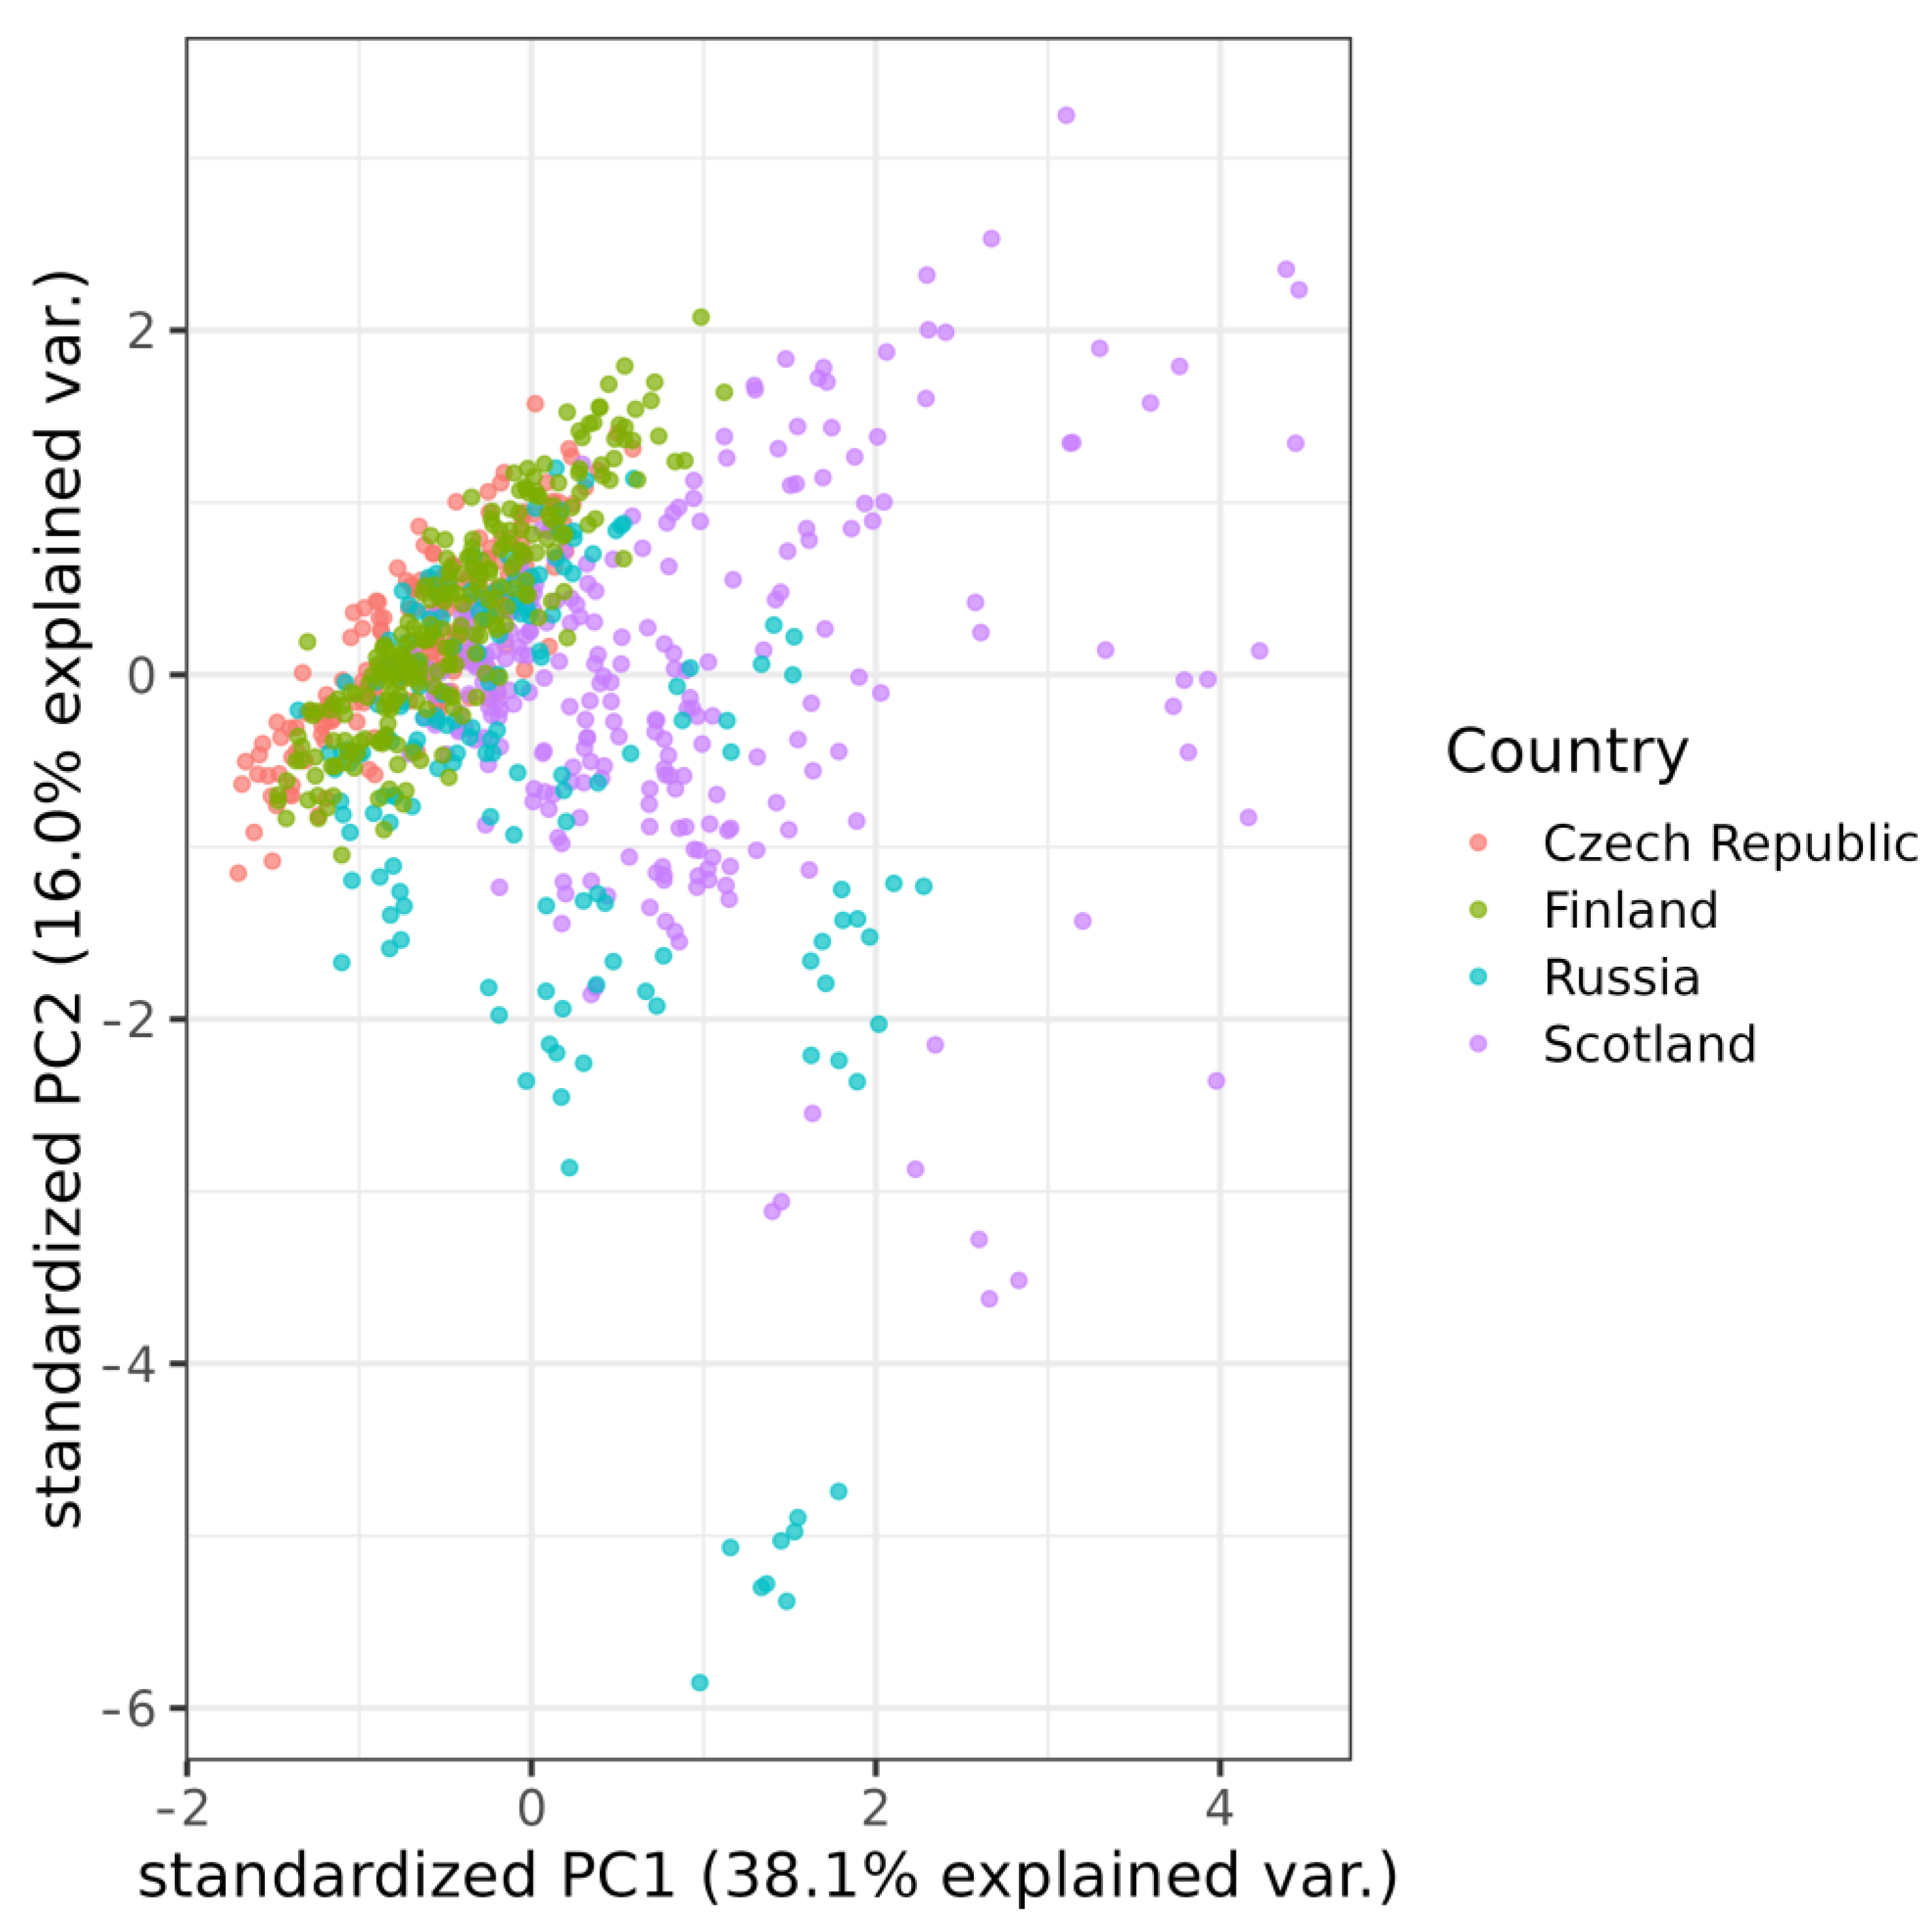
3.2. Geographical Variation
4. Discussion
5. Conclusions
Supplementary Materials
Author Contributions
Funding
Institutional Review Board Statement
Informed Consent Statement
Data Availability Statement
Acknowledgments
Conflicts of Interest
References
- Perrins, C.M. Birds of the Western Palearctic. Nature 1978, 272, 652. [Google Scholar] [CrossRef]
- BirdLife International. Species Factsheet: Lyrurus tetrix. Available online: http://www.birdlife.org (accessed on 21 June 2022).
- Merta, D.; Bobek, B.; Furtek, J.; Kolecki, M. Distribution and Number of Black Grouse, Tetrao tetrix in Southwestern Poland and the Potential Impact of Predators upon Nesting Success of the Species. Folia Zool. 2009, 58, 159–167. [Google Scholar]
- Ludwig, T.; Storch, I.; Graf, R.F. Historic Landscape Change and Habitat Loss: The Case of Black Grouse in Lower Saxony, Germany. Landsc. Ecol. 2009, 24, 533–546. [Google Scholar] [CrossRef]
- Chobot, K.; Němec, M. Red List of Threatened Species of Czech Republic: Vertebrates. Available online: https://portal.nature.cz/publik_syst/ctihtmlpage.php?what=1264] (accessed on 26 November 2021).
- Jahren, T.; Storaas, T.; Willebrand, T.; Moa, P.F.; Hagen, B.R. Declining Reproductive Output in Capercaillie and Black Grouse-16 Countries and 80 Years. Anim. Biol. 2016, 66, 363–400. [Google Scholar] [CrossRef]
- Hoglund, J.; Larsson, J.K.; Jansman, H.A.H.; Segelbacher, G. Genetic Variability in European Black Grouse (Tetrao tetrix). Conserv. Genet. 2007, 8, 239–243. [Google Scholar] [CrossRef]
- Larsson, J.K.; Jansman, H.A.H.; Segelbacher, G.; Hoglund, J.; Koelewijn, H.P. Genetic Impoverishment of the Last Black Grouse (Tetrao tetrix) Population in the Netherlands: Detectable Only with a Reference from the Past. Mol. Ecol. 2008, 17, 1897–1904. [Google Scholar] [CrossRef]
- Rutkowski, R.; Palucki, A.; Dulisz, B.; Ciach, M.; Nowak-Zyczynska, Z.; Kowalewska, K. Conservation Genetics of the Black Grouse Tetrao tetrix in Poland—Distribution of Genetic Diversity among the Last Populations. Acta Ornithol. 2018, 53, 181–204. [Google Scholar] [CrossRef]
- Segelbacher, G.; Strand, T.M.; Quintela, M.; Axelsson, T.; Jansman, H.A.H.; Koelewijn, H.P.; Hoglund, J. Analyses of Historical and Current Populations of Black Grouse in Central Europe Reveal Strong Effects of Genetic Drift and Loss of Genetic Diversity. Conserv. Genet. 2014, 15, 1183–1195. [Google Scholar] [CrossRef]
- Watson, A.; Moss, R. Grouse; Collins New Naturalist Series; Collins: London, UK, 2008; ISBN 9780007150977. [Google Scholar]
- Spidso, T.K.; Hjeljord, O.; Dokk, J.G. Seasonal Mortality of Black Grouse Tetrao tetrix during a Year with Little Snow. Wildl. Biol. 1997, 3, 205–209. [Google Scholar] [CrossRef]
- Storch, I. Conservation Status of Grouse Worldwide: An Update. Wildl. Biol. 2007, 13, 5–12. [Google Scholar] [CrossRef]
- Storch, I. Conservation Status and Threats to Grouse Worldwide: An Overview. Wildl. Biol. 2000, 6, 195–204. [Google Scholar] [CrossRef]
- Kurhinen, J.; Danilov, P.; Gromtsev, A.; Helle, P.; Linden, H. Patterns of Black Grouse, Tetrao tetrix Distribution in Northwestern Russia at the Turn of the Millennium. Folia Zool. 2009, 58, 168–172. [Google Scholar]
- Kvasnes, M.A.J.; Storaas, T.; Pedersen, H.C.; Bjork, S.; Nilsen, E.B. Spatial Dynamics of Norwegian Tetraonid Populations. Ecol. Res. 2010, 25, 367–374. [Google Scholar] [CrossRef]
- Viterbi, R.; Imperio, S.; Alpe, D.; Bosser-peverelli, V.; Provenzale, A. Climatic Control and Population Dynamics of Black Grouse (Tetrao tetrix) in the Western Italian Alps. J. Wildl. Manag. 2015, 79, 156–166. [Google Scholar] [CrossRef]
- White, P.J.C.; Warren, P.; Baines, D. Forest Expansion in Scotland and Its Potential Effects on Black Grouse Tetrao tetrix Conservation. For. Ecol. Manag. 2013, 308, 145–152. [Google Scholar] [CrossRef]
- Jankovska, I.; Bejcek, V.; Langrova, I.; Valek, P.; Vadlejch, J.; Cadkova, Z. Black Grouse in Czech Republic and Its Parasites. Helminthologia 2012, 49, 78–81. [Google Scholar] [CrossRef]
- Charnov, E.L.; Orians, G.H.; Hyatt, K. Ecological Implications of Resource Depression. Am. Nat. 1976, 110, 247–259. [Google Scholar] [CrossRef]
- Korpimaki, E.; Koivunen, V.; Hakkarainen, H. Microhabitat Use and Behavior of Voles under Weasel and Raptor Predation Risk: Predator Facilitation? Behav. Ecol. 1996, 7, 30–34. [Google Scholar] [CrossRef]
- Pekkola, M.; Alatalo, R.; Poysa, H.; Siitari, H. Seasonal Survival of Young and Adult Black Grouse Females in Boreal Forests. Eur. J. Wildl. Res. 2014, 60, 477–488. [Google Scholar] [CrossRef]
- Policht, R.; Hart, V.; Goncharov, D.; Surovy, P.; Hanzal, V.; Cerveny, J.; Burda, H. Vocal Recognition of a Nest-Predator in Black Grouse. PeerJ 2019, 7, 12. [Google Scholar] [CrossRef]
- Summers, R.W.; Green, R.E.; Proctor, R.; Dugan, D.; Lambie, D.; Moncrieff, R.; Moss, R.; Baines, D. An Experimental Study of the Effects of Predation on the Breeding Productivity of Capercaillie and Black Grouse. J. Appl. Ecol. 2004, 41, 513–525. [Google Scholar] [CrossRef]
- Tornberg, R.; Linden, A.; Byholm, P.; Ranta, E.; Valkama, J.; Helle, P.; Linden, H. Coupling in Goshawk and Grouse Population Dynamics in Finland. Oecologia 2013, 171, 863–872. [Google Scholar] [CrossRef] [PubMed]
- Widen, P.; Andren, H.; Angelstam, P.; Lindstrom, E. The Effect of Prey Vulnerability—Goshawk Predation and Population Fluctuations of Small Game. Oikos 1987, 49, 233–235. [Google Scholar] [CrossRef]
- Segelbacher, G.; Hoglund, J.; Storch, I. From Connectivity to Isolation: Genetic Consequences of Population Fragmentation in Capercaillie across Europe. Mol. Ecol. 2003, 12, 1773–1780. [Google Scholar] [CrossRef] [PubMed]
- Formenti, N.; Vigano, R.; Bionda, R.; Ferrari, N.; Cerutti, M.C.; Palme, R.; Lanfranchi, P. Evaluation of the Physiological Stress Response Induced by Winter Sports in a Black Grouse (Tetrao tetrix) Population from Lepontine Alps. Wien. Tierarztl. Mon. 2012, 99, 60–61. [Google Scholar]
- Hess, J.E.; Beck, J.L. Disturbance Factors Influencing Greater Sage-Grouse Lek Abandonment in North-Central Wyoming. J. Wildl. Manag. 2012, 76, 1625–1634. [Google Scholar] [CrossRef]
- Ingold, P. Freizeitäktivitaten im Lebensraum der Alpentiere Konfliktbereiche zwischen Mensch und Tier; mit einem Ratgeber für die Praxis; Haupt: Berlin, Germany, 2005; ISBN 9783258067803 3258067805. [Google Scholar]
- Nichter, A.N.; Lipp, T.W.; Gregory, A.J. A Possible Impact of Anthropogenic Noise on Male Lesser Prairie-Chicken Lek Attendance in Kansas. Grouse News 2017, 54, 6–9. [Google Scholar]
- Storch, I. Human Disturbance of Grouse—Why and When? Wildl. Biol. 2013, 19, 390–403. [Google Scholar] [CrossRef]
- Tost, D.; Strauss, E.; Jung, K.; Siebert, U. Impact of Tourism on Habitat Use of Black Grouse (Tetrao tetrix) in an Isolated Population in Northern Germany. PLoS ONE 2020, 15, e0238660. [Google Scholar] [CrossRef]
- Ludwig, G.X.; Alatalo, R.V.; Helle, P.; Linden, H.; Lindstrom, J.; Siitari, H. Short- and Long-Term Population Dynamical Consequences of Asymmetric Climate Change in Black Grouse. Proc. R. Soc. B Biol. Sci. 2006, 273, 2009–2016. [Google Scholar] [CrossRef]
- Ludwig, G.X.; Alatalo, R.; Helle, P.; Lindstrom, J.; Siitari, H. Population Level Consequences of Temporally Variable Climate Change in Black Grouse. J. Ornithol. 2006, 147, 26. [Google Scholar]
- Warren, P.; White, P.J.C.; Baines, D.; Atterton, F.; Brown, M.J. Variations in Black Grouse Tetrao tetrix Winter Survival in a Year with Prolonged Snow Cover. Bird Study 2013, 60, 257–263. [Google Scholar] [CrossRef]
- Zbinden, N.; Korner-Nievergelt, F.; Tettamanti, F.; Keller, V. Long-term Trends of Reproductive Success of Black Grouse Lyrurus tetrix in the Southern Swiss Alps in Relation to Changes in Climate and Habitat. Wildl. Biol. 2022, 2022, e01022. [Google Scholar] [CrossRef]
- Boon, L. Reintroduction and GPS Tracking of the Black Grouse in the National Park De Hoge Veluwe. Master’s Thesis, Utrecht University, Utrecht, The Netherlands, 2016. [Google Scholar]
- Storch, I. Grouse: Status Survey and Conservation Action Plan 2000–2004; IUCN: Cambridge, UK, 2000; ISBN 2831705193 9782831705194. [Google Scholar]
- Krzywinski, A.; Keller, M.; Krzywinska, K. New Methods for Preservation of Genetic Diversity of Black Grouse, Tetrao tetrix: Preliminary Results. Folia Zool. 2009, 58, 150–158. [Google Scholar]
- Zeitler, A. Maintaining Black Grouse Wintering Habitats by Alpine Pasture Management Plans. Sylvia 2003, 39, 97–102. [Google Scholar]
- Baillie, S.R. Monitoring Terrestrial Breeding Bird Populations. In Monitoring for Conservation and Ecology; Springer: Dordrecht, The Netherlands, 1991; ISBN 978-94-011-3086-8. [Google Scholar]
- Hancock, M.; Baines, D.; Gibbons, D.; Etheridge, B.; Shepherd, M. Status of Male Black Grouse Tetrao tetrix in Britain in 1995–96. Bird Study 1999, 46, 1–15. [Google Scholar] [CrossRef]
- Arnesen, C.H.; Johnsen, C.B.; Costanzi, J.M.; Rosell, F. Canines (Canis lupus familiaris) as Biodetectors for Conservation Work: Can They Discriminate the Rock Ptarmigan (Lagopus muta) from the Willow Grouse (L. lagopus) in a Yes/No Task? PLoS ONE 2020, 15, e0228143. [Google Scholar] [CrossRef]
- Laiolo, P.; Vogeli, M.; Serrano, D.; Tella, J.L. Testing Acoustic versus Physical Marking: Two Complementary Methods for Individual-Based Monitoring of Elusive Species. J. Avian Biol. 2007, 38, 672–681. [Google Scholar] [CrossRef]
- Bergmann, H.-H.; Klaus, S. Distribution, Status and Limiting Factors of Black Grouse (Tetrao tetrix) in Central Europe, Particularly in Germany, Including an Evaluation of Reintroductions. Gibier Faune Sauvag. Game Wildl. 1994, 11, 99–122. [Google Scholar]
- Ten Den, P.G.A.; Niewold, F.J.J. The Black Grouse in the Netherlands: Monitoring the Last (?) Surviving Population. Cah d’Ethol 2000, 20, 299–310. [Google Scholar]
- Loneux, M.; Lindsey, J.K.; Vandiepenbeeck, M.; Charlet, O.; Keulen, C.; Poncin, P.; Ruwet, J.-C. Climatic Influence on Black Grouse Population Dynamic in Belgian Hautes-Fagnes Nature Reserve: An Update. Sylvia 2003, 39, 53–57. [Google Scholar]
- Ciach, M. Rapid Decline of an Isolated Population of the Black Grouse Tetrao tetrix: The Crisis at the Southern Limit of the Range. Eur. J. Wildl. Res. 2015, 61, 623–627. [Google Scholar] [CrossRef]
- Cramp, S. Handbook of the Birds of Europe, the Middle East and North Africa: The Birds of the Western Palearctic. Vol. 3, Waders to Gulls; Oxford University Press: Oxford, UK, 1983; ISBN 0198575068. [Google Scholar]
- Fitch, W.T.; Hauser, M.D. Unpacking “Honesty”: Vertebrate Vocal Production and the Evolution of Acoustic Signals. In Acoustic Communication; Simmons, A.M., Fay, R.R., Popper, A.N., Eds.; Springer: New York, NY, USA, 2003; pp. 65–137. ISBN 978-0-387-22762-7. [Google Scholar]
- Hovi, M.; Alatalo, R.V.; Halonen, M.; Lundberg, A. Responses of Male and Female Black Grouse to Male Vocal Display. Ethology 1997, 103, 1032–1041. [Google Scholar] [CrossRef]
- Hambalkova, L.; Policht, R.; Horak, J.; Hart, V. Acoustic Individuality in the Hissing Calls of the Male Black Grouse (Lyrurus tetrix). PeerJ 2021, 9, e11837. [Google Scholar] [CrossRef]
- Caizergues, A.; Dubois, S.; Mondor, G.; Loiseau, A.; Ellison, L.N.; Rasplus, J.Y. Genetic Structure of Black Grouse (Tetrao tetrix) Populations of the French Alps. Genet. Sel. Evol. 2001, 33, S177–S191. [Google Scholar] [CrossRef]
- Borecha, D.E.; Willebrand, T.; Nielsen, O.K. Lek Site Defines Annual Spatial Use of Male Black Grouse (Tetrao tetrix). Ornis Fenn. 2017, 94, 150–160. [Google Scholar]
- Nature Conservation Agency of the Czech Republic. The Rare Black Grouse Is (Still) at Home in the Jizera Mountains. Press Release. 2019. Available online: https://lesycr.cz/tiskova-zprava/vzacny-tetrivek-obecny-je-v-jizerskych-horach-jeste-doma/ (accessed on 7 February 2022).
- Sim, I.M.W.; Eaton, M.A.; Setchfield, R.P.; Warren, P.K.; Lindley, P. Abundance of Male Black Grouse Tetrao tetrix in Britain in 2005, and Change since 1995–96. Bird Study 2008, 55, 304–313. [Google Scholar] [CrossRef]
- NatureGate. Available online: https://luontoportti.com/en/t/753/black-grouse (accessed on 7 February 2022).
- Federal Center for the Development of Hunting. Number of Hunting Resources. Available online: http://www.ohotcontrol.ru/resource/number/ (accessed on 7 February 2022).
- Robisson, P. Roles of Pitch and Duration in the Disrimination of the Mate’s Call in the King Penguin Aptenodytes Patagonicus. Bioacoustics 1992, 4, 25–36. [Google Scholar] [CrossRef]
- Langin, K.M.; Sillett, T.S.; Morrison, S.A.; Ghalambor, C.K. Bill Morphology and Neutral Genetic Structure Both Predict Variation in Acoustic Signals within a Bird Population. Behav. Ecol. 2017, 28, 866–873. [Google Scholar] [CrossRef]
- Luttrell, S.A.M.; Lohr, B. Geographic Variation in Call Structure, Likelihood, and Call-Song Associations across Subspecies Boundaries, Migratory Patterns, and Habitat Types in the Marsh Wren (Cistothorus palustris). Auk Ornithol. Adv. 2018, 135, 127–151. [Google Scholar] [CrossRef]
- Yandell, D.D.; Hochachka, W.M.; Pruett-Jones, S.; Webster, M.S.; Greig, E.I. Geographic Patterns of Song Variation in Four Species of Malurus Fairy-Wrens. J. Avian Biol. 2018, 49, 15. [Google Scholar] [CrossRef]
- Kirschel, A.N.G.; Seddon, N.; Tobias, J.A. Range-Wide Spatial Mapping Reveals Convergent Character Displacement of Bird Song. Proc. R. Soc. B Biol. Sci. 2019, 286, 8. [Google Scholar] [CrossRef]
- Sementili-Cardoso, G.; Rodrigues, F.G.; Martins, R.M.; Gerotti, R.W.; Vianna, R.M.; Donatelli, R.J. Variation among Vocalizations of Taraba Major (Aves: Thamnophilidae) Subspecies. Stud. Neotrop. Fauna Environ. 2018, 53, 120–131. [Google Scholar] [CrossRef]
- Araya-Salas, M.; Smith-Vidaurre, G.; Mennill, D.J.; Gonzalez-Gomez, P.L.; Cahill, J.; Wright, T.F. Social Group Signatures in Hummingbird Displays Provide Evidence of Co-Occurrence of Vocal and Visual Learning. Proc. R. Soc. B Biol. Sci. 2019, 286, 9. [Google Scholar] [CrossRef] [PubMed]
- Budka, M.; Osiejuk, T.S. Microgeographic Call Variation in a Non-Learning Species, the Corncrake (Crex crex). J. Ornithol. 2017, 158, 651–658. [Google Scholar] [CrossRef]
- Lynch, M.A.; Lynch, H.J. Variation in the Ecstatic Display Call of the Gentoo Penguin (Pygoscelis papua) across Regional Geographic Scales. Auk Ornithol. Adv. 2017, 134, 894–902. [Google Scholar] [CrossRef]
- Salinas-Melgoza, A.; Renton, K. Geographic Variation in Vocalisations of the Military Macaw in Western Mexico. Bioacoustics 2021, 30, 197–214. [Google Scholar] [CrossRef]
- Wright, T.F.; Dahlin, C.R. Vocal Dialects in Parrots: Patterns and Processes of Cultural Evolution. Emu-Austral Ornithol. 2018, 118, 50–66. [Google Scholar] [CrossRef]
- Sparling, D.W. Evidence for Vocal Learning in Prairie Grouse. Wilson Bull. 1979, 91, 618–621. [Google Scholar]
- Wright, T.F. Regional Dialects in the Contact Call of a Parrot. Proc. R. Soc. B Biol. Sci. 1996, 263, 867–872. [Google Scholar] [CrossRef]
- Baker, M.C. Cultural Diversification in the Flight Call of the Ringneck Parrot in Western Australia. Condor 2000, 102, 905–910. [Google Scholar] [CrossRef]
- Guerra, J.E.; Cruz-Nieto, J.; Ortiz-Maciel, S.G.; Wright, T.F. Limited Geographic Variation in the Vocalizations of the Endangered Thick-Billed Parrot: Implications for Conservation strategies. Condor 2008, 110, 639–647. [Google Scholar] [CrossRef] [PubMed]
- Bradbury, J.W.; Cortopassi, K.A.; Clemmons, J.R. Geographical Variation in the Contact Calls of Orange-Fronted Parakeets. Auk 2001, 118, 958–972. [Google Scholar] [CrossRef]
- Duque, C.C. Population Genetic Structure of Black Grouse (Tetrao tetrix): From a Large to a Fine Scale Perspective. Ph. D. Thesis, Acta Universitatis Upsaliensis, Uppsala, Sweden, 2011. Digital Comprehensive Summaries of Uppsala Dissertations from the Faculty of Science and Technology. [Google Scholar]
- Hoglund, J.; Larsson, J.K.; Corrales, C.; Santafe, G.; Baines, D.; Segelbacher, G. Genetic Structure among Black Grouse in Britain: Implications for Designing Conservation Units. Anim. Conserv. 2011, 14, 400–408. [Google Scholar] [CrossRef]
- Sittenthaler, M.; Kunz, F.; Szymusik, A.; Grunschachner-Berger, V.; Krumbock, S.; Stauffer, C.; Nopp-Mayr, U. Fine-Scale Genetic Structure in an Eastern Alpine Black Grouse Tetrao tetrix Metapopulation. J. Avian Biol. 2018, 49, jav-01681. [Google Scholar] [CrossRef]


| Country | Estimated Population (Lekking Males) | Location of Study | Males (n) | Calls (n) | ID of Males |
|---|---|---|---|---|---|
| Czech Republic | 355 | Libavá, Doupovské hory Hills | 20 | 176 | 1–20 |
| Scotland | 3400 | Cairngorms National Park | 17 | 262 | 21–37 |
| Russia | 11.3 mil. | Taldom | 18 | 169 | 38–55 |
| Finland | 425,000 | Lahti, Kuopio | 27 | 246 | 56–82 |
| Total | 82 | 853 |
| Acoustic Parameter Name | Abbreviations/Units | Description |
|---|---|---|
| Low Frequency | Low Freq (Hz) | The lower frequency bound of the selection. |
| * High Frequency | High Freq (Hz) | The upper frequency bound of the selection. |
| * Aggregate Entropy | Agg Entropy (bits) | The aggregate entropy measures the disorder in a sound by analyzing the energy distribution. A pure tone concentrated in only one frequency level corresponds to zero value. Disordered sound that spans more than one frequency level corresponds to higher entropy values. It corresponds to the overall disorder in the sound. |
| Average Entropy | Avg Entropy (bits) | This entropy is calculated by finding the entropy for each frame in the signal and then taking the average of these values. |
| Bandwidth 50% | BW 50% (Hz) | The difference between the 25% and 75% frequencies. |
| Bandwidth 90% | BW 90% (Hz) | The difference between the 5% and 95% frequencies. |
| Center Frequency | Center Freq (Hz) | The frequency that divides the selection into two frequency intervals of equal energy. |
| Center Time | Center Time (s) | The point in time at which the selection is divided into two time intervals of equal energy. |
| Relative Center Time | Center Time Rel, | The point in time at which the selection is divided into two time intervals of equal energy relative to the signal duration. |
| Delta Frequency | Delta Freq (Hz) | The difference between the upper and lower frequency limits of the selection. |
| * Delta Time | Delta Time (s) | The difference between Begin Time and End Time for the selection. |
| * Duration 50% | Dur 50% (s) | The difference between the 25% and 75% times. |
| Duration 90% | Dur 90% (s) | The difference between the 5% and 95% times. |
| * Frequency 25% | Freq 25% (Hz) | The frequency that divides the selection into two frequency intervals containing 25% and 75% of the energy in the signal. |
| * Frequency 5% | Freq 5% (Hz) | The frequency that divides the selection into two frequency intervals containing 5% and 95% of the energy in the signal. |
| * Frequency 95% | Freq 95% (Hz) | The frequency that divides the selection into two frequency intervals containing 95% and 5% of the energy in the signal. |
| Length | Length (frames) | The number of frames contained in a selection. For waveform views, the number of frames equals the number of samples in a single channel. For spectrogram and spectrogram slice views, the number of frames equals the number of individual spectra in the selection in one channel. For selection spectrum views, the number of frames always equals 1. |
| Maximum Entropy | Max Entropy (bits) | Maximum entropy calculated from each frame. |
| Maximum Frequency | Max Freq (Hz) | The frequency at which Max Power occurs within the selection. |
| Maximum Time | Max Time (s) | The first time in the selection at which a spectrogram point with power equal to Max Power/Peak Power occurs. |
| * Minimum Entropy | Min Entropy (bits) | The minimum entropy calculated for a spectrogram slice within the selection bounds. |
| Relative Peak Time | Peak Time Rel (s) | The first time in the selection at which a sample with amplitude equal to Peak Amplitude occurs. |
| Time 25% | Time 25% (s) | The time that divides the signal into two time intervals containing 25% and 75% of the energy in the signal. |
| * Relative Time 25% | Time 25% Rel (s) | The time that divides the signal into two time intervals containing 25% and 75% of the energy in the signal relative to signal duration. |
| Time 5% | Time 5% (s) | The time that divides the signal into two time intervals containing 5% and 95% of the energy in the signal. |
| * Relative Time 5% | Time 5% Rel, | The time that divides the signal into two time intervals containing 5% and 95% of the energy in the signal relative to signal duration. |
| Time 75% | Time 75% (s) | The time that divides the signal into two time intervals containing 75% and 25% of the energy in the signal. |
| Relative Time 75% | Time 75% Rel, | The time that divides the signal into two time intervals containing 75% and 25% of the energy in the signal relative to signal duration. |
| * Time 95% | Time 95% (s) | The time that divides the signal into two time intervals containing 95% and 5% of the energy in the signal. |
| * Relative Time 95% | Time 95% Rel, | The time that divides the signal into two time intervals containing 95% and 5% of the energy in the signal relative to signal duration. |
| Variable | DFA | Mean | Min | Max | SE | Mean CVw | CVa | PIC |
|---|---|---|---|---|---|---|---|---|
| Low Frequency | 834.97 | 0.00 | 1411.77 | 171.74 | 10.34 | 20.57 | 1.99 | |
| High Frequency | X | 2464.05 | 1523.80 | 4637.68 | 435.49 | 5.81 | 17.67 | 3.04 |
| Agg Entropy | X | 3.16 | 1.89 | 4.81 | 0.55 | 7.31 | 17.48 | 2.39 |
| Avg Entropy | 2.70 | 1.86 | 4.00 | 0.35 | 5.15 | 12.94 | 2.51 | |
| BW 50% | 287.38 | 86.13 | 1125.00 | 173.59 | 31.14 | 60.41 | 1.94 | |
| BW 90% | 794.41 | 258.40 | 2156.25 | 340.44 | 18.47 | 42.85 | 2.32 | |
| Center Frequency | 1580.29 | 775.20 | 3375.00 | 280.88 | 4.72 | 17.77 | 3.76 | |
| Center Time | 400.08 | 0.41 | 3476.43 | 571.01 | 49.42 | 142.72 | 2.89 | |
| Center Time Relative | 0.48 | 0.06 | 0.84 | 0.17 | 25.75 | 35.47 | 1.38 | |
| Delta Frequency | 1629.08 | 761.89 | 3478.26 | 400.54 | 9.96 | 24.59 | 2.47 | |
| Delta Time | X | 1.00 | 0.47 | 1.52 | 0.16 | 9.66 | 15.57 | 1.61 |
| Duration 50% | X | 0.42 | 0.04 | 0.77 | 0.14 | 25.83 | 32.88 | 1.27 |
| Duration 90% | 0.75 | 0.29 | 1.18 | 0.13 | 11.50 | 17.62 | 1.53 | |
| Frequency 25% | X | 1442.80 | 187.50 | 3000.00 | 239.46 | 5.73 | 16.60 | 2.90 |
| Frequency 5% | X | 1222.17 | 0.00 | 2250.00 | 218.52 | 8.36 | 17.88 | 2.14 |
| Frequency 95% | X | 2016.58 | 1291.99 | 4218.75 | 426.80 | 5.80 | 21.16 | 3.65 |
| Length | 188.50 | 89.00 | 467.00 | 41.32 | 9.67 | 21.92 | 2.27 | |
| Maximum Entropy | 3.71 | 2.95 | 4.83 | 0.29 | 3.73 | 7.92 | 2.12 | |
| Maximum Frequency | 1557.99 | 562.50 | 3468.75 | 296.88 | 7.42 | 19.06 | 2.57 | |
| Maximum Time | 399.91 | 0.21 | 3476.39 | 570.99 | 49.48 | 142.78 | 2.89 | |
| Minimum Entropy | X | 1.54 | 0.18 | 2.83 | 0.31 | 10.26 | 20.07 | 1.96 |
| Peak Time Relative | 0.30 | 0.01 | 0.93 | 0.28 | 67.33 | 90.52 | 1.34 | |
| Time 25% | 399.85 | 0.29 | 3476.30 | 571.01 | 49.52 | 142.81 | 2.88 | |
| Time 25% Relative | X | 0.24 | 0.05 | 0.66 | 0.16 | 43.52 | 66.79 | 1.53 |
| Time 5% | 399.68 | 0.17 | 3475.92 | 570.99 | 49.61 | 142.86 | 2.88 | |
| Time 5% Relative | X | 0.08 | 0.01 | 0.50 | 0.05 | 25.30 | 61.34 | 2.42 |
| Time 75% | 400.27 | 0.79 | 3476.53 | 571.01 | 49.33 | 142.66 | 2.89 | |
| Time 75% Relative | 0.67 | 0.11 | 0.89 | 0.10 | 10.14 | 15.29 | 1.51 | |
| Time 95% | X | 400.43 | 0.96 | 3476.66 | 571.01 | 49.25 | 142.60 | 2.90 |
| Time 95% Relative | X | 0.83 | 0.51 | 0.97 | 0.06 | 4.81 | 6.96 | 1.45 |
Disclaimer/Publisher’s Note: The statements, opinions and data contained in all publications are solely those of the individual author(s) and contributor(s) and not of MDPI and/or the editor(s). MDPI and/or the editor(s) disclaim responsibility for any injury to people or property resulting from any ideas, methods, instructions or products referred to in the content. |
© 2023 by the authors. Licensee MDPI, Basel, Switzerland. This article is an open access article distributed under the terms and conditions of the Creative Commons Attribution (CC BY) license (https://creativecommons.org/licenses/by/4.0/).
Share and Cite
Hambálková, L.; Policht, R.; Cukor, J.; Hart, V.; Ševčík, R. Black Grouse Hissing Calls Show Geographic Variability across the Distribution Area. Animals 2023, 13, 1844. https://doi.org/10.3390/ani13111844
Hambálková L, Policht R, Cukor J, Hart V, Ševčík R. Black Grouse Hissing Calls Show Geographic Variability across the Distribution Area. Animals. 2023; 13(11):1844. https://doi.org/10.3390/ani13111844
Chicago/Turabian StyleHambálková, Lucie, Richard Policht, Jan Cukor, Vlastimil Hart, and Richard Ševčík. 2023. "Black Grouse Hissing Calls Show Geographic Variability across the Distribution Area" Animals 13, no. 11: 1844. https://doi.org/10.3390/ani13111844