
Stray and Owner-Relinquished Cats in Australia—Estimation of Numbers Entering Municipal Pounds, Shelters and Rescue Groups and Their Outcomes

Abstract
:Simple Summary
Abstract
1. Introduction
1.1. Statistics from Australia
1.2. Statistics from USA and UK
1.3. Knowledge Gap and Aims
2. Materials and Methods
2.1. Organizations
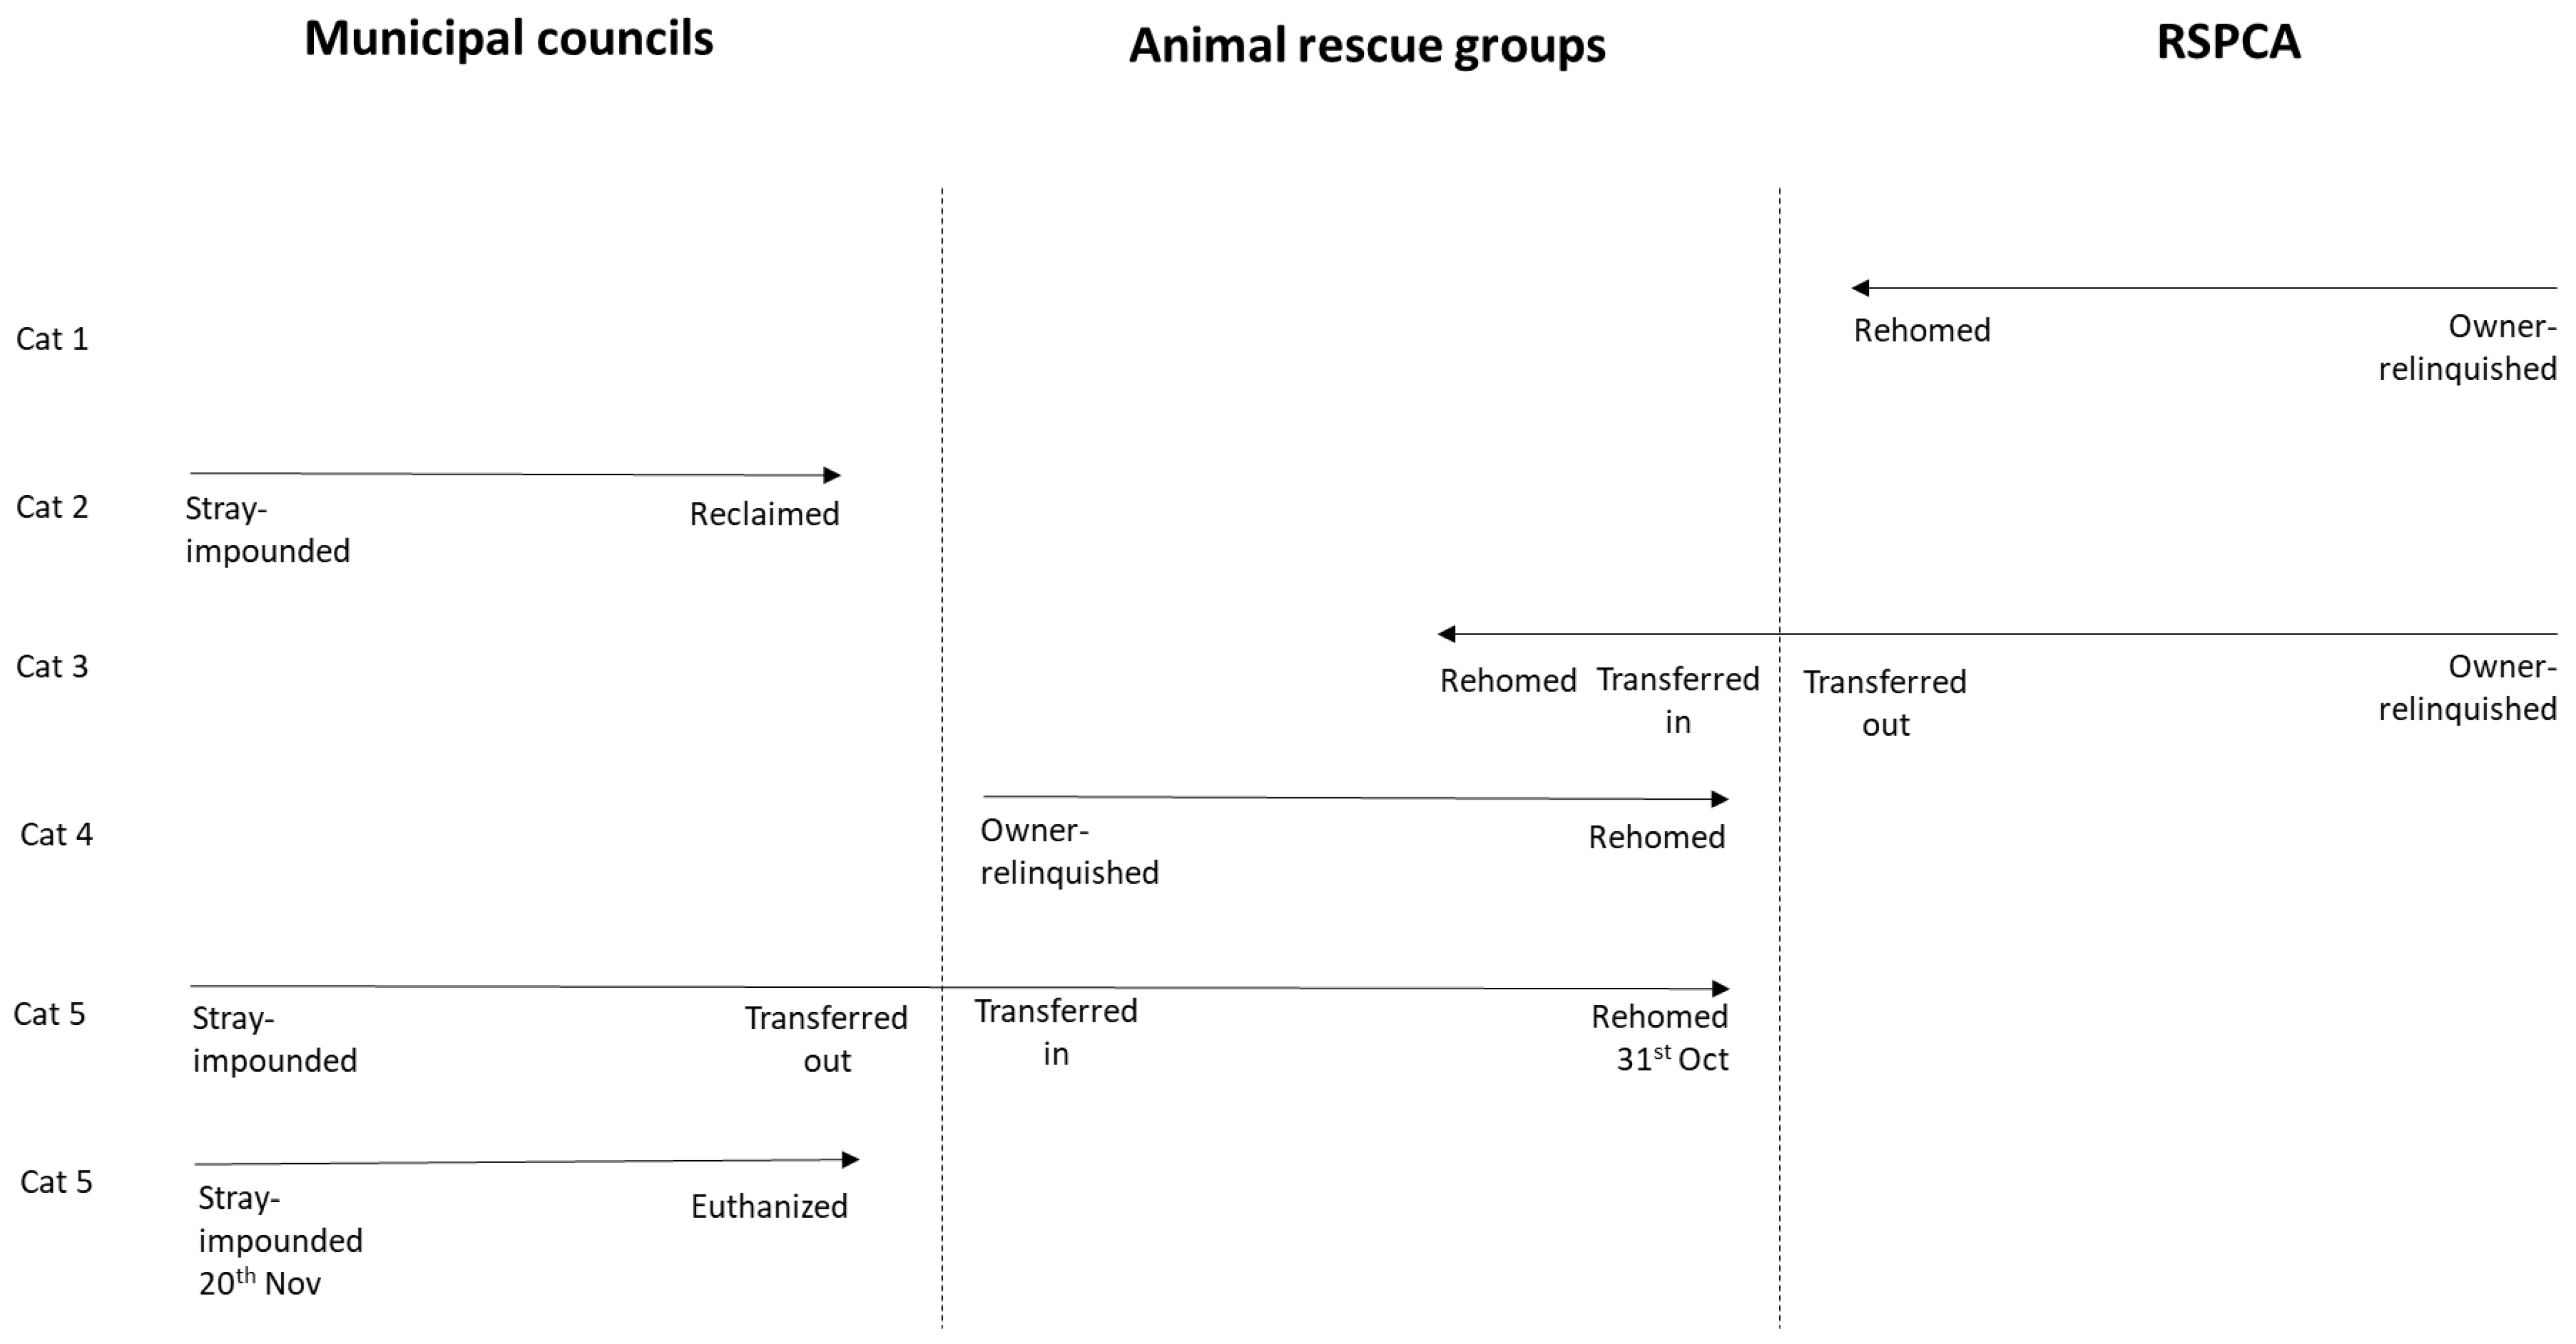
2.2. Definitions of Admission, Intake and Outcomes
2.3. Data Collection
Data Requested from Municipal Councils
- If the council took in and managed reclaiming (return to owner) and/or rehoming of cats, using its own facility/facilities (i.e., managed one or more pounds for cats);
- Agencies into which any cats were transferred.
2.4. Estimation of Unavailable Council Data
2.5. Animal Rescue Groups
2.6. Calculation of Intake, Admission and Outcome Statistics
2.6.1. Total Numbers of Admissions
2.6.2. Outcomes
2.7. Association between Human Resident Population or Urban Status and Intake per 1000 Residents and Outcomes
3. Results
3.1. Availability of Data and Contributions of Imputed Data
3.2. National Results
3.3. Comparisons between States/Territories
3.4. Comparisons within Organizations between States/Territories
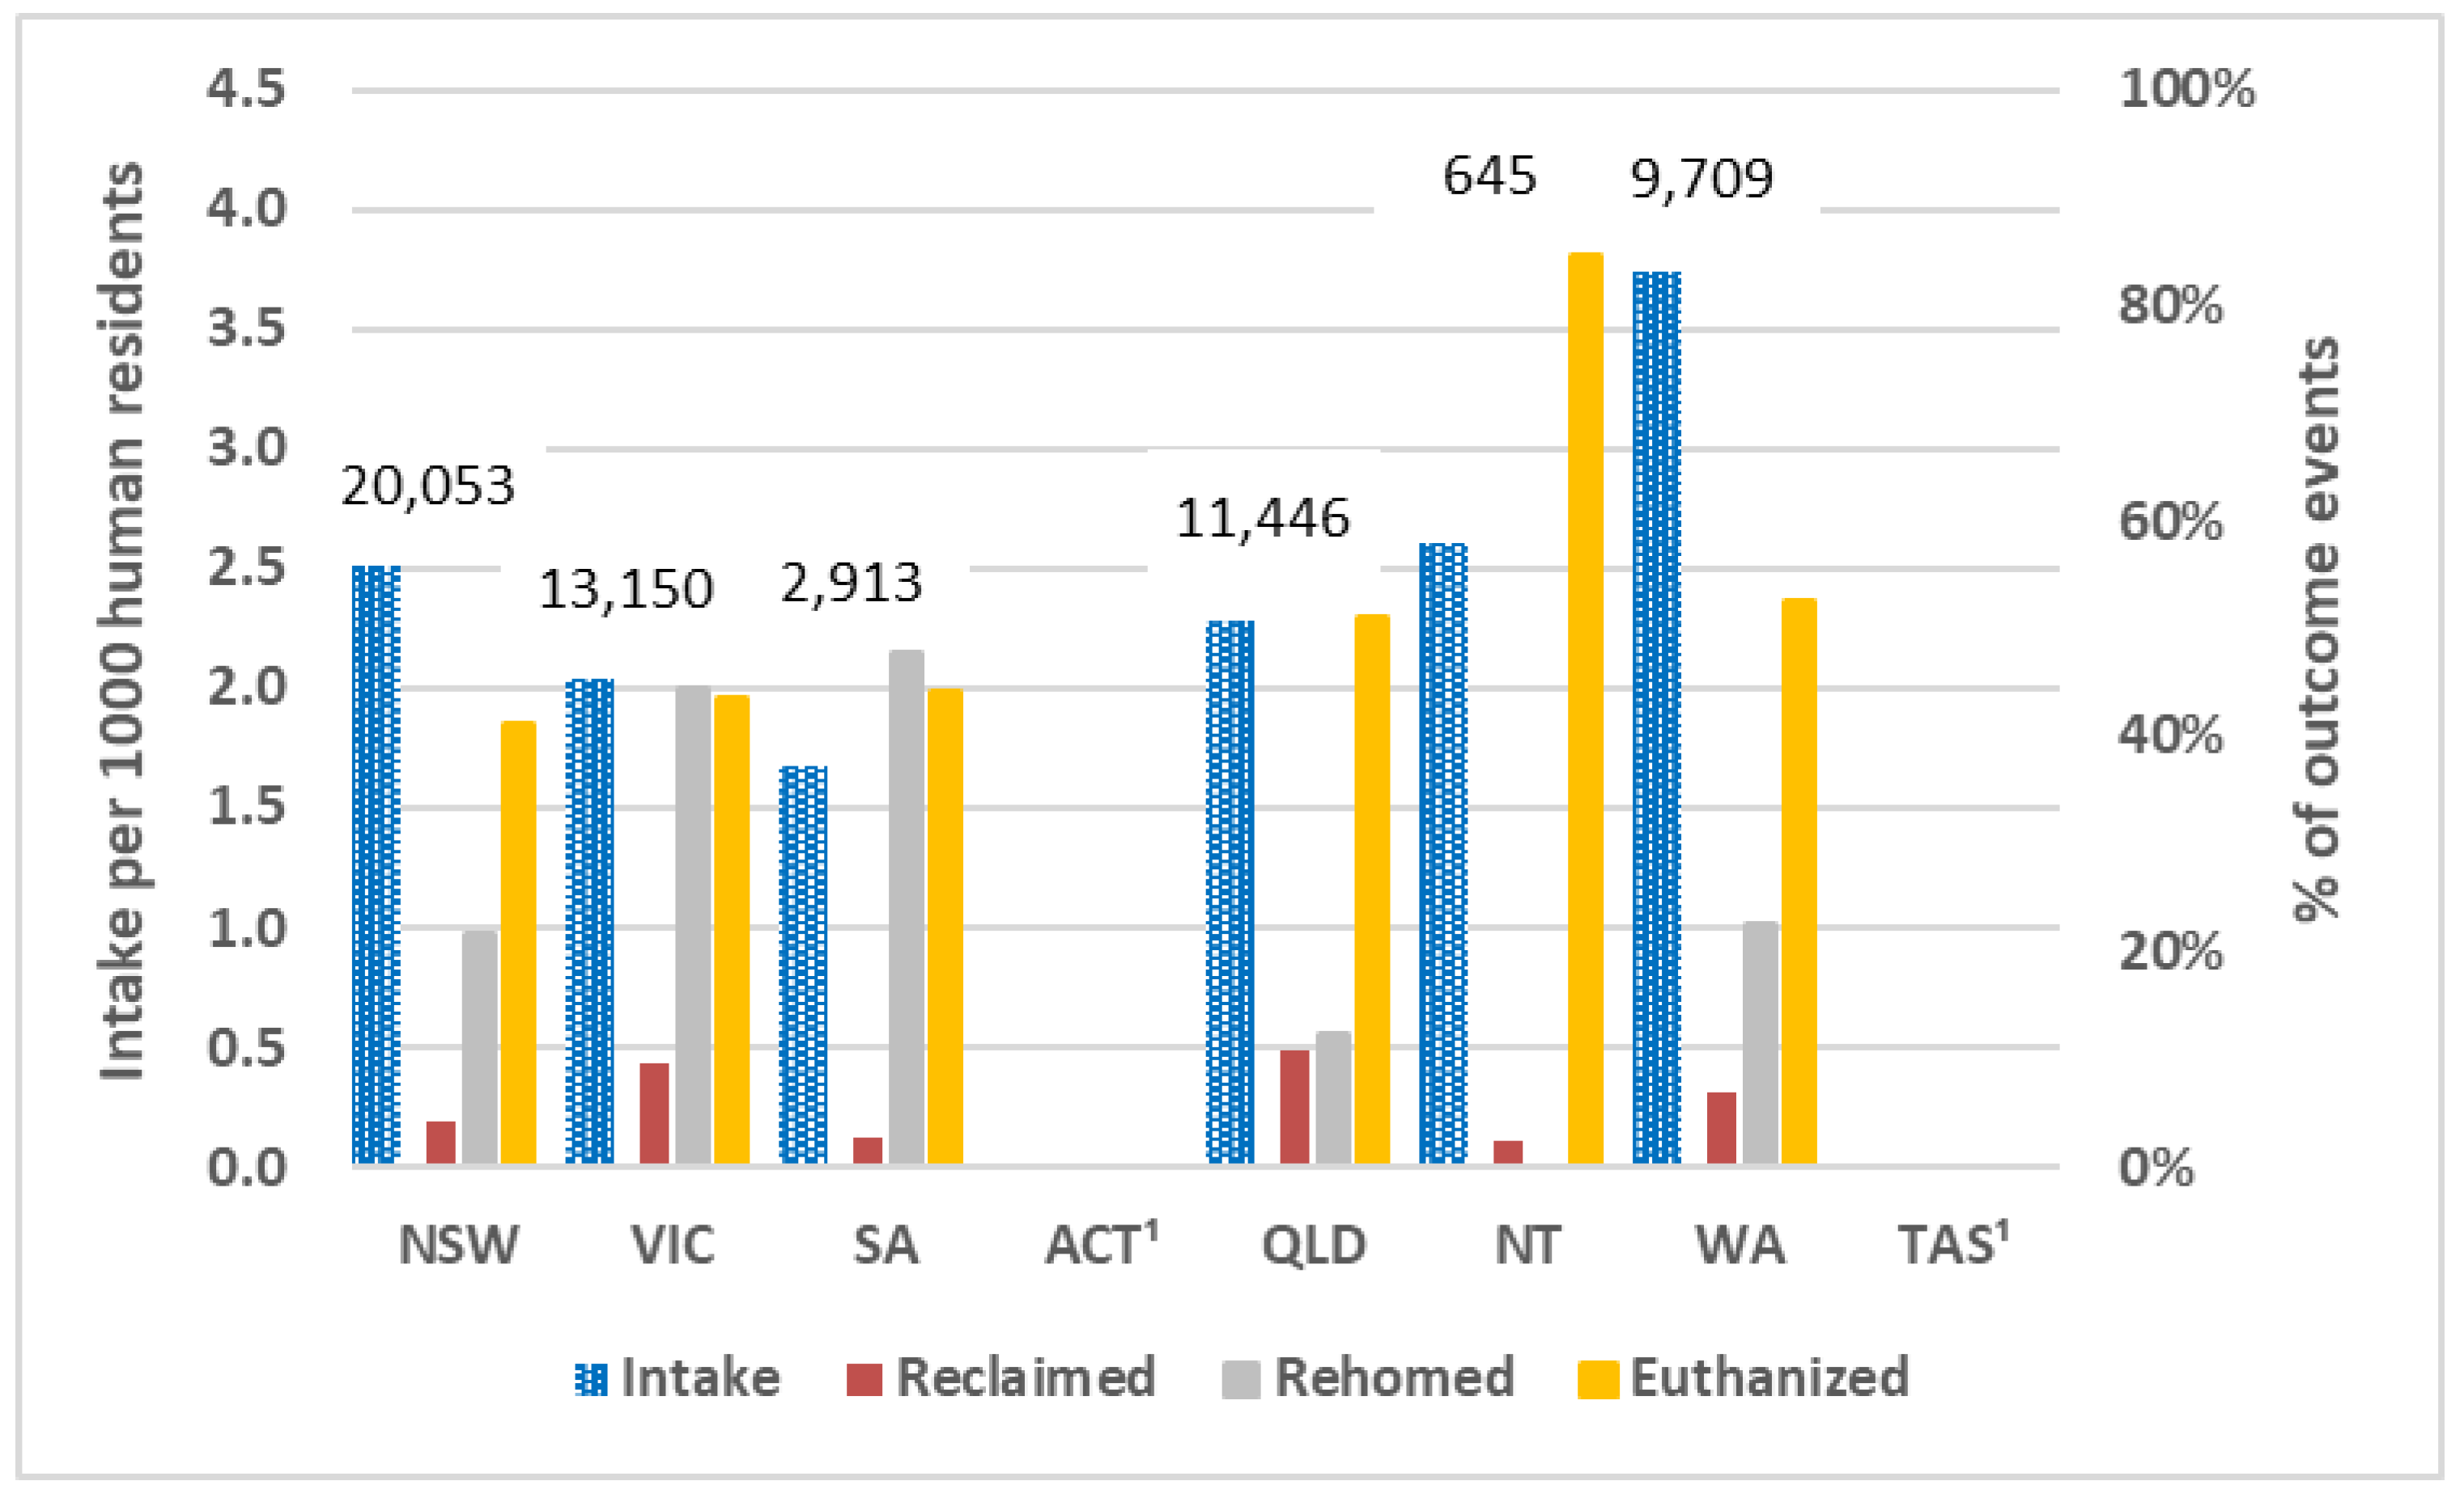
3.4.1. Municipal Councils
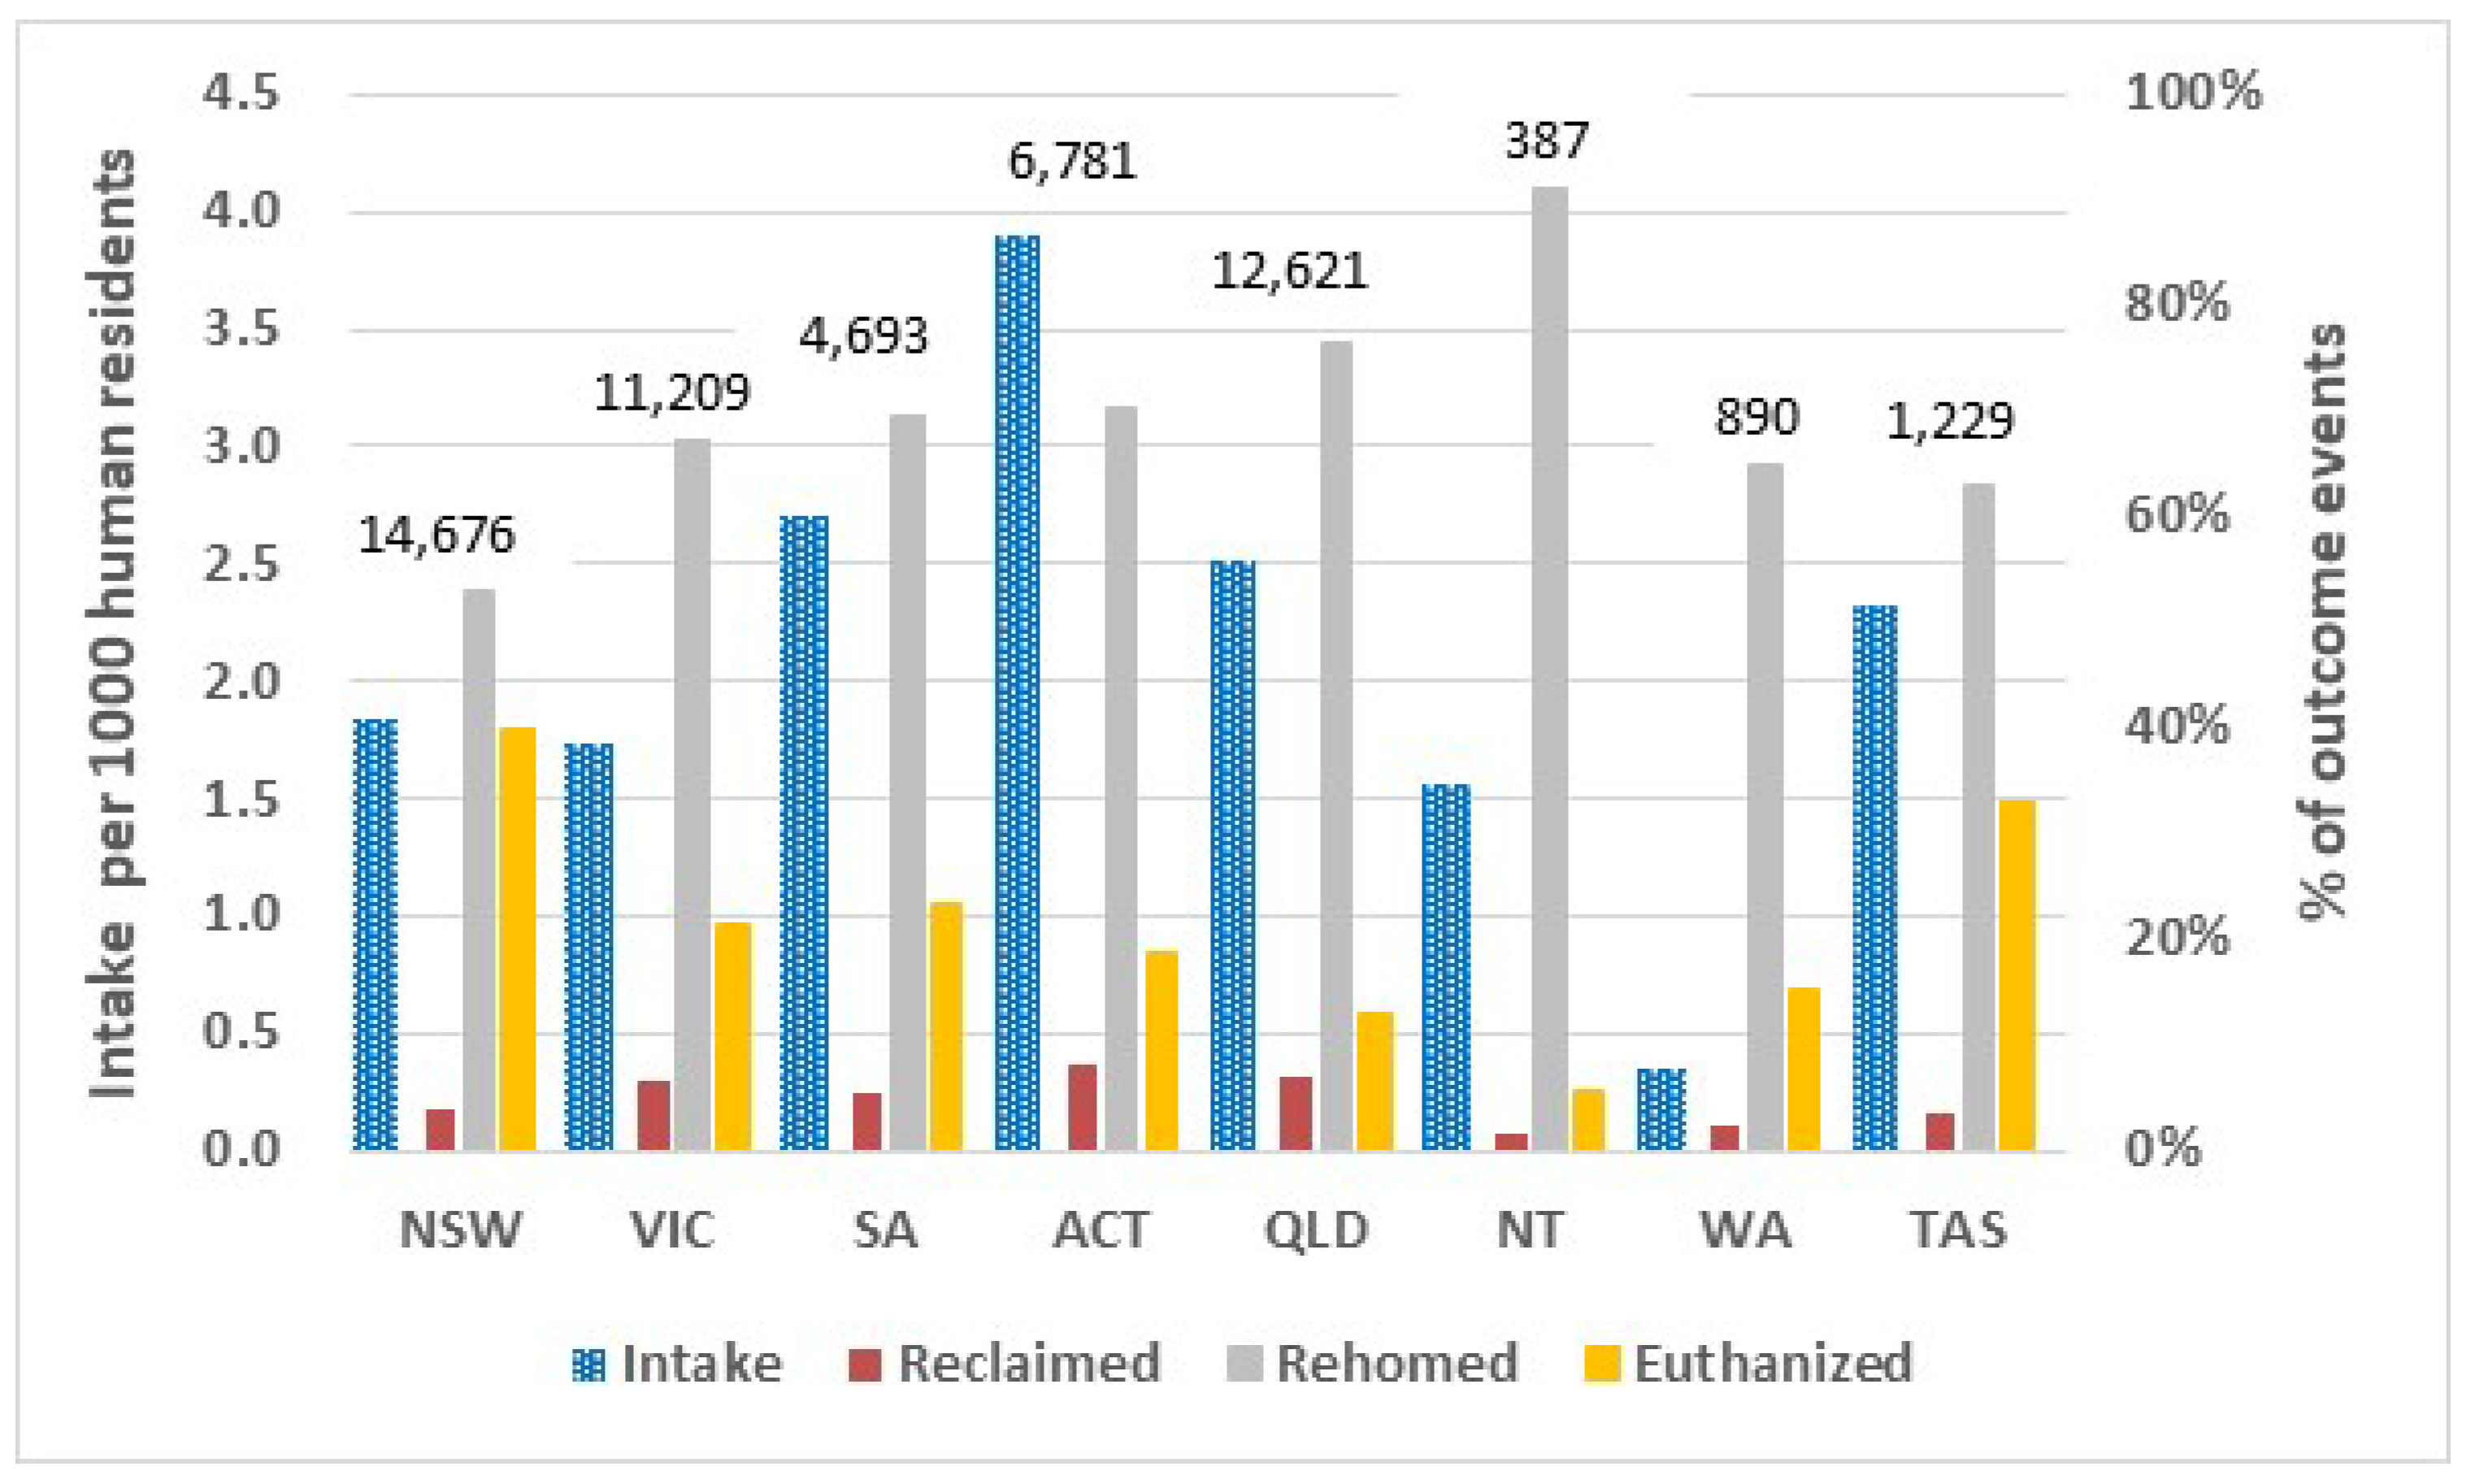
3.4.2. RSPCA
3.4.3. Other Welfare Organizations
3.4.4. Rescue Groups
3.5. Trends over Time
3.6. Associations between Each of Council Urban Status and Human Resident Population with Intake, and Percentages of Unclaimed Outcomes That Were (a) Rehomed and (b) Euthanized
4. Discussion
4.1. National Admissions and Intakes
4.2. Admissions by State/Territory
4.3. Intakes by Agency
4.4. Strategies to Reduce Intakes and Admission Rates
4.5. National Reclaim Rate
4.6. Reclaim by State/Territory
4.7. Reclaim by Agency
4.8. Strategies to Increase Reclaim Rates
4.9. National Rehome Rates and by State and Agency
4.10. Strategies to Increase Rehoming Rate
4.11. Role of Rescue Groups in Reducing Numbers Euthanized
4.12. Euthanasia—National, by State and Agency
5. Limitations of the Study
5.1. Quality and Availability of Data
5.1.1. Municipal Councils
5.1.2. Welfare Agencies
5.1.3. Rescue Groups
5.2. Lack of Transparency
6. Conclusions
Author Contributions
Funding
Institutional Review Board Statement
Informed Consent Statement
Data Availability Statement
Acknowledgments
Conflicts of Interest
Appendix A


| States/Territory | Organizations Whose Data Were Publicly Available or That Provided Data on Request | Animal Welfare Organizations and Rescue Groups (Not Listed with PetRescue or NSW Government) and Whose Data Were Not Publicly Available and Were Approached but Did Not Provide Data |
|---|---|---|
| New South Wales | RSPCA Animal Welfare League Sydney Cats and Dogs Home Cat Protection Society Pets For Life | Animal Adoption Agency Happy Paws SoCares Charmhaven Animal Facility Mini Kitty Commune |
| Victoria | RSPCA Animal Aid Victoria Lost Dogs Home Lort Smith Animal Hospital (Animal Welfare League) Cat Protection Society Geelong Animal Welfare Society | Australian Animal Protection Society Bendigo Animal Welfare and Community Services Blue Cross Animal Society Mount Alexander Animal Welfare Pets Haven Save A Dog Second Chance Animal Rescue Inc. |
| South Australia | RSPCA Animal Welfare League | Lucky Little Paws Moorook Animal Shelter Wilde Cat Cottage |
| Australian Capital Territory | RSPCA | |
| Queensland * | RSPCA Animal Welfare League | Paw and Claw Port Douglas Sunshine Coast Animal Refuge Warwick Animal Welfare |
| Northern Territory | RSPCA | PAWS (Darwin) Alice Springs Animal Shelter |
| Western Australia | RSPCA Cat Haven | Animal Protection Society Armadale Community Animal Rescue Celebrity PetRescue |
| Tasmania | RSPCA Just Cats Ten Lives |
| Methods for Imputing Intake and Outcome Numbers for Western Australia and South Australia | |
|---|---|
| Western Australia |
|
| South Australia |
|
| Discrepancies in Numbers for Council and Animal Welfare Organizations |
|
| Discrepancies in Animal Rescue Group Intakes |
|
References
- Zito, S.; Morton, J.; Vankan, D.; Paterson, M.; Bennett, P.C.; Rand, J.; Phillips, C.J.C. Reasons People Surrender Unowned and Owned Cats to Australian Animal Shelters and Barriers to Assuming Ownership of Unowned Cats. J. Appl. Anim. Welf. Sci. 2016, 19, 303–319. [Google Scholar] [CrossRef] [PubMed]
- Clark, C.C.; Gruffydd-Jones, T.; Murray, J.K. Number of Cats and Dogs in UK Welfare Organisations. Vet. Rec. 2012, 170, 493. [Google Scholar] [CrossRef] [PubMed]
- Rand, J.; Fisher, G.; Lamb, K.; Hayward, A. Public Opinions on Strategies for Managing Stray Cats and Predictors of Opposition to Trap-Neuter and Return in Brisbane, Australia. Front. Vet. Sci. 2019, 5, 290. [Google Scholar] [CrossRef] [PubMed]
- Legge, S.; Read, J.L.; Taggart, P.L.; Dickman, C.R. Cat-Dependent Diseases Cost Australia AU $ 6 Billion per Year through Impacts on Human Health and Livestock Production. Wildl. Res. 2020, 47, 731–746. [Google Scholar] [CrossRef]
- Woinarski, J.C.Z.; Legge, S.M.; Dickman, C.R. Cats in Australia: Companion and Killer; CSIRO Publishing: Clayton South, VIC, Australia, 2019; ISBN 9781486308439. [Google Scholar]
- Rand, J.; Lancaster, E.; Inwood, G.; Cluderay, C.; Marston, L. Strategies to Reduce the Euthanasia of Impounded Dogs and Cats Used by Councils in Victoria, Australia. Animals 2018, 8, 100. [Google Scholar] [CrossRef]
- Andrukonis, A.; Hall, N.J.; Protopopova, A. The Impact of Caring and Killing on Physiological and Psychometric Measures of Stress in Animal Shelter Employees: A Pilot Study. Int. J. Environ. Res. Public. Health 2020, 17, 9196. [Google Scholar] [CrossRef]
- Andrukonis, A.; Protopopova, A. Occupational Health of Animal Shelter Employees by Live Release Rate, Shelter Type, and Euthanasia-Related Decision. Anthrozoos 2020, 33, 119–131. [Google Scholar] [CrossRef]
- McGreevy, P.D.; Fawcett, A.; Johnson, J.; Freire, R.; Collins, T.; Degeling, C.; Fisher, A.D.; Hazel, S.J.; Hood, J.; Lloyd, J.K.F.; et al. Review of the Online One Welfare Portal: Shared Curriculum Resources for Veterinary Undergraduate Learning and Teaching in Animal Welfare and Ethics. Animals 2020, 10, 1341. [Google Scholar] [CrossRef]
- Pinillos, R.G. ‘One Welfare’: A Framework to Support the Implementation of OIE Animal Welfare Standards. OEI Anim. Welf. Bull. 2017, 2017, 3–8. [Google Scholar] [CrossRef]
- Pinillos, R.G. One Welfare: A Framework to Improve Animal Welfare and Human Well-Being; CABI: Wallingford, UK, 2018; ISBN 9781786393845. [Google Scholar]
- Animal Welfare Victoria If You Can’t Keep Your Cat. Available online: https://agriculture.vic.gov.au/livestock-and-animals/animal-welfare-victoria/cats/if-you-cant-keep-your-cat (accessed on 16 May 2023).
- Association of Shelter Veterinarians. Info Docs—Shelter Terminology. Available online: https://www.sheltervet.org/index.php?option=com_content&view=article&id=89:info-docs&catid=20:site-content (accessed on 18 May 2023).
- Animal Welfare Victoria Pet Rehoming. Available online: https://agriculture.vic.gov.au/livestock-and-animals/animal-welfare-victoria/domestic-animal-businesses/shelters-and-pounds/pet-rehoming (accessed on 16 May 2023).
- RSPCA Knowledgebase. Research Reports - Identifying Best Practice Domestic Cat Management in Australia. Available online: https://kb.rspca.org.au/downloads/research-reports/ (accessed on 18 May 2023).
- Commonwealth of Australia. Threat Abatement Plan for Predation by Feral Cats. Available online: https://www.dcceew.gov.au/environment/biodiversity/threatened/publications/tap/threat-abatement-plan-feral-cats (accessed on 16 May 2023).
- Victoria State Government. Invasive Plants and Animals—Feral Cat Declaration. Available online: https://www.environment.vic.gov.au/invasive-plants-and-animals/feral-cats (accessed on 10 December 2022).
- Queensland Government/Department of Agriculture and Fisheries. Feral Cat. Available online: https://www.business.qld.gov.au/industries/farms-fishing-forestry/agriculture/biosecurity/animals/invasive/restricted/feral-cat (accessed on 18 May 2023).
- Zito, S.; Morton, J.; Paterson, M.; Vankan, D.; Bennett, P.C.; Rand, J.; Phillips, C.J.C. Cross-Sectional Study of Characteristics of Owners and Nonowners Surrendering Cats to Four Australian Animal Shelters. J. Appl. Anim. Welf. Sci. 2016, 19, 126–143. [Google Scholar] [CrossRef]
- Zito, S.; Paterson, M.; Morton, J.; Vanken, D.; Bennett, P.; Rand, J.; Phillips, C.J.C. Surrenderers’ Relationships with Cats Admitted to Four Australian Animal Shelters. Animals 2018, 8, 23. [Google Scholar] [CrossRef]
- Zito, S.; Vankan, D.; Bennett, P.; Paterson, M.; Phillips, C.J.C. Cat Ownership Perception and Caretaking Explored in an Internet Survey of People Associated with Cats. PLoS ONE 2015, 10, e0133293. [Google Scholar] [CrossRef] [PubMed]
- Kerr, C.; Rand, J.; Morton, J.; Reid, R.; Paterson, M. Changes Associated with Improved Outcomes for Cats Entering RSPCA Queensland Shelters from 2011 to 2016. Animals 2018, 8, 95. [Google Scholar] [CrossRef] [PubMed]
- Baran, B.E.; Allen, J.A.; Rogelberg, S.G.; Spitzmüller, C.; DiGiacomo, N.A.; Webb, J.B.; Carter, N.T.; Clark, O.L.; Teeter, L.A.; Walker, A.G. Euthanasia-Related Strain and Coping Strategies in Animal Shelter Employees. J. Am. Vet. Med. Assoc. 2009, 235, 83–88. [Google Scholar] [CrossRef] [PubMed]
- RSPCA Australia RSPCA Australia Annual Statistics. Available online: https://www.rspca.org.au/what-we-do/our-role-caring-animals/annual-statistic (accessed on 10 February 2023).
- US Census Bureau. U.S. and World Population Clock. Available online: https://www.census.gov/popclock/ (accessed on 12 April 2021).
- ASPCA Pet Statistics. Available online: https://www.aspca.org/helping-people-pets/shelter-intake-and-surrender/pet-statistics (accessed on 1 February 2023).
- ASPCA Shelter Intake and Surrender. Available online: https://www.aspca.org/helping-people-pets/shelter-intake-and-surrender (accessed on 1 February 2023).
- Macrotrends U.K. Population 1950–2023. Available online: https://www.macrotrends.net/countries/GBR/united-kingdom/population (accessed on 21 January 2023).
- Stavisky, J.; Brennan, M.L.; Downes, M.; Dean, R. Demographics and Economic Burden of Un-Owned Cats and Dogs in the UK: Results of a 2010 Census. BMC Vet. Res. 2012, 8, 163. [Google Scholar] [CrossRef] [PubMed]
- Blue Cross. What To Do With a Stray Cat? Available online: https://www.bluecross.org.uk/advice/cat/what-to-do-with-a-stray-cat (accessed on 18 April 2023).
- Manning, A.M.; Rowan, A.N. Companion Animal Demographics and Sterilization Status: Results from a Survey in Four Massachusetts Towns. Anthrozoos 1992, 5, 192–201. [Google Scholar] [CrossRef]
- NSW Companion Animals Taskforce NSW Companion Animals Taskforce Discussion Paper. Available online: https://www.bmcc.nsw.gov.au/sites/default/files/document/files/2012-06-26_EnclosuretoItem13.pdf (accessed on 1 February 2023).
- Alberthsen, C.; Rand, J.; Morton, J.; Bennett, P.; Paterson, M.; Vankan, D. Numbers and Characteristics of Cats Admitted to Royal Society for the Prevention of Cruelty to Animals (RSPCA) Shelters in Australia and Reasons for Surrender. Animals 2016, 6, 23. [Google Scholar] [CrossRef] [PubMed]
- Alberthsen, C.; Rand, J.S.; Bennett, P.C.; Paterson, M.; Lawrie, M.; Morton, J.M. Cat Admissions to RSPCA Shelters in Queensland, Australia: Description of Cats and Risk Factors for Euthanasia after Entry. Aust. Vet. J. 2013, 91, 35–42. [Google Scholar] [CrossRef]
- Pet Rescue Pet Rescue. Available online: https://www.petrescue.com.au/ (accessed on 3 February 2023).
- Davidson, G. Justice4Max. Available online: https://www.facebook.com/justice4max/ (accessed on 1 February 2023).
- Shelter Animals Count Shelter Animals Count: The National Database. Available online: https://www.shelteranimalscount.org/about/# (accessed on 3 February 2023).
- Blackwell, B. Local and Regional Government in Remote and Unincorporated Australia: Sui Generis? Univ. N. Engl. 2012, 7, 23–46. [Google Scholar]
- NSW Government Pound and Dog Attack Statistics. Available online: https://www.olg.nsw.gov.au/public/dogs-cats/responsible-pet-ownership/pound-and-dog-attack-statistics/ (accessed on 30 December 2021).
- Animal Welfare Victoria 84Y Agreements Guidance. Available online: https://agriculture.vic.gov.au/__data/assets/pdf_file/0010/650827/84Y-Agreements-Guidance.pdf (accessed on 8 February 2023).
- Queensland Government Whole of Government Right to Information. Available online: https://www.rti.qld.gov.au/ (accessed on 8 February 2023).
- Australian Bureau of Statistics 2021 Census All Persons QuickStats. Available online: https://www.abs.gov.au/census/find-census-data/quickstats/2021/AUS (accessed on 18 November 2022).
- NSW Government. NSW Legislation—Companion Animal Regulations 2018, Section 17(c). Available online: https://legislation.nsw.gov.au/view/whole/html/inforce/current/sl-2018-0441 (accessed on 15 June 2021).
- Information and Privacy Commission NSW NSW Information Access Laws. Available online: https://www.ipc.nsw.gov.au/information-access/nsw-information-access-laws (accessed on 8 February 2023).
- Australian Government/Department of Infrastructure Transport Regional Development and Communication. Local Government National Report 2018–1019. Available online: https://www.infrastructure.gov.au/territories-regions-cities/local-government/publications/national-reports (accessed on 18 May 2023).
- ASPCA. Annual Report 2021. Available online: https://www.aspca.org/about-us/annual-report (accessed on 18 May 2023).
- RSPCA UK Facts, Figures and Myth-Busting. Available online: https://www.rspca.org.uk/whatwedo/latest/facts (accessed on 8 February 2023).
- Animal Welfare Victoria Code of Practice for the Private Keeping of Cats. Available online: https://agriculture.vic.gov.au/livestock-and-animals/animal-welfare-victoria/domestic-animals-act/codes-of-practice/code-of-practice-for-the-private-keeping-of-cats (accessed on 21 January 2023).
- Australian Veterinary Association. Uniform Companion Animal Legislation in the Northern Territory. Available online: https://www.ava.com.au/siteassets/advocacy/ava-submission---uniform-companion-animal-legsilation-in-the-northern-territory.pdf (accessed on 10 May 2023).
- Hawes, S.M.; Hupe, T.; Morris, K.N. Punishment to Support: The Need to Align Animal Control Enforcement with the Human Social Justice Movement. Animals 2020, 10, 1902. [Google Scholar] [CrossRef]
- The Humane Society of the United States Pets for Life. Available online: https://humanepro.org/programs/pets-for-life (accessed on 10 February 2023).
- Lancaster, E.; Rand, J.; Collecott, S.; Paterson, M. Problems Associated with the Microchip Data of Stray Dogs and Cats Entering RSPCA Queensland Shelters. Animals 2015, 5, 332–348. [Google Scholar] [CrossRef] [PubMed]
- Tan, K.; Rand, J.; Morton, J. Trap-Neuter-Return Activities in Urban Stray Cat Colonies in Australia. Animals 2017, 7, 46. [Google Scholar] [CrossRef] [PubMed]
- Swarbrick, H.; Rand, J. Application of a Protocol Based on Trap-Neuter-Return (TNR) to Manage Unowned Urban Cats on an Australian University Campus. Animals 2018, 8, 77. [Google Scholar] [CrossRef] [PubMed]
- Rinzin, K.; Stevenson, M.; Probert, D.; Bird, R.; Jackson, R.; French, N.; Weir, J. Free-Roaming and Surrendered Dogs and Cats Submitted to a Humane Shelter in Wellington, New Zealand, 1999–2006. N. Z. Vet. J. 2008, 56, 297–303. [Google Scholar] [CrossRef] [PubMed]
- Cotterell, J.; Rand, J.; Ahmadabadi, Z. Outcomes Associated with A Community Cat Program Based on High-Intensity Sterilization of Owned And Semi-Owned Cats in Target Areas. In Proceedings of the WSAVA Global Community Congress, Online, 13–15 November 2021. [Google Scholar]
- Banyule City Council Submission No 141 to House Standing Committee on the Environment and Energy, Parliament of Australia. Inquiry into the Problem of Feral and Domestic Cats in Australia. Available online: https://www.aph.gov.au/Parliamentary_Business/Committees/House/Former_Committees/Environment_and_Energy/Feralanddomesticcats/Submissions (accessed on 10 May 2023).
- Australian Pet Welfare Foundation. Australian Pet Welfare Foundation End-of-Year Report; Australian Pet Welfare: Kenmore, Australia, 2022. [Google Scholar]
- PetRescue Home2Home. Available online: https://www.petrescue.com.au/groups/11824/Home2Home (accessed on 21 January 2023).
- Chua, D.; Rand, J.; Morton, J. Surrendered and Stray Dogs in Australia—Estimation of Numbers Entering Municipal Pounds, Shelters and Rescue Groups and Their Outcomes. Animals 2017, 7, 50. [Google Scholar] [CrossRef]
- Goodwin, K.; Rand, J.; Morton, J.; Uthappa, V.; Walduck, R. Email Reminders Increase the Frequency That Pet Owners Update Their Microchip Information. Animals 2018, 8, 20. [Google Scholar] [CrossRef]
- Huang, L.; Coradini, M.; Rand, J.; Morton, J.; Albrecht, K.; Wasson, B.; Robertson, D. Search Methods Used to Locate Missing Cats and Locations Where Missing Cats Are Found. Animals 2018, 8, 5. [Google Scholar] [CrossRef]
- Weiss, E.; Slater, M.; Lord, L. Frequency of Lost Dogs and Cats in the United States and the Methods Used to Locate Them. Animals 2012, 2, 301–315. [Google Scholar] [CrossRef]
- Lord, L.K.; Wittum, T.E.; Ferketich, A.K.; Funk, J.A.; Rajala-Schultz, P.J. Search Methods That People Use to Find Owners of Lost Pets. J. Am. Vet. Med. Assoc. 2007, 230, 1835–1840. [Google Scholar] [CrossRef]
- The Courier Mail. Cat Registration No Longer Compulsory in Ipswich. Available online: https://www.couriermail.com.au/news/queensland/ipswich/cat-registration-no-longer-compulsory-in-ipswich/news-story/418680a49615d09b8b44cde8afbd4e83 (accessed on 18 May 2023).
- The Humane Society of the United States Our Position on Cats. Available online: https://www.humanesociety.org/resources/our-position-cats (accessed on 21 January 2023).
- McGreevy, P.; Masters, S.; Richards, L.; Soares Magalhaes, R.J.; Peaston, A.; Combs, M.; Irwin, P.J.; Lloyd, J.; Croton, C.; Wylie, C.; et al. Identification of Microchip Implantation Events for Dogs and Cats in the VetCompass Australia Database. Animals 2019, 9, 423. [Google Scholar] [CrossRef]
- Lord, L.K.; Ingwersen, W.; Gray, J.L.; Wintz, D.J. Characterization of Animals with Microchips Entering Animal Shelters. J. Am. Vet. Med. Assoc. 2009, 235, 160–167. [Google Scholar] [CrossRef] [PubMed]
- Rowan, A.; Kartal, T. Dog Population & Dog Sheltering Trends in the United States of America. Animals 2018, 8, 68. [Google Scholar] [CrossRef] [PubMed]
- Bradley, J.; Rajendran, S. Increasing Adoption Rates at Animal Shelters: A Two-Phase Approach to Predict Length of Stay and Optimal Shelter Allocation. BMC Vet. Res. 2021, 17, 70. [Google Scholar] [CrossRef] [PubMed]
- Hawes, S.; Kerrigan, J.; Morris, K. Factors Informing Outcomes for Older Cats and Dogs in Animal Shelters. Animals 2018, 8, 36. [Google Scholar] [CrossRef] [PubMed]
- Gourkow, N. Factors Affecting the Welfare and Adoption Rate of Cats in an Animal Shelter. Ph.D. Dissertation, University of British Columbia, Vancouver, BC, Canada, 2001. [Google Scholar]
- McCune, S. Temperament and the Welfare of Caged Cats. Ph.D. Thesis, University of Cambridge, Cambridge, UK, 1992. [Google Scholar]
- Barnette, B. Foster Care Volunteers Are Lifesavers. Available online: https://www.maddiesfund.org/foster-care-volunteers-are-lifesavers.htm?p=topic91&p=topic91 (accessed on 3 February 2023).
- Spehar, D.; Wolf, P. The Impact of an Integrated Program of Return-to-Field and Targeted Trap-Neuter-Return on Feline Intake and Euthanasia at a Municipal Animal Shelter. Animals 2018, 8, 55. [Google Scholar] [CrossRef]
- Spehar, D.D.; Wolf, P.J. Integrated Return-to-Field and Targeted Trap-Neuter-Vaccinate-Return Programs Result in Reductions of Feline Intake and Euthanasia at Six Municipal Animal Shelters. Front. Vet. Sci. 2019, 6, 77. [Google Scholar] [CrossRef]
- Lord, L.K.; Wittum, T.E.; Ferketich, A.K.; Funk, J.A.; Rajala-Schultz, P.J. Search and Identification Methods That Owners Use to Find a Lost Cat. J. Am. Vet. Med. Assoc. 2007, 230, 217–220. [Google Scholar] [CrossRef]
- Shelter Animals Count. Q1-Q4 2022 Analysis Report; Shelter Animals Count: Atlanta, GA, USA, 2023. [Google Scholar]
- Frenden, M. Barn Cat 101. Available online: https://www.maddiesfund.org/assets/documents/Institute/APA!%20Barn%20Cat%20Handbook.pdf (accessed on 19 May 2023).
- Animal Humane Society Cats for Barns or Businesses. Available online: https://www.animalhumanesociety.org/barncats (accessed on 19 May 2023).
- Scotney, R.; Rand, J.; Rohlf, V.; Hayward, A.; Bennett, P. The Impact of Lethal, Enforcement-Centred Cat Management on Human Wellbeing: Exploring Lived Experiences of Cat Carers Affected by Cat Culling at the Port of Newcastle. Animals 2023, 13, 271. [Google Scholar] [CrossRef]
- Reeve, C.L.; Rogelberg, S.G.; Spitzmuller, C.; Digiacomo, N. The Caring-Killing Paradox: Euthanasia-Related Strain Among Animal-Shelter Workers1. J. Appl. Soc. Psychol. 2005, 35, 119–143. [Google Scholar] [CrossRef]
- Bennett, P.; Rohlf, V. Perpetration-Induced Traumatic Stress in Persons Who Euthanize Nonhuman Animals in Surgeries, Animal Shelters, and Laboratories. Soc. Anim. 2005, 13, 201–220. [Google Scholar] [CrossRef]
- Anderson, K.A.; Brandt, J.C.; Lord, L.K.; Miles, E.A. Euthanasia in Animal Shelters: Management’s Perspective on Staff Reactions and Support Programs. Anthrozoos 2013, 26, 569–578. [Google Scholar] [CrossRef]
- Arizona Humane Society Resources to Keep Your Pet. Available online: https://www.azhumane.org/resources-to-keep-your-pet/ (accessed on 3 February 2023).
- Karsten, C.L.; Wagner, D.C.; Kass, P.H.; Hurley, K.F. An Observational Study of the Relationship between Capacity for Care as an Animal Shelter Management Model and Cat Health, Adoption and Death in Three Animal Shelters. Vet. J. 2017, 227, 15–22. [Google Scholar] [CrossRef] [PubMed]
- Marsh, P. Replacing Myth with Math: Using Evidence-Based Programs to Eradicate Shelter Overpopulation; Town and Country Reprographics, Inc.: Concord, NH, USA, 2010. [Google Scholar]
- Spehar, D.D.; Wolf, P.J. The Impact of Return-to-Field and Targeted Trap-Neuter-Return on Feline Intake and Euthanasia at a Municipal Animal Shelter in Jefferson County, Kentucky. Animals 2020, 10, 1395. [Google Scholar] [CrossRef] [PubMed]
- Levy, J.K.; Isaza, N.M.; Scott, K.C. Effect of High-Impact Targeted Trap-Neuter-Return and Adoption of Community Cats on Cat Intake to a Shelter. Vet. J. 2014, 201, 269–274. [Google Scholar] [CrossRef]
- Levy, J.K.; Gale, D.W.; Gale, L.A. Evaluation of the Effect of a Long-Term Trap-Neuter-Return and Adoption Program on a Free-Roaming Cat Population. J. Am. Vet. Med. Assoc. 2003, 222, 42–46. [Google Scholar] [CrossRef]
- Animal Welfare Victoria Mandatory Reporting of Animal Fate Data by Shelters and Pounds. Available online: https://agriculture.vic.gov.au/livestock-and-animals/animal-welfare-victoria/domestic-animals-act/codes-of-practice/reporting-amendments-code-of-practice (accessed on 31 December 2021).
- Wagner, D.; Hurley, K.; Stavisky, J. Shelter Housing for Cats: 1. Principles of Design for Health, Welfare and Rehoming. J. Feline Med. Surg. 2018, 20, 635–642. [Google Scholar] [CrossRef]
- Patronek, G.J.; Sperry, E. Quality of Life in Long-Term. Confinement, 4th ed.; Saunders Company: Philadelphia, PA, USA, 2001. [Google Scholar]
- Dinnage, J.D.; Scarlett, J.M.; Richards, J.R. Descriptive Epidemiology of Feline Upper Respiratory Tract Disease in an Animal Shelter. J. Feline Med. Surg. 2009, 11, 816–825. [Google Scholar] [CrossRef]
- Gouveia, K.; Magalhães, A.; de Sousa, L. The Behaviour of Domestic Cats in a Shelter: Residence Time, Density and Sex Ratio. Appl. Anim. Behav. Sci. 2011, 130, 53–59. [Google Scholar] [CrossRef]
- The Lost Dogs Home. About Us—2020/2021 Annual Report. Available online: https://dogshome.com/about-us/annual-reports/ (accessed on 20 May 2021).
- Kreisler, R.E.; Pugh, A.A.; Pemberton, K.; Pizano, S. The Impact of Incorporating Multiple Best Practices on Live Outcomes for a Municipal Animal Shelter in Memphis, TN. Front. Vet. Sci. 2022, 9, 834. [Google Scholar] [CrossRef]
- Getting 2 Zero Current Events. Available online: https://www.g2z.org.au/events.html (accessed on 8 February 2023).
- HSUS The Humane Society of the United States. Available online: https://www.humanesociety.org/ (accessed on 8 February 2023).
- Best Friends Best Friends Save Them All. Available online: https://bestfriends.org/ (accessed on 8 February 2023).
- Maddies Fund Maddies Fund. Available online: https://www.maddiesfund.org/index.htm (accessed on 8 February 2023).
- Gunther, I.; Hawlena, H.; Azriel, L.; Gibor, D.; Berke, O. Reduction of Free-Roaming Cat Population Requires High-Intensity Neutering in Spatial Contiguity to Mitigate Compensatory Effects. Proc. Natl. Acad. Sci. USA 2022, 119, e2119000119. [Google Scholar] [CrossRef]
- Boone, J.D.; Miller, P.S.; Briggs, J.R.; Benka, V.A.W.; Lawler, D.F.; Slater, M.; Levy, J.K.; Zawistowski, S. A Long-Term Lens: Cumulative Impacts of Free-Roaming Cat Management Strategy and Intensity on Preventable Cat Mortalities. Front. Vet. Sci. 2019, 6, 238. [Google Scholar] [CrossRef] [PubMed]
- Kreisler, R.E.; Cornell, H.N.; Levy, J.K. Corrigendum: Decrease in Population and Increase in Welfare of Community Cats in a Twenty-Three Year Trap-Neuter-Return Program in Key Largo, FL: The ORCAT Program. Front. Vet. Sci. 2019, 6, 7. [Google Scholar] [CrossRef] [PubMed]
- Dog and Cat Board The Act and Regulations. Available online: https://dogandcatboard.com.au/about/the-act-and-regulations (accessed on 8 February 2023).


| State | Total Number of Municipal Councils | Number of Municipal Councils Operating Their Own Pound | Proportion of Municipal Councils Operating Their Own Pound | Number Operating Their Own Pound That Supplied Data | Proportion Operating Their Own Pound That Supplied Data |
|---|---|---|---|---|---|
| New South Wales | 128 | 111 | 87% | 107 | 96% |
| Victoria | 79 | 38 | 48% | 37 (1/38 by RTI) | 97% |
| South Australia | 69 | 12 | 17% | 4 | 33% |
| Queensland | 78 | 60 | 77% | 18 (6/18 by RTI) | 30% |
| Northern Territory | 17 | 3 | 18% | 1 | 33% |
| Western Australia | 149 | 82 | 55% | 18 | 22% |
| Tasmania | 29 | 0 | 0% | N.A. | N.A. |
| Australian total | 549 | 306 | 56% | 185 | 60% |
| State/Territory (Human Population) | Admissions/Intake for Year | Outcomes during Year | Discrepancy 5 | ||||||||
|---|---|---|---|---|---|---|---|---|---|---|---|
| Reclaimed | Rehomed | Transferred Out | Released Alive 3 | Euthanized | Other Outcomes 4 | No. (%) 6 | |||||
| No. 1 | No. (Per 1000 Residents) [%] 2 | No. (Per 1000 Residents) [%] 2 | No. (Per 1000 Residents) [%] 2 | % Rehomed of Unclaimed | No. (Per 1000 Residents) [%] 2 | No. (Per 1000 Residents) [%] 2 | No. (Per 1000 Residents) [%] 2 | % Euthanized of Unclaimed | No. (Per 1000 Residents) [%] 2 | ||
| Admissions: | |||||||||||
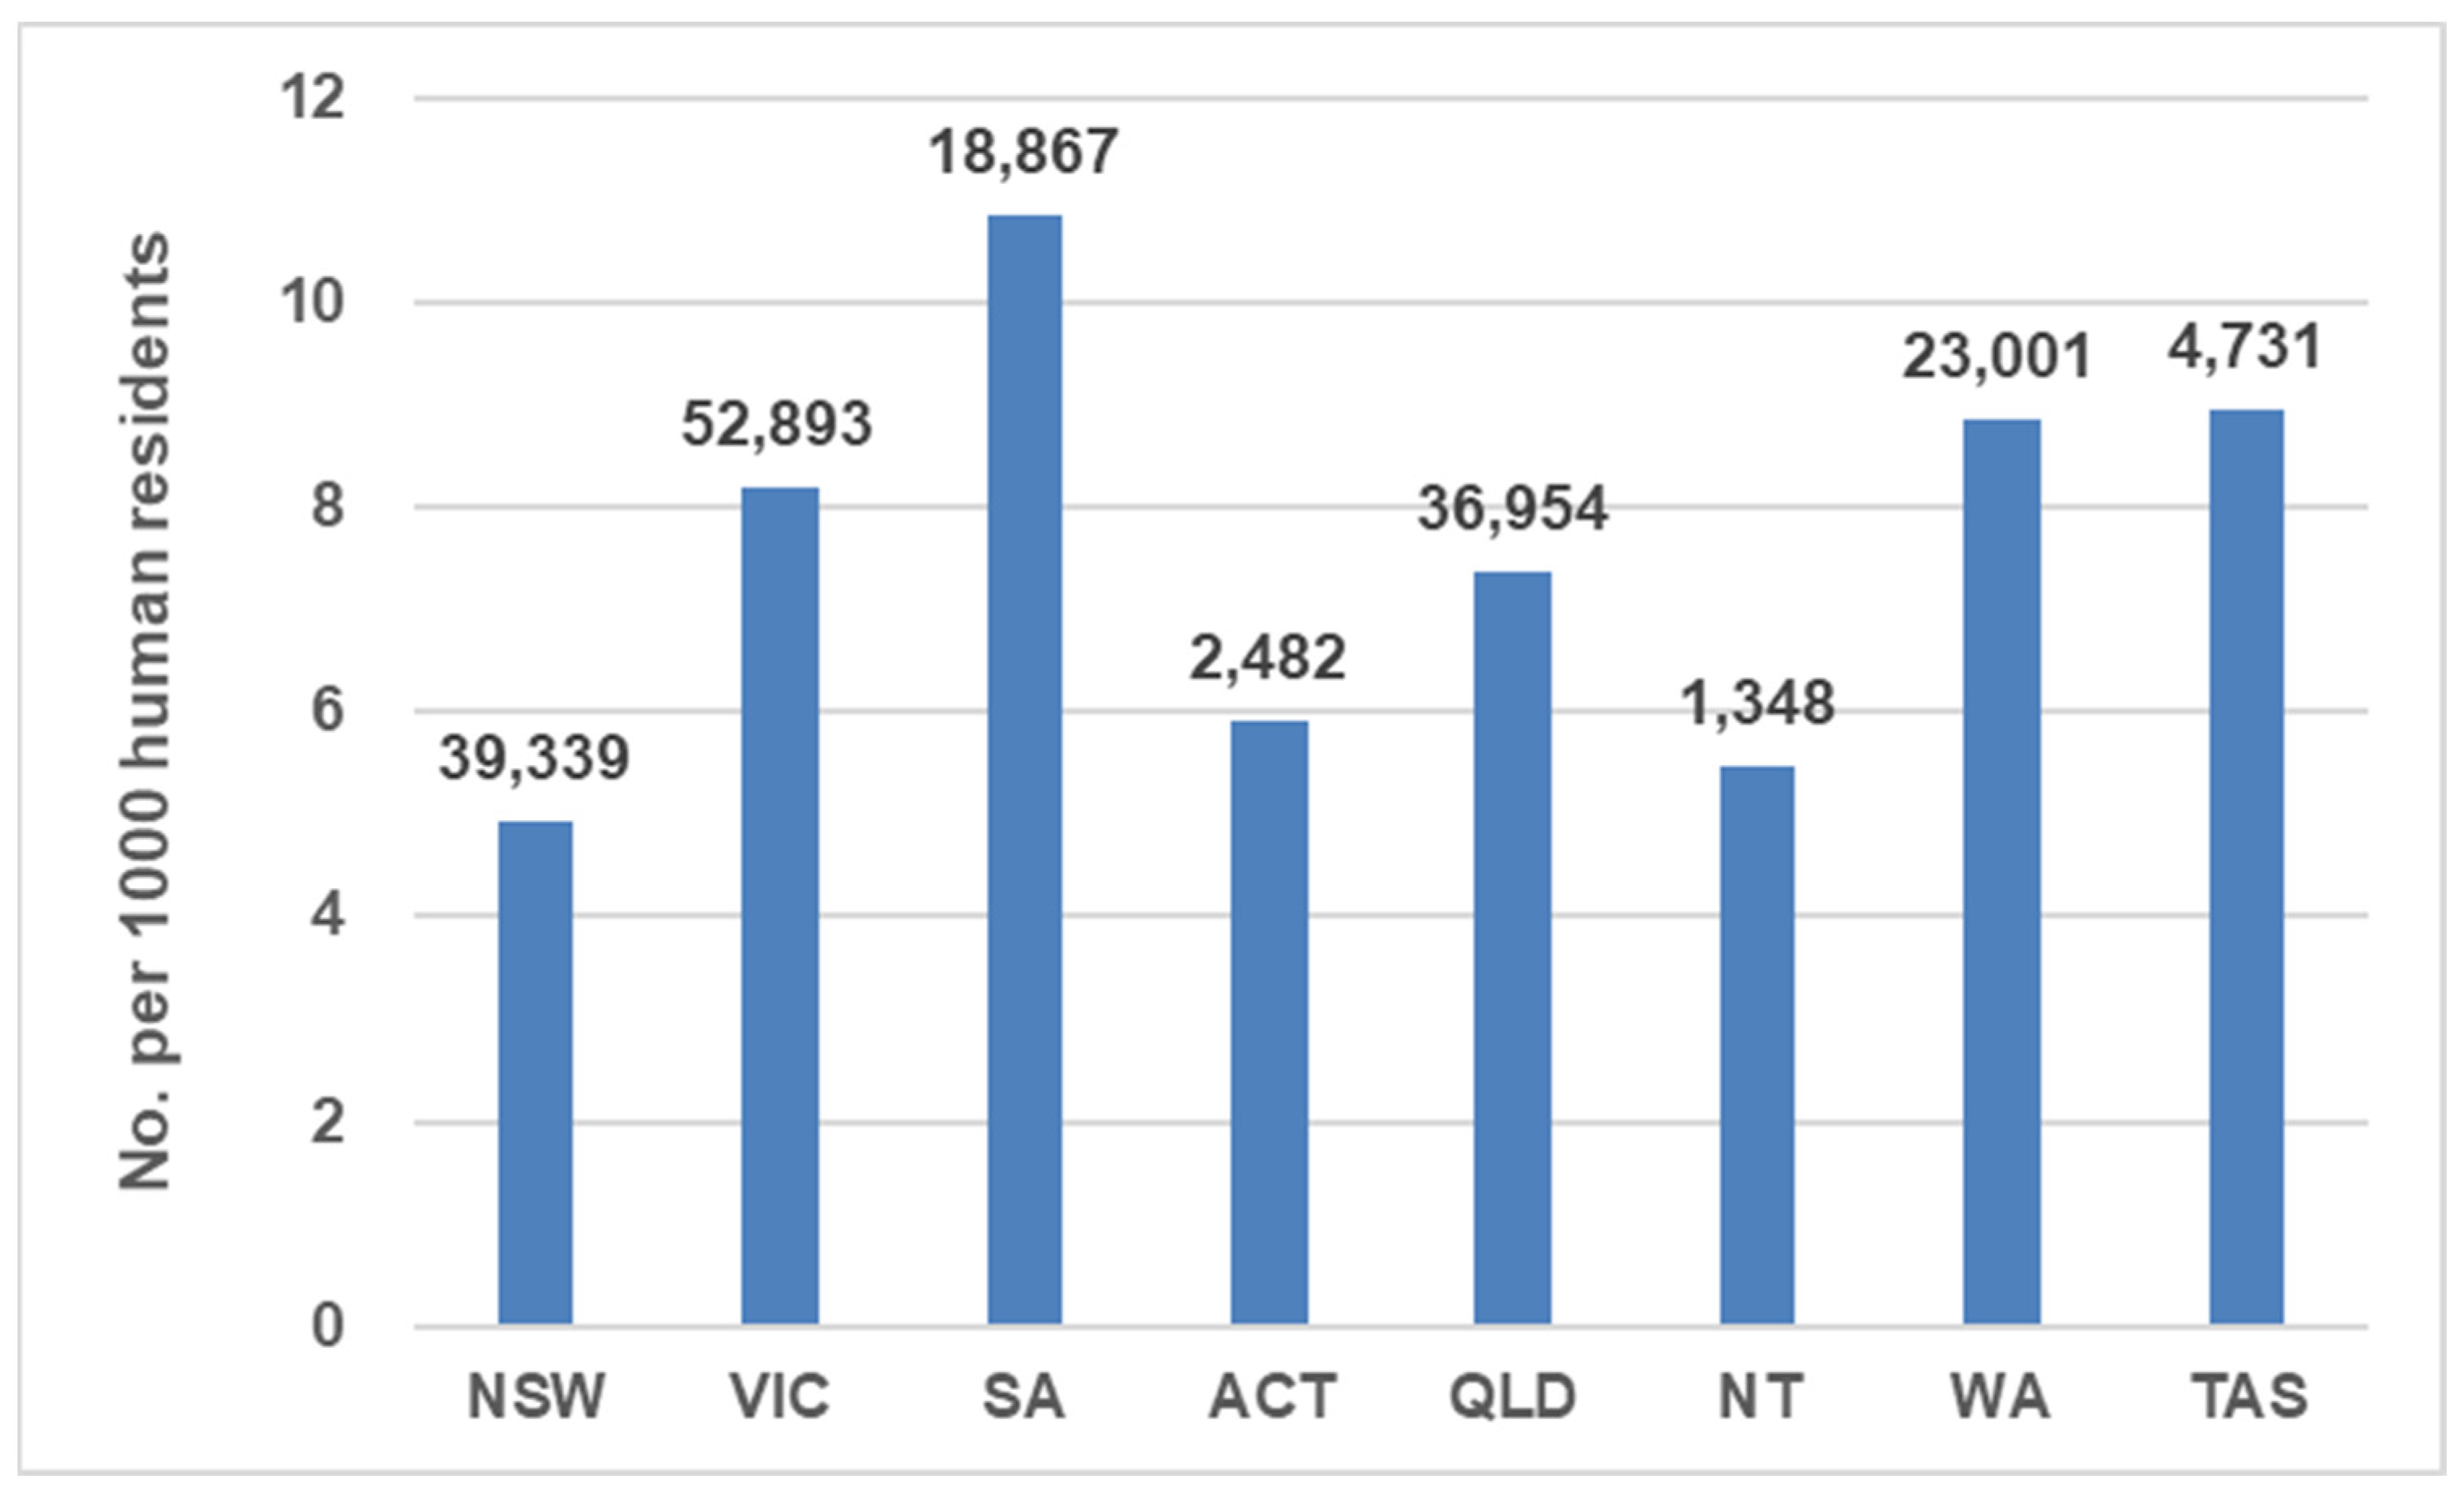
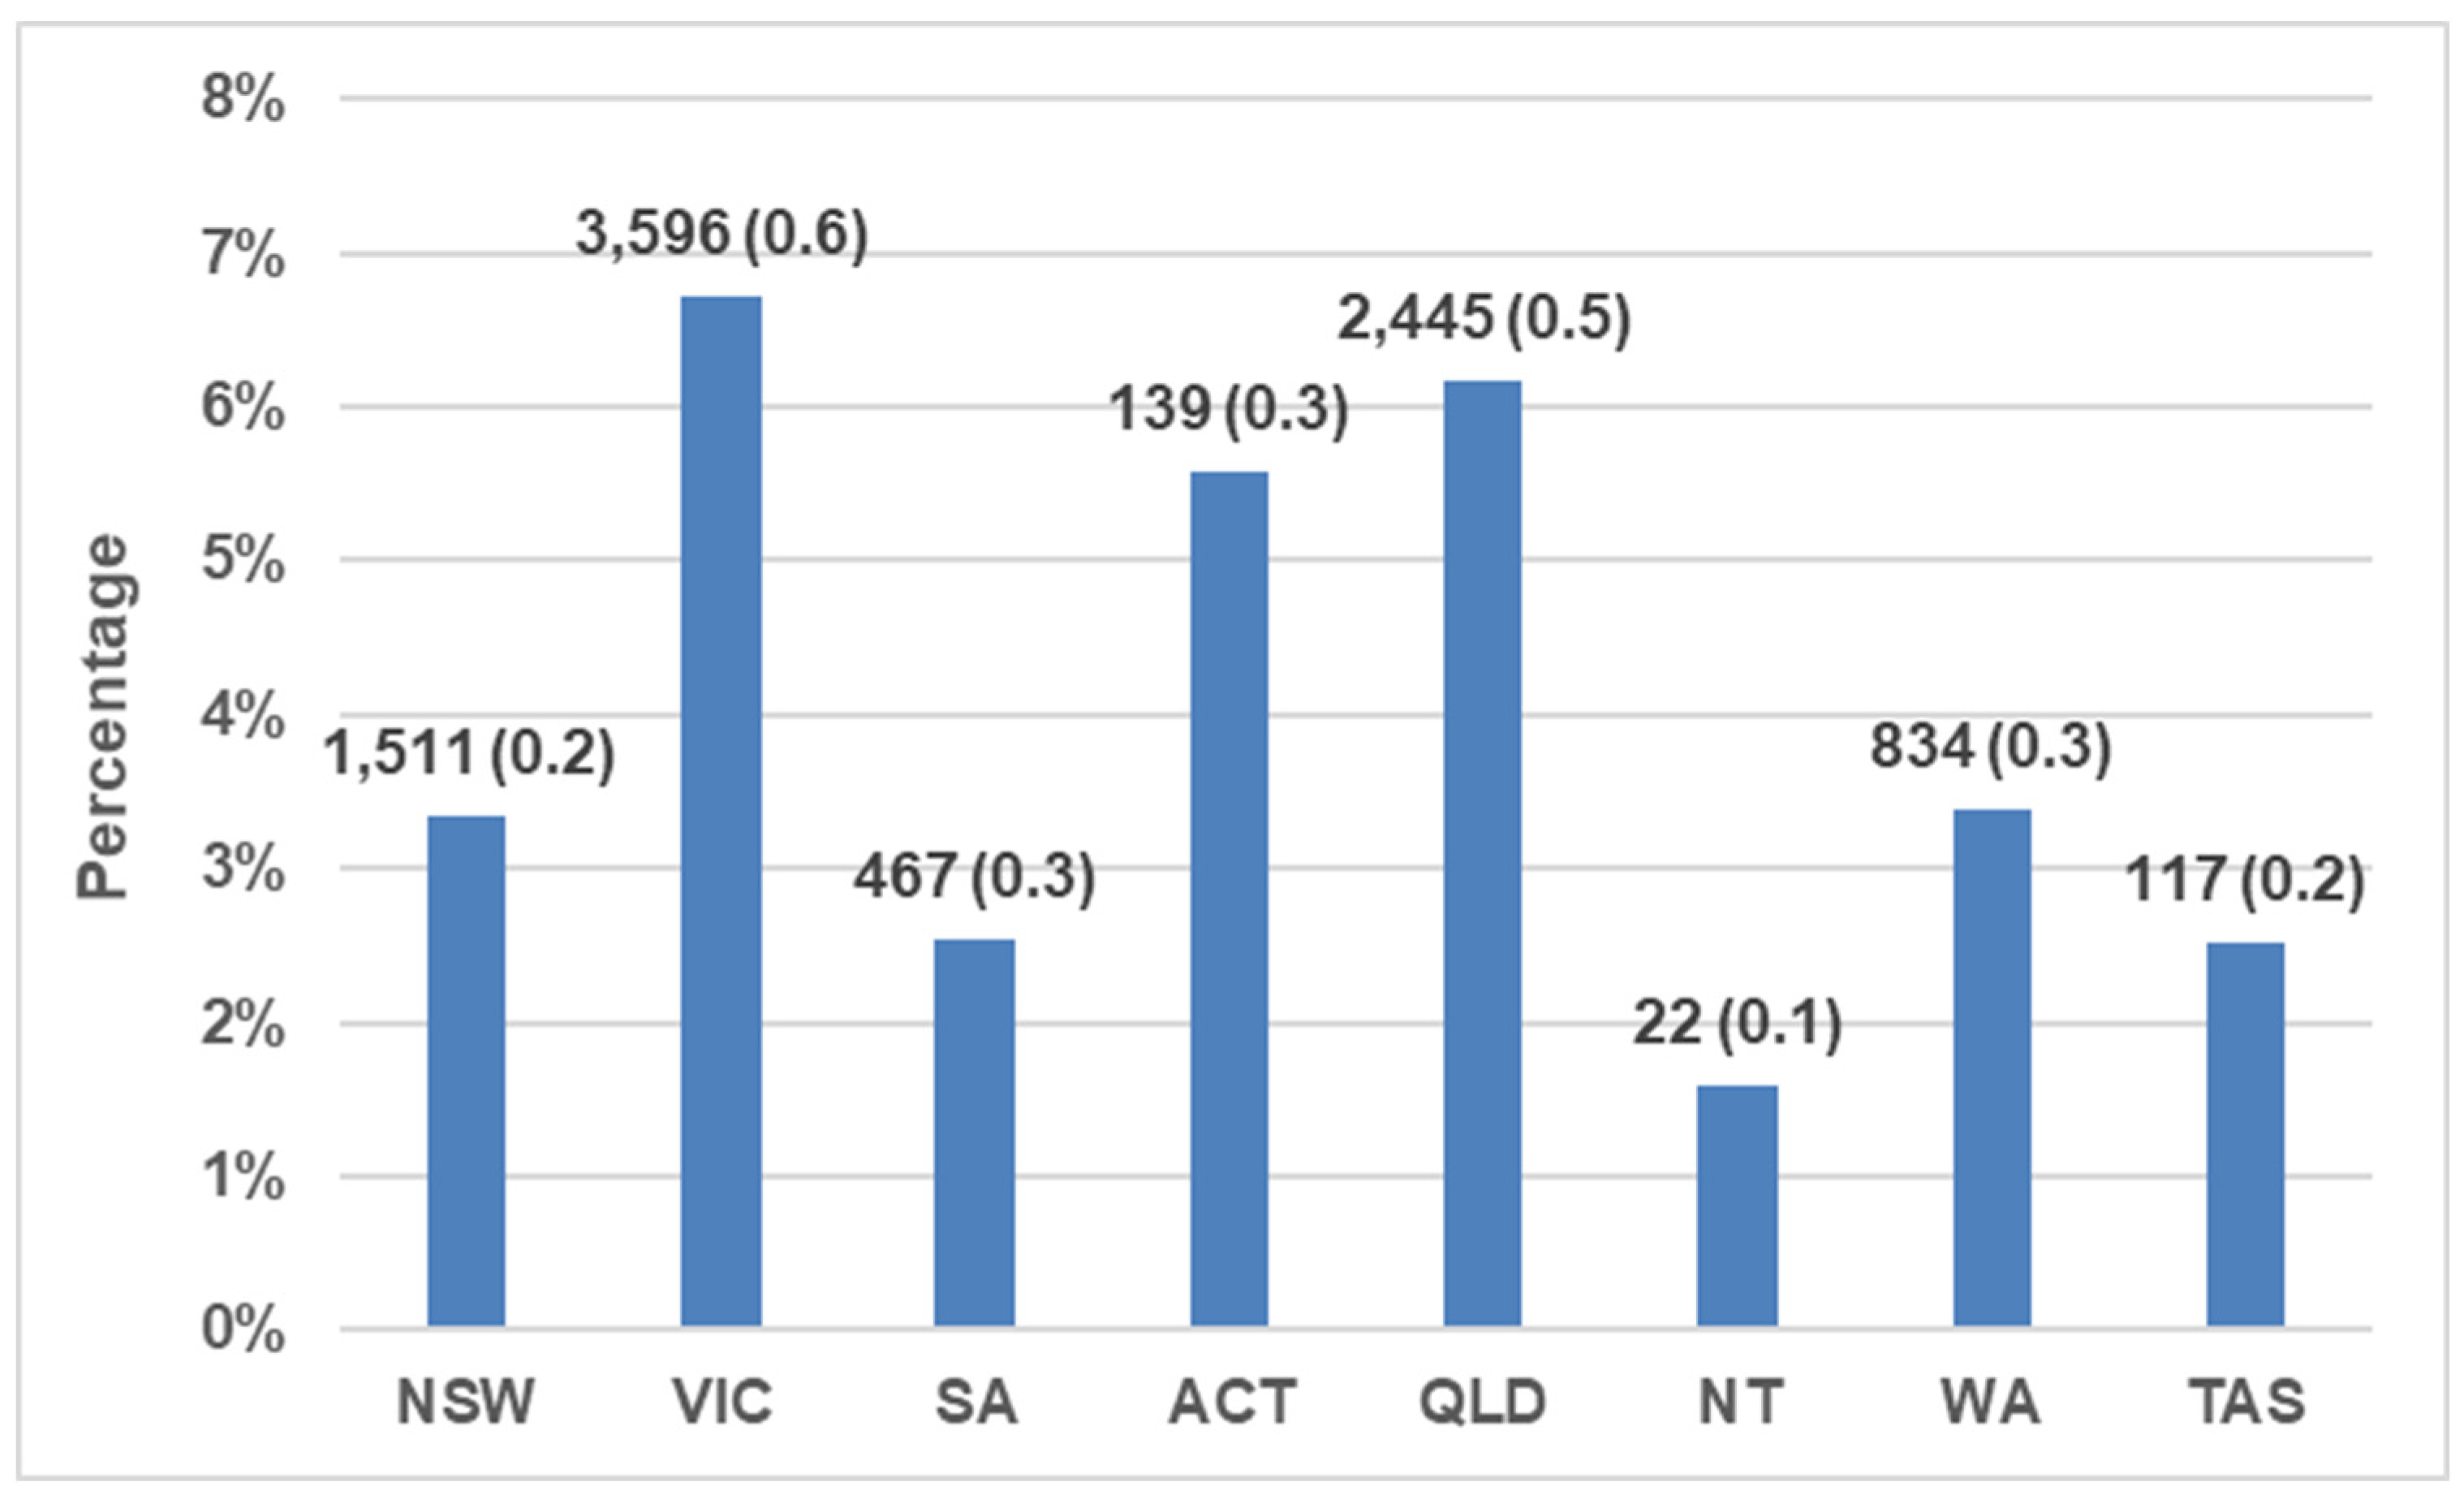
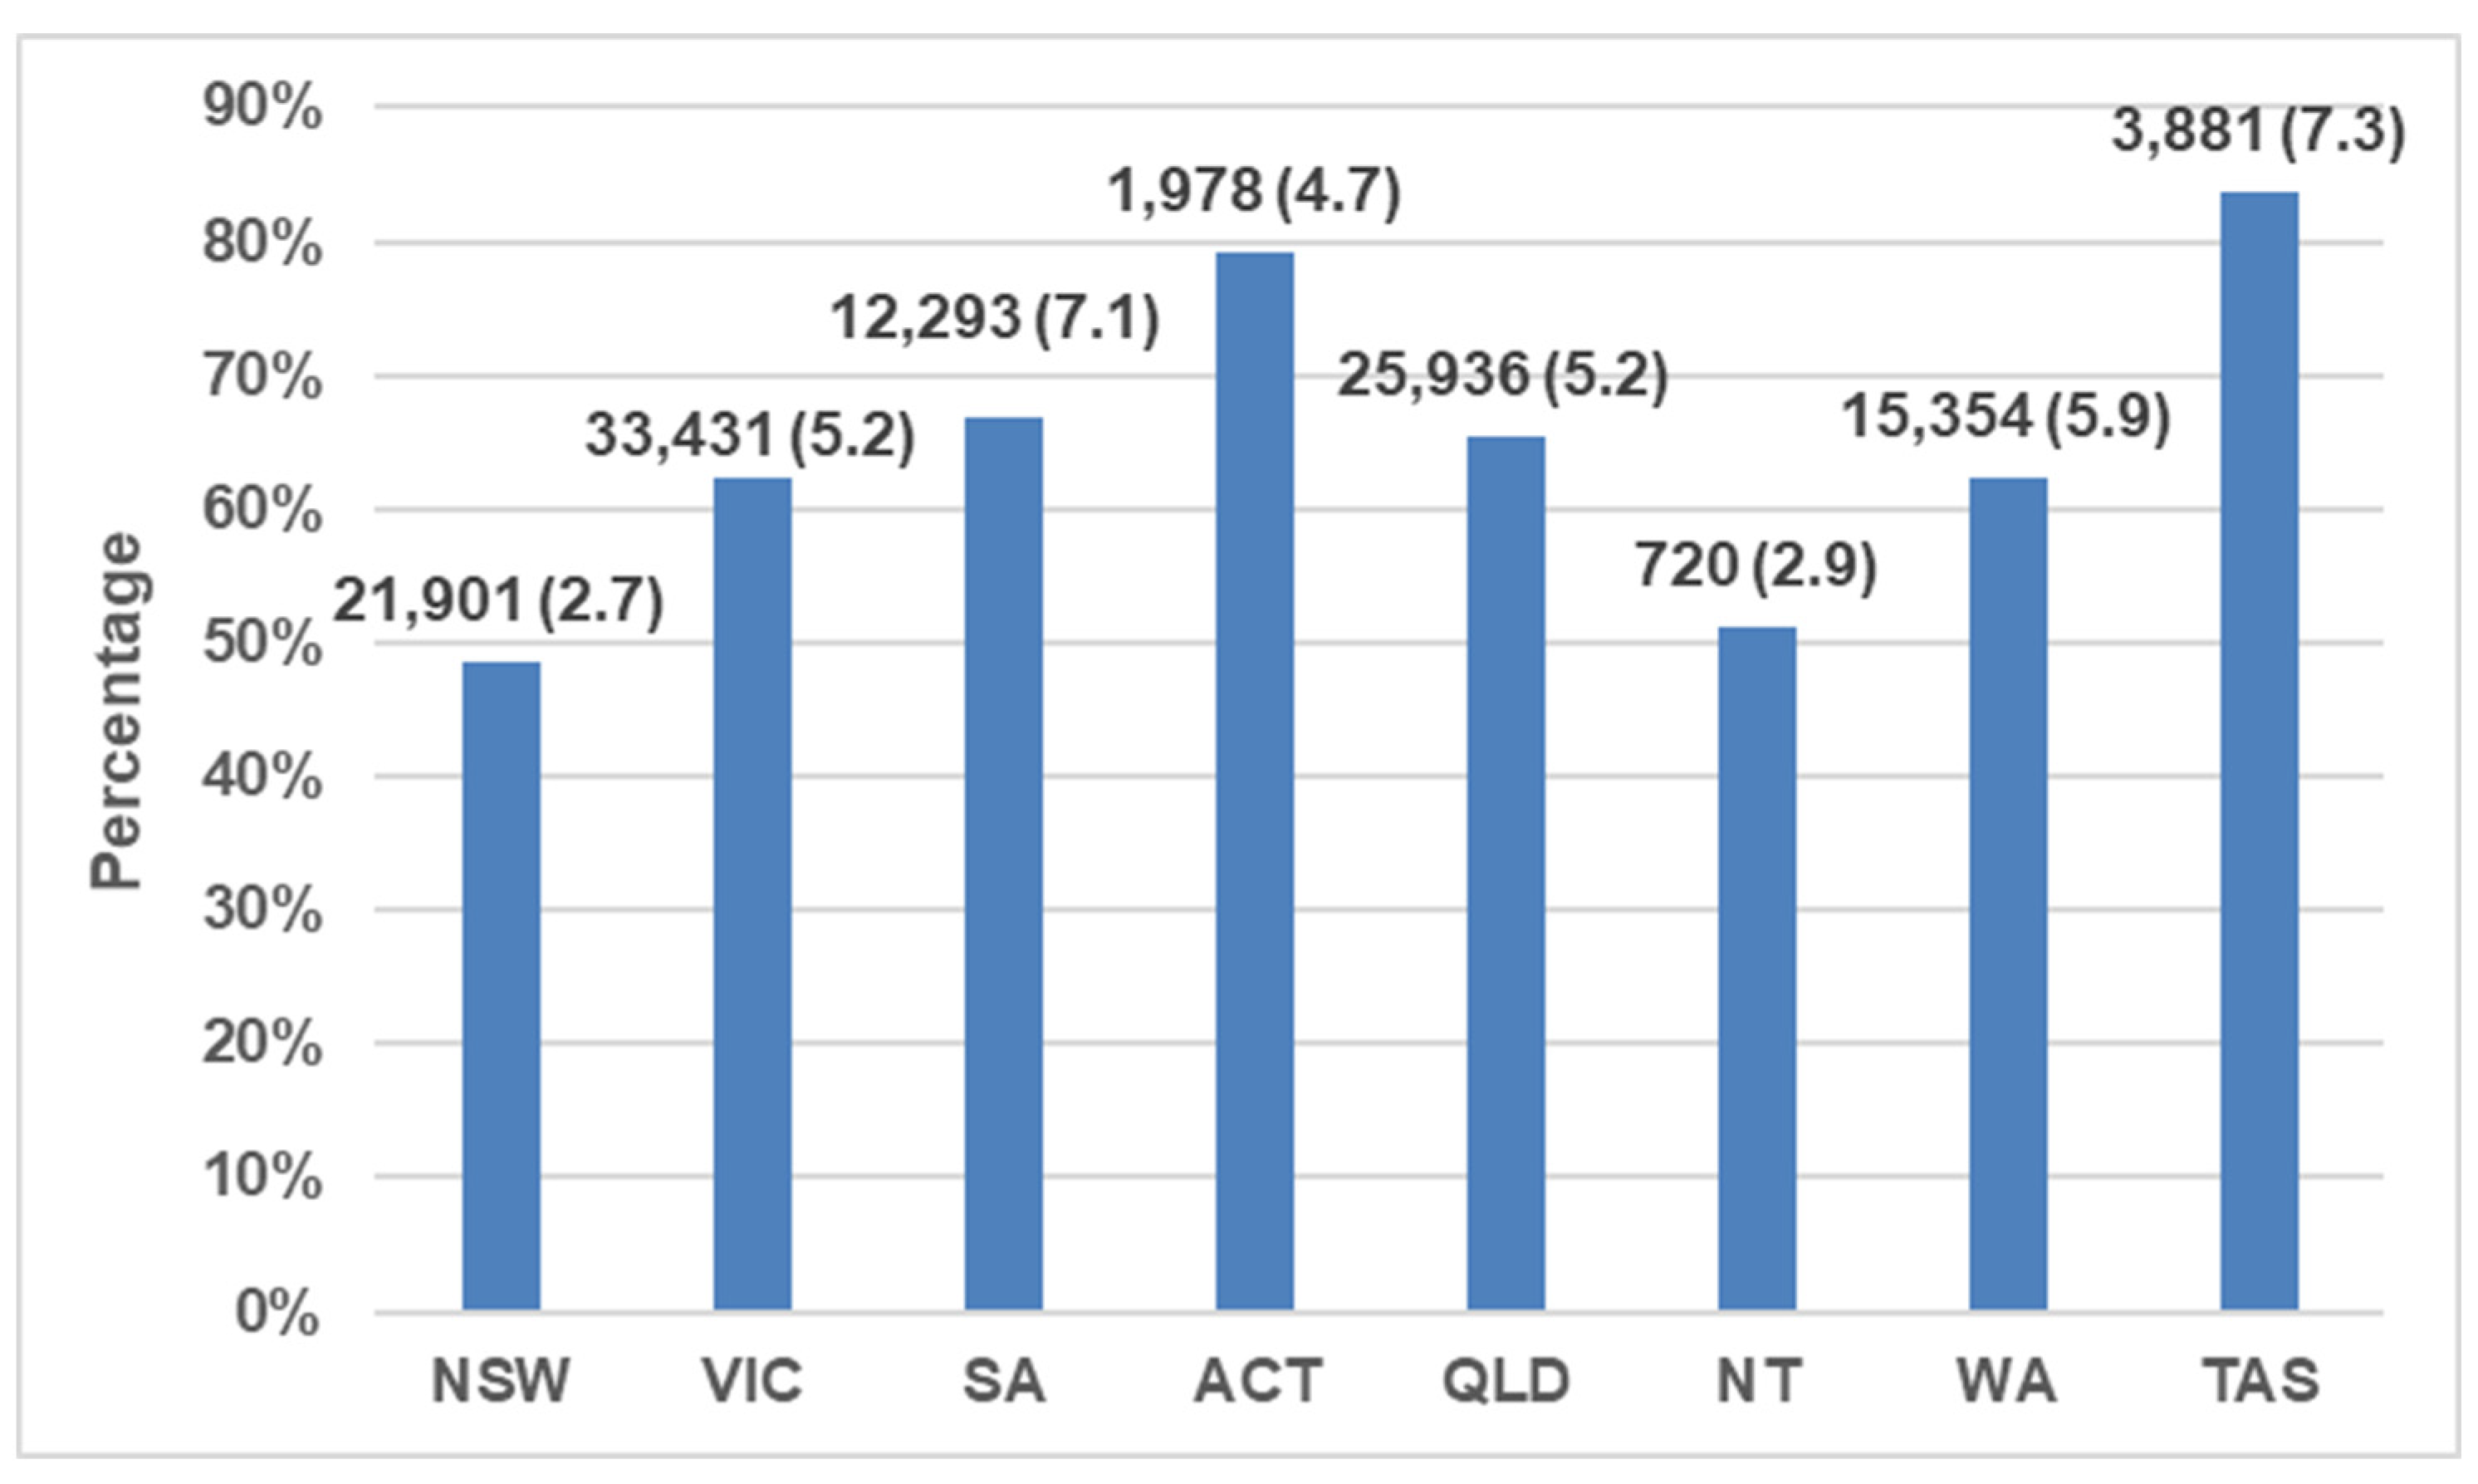
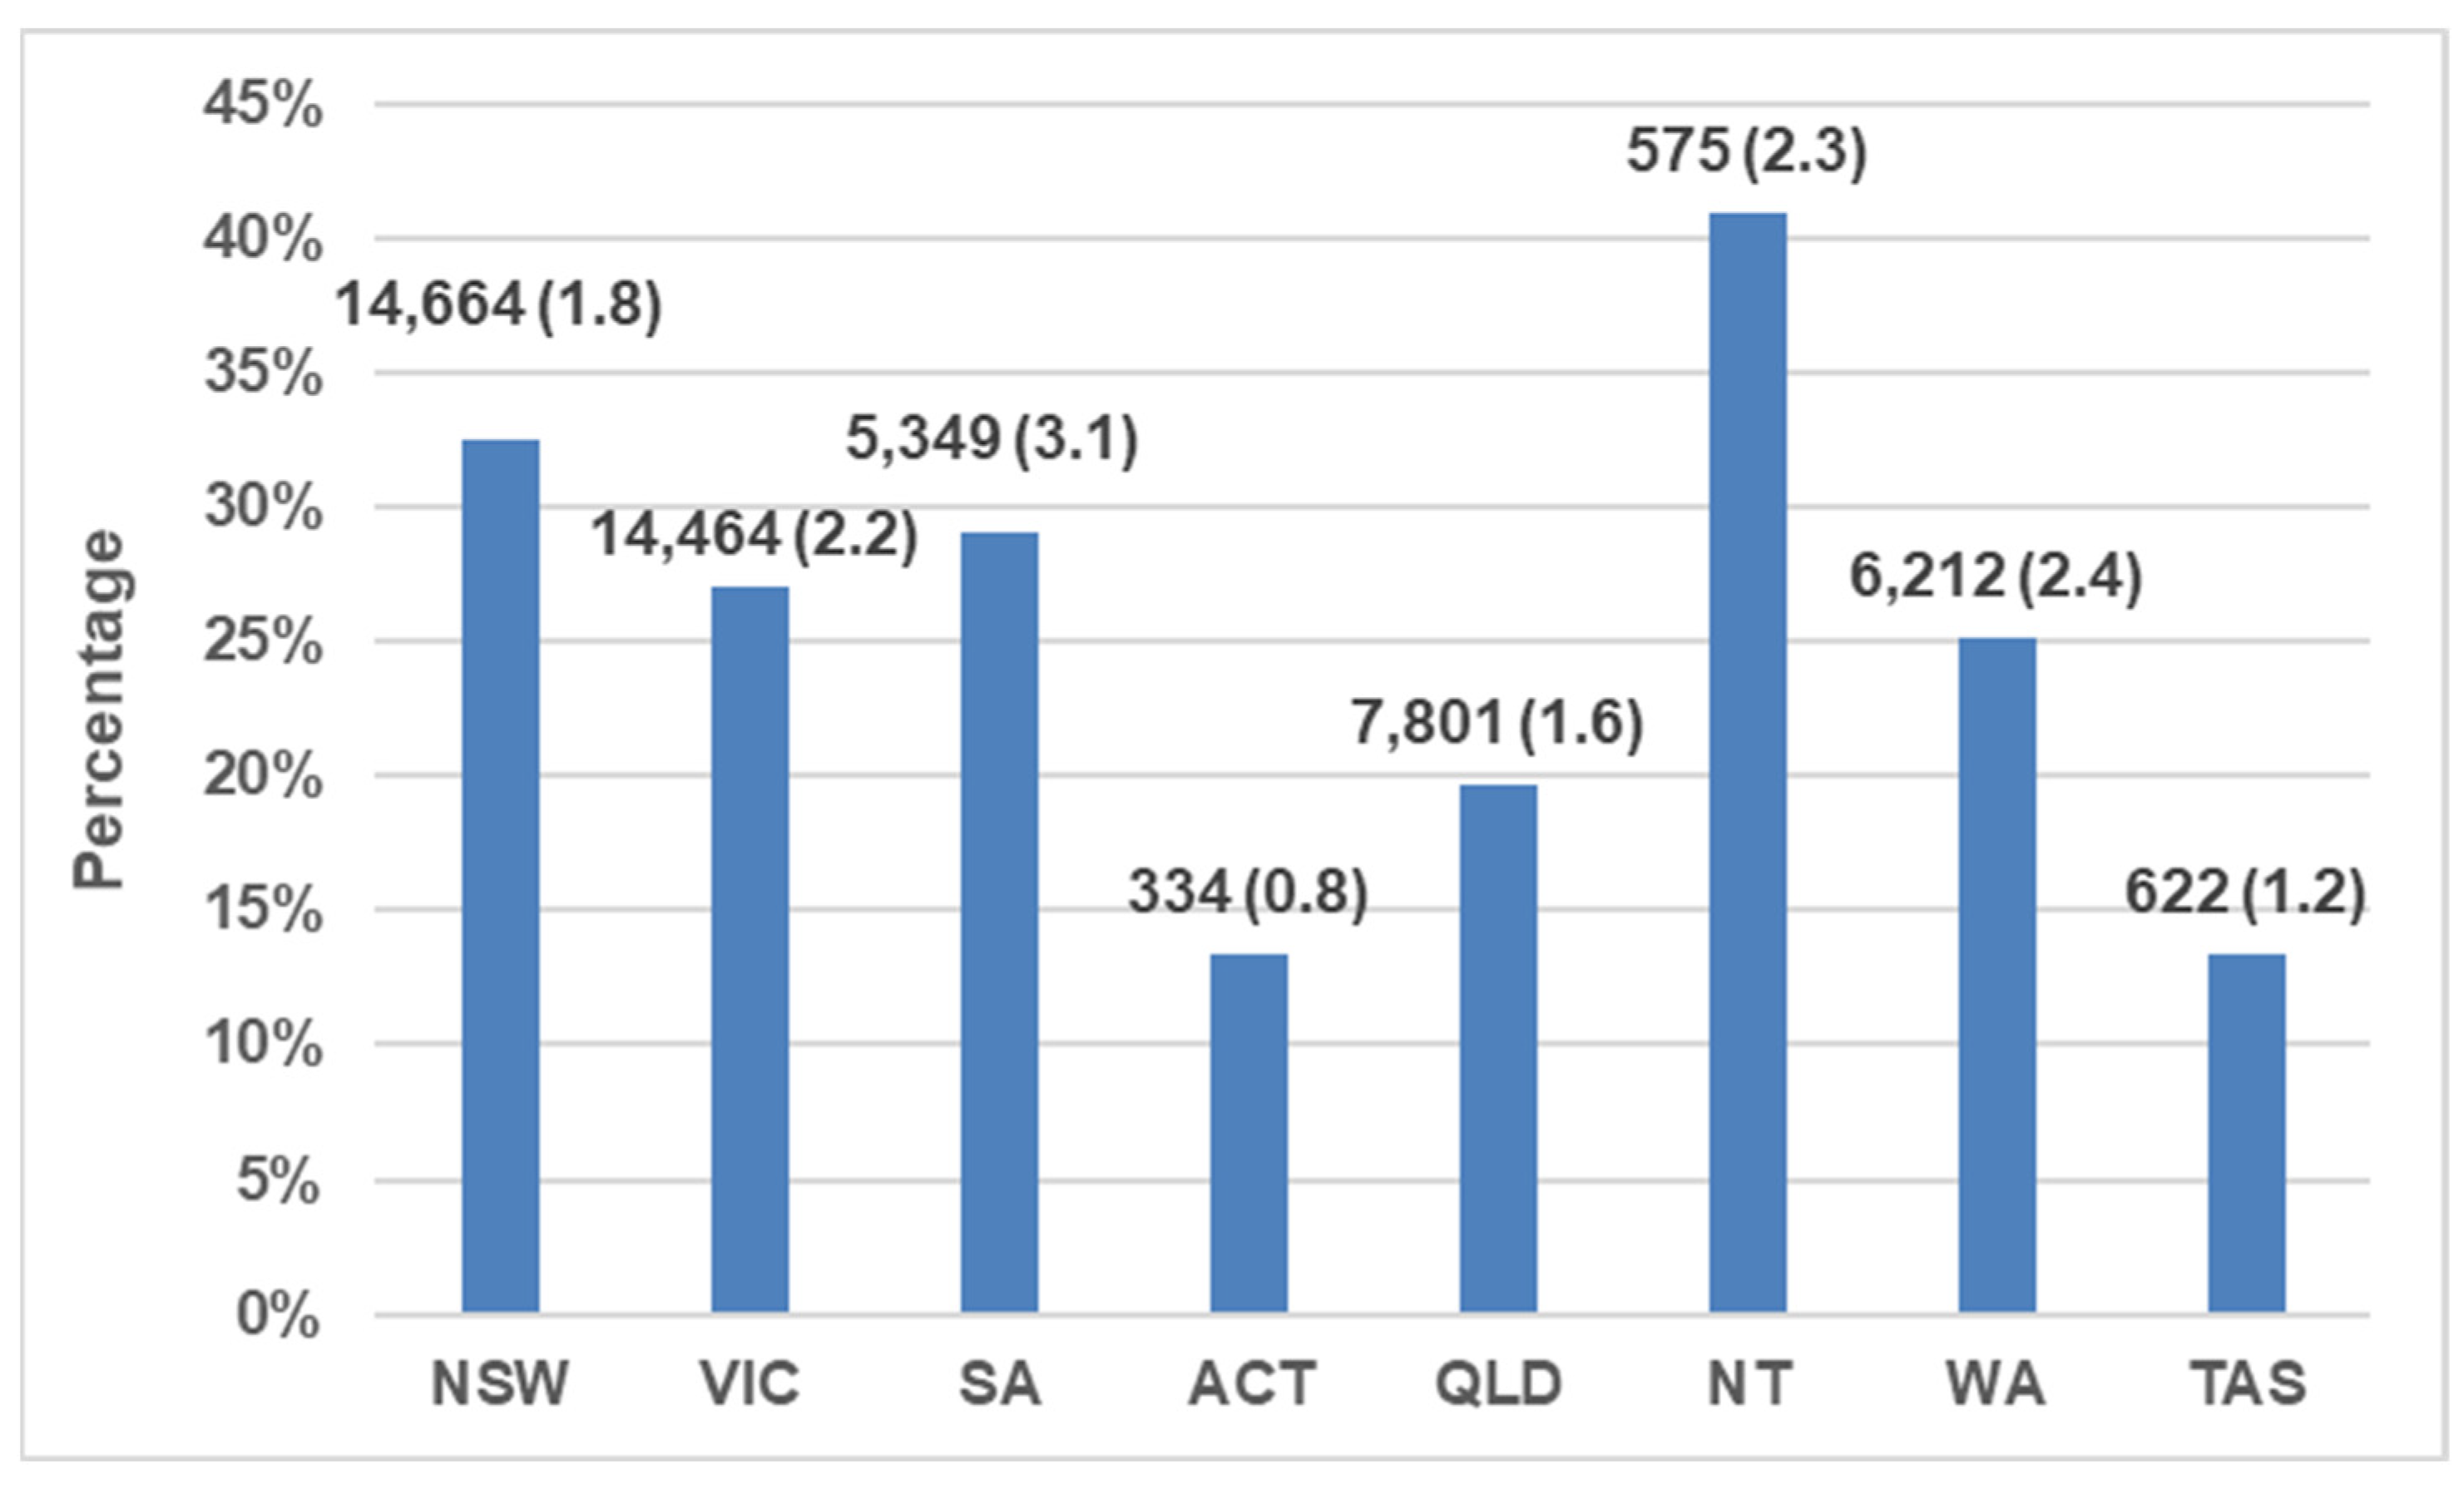
| New South Wales (7,980,168) | 39,339 | 4.9 | 1511 (0.2) [3%] | 21,901 (2.7) [49%] | 50% | 29,960 (3.8) [66%] | 14,664 (1.8) [32%] | 34% | 513 (0.1) [1%] | +88 (+0%) | |
| Victoria (6,462,019) | 52,893 | 8.2 | 3596 (0.6) [7%] | 33,431 (5.2) [62%] | 67% | 38,183 (5.9) [71%] | 14,464 (2.2) [27%] | 29% | 909 (0.1) [2%] | +387 (+1%) | |
| South Australia (1,736,527) | 18,867 | 10.9 | 467 (0.3) [3%] | 12,293 (7.1) [67%] | 68% | 12,829 (7.4) [70%] | 5349 (3.1) [29%] | 30% | 235 (0.1) [1%] | +601 (+3%) | |
| Australian Capital Territory (420,379) | 2482 | 5.9 | 139 (0.3) [6%] | 1978 (4.7) [79%] | 84% | 2126 (5.1) [85%] | 334 (0.8) [13%] | 14% | 34 (0.1) [1%] | 0 (0%) | |
| Queensland (5,009,424) | 36,954 | 7.4 | 2445 (0.5) [6%] | 25,936 (5.2) [65%] | 70% | 31,226 (6.2) [79%] | 7801 (1.6) [20%] | 21% | 453 (0.1) [1%] | +330 (+1%) | |
| Northern Territory (247,058) | 1348 | 5.5 | 22 (0.1) [2%] | 720 (2.9) [51%] | 52% | 434 (1.8) [31%] | 575 (2.3) [41%] | 42% | 6 (0.0) [0%] | 0 (0%) | |
| Western Australia (2,594,181) | 23,001 | 8.9 | 834 (0.3) [3%] | 15,354 (5.9) [62%] | 64% | 8402 (229.8) [34%] | 6212 (2.4) [25%] | 26% | 148 (0.1) [1%] | +496 (+2%) | |
| Tasmania (528,298) | 4731 | 9.0 | 117 (0.2) [3%] | 3881 (7.3) [84%] | 86% | 3017 (5.7) [65%] | 622 (1.2) [13%] | 14% | 21 (0.0) [0%] | 0 (0%) | |
| National (24,982,688) | 179,615 | 7.2 | 9132 (0.4) [5%] | 115,494 (4.6) [65%] | 69% | 124,625 (5.0) [70%] | 50,022 (2.0) [28%] | 30% | 2319 (0.1) [1%] | +1902 (+1%) | |
| Admission outcomes: | |||||||||||
| Admissions nationally | 176,965 | 9132 [5%] | 115,494 [65%] | 50,022 [28%] | 2319 [1%] | ||||||
| Intakes: | |||||||||||
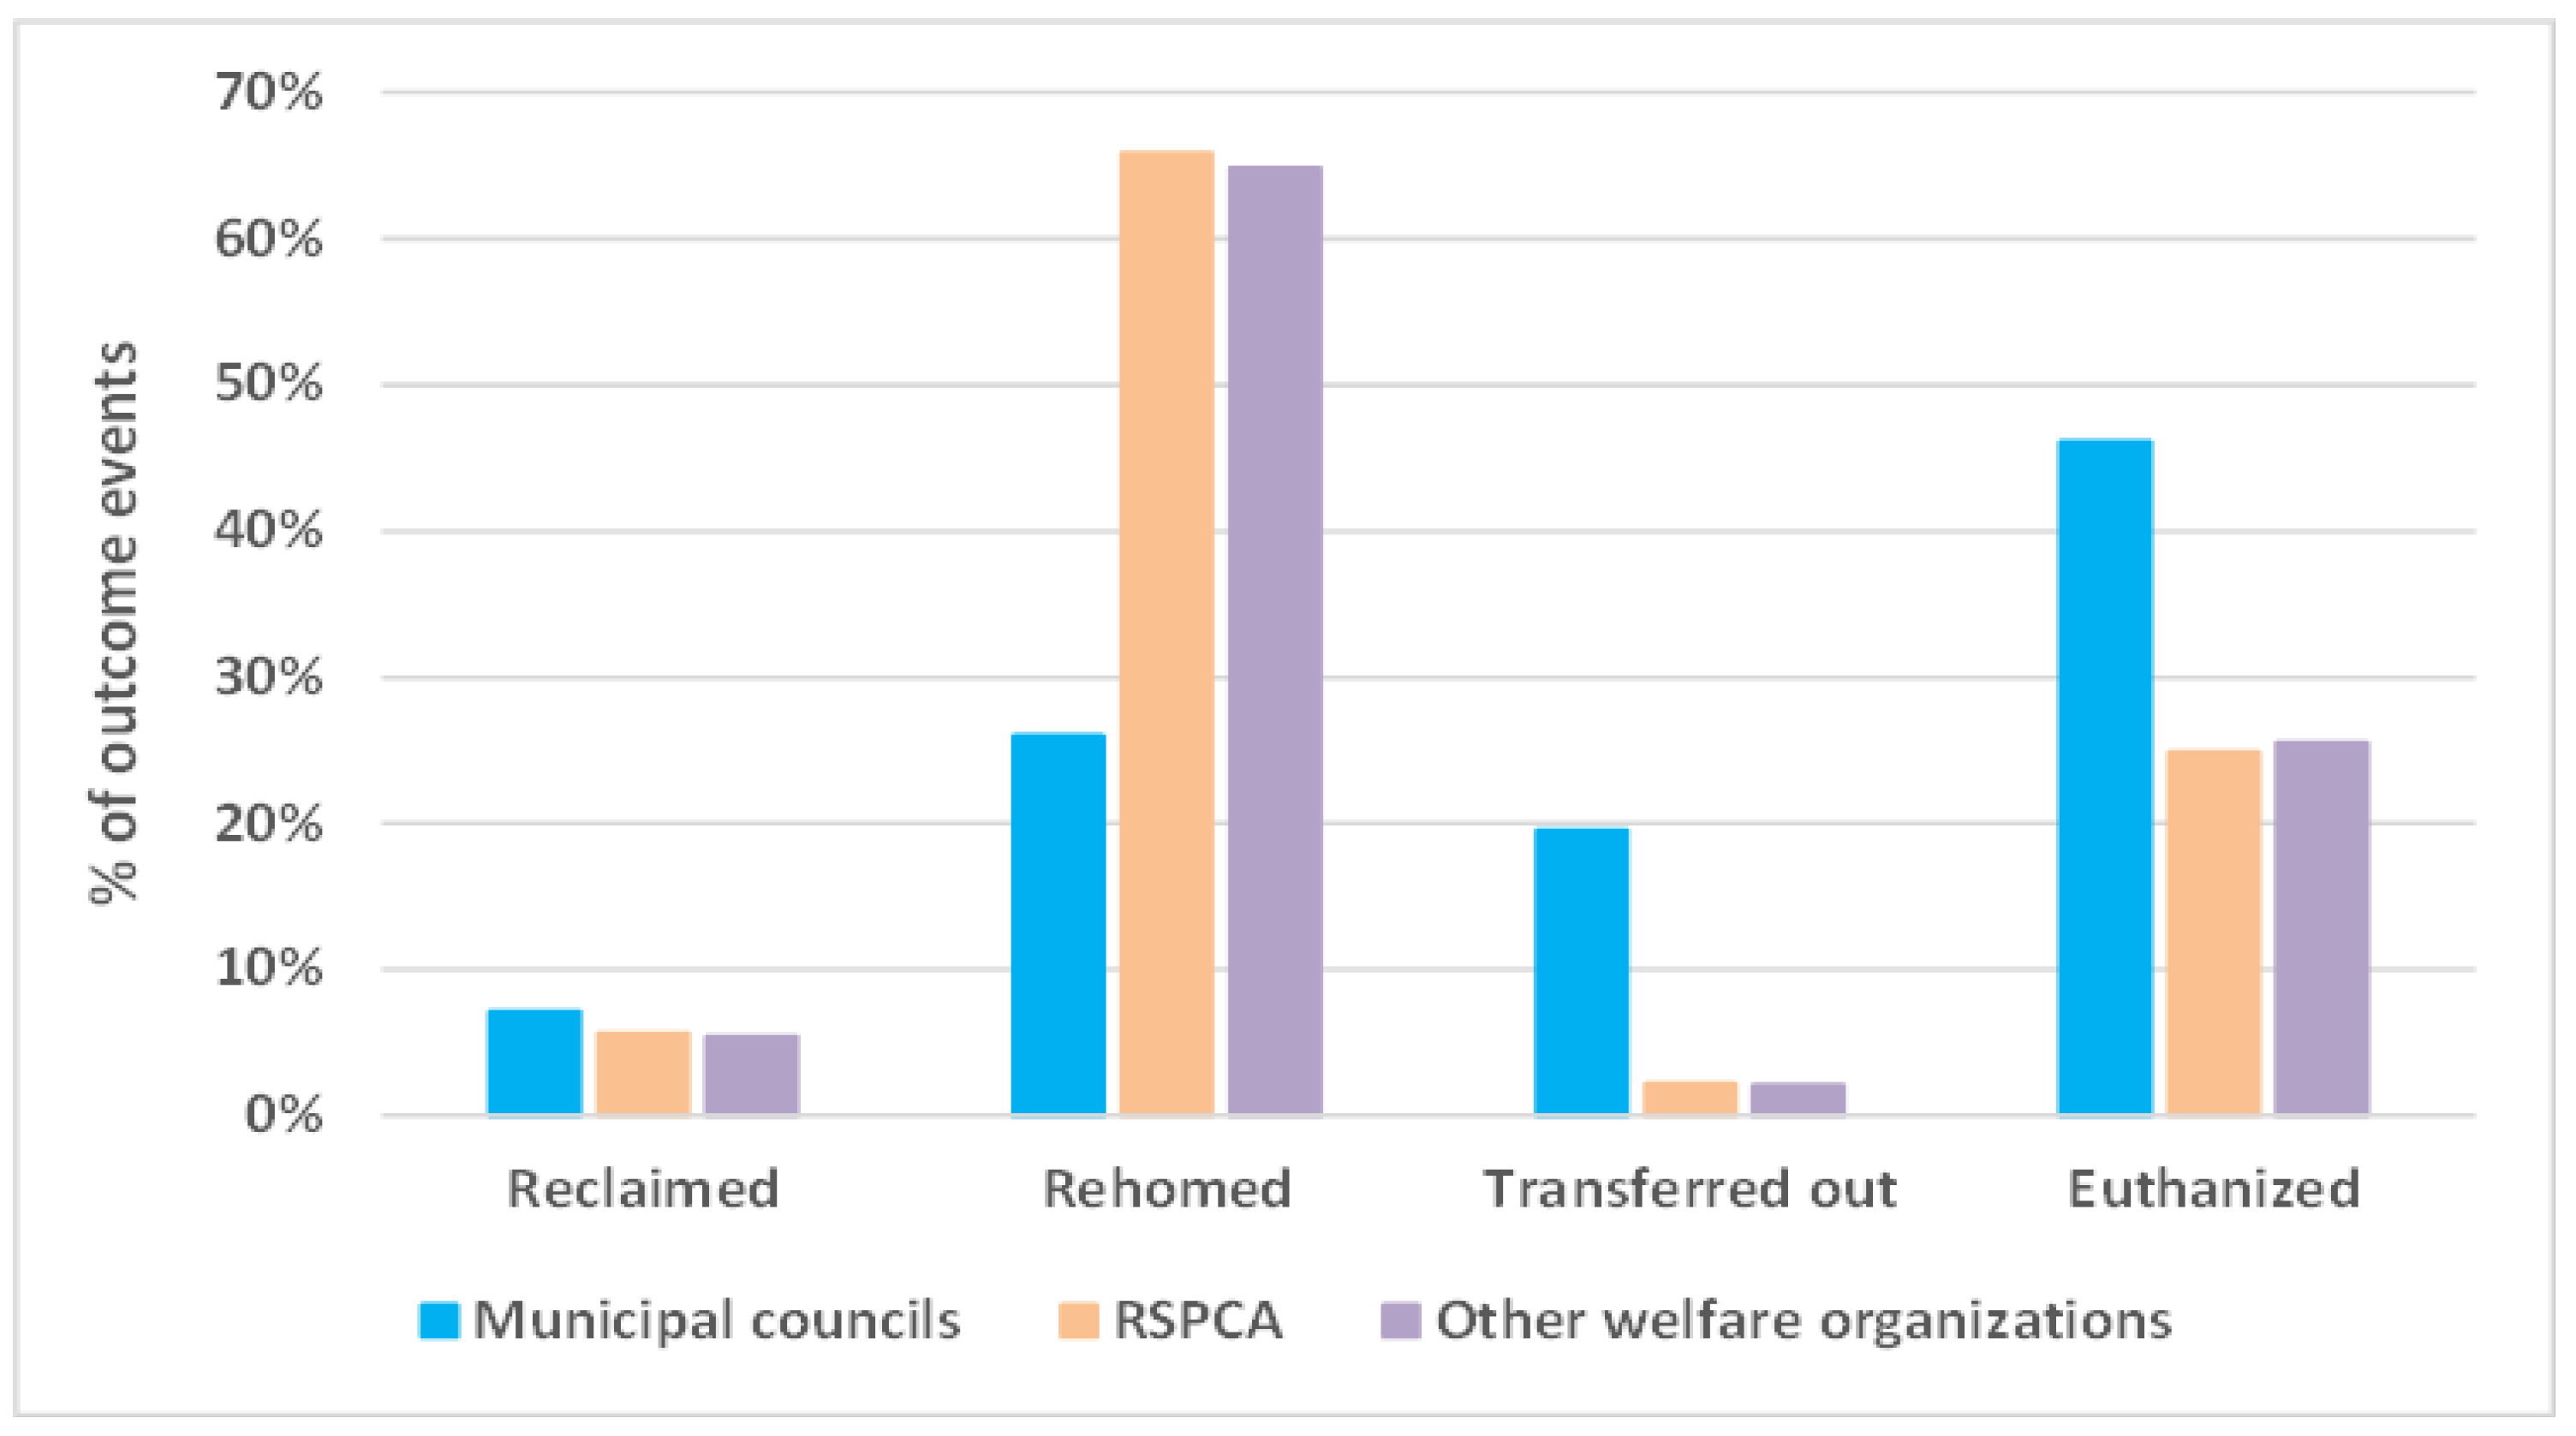
| Municipal councils | 58,121 * | 2.3 | 4007 (0.2) [7%] | 14,775 (0.6) [26%] | 28% | 11,004 (0.44) [19%] | 29,785 (1.2) [53%] | 26,036 (1.0) [46%] | 50% | 666 (0.0) [1%] | +1329 (+2%) |
| Welfare organizations: | |||||||||||
| - RSPCA | 47,388 * | 1.9 | 2665 (0.1) [6%] | 31,105 (1.2) [66%] | 70% | 1033 (0.04) [2%] | 34,803 (1.4) [74%] | 11,740 (0.5) [25%] | 26% | 683 (0.0) [1%] | 0 (0%) |
| - Other organizations | 45,924 * | 1.8 | 2460 (0.1) [5%] | 29,222 (1.2) [65%] | 69% | 932 (0.04) [2%] | 32,614 (1.3) [72%] | 11,486 (0.5) [25%] | 27% | 970 (0.0) [2%] | +573 (+1%) |
| Sub-total: | 93,312 * | 3.7 | 5125 (0.2) [6%] | 60,327 (2.4) [65%] | 69% | 1965 (0.08) [2%] | 67,417 (2.7) [73%] | 23,226 (0.9) [25%] | 27% | 1653 (0.1) [2%] | +573 (+1%) |
| Animal rescue groups | 41,355 * (28,753 7) * | 1.7 (1.2 7) | 0 (0.0) [0%] | 40,528 (1.6) [98%] | 98% | 0 (0.00) [0%] | 40,528 (1.6) [98%] | 827 (0.0) [2%] | 2% | 0 (0.0) [0%] | 0 (0%) |
| Total intake | 192,584 * | 7.7 | |||||||||
| State/Territory and Organization | Intake/Admission for Year | Outcomes during Year | Discrepancy 5 | ||||||||
|---|---|---|---|---|---|---|---|---|---|---|---|
| Returned to Owner (RTO) | Rehomed | Transferred Out | Released Alive 3 | Euthanized | Other Outcomes 4 | No. (%) 6 | |||||
| No. 1 | No. (Per 1000 Residents) [%] 2 | No. (Per 1000 Residents) [%] 2 | No. (Per 1000 Residents) [%] 2 | % Rehomed of Unclaimed | No. (Per 1000 Residents) [%] 2 | No. (Per 1000 Residents) [%] 2 | No. (Per 1000 Residents) [%] 2 | % Euthanized of Unclaimed | No. (Per 1000 Residents) [%] 2 | ||
| NEW SOUTH WALES (human population 7,980,168) | |||||||||||
| Municipal councils that ran own pound service pooled | 20,053 {19,928} | 2.5 {2.5} | 853 (0.1) [4%] | 4326 (0.5) [22%] | 23% | 6259 (0.8) [31%] | 11,438 (1.4) [57%] | 8176 (1.0) [41%] | 43% | 295 (0.0) [1%] | 0 (0%) |
| Welfare organizations: | |||||||||||
| 14,676 7 | 1.8 | 563 (0.1) [4%] | 7652 (1.0) [53%] | 55% | 288 (0.0) [2%] | 8503 (1.1) [59%] | 5735 (0.7) [40%] | 41% | 211 (0.0) [1%] | 0 (0%) |
| 1415 | 0.2 | 17 (0.0) [1%] | 986 (0.1) [83%] | 85% | 0 (0.0) [0%] | 1003 (0.1) [85%] | 179 (0.0) [15%] | 15% | 0 (0.0) [0%] | 0 (0%) |
| 2266 | 0.3 | 74 (0.0) [3%] | 1627 (0.2) [76%] | 79% | 0 (0.0) [0%] | 1701 (0.2) [80%] | 432 (0.1) [20%] | 21% | 0 (0.0) [0%] | +133 (+6%) |
| 862 | 0.1 | 3 (0.0) [0%] | 837 (0.1) [98%] | 98% | 0 (0.0) [0%] | 840 (0.1) [98%] | 10 (0.0) [1%] | 1% | 4 (0.0) [0%] | −45 (−5%) |
| 67 | 0.0 | 1 (0.0) [2%] | 57 (0.0) [92%] | 93% | 0 (0.0) [0%] | 58 (0.0) [94%] | 1 (0.0) [2%] | 2% | 3 (0.0) [5%] | 0 (0%) |
| Animal rescue groups pooled | 6547 [NA 8] | 0.8 [NA 8] | 0 (0.0) [0%] | 6416 (0.8) [98%] | 98% | 0 (0.0) [0%] | 6416 (0.8) [98%] | 131 (0.0) [2%] | 2% | 0 (0.0) [0%] | 0 (0%) |
| Admissions/outcomes for state | 39,339 | 4.9 | 1511 (0.2) [3%] | 21,901 (2.7) [49%] | 50% | 29,960 (3.8) [66%] | 14,664 (1.8) [32%] | 34% | 513 (0.1) [1%] | +88 (+0%) | |
| VICTORIA (human population 6,462,019) | |||||||||||
| Municipal councils that ran own pound service pooled | 13,150 {12,749} | 2.0 {2.0} | 1243 (0.2) [10%] | 5751 (0.9) [44%] | 49% | 330 (0.1) [3%] | 7324 (1.1) [57%] | 5631 (0.9) [43%] | 48% | 0 (0.0) [0%] | +195 (+1%) |
| Welfare organizations: | |||||||||||
| 11,2097 | 1.7 | 730 (0.1) [7%] | 7500 (1.2) [68%] | 72% | 391 (0.1) [4%] | 8621 (1.3) [78%] | 2369 (0.4) [21%] | 23% | 113 (0.0) [1%] | 0 (0%) |
| 2925 | 0.5 | 434 (0.1) [15%] | 1711 (0.3) [59%] | 69% | 32 (0.0) [1%] | 2177 (0.3) [75%] | 692 (0.1) [24%] | 28% | 42 (0.0) [1%] | +14 (+0%) |
| 10,549 | 1.6 | 881 (0.1) [8%] | 3867 (0.6) [37%] | 40% | 0 (0.0) [0%] | 4748 (0.7) [46%] | 5029 (0.8) [48%] | 53% | 654 (0.1) [6%] | +118 (+1%) |
| 938 | 0.1 | 0 (0.0) [0%] | 522 (0.1) [75%] | 75% | 37 (0.0) [5%] | 559 (0.1) [80%] | 37 (0.0) [5%] | 5% | 100 (0.0) [11%] | +242 (+26%) |
| 1400 | 0.2 | 105 (0.0) [7%] | 1274 (0.2) [84%] | 90% | 0 (0.0) [0%] | 1379 (0.2) [90%] | 146 (0.0) [10%] | 10% | 0 (0.0) [0%] | −125 (−9%) |
| 2981 | 0.5 | 203 (0.0) [7%] | 2127 (0.3) [70%] | 75% | 366 (0.1) [12%] | 2696 (0.4) [89%] | 342 (0.1) [11%] | 12% | 0 (0.0) [0%] | −57 (−2%) |
| Animal rescue groups pooled | 10,897 [10,107 8] | 1.7 [1.6 8] | 0 (0.0) [0%] | 10,679 (1.7) [98%] | 98% | 0 (0.0) [0%] | 10,679 (1.7) [98%] | 218 (0.0) [2%] | 2% | 0 (0.0) [0%] | 0 (0%) |
| Admissions/outcomes for state | 52,893 | 8.2 | 3596 (0.6) [7%] | 33,431 (5.2) [62%] | 67% | 38,183 (5.9) [71%] | 14,464 (2.2) [27%] | 29% | 909 (0.1) [2%] | +387 (+1%) | |
| SOUTH AUSTRALIA (human population 1,736,527) | |||||||||||
| Municipal councils that ran own pound service pooled | 2913 {1658} | 1.7 {1.0} | 60 (0.0) [3%] | 1102 (0.6) [48%] | 49% | 0 (0.0) [0%] | 1161 (0.7) [50%] | 1017 (0.6) [44%] | 45% | 132 (0.1) [6%] | +601 (+21%) |
| Welfare organizations: | |||||||||||
| 46937 | 2.7 | 265 (0.2) [6%] | 3317 (1.9) [70%] | 74% | 19 (0.0) [0%] | 3601 (2.1) [75%] | 1121 (0.6) [23%] | 25% | 50 (0.0) [1%] | 0 (0%) |
| 6781 | 3.9 | 142 (0.1) [2%] | 3415 (2.0) [50%] | 51% | 51 (0.0) [1%] | 3608 (2.1) [53%] | 3120 (1.8) [46%] | 47% | 53 (0.0) [1%] | 0 (0%) |
| Animal rescue groups pooled | 4550 [4480 8] | 2.6 [2.6 8] | 0 (0.0) [0%] | 4459 (2.6) [98%] | 98% | 0 (0.0) [0%] | 4459 (2.6) [98%] | 91 (0.1) [2%] | 2% | 0 (0.0) [0%] | 0 (0%) |
| Admissions/outcomes for state | 18,867 | 10.9 | 467 (0.3) [3%] | 12,293 (7.1) [67%] | 68% | 12,829 (7.4) [70%] | 5349 (3.1) [29%] | 30% | 235 (0.1) [1%] | +601 (+3%) | |
| AUSTRALIAN CAPITAL TERRITORY (human population 420,379) | |||||||||||
| Welfare organizations: | |||||||||||
| 1683 7 | 4.0 | 139 (0.3) [8%] | 1186 (2.8) [70%] | 77% | 9 (0.0) [1%] | 1334 (3.2) [79%] | 318 (0.8) [19%] | 21% | 34 (0.1) [2%] | 0 (0%) |
| Animal rescue groups pooled | 808 [799 8] | 1.9 [1.9 8] | 0 (0.0) [0%] | 792 (1.9) [98%] | 98% | 0 (0.0) [0%] | 792 (1.9) [98%] | 16 (0.0) [2%] | 2% | 0 (0.0) [0%] | 0 (0%) |
| Admissions/outcomes for territory | 2482 | 5.9 | 139 (0.3) [6%] | 1978 (4.7) [79%] | 84% | 2126 (5.1) [85%] | 334 (0.8) [13%] | 14% | 34 (0.1) [1%] | 0 (0%) | |
| QUEENSLAND (human population 5,009,424) | |||||||||||
| Councils pound service pooled | 11,446 {9570} | 2.3 {1.9} | 1182 (0.2) [11%] | 1334 (0.3) [12%] | 14% | 2695 (0.5) [25%] | 5063 (1.0) [46%] | 5597 (1.1) [51%] | 57% | 148 (0.0) [1%] | +330 (+3%) |
| Welfare organizations: | |||||||||||
| 12,621 7 | 2.5 | 901 (0.2) [7%] | 9833 (2.0) [77%] | 82% | 233 (0.0) [2%] | 10,967 (2.2) [85%] | 1666 (0.3) [13%] | 14% | 205 (0.0) [2%] | 0 (0%) |
| 4320 | 0.9 | 362 (0.1) [8%] | 3440 (0.7) [80%] | 88% | 65 (0.0) [2%] | 3867 (0.8) [90%] | 307 (0.1) [7%] | 8% | 100 (0.0) [2%] | 0 (0%) |
| Animal rescue groups pooled | 11,560 [8567 8] | 2.3 [1.7 8] | 0 (0.0) [0%] | 11,329 (2.3) [98%] | 98% | 0 (0.0) [0%] | 11,329 (2.3) [98%] | 231 (0.0) [2%] | 2% | 0 (0.0) [0%] | 0 (0%) |
| Admissions/outcomes for state | 36,954 | 7.4 | 2445 (0.5) [6%] | 25,936 (5.2) [65%] | 70% | 31,226 (6.2) [79%] | 7801 (1.6) [20%] | 21% | 453 (0.1) [1%] | +330 (+1%) | |
| NORTHERN TERRITORY (human population 247,058) | |||||||||||
| Councils pound service pooled | 645 {590} | 2.6 {2.4} | 16 (0.1) [3%] | 0 (0.0) [0%] | 0% | 82 (0.3) [13%] | 98 (0.4) [15%] | 547 (2.2) [85%] | 87% | 0 (0.0) [0%] | 0 (0%) |
| Welfare organizations: | |||||||||||
| 387 | 1.6 | 6 (0.0) [2%] | 330 (1.3) [91%] | 93% | 0 (0.0) [0%] | 336 (1.4) [93%] | 20 (0.1) [6%] | 6% | 6 (0.0) [2%] | 0 (0%) |
| Animal rescue groups pooled | 398 [316] | 1.6 [1.3] | 0 (0.0) [0%] | 390 (1.6) [98%] | 98% | 0 (0.0) [0%] | 0 (0.0) [0%] | 8 (0.0) [2%] | 2% | 0 (0.0) [0%] | 0 (0%) |
| Admissions/outcomes for territory | 1348 | 5.5 | 22 (0.1) [2%] | 720 (2.9) [51%] | 52% | 434 (1.8) [31%] | 575 (2.3) [41%] | 42% | 6 (0.0) [0%] | 0 (0%) | |
| WESTERN AUSTRALIA (human population 2,594,181) | |||||||||||
| Councils pound service pooled | 9709 {3635} | 3.7 {1.4} | 652 (0.3) [7%] | 2126 (0.8) [22%] | 24% | 1637 (0.6) [17%] | 0 (0.0) [0%] | 5000 (1.9) [53%] | 56% | 91 (0.0) [1%] | +203 (+2%) |
| Welfare organizations: | |||||||||||
| 890 7 | 0.3 | 22 (0.0) [3%] | 570 (0.2) [65%] | 67% | 93 (0.0) [11%] | 685 (18.7) [78%] | 135 (0.1) [15%] | 16% | 57 (0.0) [6%] | 0 (0%) |
| 8919 | 3.4 | 160 (0.1) [2%] | 7176 (2.8) [83%] | 84% | 381 (0.1) [4%] | 7717 (211.0) [89%] | 965 (0.4) [11%] | 11% | 0 (0.0) [0%] | +293 (+3%) |
| Animal rescue groups pooled | 5594 [3483 8] | 2.2 [1.3 8] | 0 (0.0) [0%] | 5482 (2.1) [98%] | 98% | 0 (0.0) [0%] | 0 (0.0) [0%] | 112 (0.0) [2%] | 2% | 0 (0.0) [0%] | 0 (0%) |
| Admissions/outcomes for state | 23,001 | 8.9 | 834 (0.3) [3%] | 15,354 (5.9) [62%] | 64% | 8402 (229.8) [34%] | 6212 (2.4) [25%] | 26% | 148 (0.1) [1%] | +496 (+2%) | |
| TASMANIA (human population 528,298) | |||||||||||
| Councils pound service pooled | 0 {0} | 0.0 {0.0} | |||||||||
| Welfare organizations: | |||||||||||
| 12297 | 2.3 | 39 (0.1) [3%] | 717 (1.4) [63%] | 65% | 0 (0.0) [0%] | 756 (1.4) [66%] | 376 (0.7) [33%] | 34% | 7 (0.0) [1%] | 0 (0%) |
| 1040 | 2.0 | 15 (0.0) [1%] | 932 (1.8) [90%] | 91% | 0 (0.0) [0%] | 947 (1.8) [91%] | 79 (0.1) [8%] | 8% | 14 (0.0) [1%] | 0 (0%) |
| 1461 | 2.8 | 63 (0.1) [4%] | 1251 (2.4) [86%] | 89% | 0 (0.0) [0%] | 1314 (2.5) [90%] | 147 (0.3) [10%] | 11% | 0 (0.0) [0%] | 0 (0%) |
| Animal rescue groups pooled | 1001 [1001 8] | 1.9 [1.9 8] | 0 (0.0) [0%] | 981 (1.9) [98%] | 98% | 0 (0.0) [0%] | 0 (0.0) [0%] | 20 (0.0) [2%] | 2% | 0 (0.0) [0%] | 0 (0%) |
| Admissions/outcomes for territory | 4731 | 9.0 | 117 (0.2) [3%] | 3881 (7.3) [84%] | 86% | 3017 (5.7) [65%] | 622 (1.2) [13%] | 14% | 21 (0.0) [0%] | 0 (0%) | |
| State and Statistic | Mean 1 | Standard Deviation | Median | Lower Quartile Range (Minimum to 25th Percentile) | Upper Quartile Range (75th Percentile to Maximum) |
|---|---|---|---|---|---|
| New South Wales (n = 61) 2 | |||||
| Human population (no. residents) in council area | 70,591 | 96,182 | 8900 | 373,486 | 72,630 to 373,486 |
| Intake | 312 | 377 | 178 | 51 to 106 | 416 to 2437 |
| Intake/1000 human residents in council area | 21 | 39 | 7 | 0.2 to 2 | 24 to 245 |
| Percentage reclaimed 3 | 5 | 4 | 4 | 0 to 2 | 5 to 18 |
| Percentage rehomed 3 | 17 | 20 | 9 | 0 to 0 | 30 to 70 |
| Percentage euthanized 3 | 46 | 27 | 42 | 2 to 25 | 67 to 100 |
| Percentage of unclaimed rehomed 3 | 17 | 21 | 9 | 0 to 0 | 31 to 70 |
| Percentage of unclaimed euthanized 3 | 48 | 27 | 46 | 2 to 27 | 67 to 100 |
| Victoria (n = 34) 4 | |||||
| Human population (no. residents) in council area | 47,743 | 56,619 | 25,539 | 3862 to 11,521 | 62,585 to 255,367 |
| Intake | 389 | 414 | 217 | 54 to 125 | 476 to 1544 |
| Intake/1000 human residents in council area | 11 | 7 | 9 | 1 to 6 | 16 to 27 |
| Percentage reclaimed 3 | 10 | 6 | 9 | 2 to 5 | 14 to 24 |
| Percentage rehomed 3 | 37 | 24 | 37 | 0 to 15 | 58 to 76 |
| Percentage euthanized 3 | 49 | 26 | 47 | 0 to 28 | 73 to 98 |
| Percentage of unclaimed rehomed 3 | 42 | 27 | 41 | 0 to 16 | 65 to 86 |
| Percentage of unclaimed euthanized 3 | 54 | 28 | 52 | 0 to 30 | 79 to 100 |
| Organization | Year | Intake | % Change | No. of Cats Euthanized | % Change |
|---|---|---|---|---|---|
| Municipal councils pooled 1 | 2016/17 | 20,025/17,566 1 | +3%/+8% 1, 2 | 8104/6852 | +4%/+13% 1, 2 |
| 2017/18 | 20,630/19,044 1 | +13%/+5% 1, 2 | 8404/7757 | +12%/+4% 1, 2 | |
| 2018/19 | 23,368/19,967 1 | +17%/+14% 1, 3 | 9419/8046 | +16%/+17% 1, 3 | |
| RSPCA | 2016/17 | 15,608 | −2% 2 | 6571 | −7%2 |
| 2017/18 | 15,309 | −4% 2 | 6118 | −6%2 | |
| 2018/19 | 14,676 | −6% 3 | 5735 | −13%3 | |
| Animal Welfare League | 2016/17 | 2236 4 | −28% 2 | 267 | −20%2 |
| 2017/18 | 1614 4 | −7% 2 | 214 | −16%2 | |
| 2018/19 | 1506 4 | −33% 3 | 179 | −33%3 |
Disclaimer/Publisher’s Note: The statements, opinions and data contained in all publications are solely those of the individual author(s) and contributor(s) and not of MDPI and/or the editor(s). MDPI and/or the editor(s) disclaim responsibility for any injury to people or property resulting from any ideas, methods, instructions or products referred to in the content. |
© 2023 by the authors. Licensee MDPI, Basel, Switzerland. This article is an open access article distributed under the terms and conditions of the Creative Commons Attribution (CC BY) license (https://creativecommons.org/licenses/by/4.0/).
Share and Cite
Chua, D.; Rand, J.; Morton, J. Stray and Owner-Relinquished Cats in Australia—Estimation of Numbers Entering Municipal Pounds, Shelters and Rescue Groups and Their Outcomes. Animals 2023, 13, 1771. https://doi.org/10.3390/ani13111771
Chua D, Rand J, Morton J. Stray and Owner-Relinquished Cats in Australia—Estimation of Numbers Entering Municipal Pounds, Shelters and Rescue Groups and Their Outcomes. Animals. 2023; 13(11):1771. https://doi.org/10.3390/ani13111771
Chicago/Turabian StyleChua, Diana, Jacquie Rand, and John Morton. 2023. "Stray and Owner-Relinquished Cats in Australia—Estimation of Numbers Entering Municipal Pounds, Shelters and Rescue Groups and Their Outcomes" Animals 13, no. 11: 1771. https://doi.org/10.3390/ani13111771