
Dietary Betaine Impacts Metabolic Responses to Moderate Heat Exposure in Sheep

Abstract
:Simple Summary
Abstract
1. Introduction
2. Materials and Methods
2.1. Animals, Housing, and Treatments
2.2. Metabolic Challenges
2.3. Tissue Biopsies
2.4. mRNA Extraction and RT-PCR Analysis
2.5. Statistical Analysis
3. Results
3.1. Metabolic Challenges

| Thermoneutral | Heat Exposure | p-Value | ||||||||
|---|---|---|---|---|---|---|---|---|---|---|
| Betaine (g/day) | 0 | 2 | 4 | 0 | 2 | 4 | SED 2 | Temp 3 | Betaine 4 | Within Betaine 5 |
| Glucose, mmol/L | 3.65 | 3.65 | 3.90 | 3.87 | 3.73 | 3.83 | 1.096 | 0.73 | 0.90 | 0.56 |
| Insulin, mU/L | 3.16 | 8.37 | 5.89 | 6.44 | 8.27 | 10.6 | 1.448 | 0.069 | 0.017 | 0.79 |
| Insulin:glucose, mU/mmol | 1.04 | 2.35 | 1.63 | 2.29 | 3.28 | 3.37 | 1.009 | 0.033 | 0.11 | 0.69 |
| NEFA, mmol/L | 283 | 217 | 169 | 229 | 207 | 175 | 1.247 | 0.56 | 0.036 | 0.065 |
| HOMA-IR | 0.575 | 1.73 | 1.14 | 1.58 | 1.98 | 2.17 | 0.5759 | 0.029 | 0.061 | 0.63 |
| RQUICKI | 0.458 | 0.361 | 0.380 | 0.382 | 0.357 | 0.344 | 0.0274 | 0.015 | 0.001 | 0.92 |
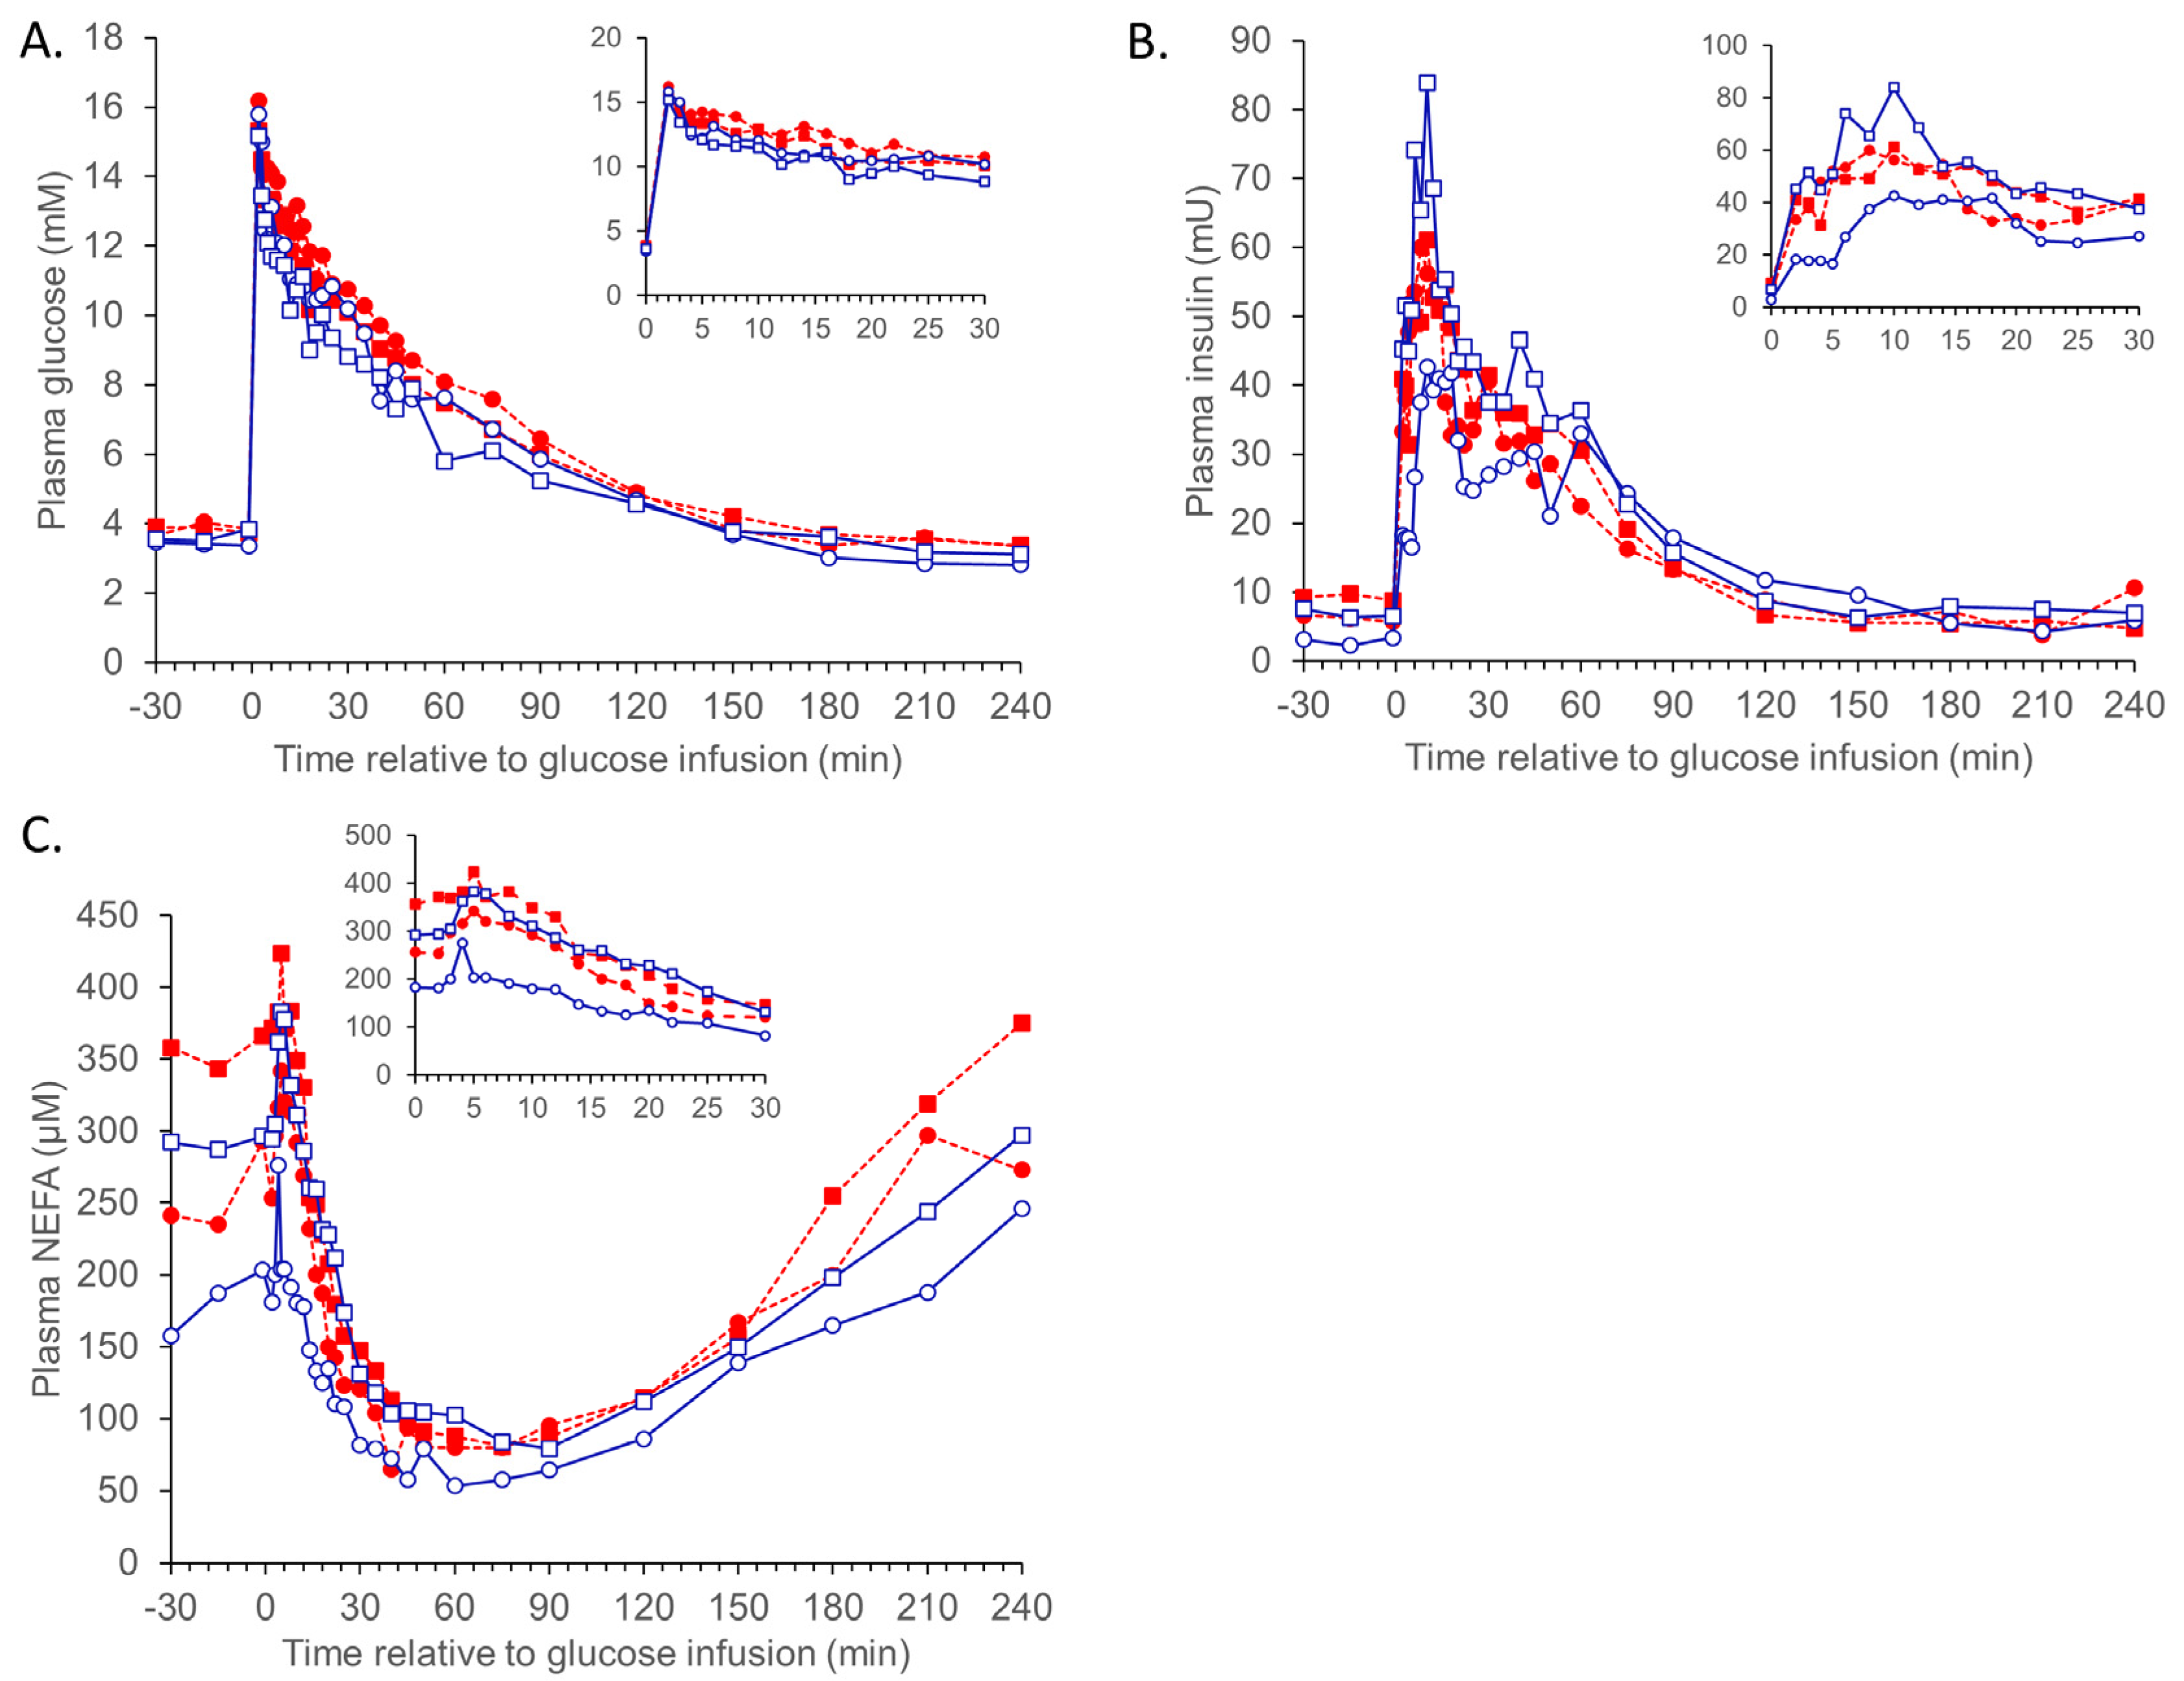
3.1.1. IVGTT

| Thermoneutral | Heat Exposure | p-Value | ||||||||
|---|---|---|---|---|---|---|---|---|---|---|
| Betaine (g/day) | 0 | 2 | 4 | 0 | 2 | 4 | SED 2 | Temp 3 | Betaine 4 | Within Betaine 5 |
| Glucose baseline (mM) | 3.43 | 3.39 | 3.79 | 4.11 | 3.33 | 4.10 | 1.300 | 0.51 | 0.21 | 0.85 |
| Glucose peak (mM) | 15.9 | 17.6 | 16.4 | 16.4 | 17.1 | 17.2 | 1.106 | 0.78 | 0.33 | 0.67 |
| Glucose CR6–30 % min−1 | −0.004 | −0.004 | −0.007 | −0.005 | −0.005 | −0.007 | 0.0012 | 0.19 | 0.21 | 0.009 |
| Insulin baseline (mU/L) | 3.00 | 7.44 | 6.13 | 7.69 | 9.91 | 12.2 | 1.550 | 0.026 | 0.006 | 0.73 |
| G:IBaseline | 1.22 | 0.467 | 0.663 | 0.591 | 0.424 | 0.366 | 1.518 | 0.055 | 0.024 | 0.85 |
| Insulin peak (mU/L) | 59.8 | 124 | 80.5 | 85.3 | 83.8 | 96.2 | 1.531 | 0.79 | 0.13 | 0.42 |
| Insulin AUC0–5 (mU/L.min) | 71.1 | 247 | 144 | 164 | 147 | 173 | 40.25 | 0.78 | 0.032 | 0.14 |
| Insulin AUC0–20 (mU/L.min) | 664 | 1379 | 882 | 1067 | 766 | 1251 | 285.8 | 0.47 | 0.30 | 0.35 |
| Insulin AUC0–240 (mU/L.min) | 6451 | 3792 | 3034 | 2635 | 2362 | 2333 | 1931.0 | 0.048 | 0.26 | 0.23 |
| Insulin CR6–60min % min−1 | −0.002 | −0.006 | −0.004 | −0.007 | −0.002 | −0.008 | 0.0022 | 0.46 | 0.45 | 0.64 |
| NEFA baseline (µM) | 351 | 260 | 246 | 342 | 360 | 248 | 1.349 | 0.56 | 0.22 | 0.16 |
| NEFA peak (µM) | 537 | 541 | 313 | 493 | 541 | 313 | 2.584 | 0.64 | 0.81 | 0.99 |
| NEFA nadir (µM) | 45.1 | 61.8 | 53.2 | 63.1 | 57.5 | 43.1 | 1.273 | 0.97 | 0.13 | <0.001 |
| Thermoneutral | Heat Exposure | p-Value | ||||||||
|---|---|---|---|---|---|---|---|---|---|---|
| Betaine (g/day) | 0 | 2 | 4 | 0 | 2 | 4 | SED 2 | Temp 3 | Betaine 4 | Within Betaine 5 |
| Gb (mg/dL) | 58.7 | 70.9 | 68.5 | 65.9 | 72.7 | 72.8 | 9.756 | 0.51 | 0.20 | 0.60 |
| Ib (mU/L) | 3.33 | 7.40 | 6.08 | 6.39 | 7.29 | 9.70 | 1.766 | 0.09 | 0.037 | 0.99 |
| Insulin resistance ((mM.mU/L)2) | 0.48 | 1.29 | 1.04 | 1.05 | 1.15 | 1.65 | 0.2803 | 0.09 | 0.015 | 0.48 |
| AIRg ((mU/L)·min−1) | 162 | 364 | 242 | 271 | 205 | 308 | 72.67 | 0.97 | 0.23 | 0.44 |
| SI ((mU/L)−1·min−1) | 6.52 | 5.20 | 4.03 | 10.43 | 4.91 | 4.73 | 2.478 | 0.43 | 0.041 | 0.33 |
| DI | 1070 | 2002 | 971 | 2678 | 985 | 1354 | 697.0 | 0.49 | 0.26 | 0.33 |
| Sg | 0.010 | 0.009 | 0.018 | 0.011 | 0.013 | 0.013 | 0.0040 | 0.88 | 0.33 | 0.28 |
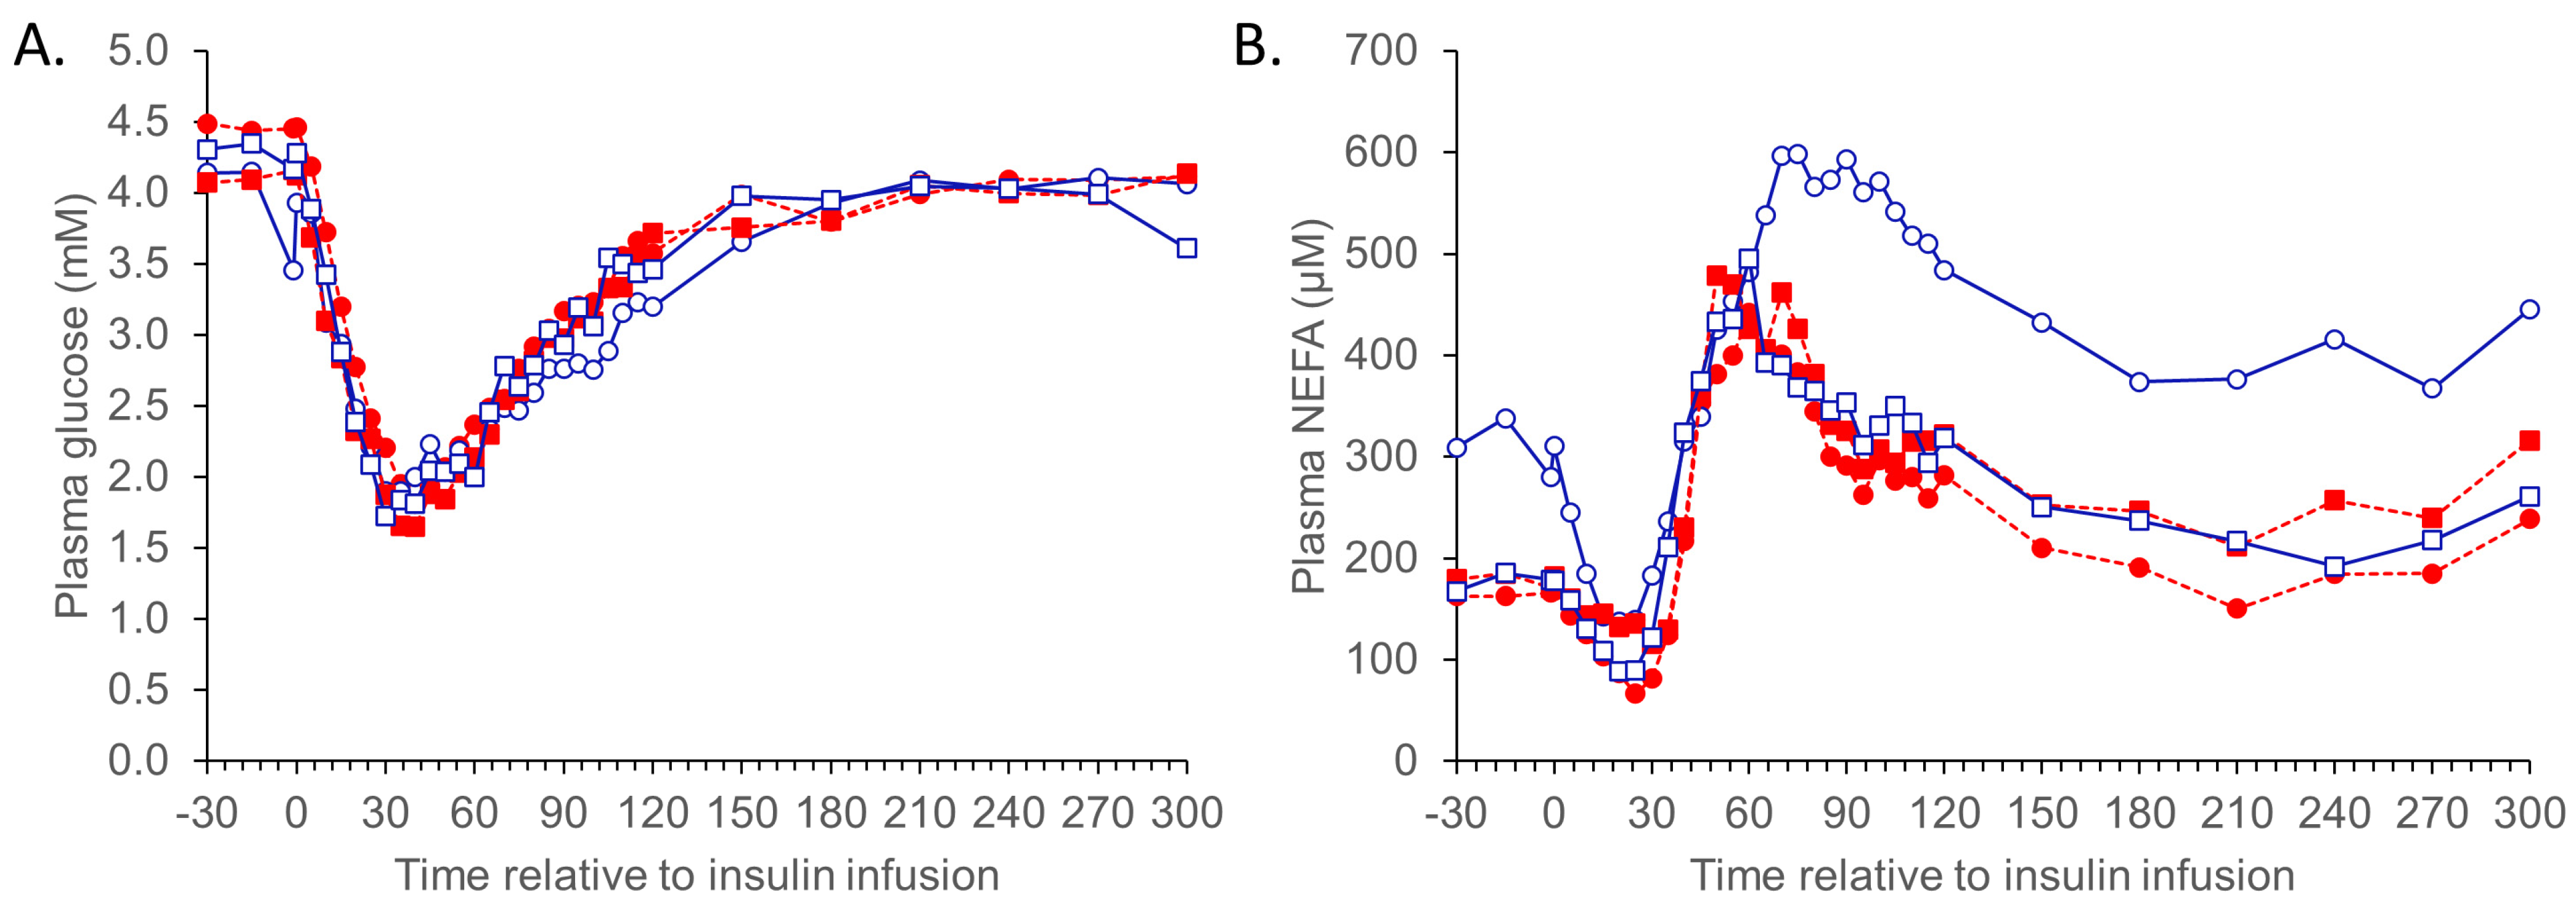
3.1.2. ITT

| Thermoneutral | Heat Exposure | p-Value | ||||||||
|---|---|---|---|---|---|---|---|---|---|---|
| 0 | 2 | 4 | 0 | 2 | 4 | SED 2 | Temp 3 | Betaine 4 | Within Betaine 5 | |
| Glucose baseline (mM) | 3.93 | 4.20 | 4.36 | 4.46 | 4.32 | 3.90 | 1.102 | 0.80 | 0.99 | 0.62 |
| Glucose nadir (mM) | 1.61 | 1.36 | 1.55 | 1.73 | 1.62 | 1.23 | 1.189 | 0.98 | 0.15 | 0.55 |
| Glucose peak (mM) | 4.50 | 4.28 | 4.69 | 4.46 | 4.54 | 4.14 | 1.108 | 0.66 | 0.81 | 0.67 |
| NEFA baseline (µM) | 234 | 216 | 147 | 168 | 145 | 147 | 1.376 | 0.22 | 0.31 | 0.37 |
| NEFA peak (µM) | 780 | 652 | 513 | 502 | 617 | 522 | 1.288 | 0.28 | 0.57 | 0.23 |
| NEFA nadir (µM) | 104 | 64.7 | 63.5 | 50.9 | 86.1 | 77.1 | 1.527 | 0.74 | 0.97 | 0.82 |
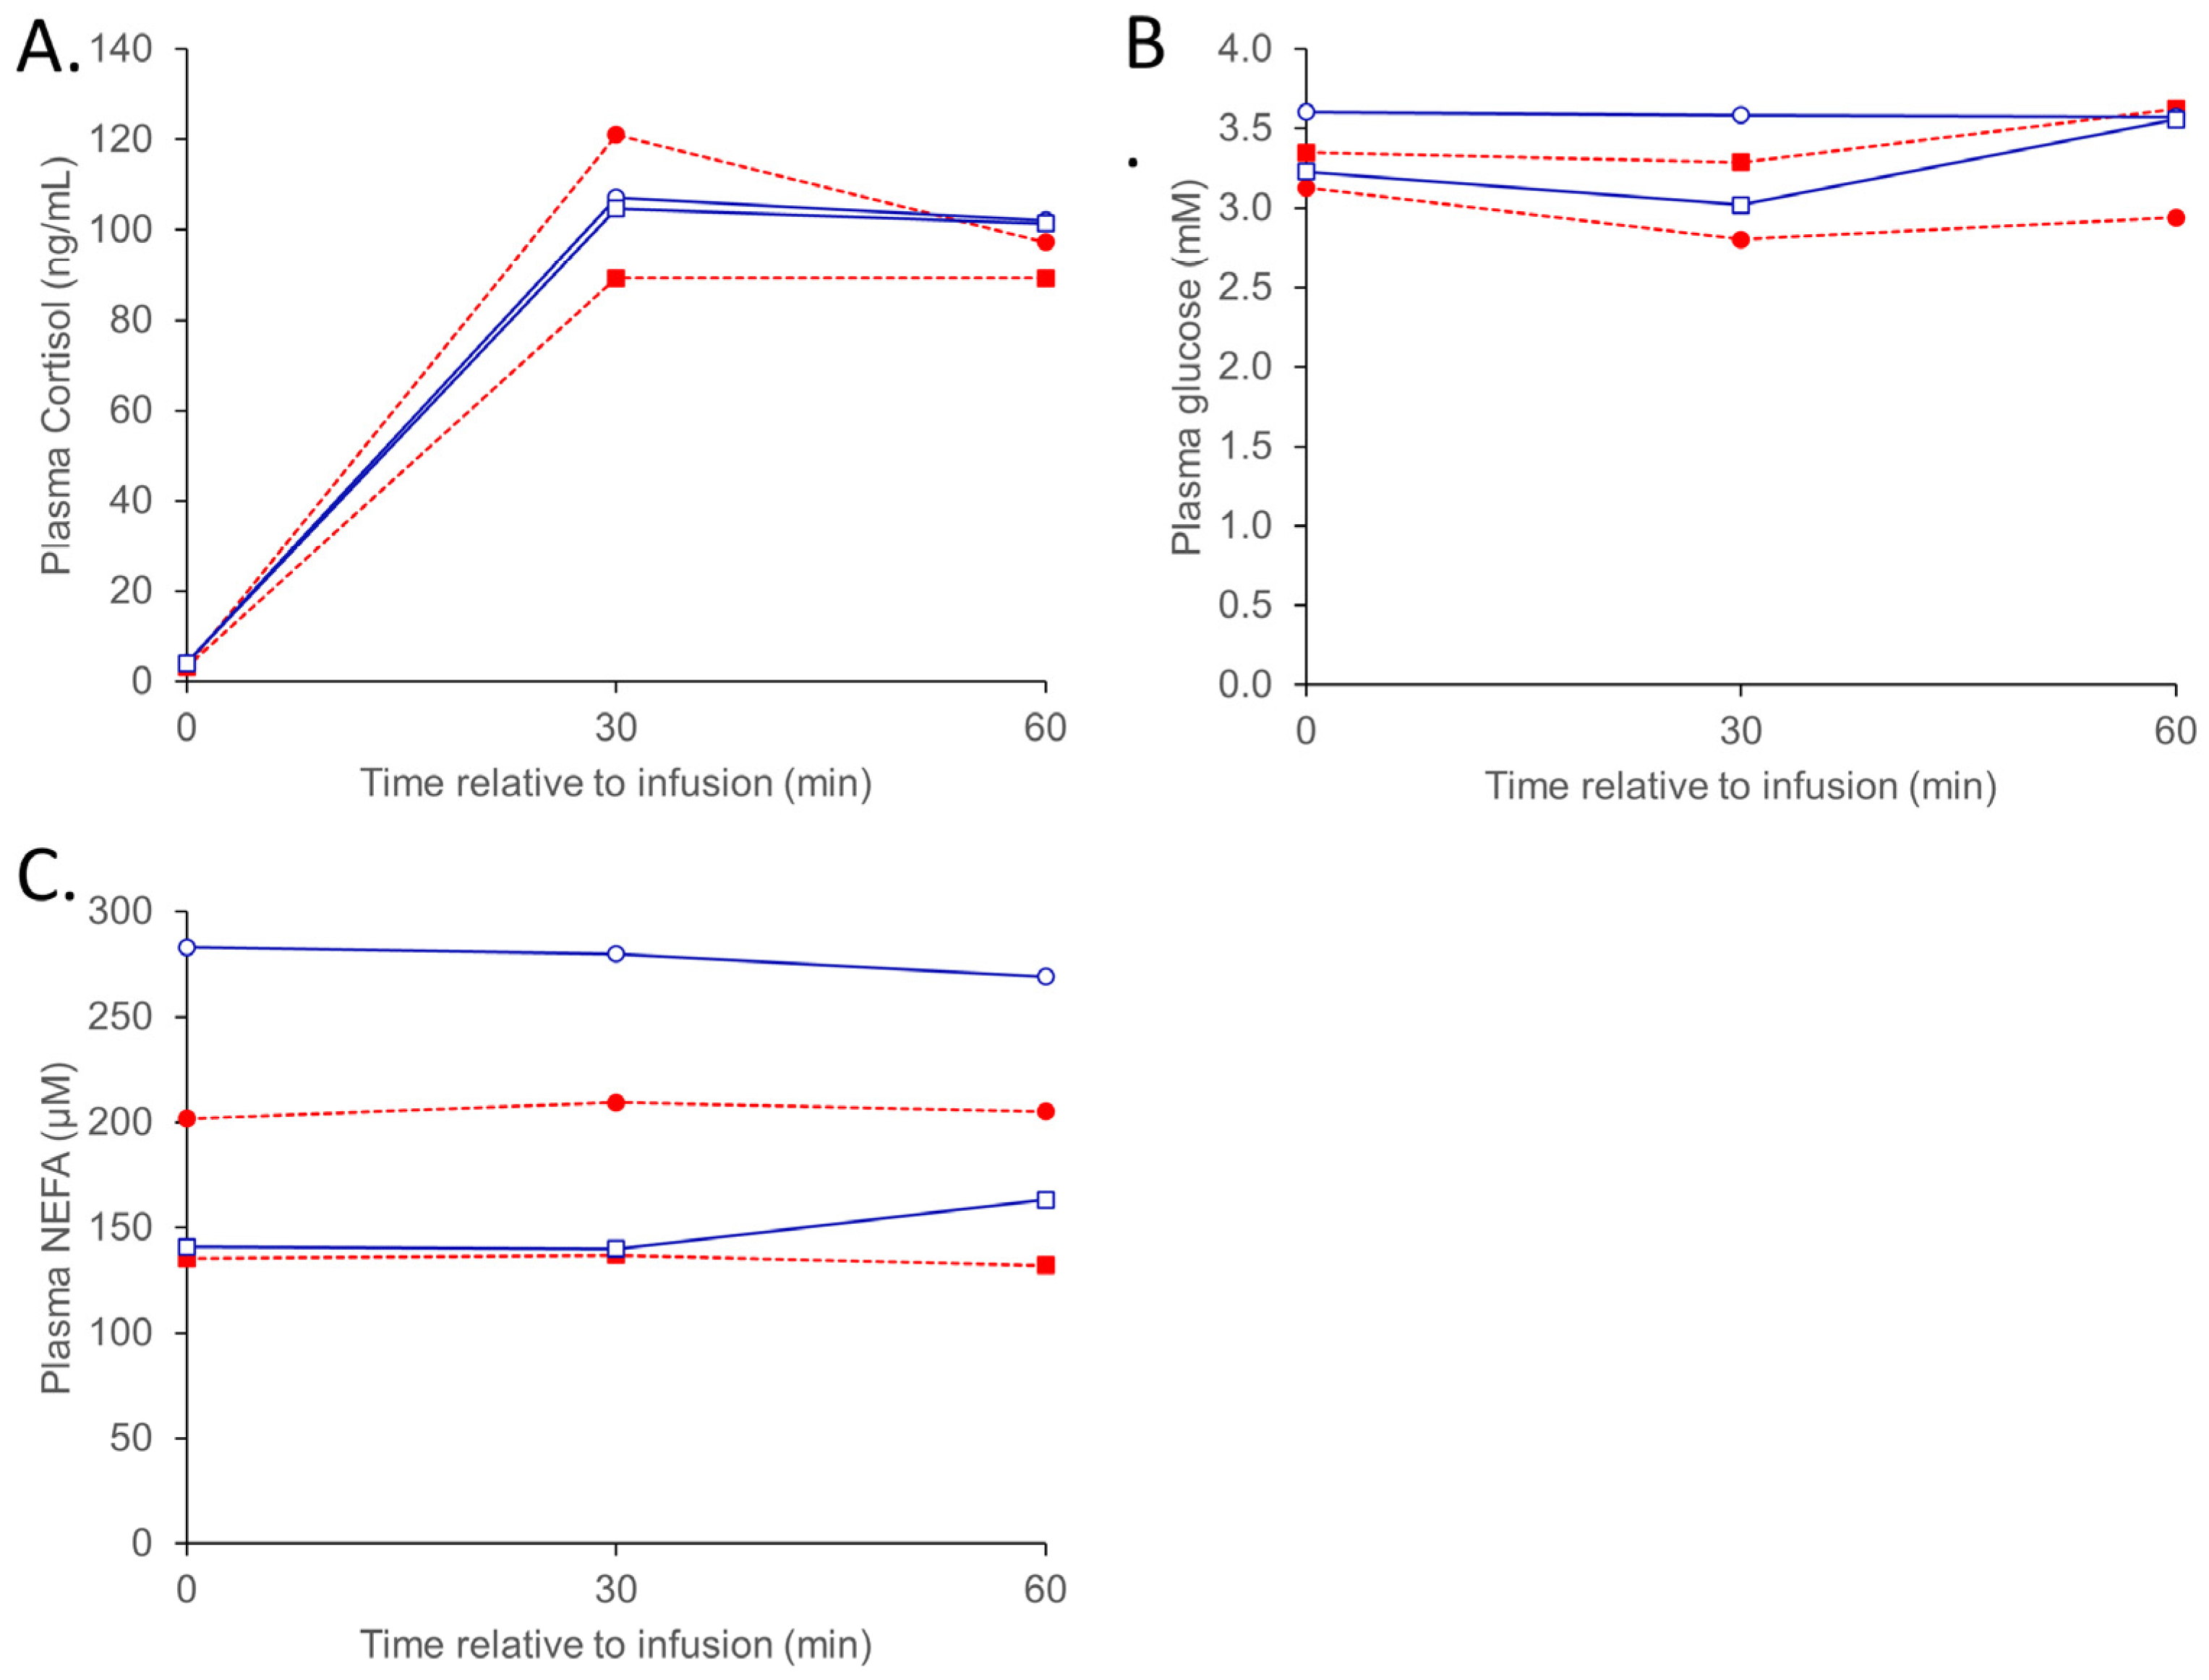
3.1.3. ACTH
| Thermoneutral | Heat Exposure | p-Value | ||||||||
|---|---|---|---|---|---|---|---|---|---|---|
| 0 | 2 | 4 | 0 | 2 | 4 | SED 2 | Temp 3 | Betaine 4 | Within Betaine 5 | |
| Cortisol baseline (µM) | 6.68 | 2.95 | 4.35 | 5.50 | 4.96 | 6.54 | 1.484 | 0.29 | 0.23 | 0.22 |
| Cortisol peak (µM) | 113 | 96.2 | 106 | 128 | 126 | 95.1 | 1.263 | 0.48 | 0.34 | 0.55 |
| NEFA baseline (µM) | 283 | 166 | 119 | 202 | 134 | 137 | 1.444 | 0.52 | 0.019 | 0.56 |
| NEFA peak (µM) | 348 | 227 | 162 | 263 | 157 | 157 | 1.375 | 0.28 | 0.007 | 0.50 |
| Glucose baseline (mM) | 3.59 | 3.20 | 3.24 | 3.12 | 3.42 | 3.25 | 1.210 | 0.77 | 0.80 | 0.88 |
| Glucose peak (mM) | 3.81 | 3.79 | 3.58 | 3.27 | 3.58 | 3.90 | 1.138 | 0.58 | 0.52 | 0.89 |

3.2. Tissue Gene Expression
4. Discussion
5. Conclusions
Author Contributions
Funding
Institutional Review Board Statement
Informed Consent Statement
Data Availability Statement
Acknowledgments
Conflicts of Interest
References
- Blaxter, K.L.; Graham, N.M.; Wainman, F.W.; Armstrong, D.G. Environmental temperature, energy metabolism and heat regulation in sheep. II. The partition of heat losses in closely clipped sheep. J. Agr. Sci. 1959, 52, 25–40. [Google Scholar] [CrossRef]
- Joy, A.; Dunshea, F.R.; Leury, B.J.; Clarke, I.J.; DiGiacomo, K.; Chauhan, S.S. Resilience of small ruminants to climate change and increased environmental temperature: A review. Animals 2020, 10, 867. [Google Scholar] [CrossRef]
- Blackshaw, J.K.; Blackshaw, A.W. Heat stress in cattle and the effect of shade on production and behaviour: A review. Aust. J. Exp. Agric. 1994, 34, 285–295. [Google Scholar] [CrossRef]
- Alhidary, I.A.; Shini, S.; Al Jassim, R.A.M.; Gaughan, J.B. Physiological responses of Australian Merino wethers exposed to high heat load. J. Anim. Sci. 2012, 90, 212–220. [Google Scholar] [CrossRef] [PubMed]
- Collier, R.J.; Beede, D.K.; Thatcher, W.W.; Israel, L.A.; Wilcox, C.J. Influences of environment and its modification on dairy animal health and production. J. Dairy Sci. 1982, 65, 2213–2227. [Google Scholar] [CrossRef]
- Annison, E.F. Plasma non-esterified fatty acids in sheep. Aust. J. Agric. Res. 1960, 11, 58–64. [Google Scholar] [CrossRef]
- Rhoads, M.L.; Rhoads, R.P.; VanBaale, M.J.; Collier, R.J.; Sanders, S.R.; Weber, W.J.; Crooker, B.A.; Baumgard, L.H. Effects of heat stress and plane of nutrition on lactating Holstein cows: I. Production, metabolism, and aspects of circulating somatotropin. J. Dairy Sci. 2009, 92, 1986–1997. [Google Scholar] [CrossRef]
- Shwartz, G.; Rhoads, M.L.; VanBaale, M.J.; Rhoads, R.P.; Baumgard, L.H. Effects of a supplemental yeast culture on heat-stressed lactating Holstein cows. J. Dairy Sci. 2009, 92, 935–942. [Google Scholar] [CrossRef]
- Wheelock, J.B.; Rhoads, R.P.; Vanbaale, M.J.; Sanders, S.R.; Baumgard, L.H. Effects of heat stress on energetic metabolism in lactating Holstein cows. J. Dairy Sci. 2010, 93, 644–655. [Google Scholar] [CrossRef]
- Johnson, J.D.; Fleshner, M. Releasing signals, secretory pathways, and immune function of endogenous extracellular heat shock protein 72. J. Leukoc. Biol. 2006, 79, 425–434. [Google Scholar] [CrossRef]
- Pockley, G.A. Heat shock proteins as regulators of the immune response. Lancet 2003, 362, 469–476. [Google Scholar] [CrossRef] [PubMed]
- Sonna, L.A.; Fujita, J.; Gaffin, S.L.; Lilly, C.M. Molecular biology of thermoregulation: Invited review: Effects of heat and cold stress on mammalian gene expression. J. Appl. Physiol. 2002, 92, 1725–1742. [Google Scholar] [CrossRef]
- Henry, B.A.; Dunshea, F.R.; Gould, M.; Clarke, I.J. Profiling postprandial thermogenesis in muscle and fat of sheep and the central effect of leptin administration. Endocrinology 2008, 149, 2019–2026. [Google Scholar] [CrossRef] [PubMed]
- Chauhan, S.S.; Celi, P.; Fahri, F.T.; Leury, B.J.; Dunshea, F.R. Dietary antioxidants at supranutritional doses modulate skeletal muscle heat shock protein and inflammatory gene expression in sheep exposed to heat stress. J. Anim. Sci. 2014, 92, 4897–4908. [Google Scholar] [CrossRef] [PubMed]
- Gaughan, J.; Bonner, S.; Loxton, I.; Mader, T. Effects of chronic heat stress on plasma concentration of secreted heat shock protein 70 in growing feedlot cattle. J. Anim. Sci. 2013, 91, 120–129. [Google Scholar] [CrossRef]
- Dunshea, F.R.; Leury, B.J.; Fahri, F.; DiGiacomo, K.; Hung, A.; Chauhan, S.; Clarke, I.J.; Collier, R.; Little, S.; Baumgard, L.H.; et al. Amelioration of thermal stress impacts in dairy cows. Anim. Prod. Sci. 2013, 53, 965–975. [Google Scholar] [CrossRef]
- Garner, J.B.; Douglas, M.L.; Williams, S.R.O.; Wales, W.J.; Marett, L.C.; Nguyen, T.T.T.; Reich, C.M.; Hayes, B.J. Genomic selection improves heat tolerance in dairy cattle. Sci. Rep. 2016, 6, 34114. [Google Scholar] [CrossRef]
- Joy, A.; Dunshea, F.R.; Leury, B.J.; DiGiacomo, K.; Clarke, I.J.; Zhang, M.H.; Abhijith, A.; Osei-Amponsah, R.; Chauhan, S.S. Comparative assessment of thermotolerance in Dorper and Second-Cross (Poll Dorset/Merino × Border Leicester) lambs. Animals 2020, 10, 2441. [Google Scholar] [CrossRef]
- Suster, D.; Leury, B.J.; King, R.H.; Mottram, M.; Dunshea, F.R. Interrelationships between porcine somatotropin (pST), betaine, and energy level on body composition and tissue distribution of finisher boars. Aust. J. Agric. Res. 2004, 55, 983–990. [Google Scholar] [CrossRef]
- Moeckel, G.W.; Shadman, R.; Fogel, J.M.; Sadrzadeh, S.M.H. Organic osmolytes betaine, sorbitol and inositol are potent inhibitors of erythrocyte membrane ATPases. Life Sci. 2002, 71, 2413–2424. [Google Scholar] [CrossRef]
- Eklund, M.; Bauer, E.; Wamatu, J.; Mosenthin, R. Potential nutritional and physiological functions of betaine in livestock. Nutr. Res. Rev. 2005, 18, 31–48. [Google Scholar] [CrossRef] [PubMed]
- Fernandez, C.; Gallego, L.; Lopez-Bote, C.J. Effect of betaine on fat content in growing lambs. Anim. Feed Sci. Tech. 1998, 73, 329–338. [Google Scholar] [CrossRef]
- Loest, C.A.; Titgemeyer, E.C.; Drouillard, J.S.; Coetzer, C.M.; Hunter, R.D.; Bindel, D.J.; Lambert, B.D. Supplemental betaine and peroxide-treated feather meal for finishing cattle. J. Anim. Sci. 2002, 80, 2234–2240. [Google Scholar] [CrossRef] [PubMed]
- Loxton, I.; Grant, T.P.; Reid, D.J.; Lawrence, R.J. Effects of a supplement containing betaine on feedlot steers exposed to a heat load. In Proceedings of the Recent Advances in Animal Nutrition in Australia, Armidale, NSW, Australia, 9–11 July 2007; pp. 201–210. [Google Scholar]
- Huang, Q.C.; Xu, Z.R.; Han, X.Y.; Li, W.F. Changes in hormones, growth factor and lipid metabolism in finishing pigs fed betaine. Livest. Sci. 2006, 105, 78–85. [Google Scholar] [CrossRef]
- Caldas, T.; Demont-Caulet, N.; Ghazi, A.; Richarme, G. Thermoprotection by glycine betaine and choline. Microbiology 1999, 145, 2543–2548. [Google Scholar] [CrossRef]
- DiGiacomo, K.; Simpson, S.; Leury, B.J.; Dunshea, F.R. Dietary betaine impacts the physiological responses to moderate heat conditions in a dose dependent manner in sheep. Animals 2016, 6, 51. [Google Scholar] [CrossRef]
- Wang, C.; Liu, Q.; Yang, W.Z.; Wu, J.; Zhang, W.W.; Zhang, P.; Dong, K.H.; Huang, Y.X. Effects of betaine supplementation on rumen fermentation, lactation performance, feed digestibilities and plasma characteristics in dairy cows. J. Agr. Sci. 2010, 148, 487–495. [Google Scholar] [CrossRef]
- Mitchell, A.D.; Chappell, A.; Knox, K.L. Metabolism of betaine in the ruminant. J. Anim. Sci. 1979, 49, 764–774. [Google Scholar] [CrossRef]
- Baumgard, L.H.; Wheelock, J.B.; O’Brien, M.; Schwartz, G.; Zimbelman, R.B.; Sanders, S.R.; VanBaale, M.J.; Collier, R.J.; Rhoads, M.L.; Rhoads, R.P. The differential effects of heat stress vs. underfeeding on production and post-absorptive nutrient partitioning. In Proceedings of the 22nd Annual Southwest Nutrition & Management Conference, Tempe, Arizona, 22–23 February 2007; pp. 116–124. [Google Scholar]
- Rhoads, M.L.; Kim, J.W.; Collier, R.J.; Crooker, B.A.; Boisclair, Y.R.; Baumgard, L.H.; Rhoads, R.P. Effects of heat stress and nutrition on lactating Holstein cows: II. Aspects of hepatic growth hormone responsiveness. J. Dairy Sci. 2009, 93, 170–179. [Google Scholar] [CrossRef]
- Knott, S.A.; Cummins, L.J.; Dunshea, F.R.; Leury, B.J. Rams with poor feed efficiency are highly responsive to an exogenous adrenocorticotropin hormone (ACTH) challenge. Domest. Anim. Endocrinol. 2008, 34, 261–268. [Google Scholar] [CrossRef]
- Turner, A.I.; Canny, B.J.; Hobbs, R.J.; Bond, J.D.; Clarke, I.J.; Tilbrook, A.J. Influence of sex and gonadal status of sheep on cortisol secretion in response to ACTH and on cortisol and LH secretion in response to stress: Importance of different stressors. J. Endocrinol. 2002, 173, 113–122. [Google Scholar] [CrossRef]
- Johnson, M.M.; Peters, J.P. Technical note: An improved method to quantify nonesterified fatty acids in bovine plasma. J. Anim. Sci. 1993, 71, 753–756. [Google Scholar] [CrossRef]
- Trinder, P. Determination of glucose in blood using glucose oxidase with an alternative oxygen receptor. Ann. Clin. Biochem. 1969, 6, 24–25. [Google Scholar] [CrossRef]
- Hammon, H.M.; Bellmann, O.; Voigt, J.; Schneider, F.; Kühn, C. Glucose-dependent insulin response and milk production in Heifers within a segregating resource family population. J. Dairy Sci. 2007, 90, 3247–3254. [Google Scholar] [CrossRef] [PubMed]
- Pires, J.A.A.; Souza, A.H.; Grummer, R.R. Induction of hyperlipidemia by intravenous infusion of tallow emulsion causes insulin resistance in Holstein cows. J. Dairy Sci. 2007, 90, 2735–2744. [Google Scholar] [CrossRef] [PubMed]
- Perseghin, G.; Caumo, A.; Caloni, M.; Testolin, G.; Luzi, L. Incorporation of the fasting plasma FFA concentration into QUICKI improves its association with insulin sensitivity in nonobese individuals. J. Clin. Endocrinol. Metab. 2001, 86, 4776–4781. [Google Scholar] [CrossRef] [PubMed]
- Bergman, R.N.; Ider, Y.; Bowden, C.; Cobelli, C. Quantitative estimation of insulin sensitivity. Am. J. Physiol. Gastrointest. Liver Physiol. 1979, 236, 667–677. [Google Scholar] [CrossRef]
- Bergman, R.N.; Steil, G.M.; Bradley, D.C.; Watanabe, R.M. Modeling of insulin action in vivo. Annu. Rev. Physiol. 1992, 54, 861–883. [Google Scholar] [CrossRef]
- Boston, R.C.; Stefanovski, D.; Moate, P.J.; Sumner, A.E.; Watanabe, R.M.; Bergman, R.N. MINMOD Millennium: A computer program to calculate glucose effectiveness and insulin sensitivity from the frequently sampled intravenous glucose tolerance test. Diabetes Technol. Ther. 2003, 5, 1003–1015. [Google Scholar] [CrossRef]
- Finegood, D. Application of the Minimal Model of glucose kinetics. In The Minimal Model Approach and Determinants of Glucose Tolerance; Bergman, R.N., Lovejoy, J.C., Eds.; Louisiana State University press: Baton Rouge, LA, USA, 1997. [Google Scholar]
- Back, P.J.; Boston, R.C.; Palliser, C.C.; Kolver, E.S.; Chagas, L.M. Evaluation of a model that estimates insulin sensitivity in dairy cows. Proc. N. Z. Soc. Anim. Prod. 2007, 67, 261–265. [Google Scholar]
- Stanley, C.C. Regulation of Glucose Metabolism in Dairy Cattle. Ph.D. Thesis, Louisiana State University and Agricultural and Mechanical College, Baton Rouge, LA, USA, 1997. [Google Scholar]
- Zamuner, F.; Cameron, A.W.N.; Carpenter, E.K.; Leury, B.J.; DiGiacomo, K. Endocrine and metabolic responses to glucose, insulin, and adrenocorticotropin (ACTH) infusions in early-lactation dairy goats of high and low milk yield. J. Dairy Sci. 2020, 103, 12045–12058. [Google Scholar] [CrossRef] [PubMed]
- Villar, M.L.; Godwin, I.R.; Hegarty, R.S.; Dobos, R.C.; Smith, K.A.; Clay, J.W.; Nolan, J.V. The effects of dietary nitrate on plasma glucose and insulin sensitivity in sheep. J. Anim. Physiol. Anim. Nutr. Berl. 2019, 103, 1657–1662. [Google Scholar] [CrossRef] [PubMed]
- Hall, L.W.; Dunshea, F.R.; Allen, J.D.; Rungruang, S.; Collier, J.L.; Long, N.M.; Collier, R.J. Evaluation of dietary betaine in lactating Holstein cows subjected to heat stress. J. Dairy Sci. 2016, 99, 9745–9753. [Google Scholar] [CrossRef]
- Shah, A.M.; Ma, J.; Wang, Z.; Zou, H.; Hu, R.; Peng, Q. Betaine supplementation improves the production performance, rumen fermentation, and antioxidant profile of dairy cows in heat stress. Animals 2020, 10, 634. [Google Scholar] [CrossRef]
- Wang, Z.; Yao, T.; Pini, M.; Zhou, Z.; Fantuzzi, G.; Song, Z. Betaine improved adipose tissue function in mice fed a high fat diet: A mechanism for hepatoprotective effect of betaine in nonalcholic fatty liver disease. Am. J. Physiol. Gastrointest. Liver Physiol. 2010, 298, G634–G642. [Google Scholar] [CrossRef] [PubMed]
- Arumugam, M.K.; Paal, M.C.; Donohue, T.M.; Ganesan, M.; Osna, N.A.; Kharbanda, K.K. Beneficial effects of betaine: A comprehensive review. Biology 2021, 10, 456. [Google Scholar] [CrossRef]
- Huang, Q.C.; Xu, Z.R.; Han, X.Y.; Li, W.F. Effect of dietary betaine supplementation on lipogenic enzyme activities and fatty acid synthase mRNA expression in finishing pigs. Anim. Feed Sci. Tech. 2008, 140, 365–375. [Google Scholar] [CrossRef]
- Kathirvel, E.; Morgan, K.; Nandgiri, G.; Sandoval, B.C.; Caudill, M.A.; Bottiglieri, T.; French, S.W.; Morgan, T.R. Betaine improves nonalcoholic fatty liver and associated hepatic insulin resistance: A potential mechanism for hepatoprotection by betaine. Am. J. Physiol. Gastrointest. Liver Physiol. 2010, 299, G1068–G1077. [Google Scholar] [CrossRef]
- Hung, A.T.; Leury, B.J.; Sabin, M.A.; Fahri, F.; DiGiacomo, K.; Lien, T.-F.; Dunshea, F.R. Nano-chromium picolinate and heat stress enhance insulin sensitivity in cross-bred sheep. Anim. Nutr. 2023, 13, 173–184. [Google Scholar] [CrossRef]
- Baumgard, L.H.; Hausman, G.J.; Sanz Fernandez, M.V. Insulin: Pancreatic secretion and adipocyte regulation. Domest. Anim. Endocrinol. 2016, 54, 76–84. [Google Scholar] [CrossRef]
- Salama, A.A.K.; Hamzaoui, S.; Albanell, E.; Such, X.; Caja, G. Metabolic and behavior responses of lactating goats under heat stress. Small Rumin. Res. 2021, 203, 106496. [Google Scholar] [CrossRef]
- Mehaba, N.; Coloma-Garcia, W.; Such, X.; Caja, G.; Salama, A.A.K. Heat stress affects some physiological and productive variables and alters metabolism in dairy ewes. J. Dairy Sci. 2021, 104, 1099–1110. [Google Scholar] [CrossRef]
- Achmadi, J.; Yanagisawa, T.; Sano, H.; Terashima, Y. Pancreatic insulin secretory response and insulin action in heat-exposed sheep given a concentrate or roughage diet. Domest. Anim. Endocrinol. 1993, 10, 279–287. [Google Scholar] [CrossRef] [PubMed]
- DiGiacomo, K.; Dunshea, F.R.; Leury, B.J. Mild heat load alters some aspects of nutrient partitioning and gene expression in sheep. In Proceedings of the 63rd Annual Meeting of the European Federation of Animal Science, Bratislava, Slovakia, 27–31 August 2012; p. 369. [Google Scholar]
- Gonzalez-Rivas, P.A.; DiGiacomo, K.; Giraldo, P.A.; Leury, B.J.; Cottrell, J.J.; Dunshea, F.R. Reducing rumen starch fermentation of wheat with three percent sodium hydroxide has the potential to ameliorate the effect of heat stress in grain-fed wethers. J. Anim. Sci. 2017, 95, 5547–5562. [Google Scholar] [CrossRef]
- Chauhan, S.S.; Celi, P.; Leury, B.J.; Clarke, I.J.; Dunshea, F.R. Dietary antioxidants at supranutritional doses improve oxidative status and reduce the negative effects of heat stress in sheep. J. Anim. Sci. 2014, 92, 3364–3374. [Google Scholar] [CrossRef] [PubMed]
- DiGiacomo, K.; Simpson, S.; Leury, B.J.; Dunshea, F.R. Dietary betaine improves physiological responses in sheep under chronic heat load in a dose dependent manner. J. Anim. Sci. 2012, 90, 269. [Google Scholar]
| Gene | Abbreviation | Accession Number | Primer Sequence (5′→3′) | Annealing Temp. (°C) |
|---|---|---|---|---|
| Heat shock protein 72 | HSP 70 | U02892 | F: AACATGAAGAGCGCCGTGGAGG R: GTTACACACCTGCTCCAGCTCC | 61.0 |
| Heat shock protein 90 | HSP90 | * | F: GACTCCCAGGCATACTGCTC R: GGCGCTGATATCTCCATGAT | 60.0 |
| β-Actin | ACTB | * | F: CATCGAGCACGGCATCGTCA R: TAGCACAGCCTGGATAGCAAC | 56.0 |
| Peroxisome proliferator-activated receptor γ | PPγ | AY 137204 | F: CATAAAGTCCTTCCCGCTGA R: ACTGACACCCCTGGAAGATG | 60.7 |
| Leptin | * | AY278244 | F: CGTTCTGAGGCAGTTGTTGA R: CAAATGCCTTCCCTTCAATG | 58.5 |
| Adiponectin | * | NM_174742 | F: ATTATGACGGCAGCACTGG R: CCAGATGGAGGAGCACAGA | 51.0 |
| Hormone sensitive lipase | HSL | NM_001080220 | F: AGCATCTTCTTTCGCACCAG R: CCGTAGAAGCAGCCTTTGTG | 60.7 |
| Fatty acid synthase | FAS | AY343889 | F: CTGAGTCGGAGAACCTGGAG R: CGAAGAAGGAAGCGTCAAAC | 62.2 |
| Adenosine monophosphate kinase | AMPK | BT021145 | F: CTTCCGAGCCAGTAGTCACC R: ATGCCCGTGTCCTTGTTTAG | 62.2 |
| Thermoneutral | Heat Exposure | p-Value | |||||||||
|---|---|---|---|---|---|---|---|---|---|---|---|
| Betaine (g/day) | 0 | 2 | 4 | 0 | 2 | 4 | SED 2 | Temp 3 | Betaine 4 | Within Betaine 5 | |
| Adipose tissue | HSP70 | −2.59 | −4.04 | −5.85 | −4.41 | −3.95 | −4.16 | 0.949 | 0.68 | 0.44 | 0.22 |
| (100) | (273) | (954) | (352) | (256) | (296) | ||||||
| HSP90 | −2.96 | −3.50 | −3.95 | −3.50 | −2.95 | −3.68 | 0.453 | 0.90 | 0.36 | 0.03 | |
| (100) | (145) | (199) | (145) | (99) | (164) | ||||||
| Leptin | −2.99 | −5.57 | −7.16 | −5.17 | −5.55 | −5.65 | 2.062 | 0.86 | 0.19 | 0.58 | |
| (100) | (600) | (1800) | (452) | (590) | (630) | ||||||
| Adiponectin | −2.85 | −2.54 | −1.64 | −1.34 | −2.90 | −1.69 | 0.855 | 0.33 | 0.81 | 0.17 | |
| (100) | (81) | (43) | (35) | (104) | (45) | ||||||
| HSL | −1.07 | −1.61 | −1.20 | −1.55 | −1.85 | −1.98 | 0.770 | 0.28 | 0.43 | 0.59 | |
| (100) | (146) | (110) | (140) | (172) | (188) | ||||||
| PPARγ | −3.83 | −3.58 | −3.49 | −3.20 | −3.98 | −3.18 | 0.624 | 0.44 | 0.94 | 0.17 | |
| (100) | (84) | (79) | (64) | (111) | (64) | ||||||
| FAS | 0.39 | −1.52 | 1.61 | 0.03 | 1.61 | 2.11 | 1.598 | 0.39 | 0.29 | 0.01 | |
| (100) | (375) | (43) | (128) | (43) | (30) | ||||||
| Muscle | HSP70 | −4.87 | −4.54 | −4.85 | −4.34 | −4.40 | −5.00 | 0.476 | 0.60 | 0.70 | 0.20 |
| (100) | (80) | (99) | (69) | (77) | (109) | ||||||
| HSP90 | −2.33 | −2.71 | −2.83 | −2.47 | −2.34 | −2.94 | 0.374 | 0.91 | 0.18 | 0.12 | |
| (100) | (130) | (141) | (110) | (104) | (152) | ||||||
| AMPK | −8.42 | −8.65 | −9.01 | −9.26 | −8.90 | −9.02 | 0.443 | 0.15 | 0.84 | 0.44 | |
| (100) | (117) | (150) | (179) | (139) | (151) | ||||||
Disclaimer/Publisher’s Note: The statements, opinions and data contained in all publications are solely those of the individual author(s) and contributor(s) and not of MDPI and/or the editor(s). MDPI and/or the editor(s) disclaim responsibility for any injury to people or property resulting from any ideas, methods, instructions or products referred to in the content. |
© 2023 by the authors. Licensee MDPI, Basel, Switzerland. This article is an open access article distributed under the terms and conditions of the Creative Commons Attribution (CC BY) license (https://creativecommons.org/licenses/by/4.0/).
Share and Cite
DiGiacomo, K.; Simpson, S.; Leury, B.J.; Dunshea, F.R. Dietary Betaine Impacts Metabolic Responses to Moderate Heat Exposure in Sheep. Animals 2023, 13, 1691. https://doi.org/10.3390/ani13101691
DiGiacomo K, Simpson S, Leury BJ, Dunshea FR. Dietary Betaine Impacts Metabolic Responses to Moderate Heat Exposure in Sheep. Animals. 2023; 13(10):1691. https://doi.org/10.3390/ani13101691
Chicago/Turabian StyleDiGiacomo, Kristy, Sarah Simpson, Brian J. Leury, and Frank R. Dunshea. 2023. "Dietary Betaine Impacts Metabolic Responses to Moderate Heat Exposure in Sheep" Animals 13, no. 10: 1691. https://doi.org/10.3390/ani13101691