
Targeted Mop up and Robust Response Tools Can Achieve and Maintain Possum Freedom on the Mainland

Abstract
:Simple Summary
Abstract
1. Introduction
2. Materials and Methods
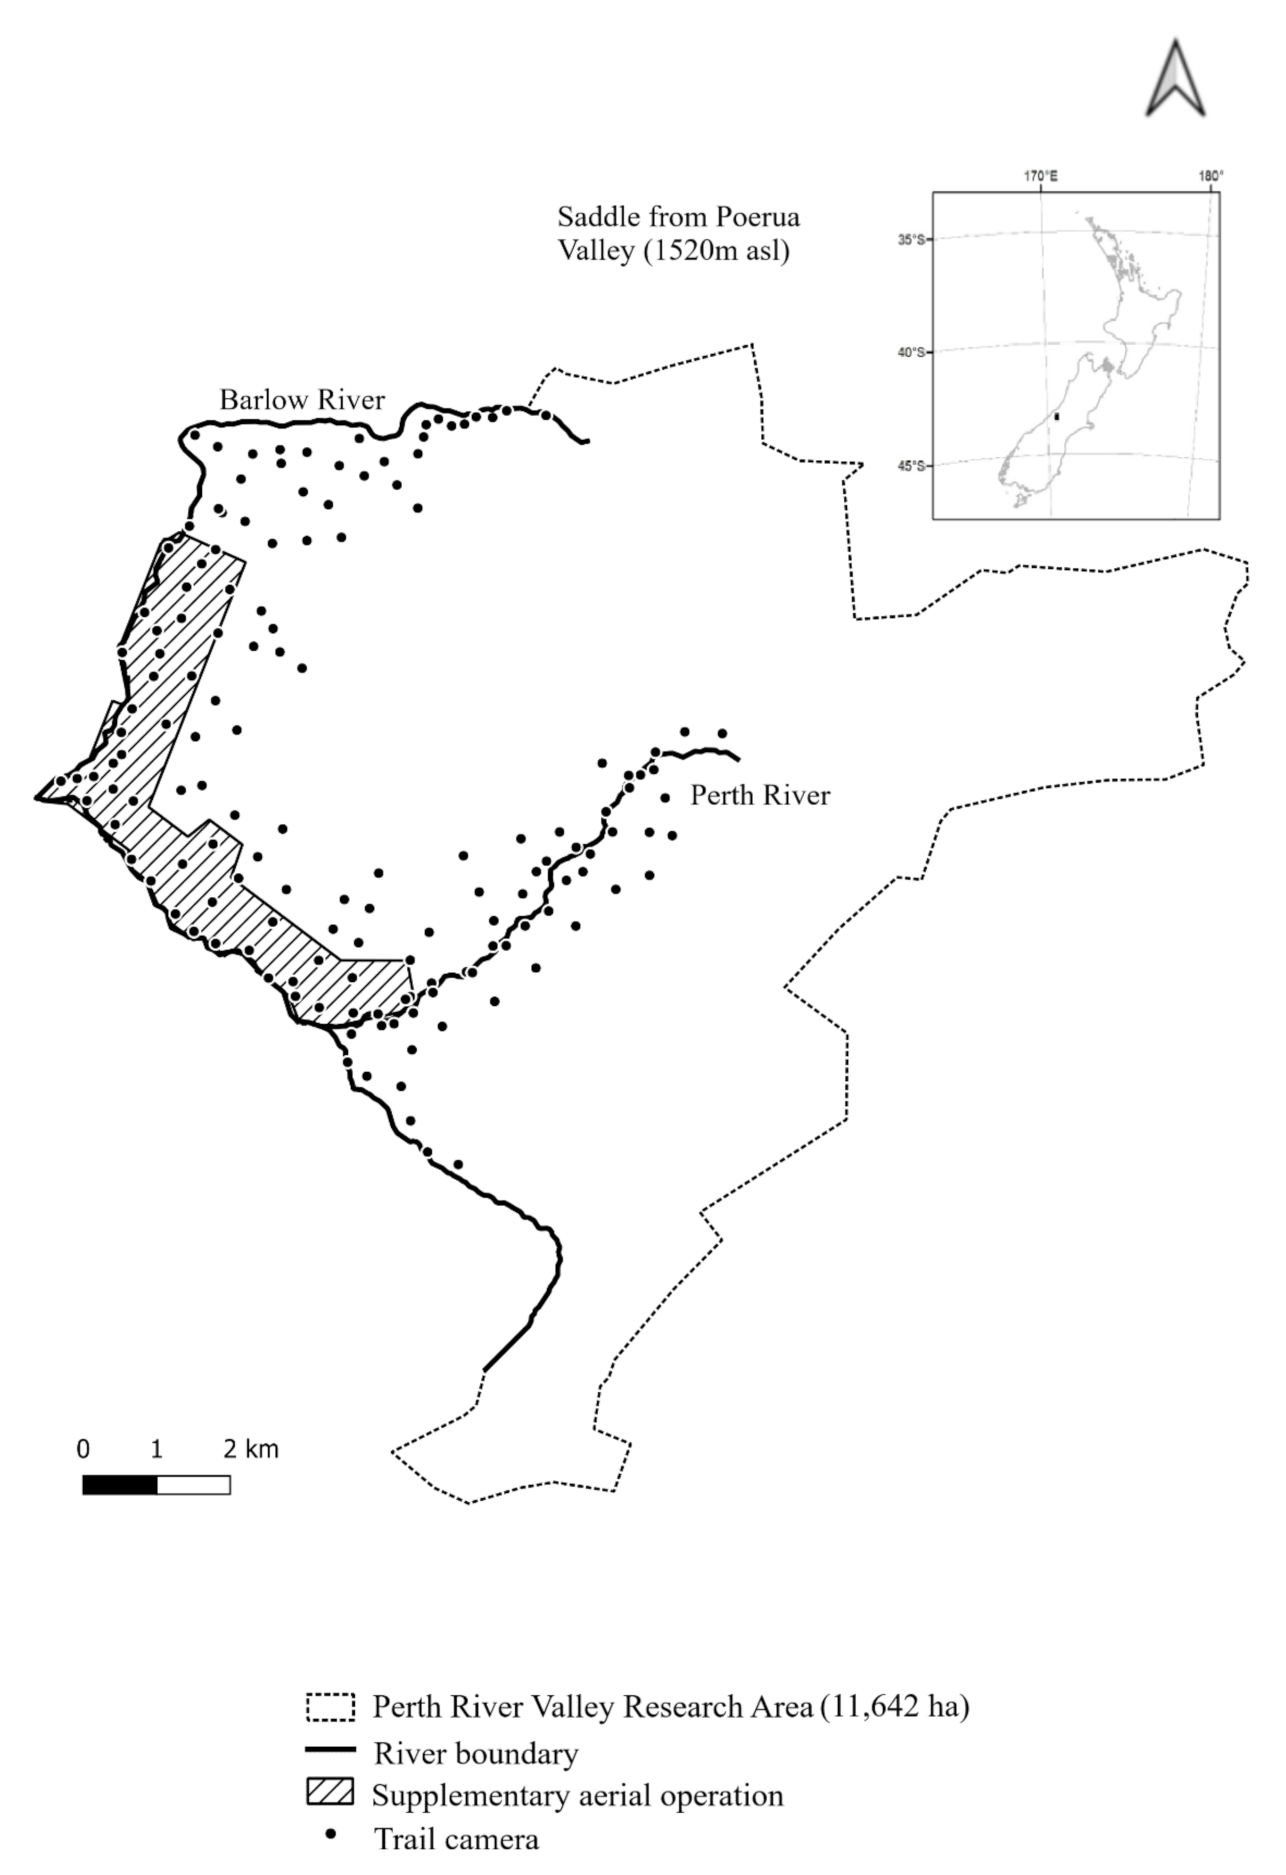
2.1. Study Site
2.2. Detection
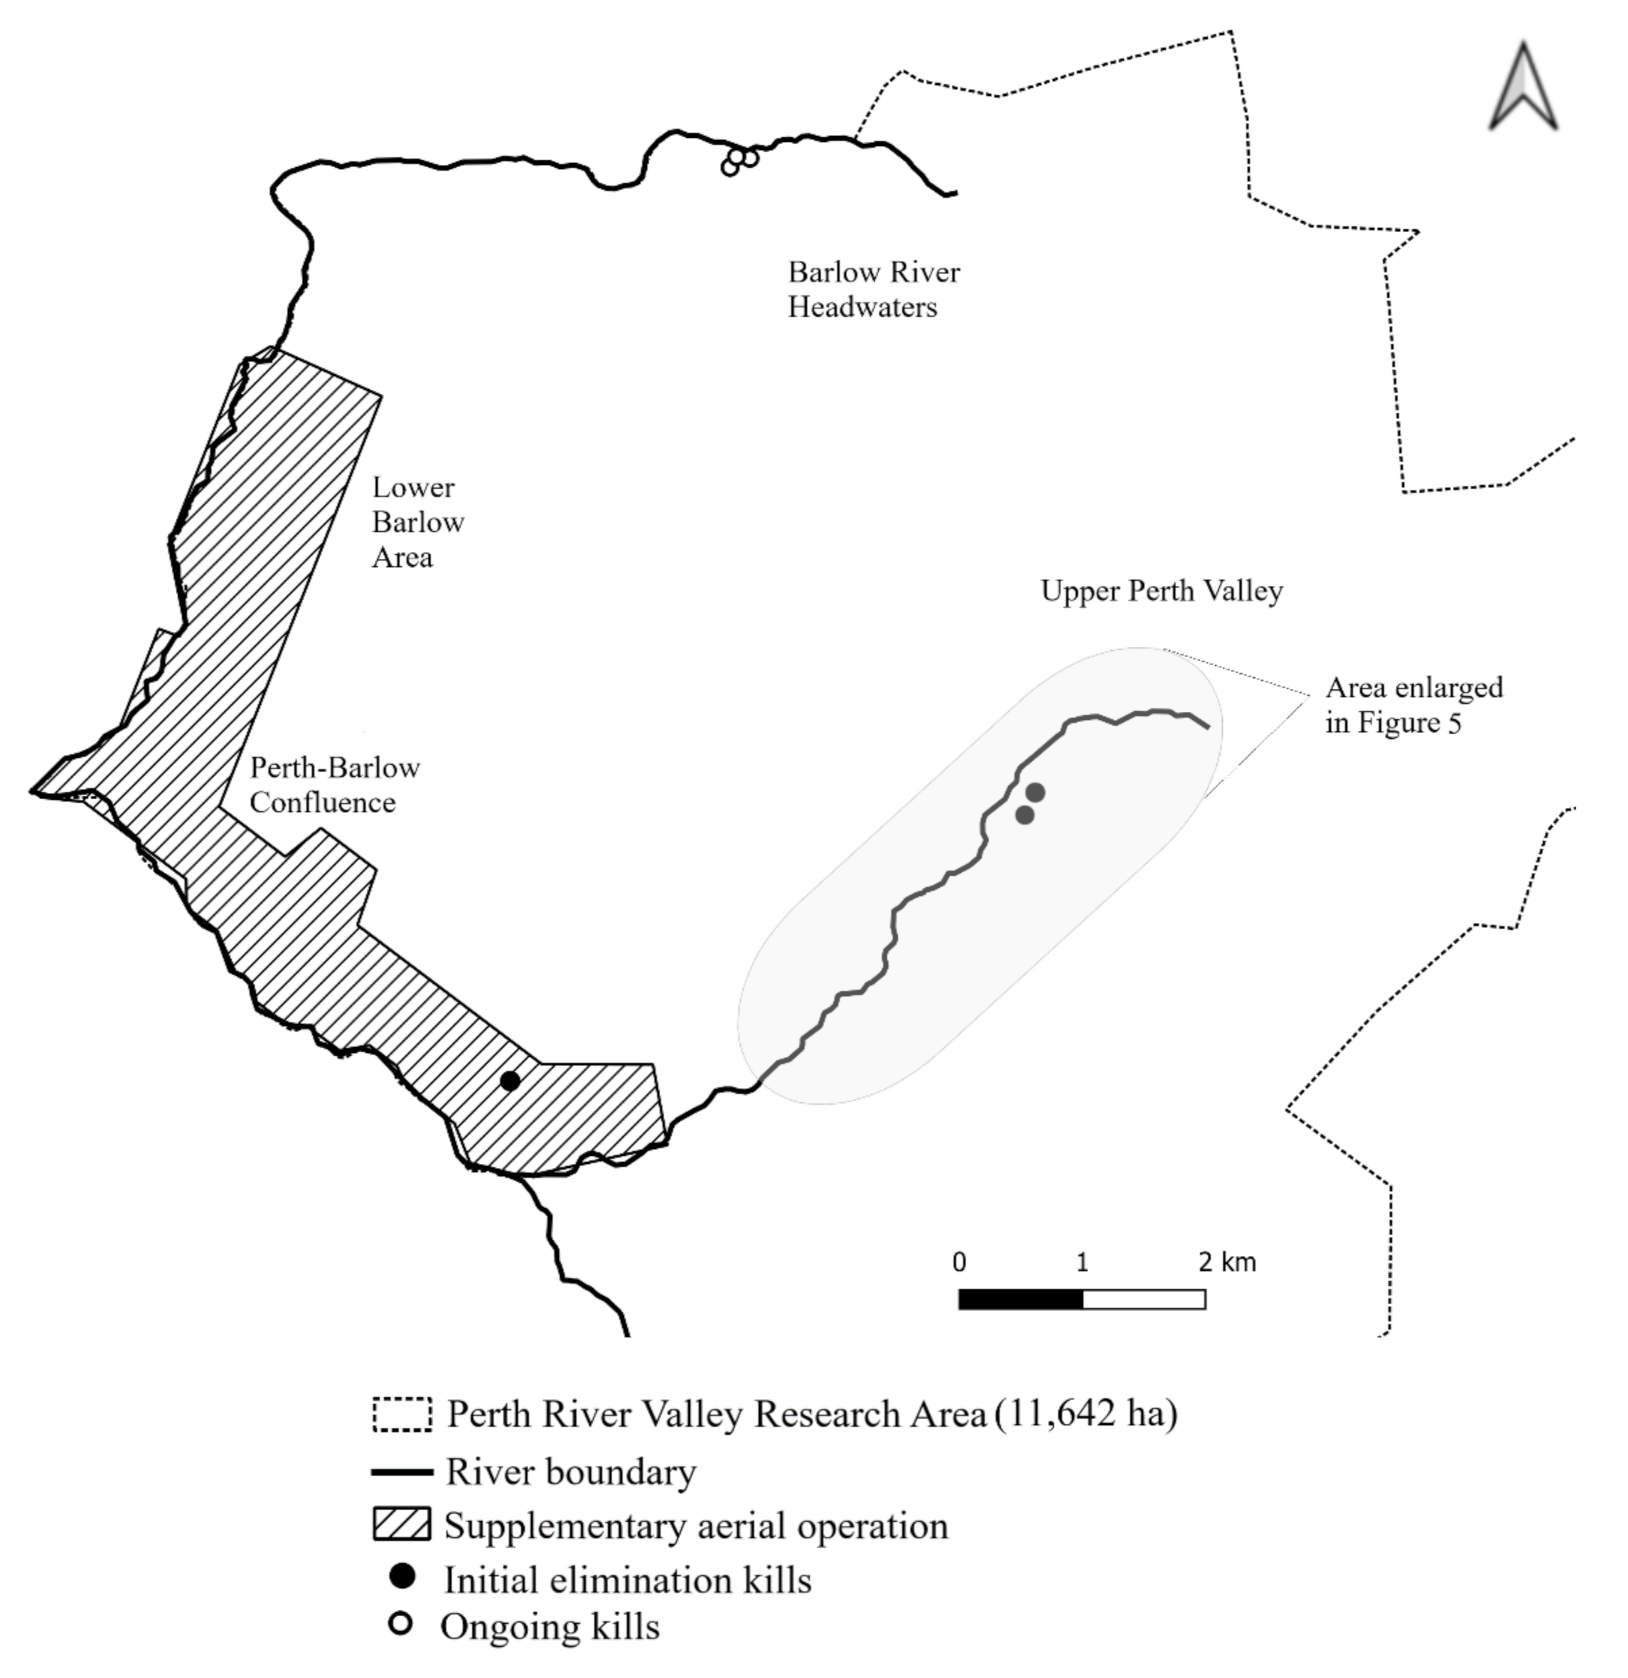
2.3. Supplementary Aerial Operation
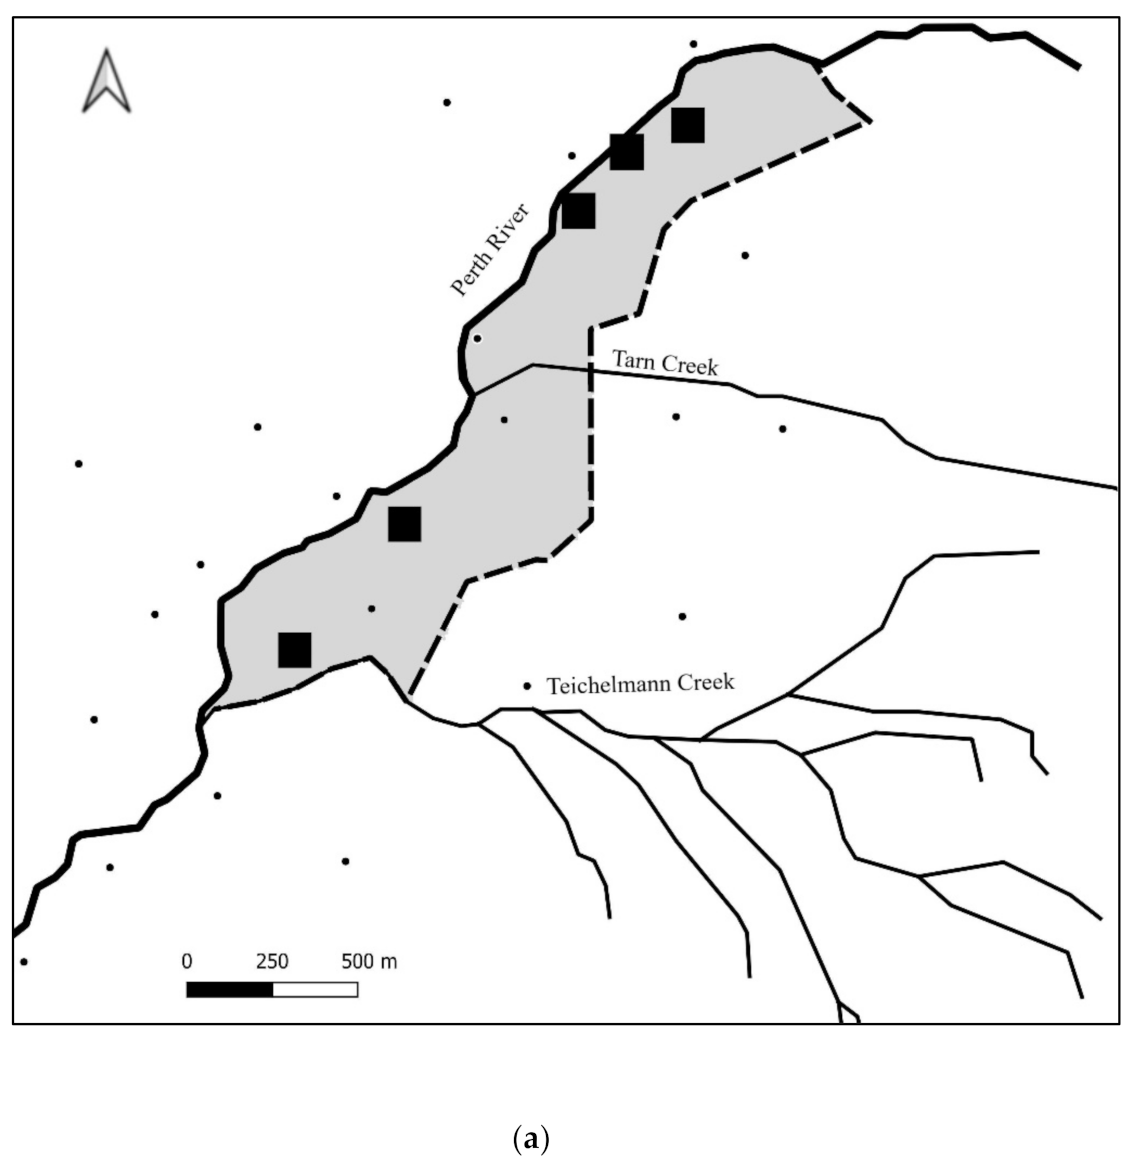
2.4. Detectability of “Roaming” and “Settled” Behaviour—Upper Perth Survivors
2.5. Frequency of Invaders
3. Results
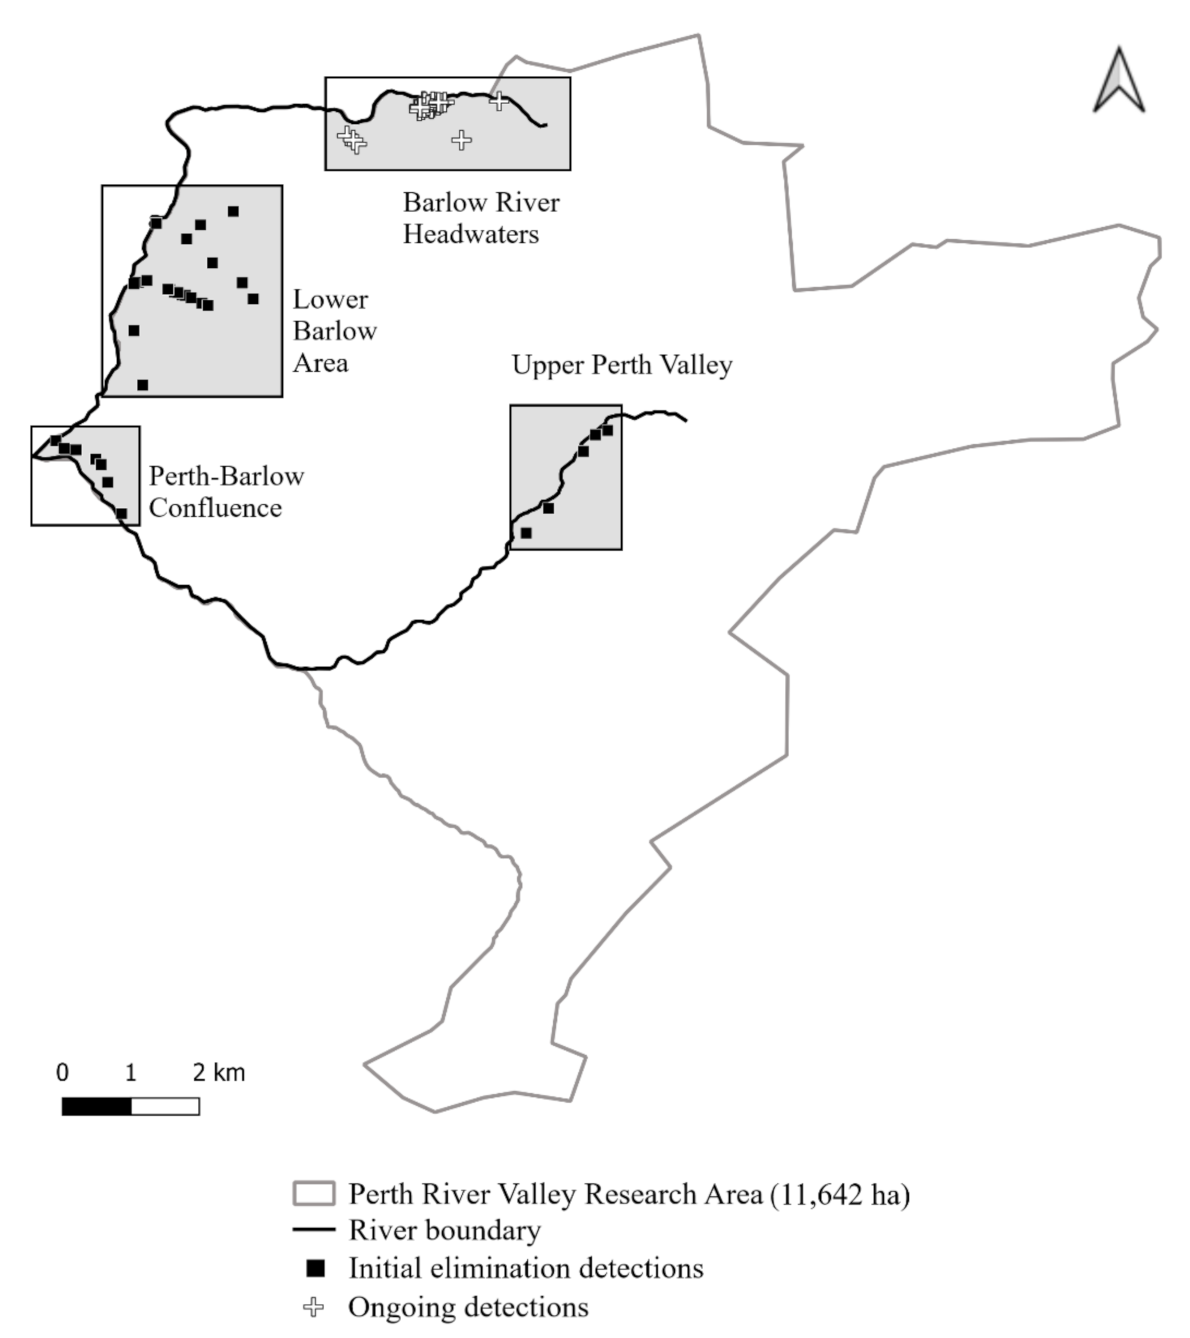
3.1. Detections
3.2. The Cost of Possum Elimination
3.3. Detectability and “Roaming” vs. “Settled” Behaviour
4. Discussion
- Survivor Detectability—Upper Perth Valley
- Lower Barlow Area
4.1. Frequency of Invaders
4.2. Detection and Response Tools
4.3. Lure Dispensers and Cage Trap Efficacy
4.4. Automated Reporting
4.5. Supplementary Aerial Treatment
4.6. Operational Cost of Possum Elimination
4.7. Cost Comparison with Suppression Operations
4.8. Research and Development Cost Component
4.9. Cost Refinements
5. Conclusions
Author Contributions
Funding
Institutional Review Board Statement
Informed Consent Statement
Data Availability Statement
Acknowledgments
Conflicts of Interest
References
- Nugent, G. Effects of possums on the native flora. In Proceedings of the a workshop on Possums as Conservation Pests, Wellington, New Zealand, 29–30 November 1994. [Google Scholar]
- Payton, I. Damage to native forests. In The Brushtail Possum: Biology, Impact and Management of an Introduced Marsupial; Montague, T.L., Ed.; Manaaki Whenua Press: Lincoln, New Zealand, 2000; pp. 111–125. [Google Scholar]
- Glen, A.S.; Byrom, A.E.; Pech, R.P.; Cruz, J.; Schwab, A.; Sweetapple, P.J.; Whitford, J. Ecology of brushtail possums in a New Zealand dryland ecosystem. N. Z. J. Ecol. 2012, 36, 29–37. [Google Scholar]
- Owen, H.J.; Norton, D.A. The diet of introduced brushtail possums Trichosurus vulpecula in a low-diversity New Zealand Nothofagus forest and possible implications for conservation management. Biol. Conserv. 1995, 71, 339–345. [Google Scholar] [CrossRef]
- Brown, K.; Innes, J.; Shorten, R. Evidence that possums prey on and scavenge birds’ eggs, birds and mammals. Notornis 1993, 40, 169–177. [Google Scholar]
- OSPRI Area Disease Management Plan, 2016–2055 National Bovine Tuberculosis Pest Management Plan, North Island. Available online: https://www.ospri.co.nz/assets/Documents/20201210-TBfree-NOP-2020.pdf (accessed on 28 December 2021).
- Veitch, C.R.; Clout, M.N. Turning the tide: The eradication of invasive species. In Proceedings of the International Conference on Eradication of Island Invasives, Auckland, New Zealand, 19–23 February 2001. [Google Scholar]
- Latham, A.D.M.; Latham, M.C.; Norbury, G.L.; Forsyth, D.M.; Warburton, B. A review of the damage caused by invasive wild mammalian herbivores to primary production in New Zealand. N. Z. J. Zool. 2020, 47, 20–52. [Google Scholar] [CrossRef]
- Livingstone, P.G.; Hancox, N.; Nugent, G.; Mackereth, G.; Hutchings, S.A. Development of the New Zealand strategy for local eradication of tuberculosis from wildlife and livestock. N. Z. Vet J. 2015, 63, 98–107. [Google Scholar] [CrossRef] [Green Version]
- Giera, N.; Bell, B.A. Nimmo-Bell. Economic Costs of Pests to New Zealand: A Report; MAF Biosecurity New Zealand: Wellington, New Zealand, 2009. [Google Scholar]
- Clout, M. Anatomy of a disastrous success: The brushtail possum as an invasive species. In The Brushtail Possum—Biology, Impact and Management of an Introduced Marsupial; Montague, T.L., Ed.; Manaaki Whenua Press: Lincoln, New Zealand, 2000; pp. 1–9. [Google Scholar]
- Sherley, G. Eradication of Brushtail Possums (Trichosurus vulpecula) on Kapiti Island, New Zealand: Techniques and Methods; Department of Conservation Science and Research Series: Wellington, New Zeeland, 1992; Volume 46. [Google Scholar]
- Cowan, P. The eradication of introduced Australian brushtail possums, Trichosurus vulpecula, from Kapiti Island, a New Zealand nature reserve. Biol. Conserv. 1992, 61, 217–226. [Google Scholar] [CrossRef]
- Stats NZ. Consumer Price Index. Available online: http://infoshare.stats.govt.nz/ (accessed on 30 December 2021).
- Mowbray, S. Eradication of introduced Australian marsupials (brushtail possum and brush-tailed rock wallaby) from Rangitoto and Motutapu Islands, New Zealand. In Proceedings of the International Conference on Eradication of Island Invasives, Auckland, New Zealand, 19–23 February 2001. [Google Scholar]
- Griffiths, R. Targeting multiple species–a more efficient approach to pest eradication. In Island Invasives: Eradication and Management; Veitch, C.R., Clout, M.N., Towns, D.R., Eds.; International Union for Conservation of Nature: Gland, Switzerland, 2011; pp. 172–176. [Google Scholar]
- Veitch, C.R.; Bell, B.D. Eradication of introduced animals from the islands of New Zealand. In Ecological Restoration of New Zealand Islands; Towns, D.R., Daugherty, C.H., Atkinson, I.A.E., Eds.; Conservation Sciences Publication; Department of Conservation: Wellington, New Zealand, 1990; Volume 2, pp. 137–146. [Google Scholar]
- Speedy, C.; Day, T.; Innes, J. Pest eradication technology-the critical partner to pest exclusion technology: The Maungatautari experience. Manag. Vertebr. Invasive Species 2007, 34, 115–126. [Google Scholar]
- Curnow, M.; Kerr, G.N. Predator Free Banks Peninsula: Scoping Analysis; Lincoln University: Christchurch, New Zealand, 2017. [Google Scholar]
- Scofield, R.P.; Cullen, R.; Wang, M. Are predator-proof fences the answer to New Zealand’s terrestrial faunal biodiversity crisis? N. Z. J. Ecol. 2011, 35, 312–317. [Google Scholar]
- Bell, P.; Nathan, H.; Mulgan, N. ‘Island’ Eradication Within Large Landscapes: The Remove and Protect Model. In Proceedings of the Island Invasives Conference, Dundee, UK, 10–14 July 2017. [Google Scholar] [CrossRef]
- Russell, J.C.; Innes, J.G.; Brown, P.H.; Byrom, A.E. Predator-free New Zealand: Conservation country. BioScience 2015, 65, 520–525. [Google Scholar] [CrossRef] [Green Version]
- Towns, D.R.; Broome, K.G. From small Maria to massive Campbell: Forty years of rat eradications from New Zealand islands. N. Z. J. Zool. 2003, 30, 377–398. [Google Scholar] [CrossRef]
- Brown, K.; Elliott, G.; Innes, J.; Kemp, J. Ship Rat, Stoat and Possum Control on Mainland New Zealand. An Overview of Techniques, Successes and Challenges; Department of Conservation: Wellington, New Zealand, 2015. [Google Scholar]
- Animal Control Products Ltd. Operating Plan 63, Aerial and Hand Broadcast Application of Pestoff® Rodent Bait 20R (V9014) for the Intended Eradication of Rodents from Specified Areas of New Zealand. Available online: https://pestoff.co.nz/wp-content/uploads/2019/05/20R-Operating-Plan-63-121219.pdf (accessed on 22 July 2021).
- Eason, C.T.; Murphy, E.C.; Wright, G.R.; Spurr, E.B. Assessment of risks of brodifacoum to non-target birds and mammals in New Zealand. Ecotoxicology 2002, 11, 35–48. [Google Scholar] [CrossRef]
- Eason, C.T.; Ogilvie, S. A Re-Evaluation of Potential Rodenticides for Aerial Control of Rodents; Lincoln University: Christchurch, New Zealand, 2009. [Google Scholar]
- Elliott, G.; Kemp, J. Large-scale pest control in New Zealand beech forests. Ecol. Manag. Restor. 2016, 17, 200–209. [Google Scholar] [CrossRef]
- O’Donnell, C.F.; Hoare, J.M. Quantifying the benefits of long-term integrated pest control for forest bird populations in a New Zealand temperate rainforest. N. Z. J. Ecol. 2012, 36, 131–140. [Google Scholar]
- Cowan, P.E. Factors Affecting Possum Re-Infestation—Implications for Management; Department of Conservation: Wellington, New Zealand, 2000. [Google Scholar]
- Ross, J.G.; Ryan, G.; Jansen, M.; Sjoberg, T. Predator-free New Zealand 2050: Fantasy or Reality? In Proceedings of the 29th Vertebrate Pest Conference, Santa Barbara, CA, USA, 2–5 March 2020. [Google Scholar]
- Tompkins, D.M. The Research Strategy for a Predator Free New Zealand. In Proceedings of the 28th Vertebrate Pest Conference, Reno, NV, USA, 26 February–1 March 2018. [Google Scholar]
- The Spinoff. Available online: https://thespinoff.co.nz/science/24-04-2020/siouxsie-wiles-toby-morris-what-do-we-mean-we-talk-about-the-elimination-of-covid-19 (accessed on 29 December 2021).
- Cook, B.; Mulgan, N.; Nathan, H. Rivers as obstacles to home range expansion by the brushtail possum. N. Z. J. Ecol. 2021, 45, 3426. [Google Scholar] [CrossRef]
- Julian, A. Possum Distribution and Recent Spread in Northern Northland: With Observations on the Vegetation; Department of Lands and Survey: Wellington, New Zealand, 1984; 61p. [Google Scholar]
- Foster, N.J.; Maloney, R.F.; Seddon, P.J.; Recio, M.R.; Khan, M.S.I.; van Heezik, Y. Altitudinal distribution of the entire invasive small mammal guild in the eastern dryland zone of New Zealand’s Southern Alps. Biol. Invasions 2021, 23, 1837–1857. [Google Scholar] [CrossRef]
- Pekelharing, C.J.; Parkes, J.P.; Barker, R.J. Possum (Trichosurus vulpecula) densities and impacts on fuchsia (Fuchsia excorticata) in South Westland, New Zealand. N. Z. J. Ecol. 1998, 22, 197–203. [Google Scholar]
- Nugent, G.; Morriss, G.A.; Warburton, B. Attempting local elimination of possums (and rats) using dual aerial 1080 baiting. N. Z. J. Ecol. 2019, 43, 3373. [Google Scholar] [CrossRef] [Green Version]
- Nugent, G.; Clayton, R.; Warburton, B.; Day, T. Dual 1080 bait switching for killing cereal-bait-shy possums. N. Z. J. Ecol. 2020, 44, 3403. [Google Scholar] [CrossRef]
- Nichols, M.; Nathan, H.; Mulgan, N. Dual aerial 1080 baiting operation removes predators at a large spatial scale. N. Z. J. Ecol. 2021, 45, 3428. [Google Scholar] [CrossRef]
- Sweetapple, P.; Nugent, G. Possum demographics and distribution after reduction to near–zero density. N. Z. J. Zool. 2009, 461–471. [Google Scholar] [CrossRef]
- Whyte, B.I.; Ross, J.G.; Blackie, H.M. Differences in brushtail possum home-range characteristics among sites of varying habitat and population density. Wildl. Res. 2013, 40, 537–544. [Google Scholar] [CrossRef] [Green Version]
- Zero Invasive Predators, ZIP MotoLure Installation Guide. Available online: https://issuu.com/zipnz/docs/zip_motolure-manual_20191127_web?fr=sZmZmYjUxMzI5OQ (accessed on 1 October 2020).
- Efford, M.; Dawson, D.K.; Jhala, Y.V.; Qureshi, Q. Density-dependent home-range size revealed by spatially explicit capture–recapture. Ecography 2016, 39, 676–688. [Google Scholar] [CrossRef]
- ESRI. ArcGIS Desktop; Environmental Systems Research Institute: Redlands, CA, USA, 2017. [Google Scholar]
- Ball, S.J.; Ramsey, D.; Nugent, G.; Warburton, B.; Efford, M. A method for estimating wildlife detection probabilities in relation to home-range use: Insights from a field study on the common brushtail possum (Trichosurus vulpecula). Wildl. Res. 2005, 32, 217–227. [Google Scholar] [CrossRef]
- Samaniego-Herrera, A.; Anderson, D.P.; Parkes, J.P.; Aguirre-Muñoz, A. Rapid assessment of rat eradication after aerial baiting. J. Appl. Ecol. 2013, 50, 1415–1421. [Google Scholar] [CrossRef]
- Patil, V.; Kulkarni, H. Comparison of confidence intervals for the Poisson mean: Some new aspects. Revstat Stat. J. 2012, 10, 211–227. [Google Scholar]
- Zero Invasive Predators, Stoatally Detectable: Using Lured Trail Cameras with ZIP MotoLure Automated Lure Dispensers to Detect Stoats at Low Density. Available online: https://zip.org.nz/findings/2019/1/stoatally-detectable-using-paired-trail-cameras-and-automated-lure-dispensers-to-detect-stoats-when-they-are-at-low-density (accessed on 16 October 2021).
- Ministry for Primary Industries. Remote Monitoring of Live Capture Traps for Vertebrates: Guidelines for Good Practice. Available online: https://www.mpi.govt.nz/dmsdocument/27894-.remote-monitoring-of-live-capture-traps-for-vertebrates (accessed on 28 December 2021).
- Reserve Bank of New Zealand. Available online: https://www.rbnz.govt.nz/monetary-policy/inflation-calculator (accessed on 30 December 2021).
- Wright, J. Evaluating the Use of 1080: Predators, Poisons and Silent Forests; Parliamentary Commissioner for the Environment: Wellington, New Zealand, 2011. [Google Scholar]
- Morgan, D.R.; Milne, L.; O’Connor, C. Learned Bait-shyness by Possums (Trichosurus vulpecula) Towards Baits Containing Cyanide, 1080, Cholecalciferol, or Brodifacoum. In Proceedings of the 20th Vertebrate Pest Conference, Rohnert Park, CA, USA, 26 February–1 March 2002. [Google Scholar] [CrossRef] [Green Version]
- Ogilvie, S.C.; Thomas, M.D.; Morriss, G.A.; Morgan, D.R.; Eason, C.T. Investigation of sodium monofluoroacetate (1080) bait shyness in wild brushtail possum (Trichosurus vulpecula) populations. Int. J. Pest Manag. 2000, 46, 77–80. [Google Scholar] [CrossRef]
- Morgan, D.; Morriss, G.; Hickling, G. Induced 1080 bait-shyness in captive brushtail possums and implications for management. Wildl. Res. 1996, 23, 207–211. [Google Scholar] [CrossRef]
- Cook, B. Technical Report #12: Assessing the Use of the ZIP SafeLock Trap in the Perth River Valley; Zero Invasive Predators Ltd.: Wellington, New Zealand, 2021. [Google Scholar]


| Tool | Probable Survivor Mop Up | Probable Invader Response * | Total |
|---|---|---|---|
| 23 July 2019–29 June 2020 | 8 March 2020–31 August 2020 | ||
| Lured camera network (TN) | 48,002 | 9650 | 57,652 |
| Extra cameras × 5 (TN) | 0 | 1145 | 1145 |
| Remote reporting legholds (TN) | 170 | 0 | 170 |
| Remote reporting cage traps (TN) | 192 | 60 | 252 |
| Total (TN) | 48,364 | 10,855 | 59,219 |
| Possum dog (days) | 48 | 19 | 67 |
| Targeted person (days) | 55 | 25 | 80 |
| Camera servicing (days) | 164 | 84 | 248 |
| Total (days) | 267 | 128 | 395 |
| Initial Elimination Costs | 2020 NZD Excl. GST |
|---|---|
| Aerial 1080 and kea mitigation | NZD 1148,435.54 |
| Detection network and servicing | NZD 170,731.89 |
| Supplementary treatment | NZD 54,004.04 |
| Targeted ground response | NZD 44,782.61 |
| Total | NZD 1417,954.08 |
| Total per ha | NZD 163.75 |
| Ongoing Costs | 2020 NZD excl. GST |
| 8 March to 31 August 2020 | NZD 65,554.78 |
| Equivalent annual cost | NZD 135,951.68 |
| Annual cost per ha | NZD 15.70 |
Publisher’s Note: MDPI stays neutral with regard to jurisdictional claims in published maps and institutional affiliations. |
© 2022 by the authors. Licensee MDPI, Basel, Switzerland. This article is an open access article distributed under the terms and conditions of the Creative Commons Attribution (CC BY) license (https://creativecommons.org/licenses/by/4.0/).
Share and Cite
Cook, B.; Mulgan, N. Targeted Mop up and Robust Response Tools Can Achieve and Maintain Possum Freedom on the Mainland. Animals 2022, 12, 921. https://doi.org/10.3390/ani12070921
Cook B, Mulgan N. Targeted Mop up and Robust Response Tools Can Achieve and Maintain Possum Freedom on the Mainland. Animals. 2022; 12(7):921. https://doi.org/10.3390/ani12070921
Chicago/Turabian StyleCook, Briar, and Nick Mulgan. 2022. "Targeted Mop up and Robust Response Tools Can Achieve and Maintain Possum Freedom on the Mainland" Animals 12, no. 7: 921. https://doi.org/10.3390/ani12070921