
The Use of Selfie Camera Traps to Estimate Home Range and Movement Patterns of Small Mammals in a Fragmented Landscape


Abstract
:Simple Summary
Abstract
1. Introduction
2. Materials and Methods
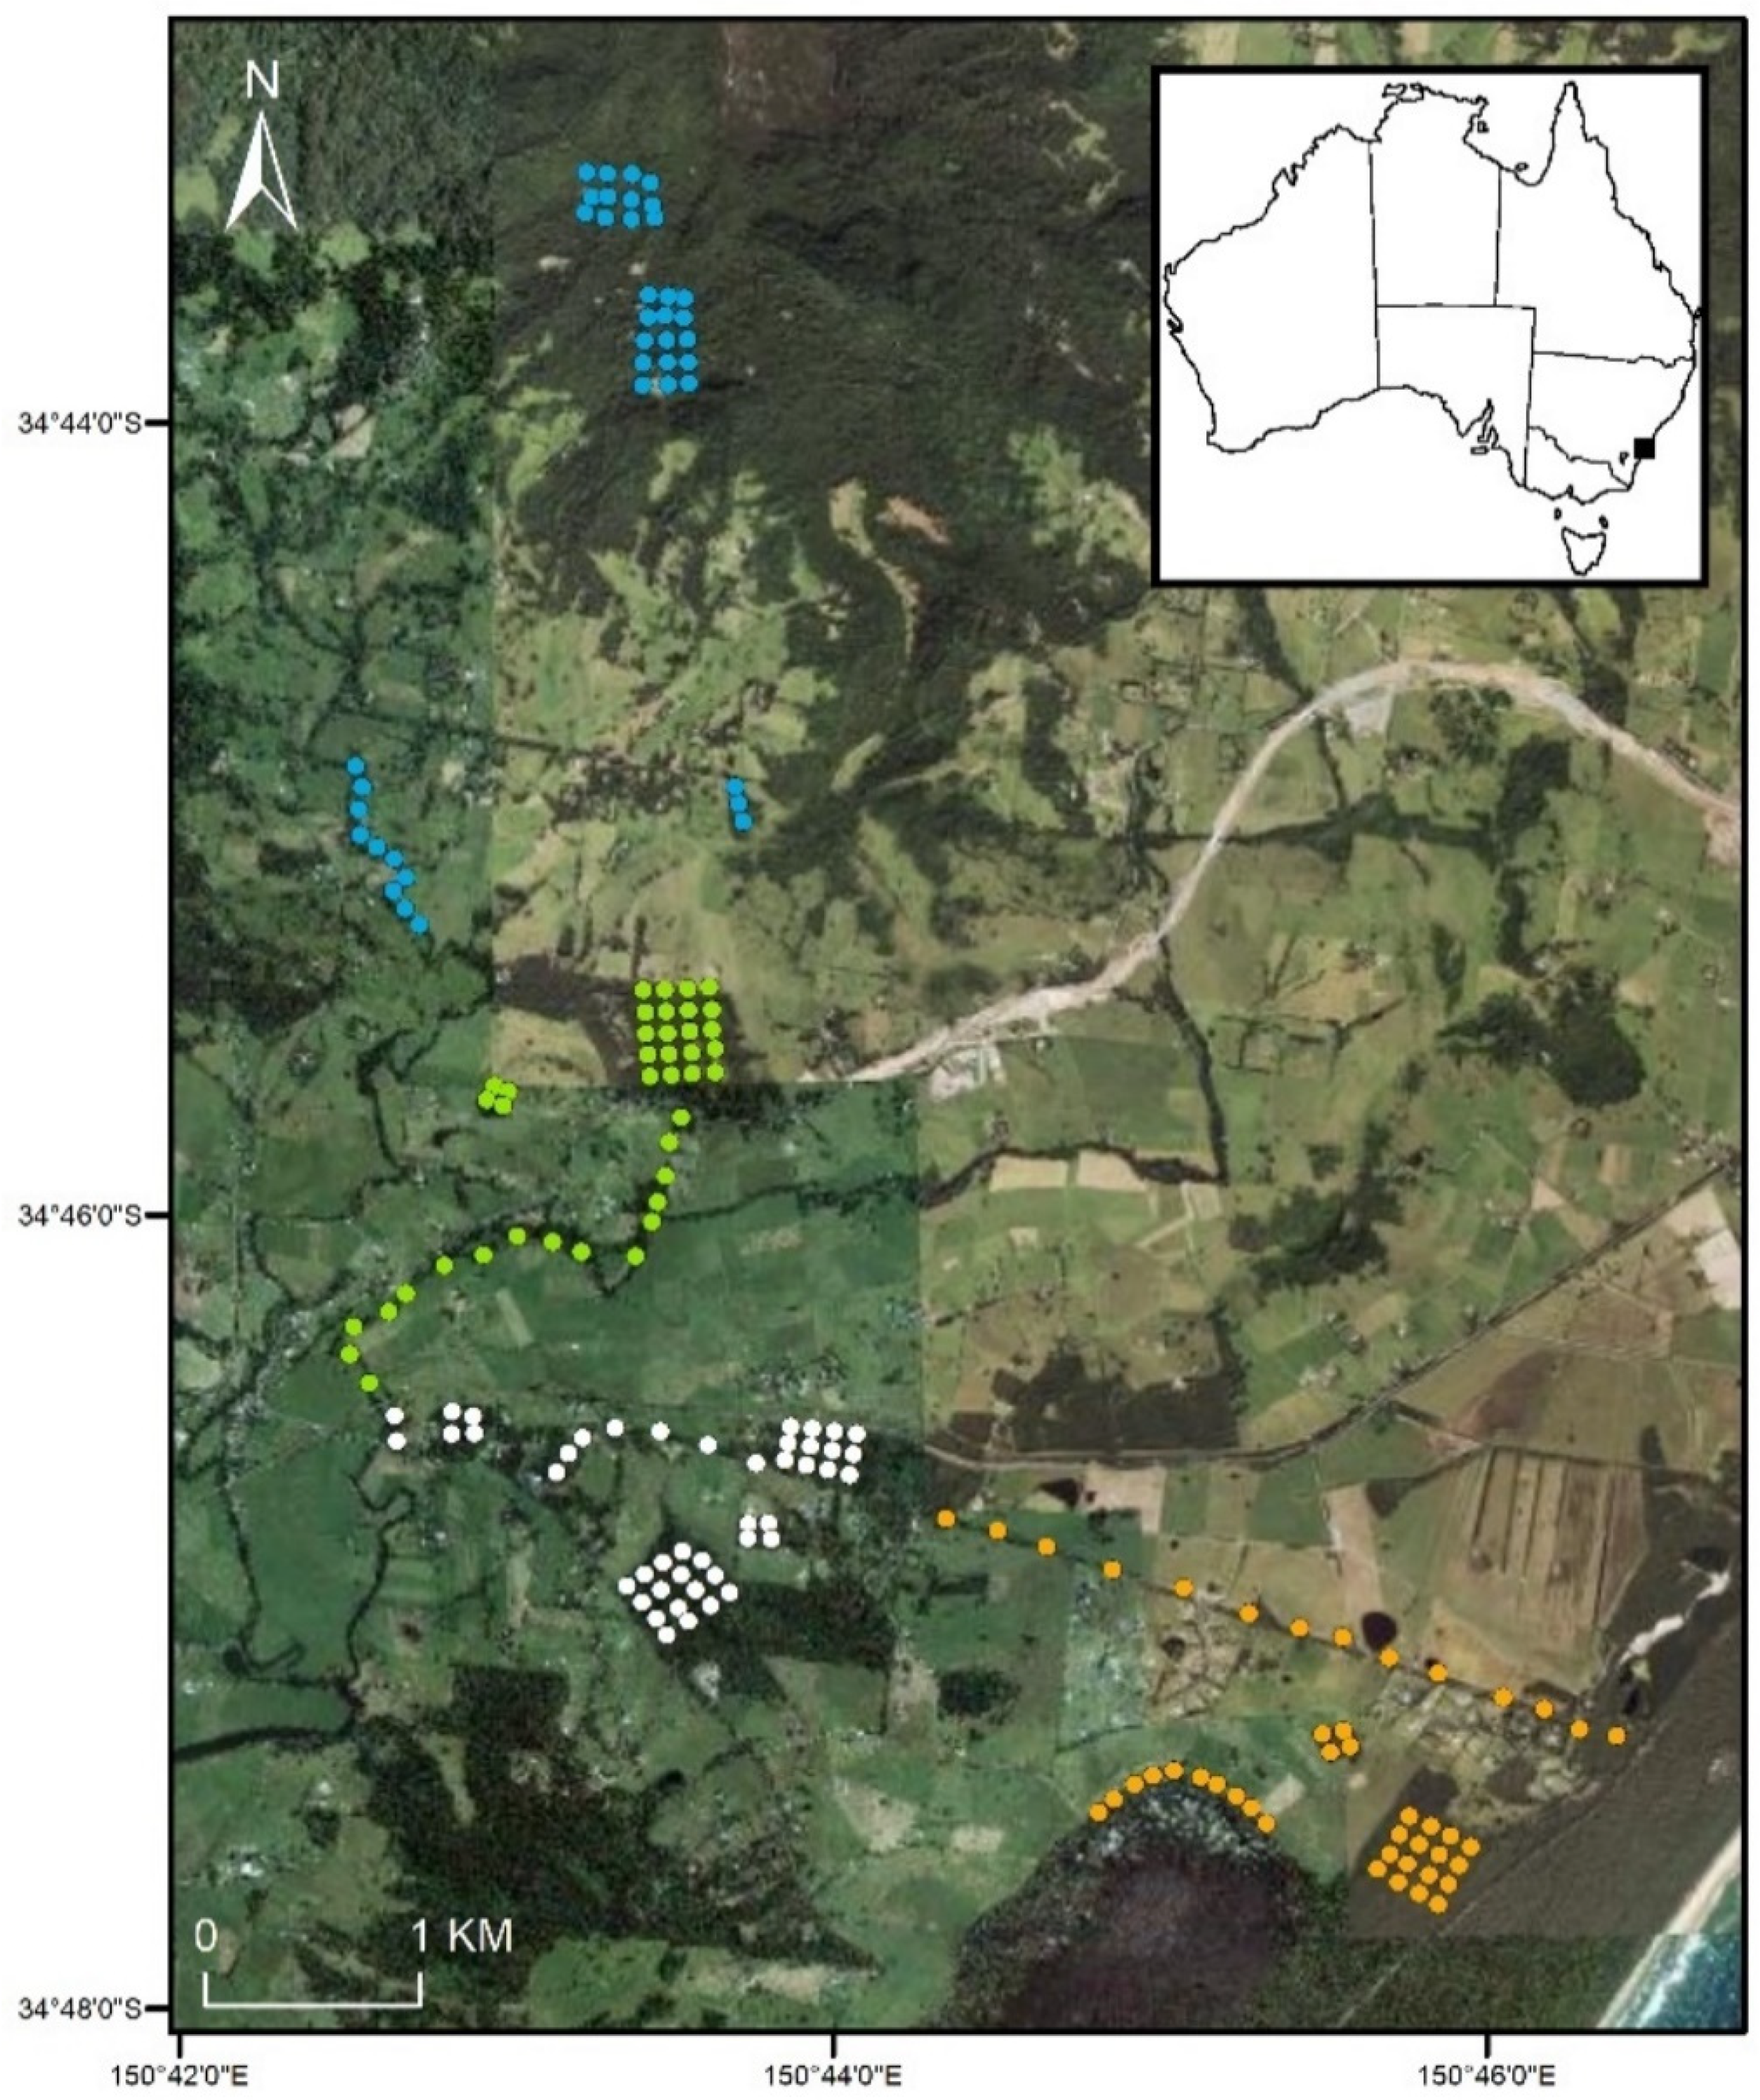
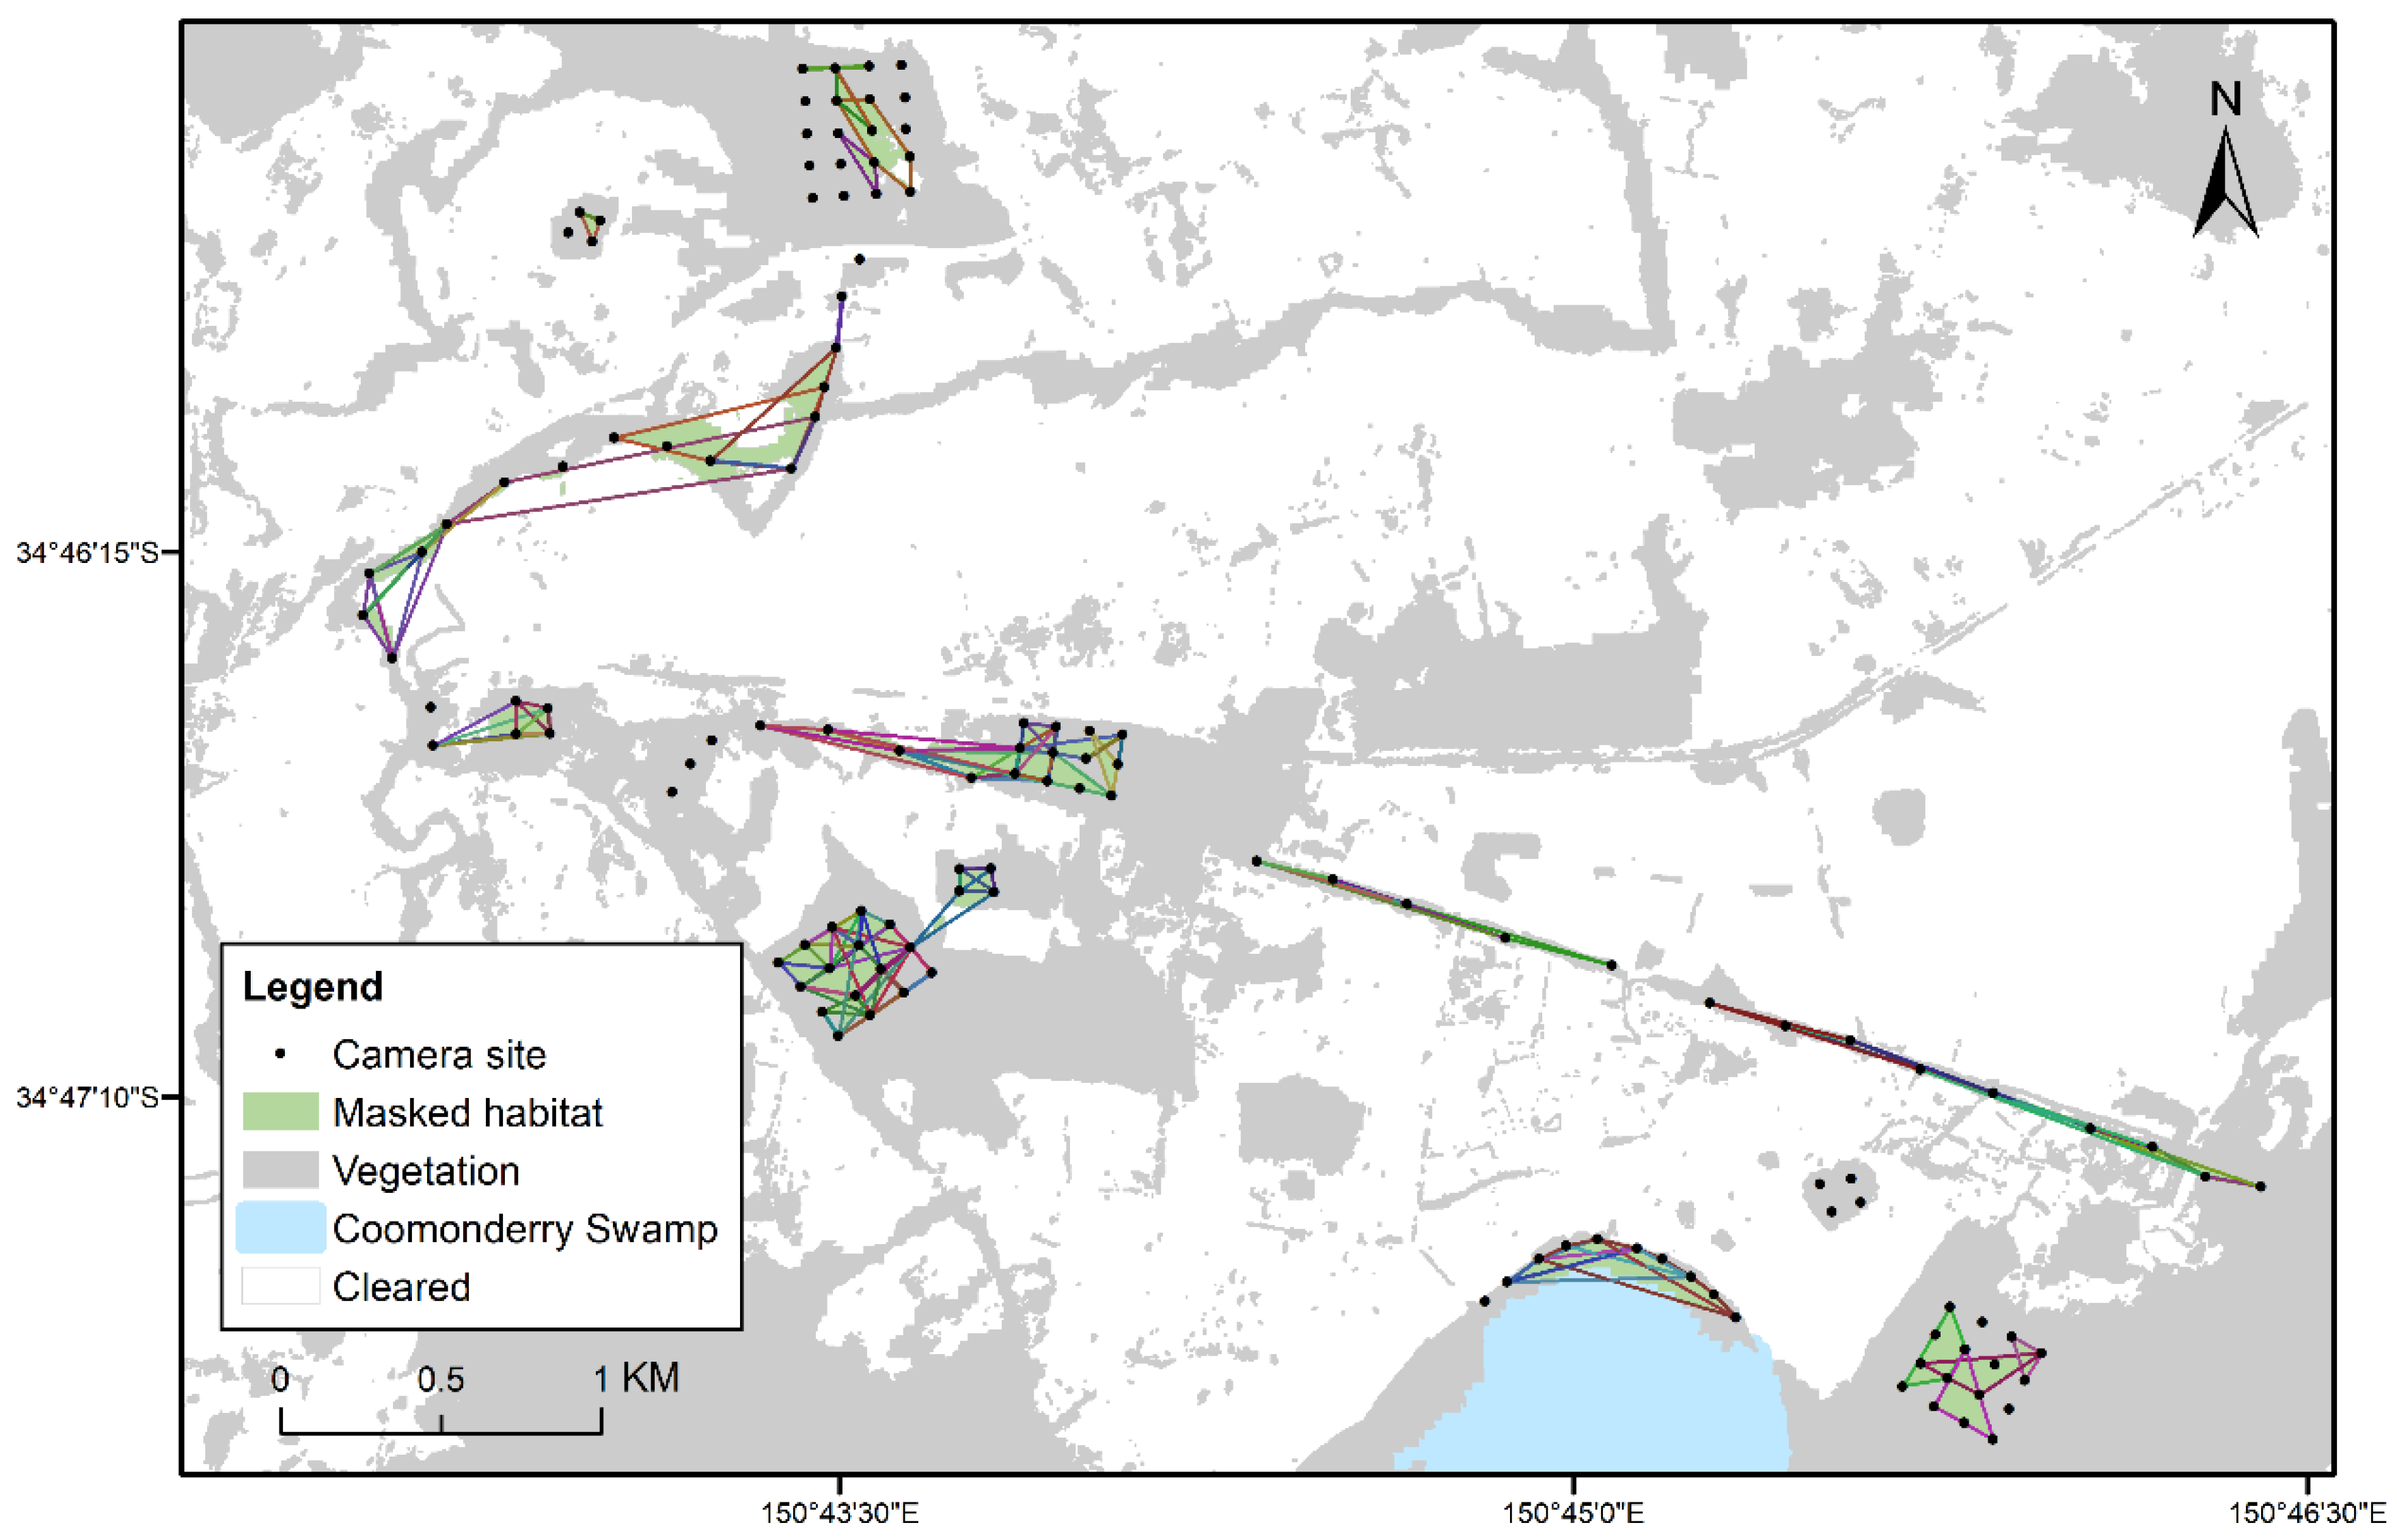
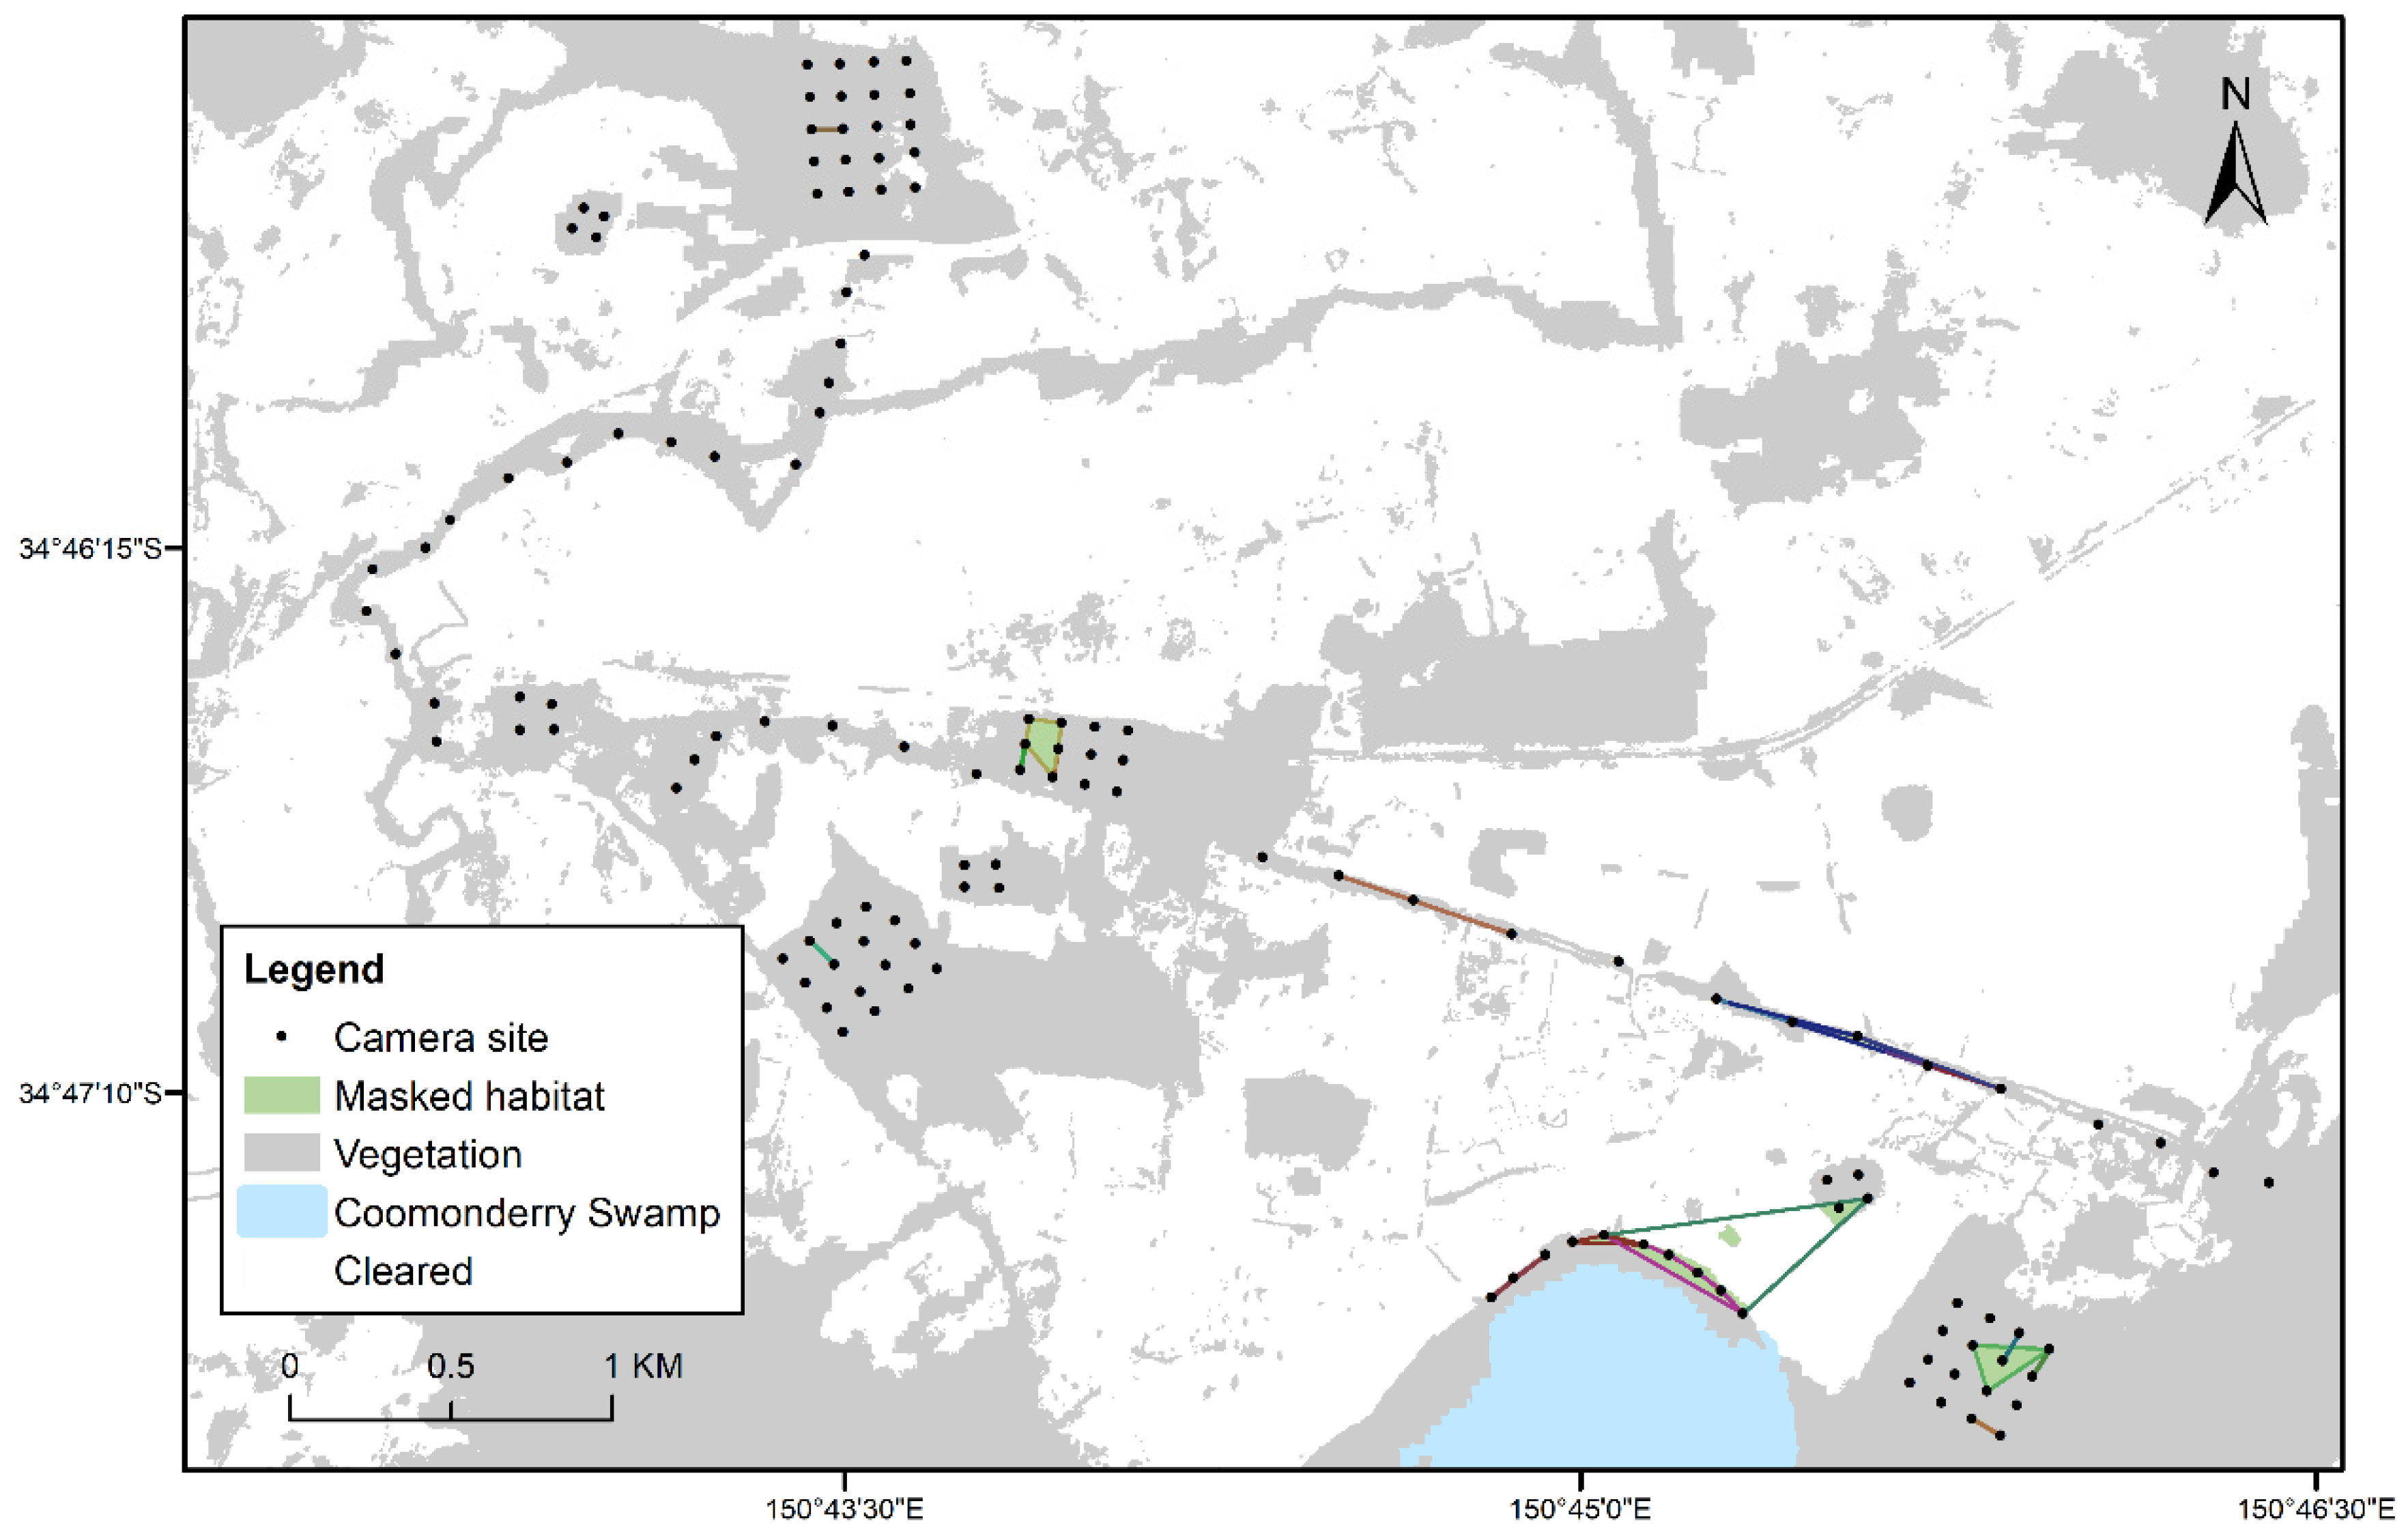
2.1. Study Area
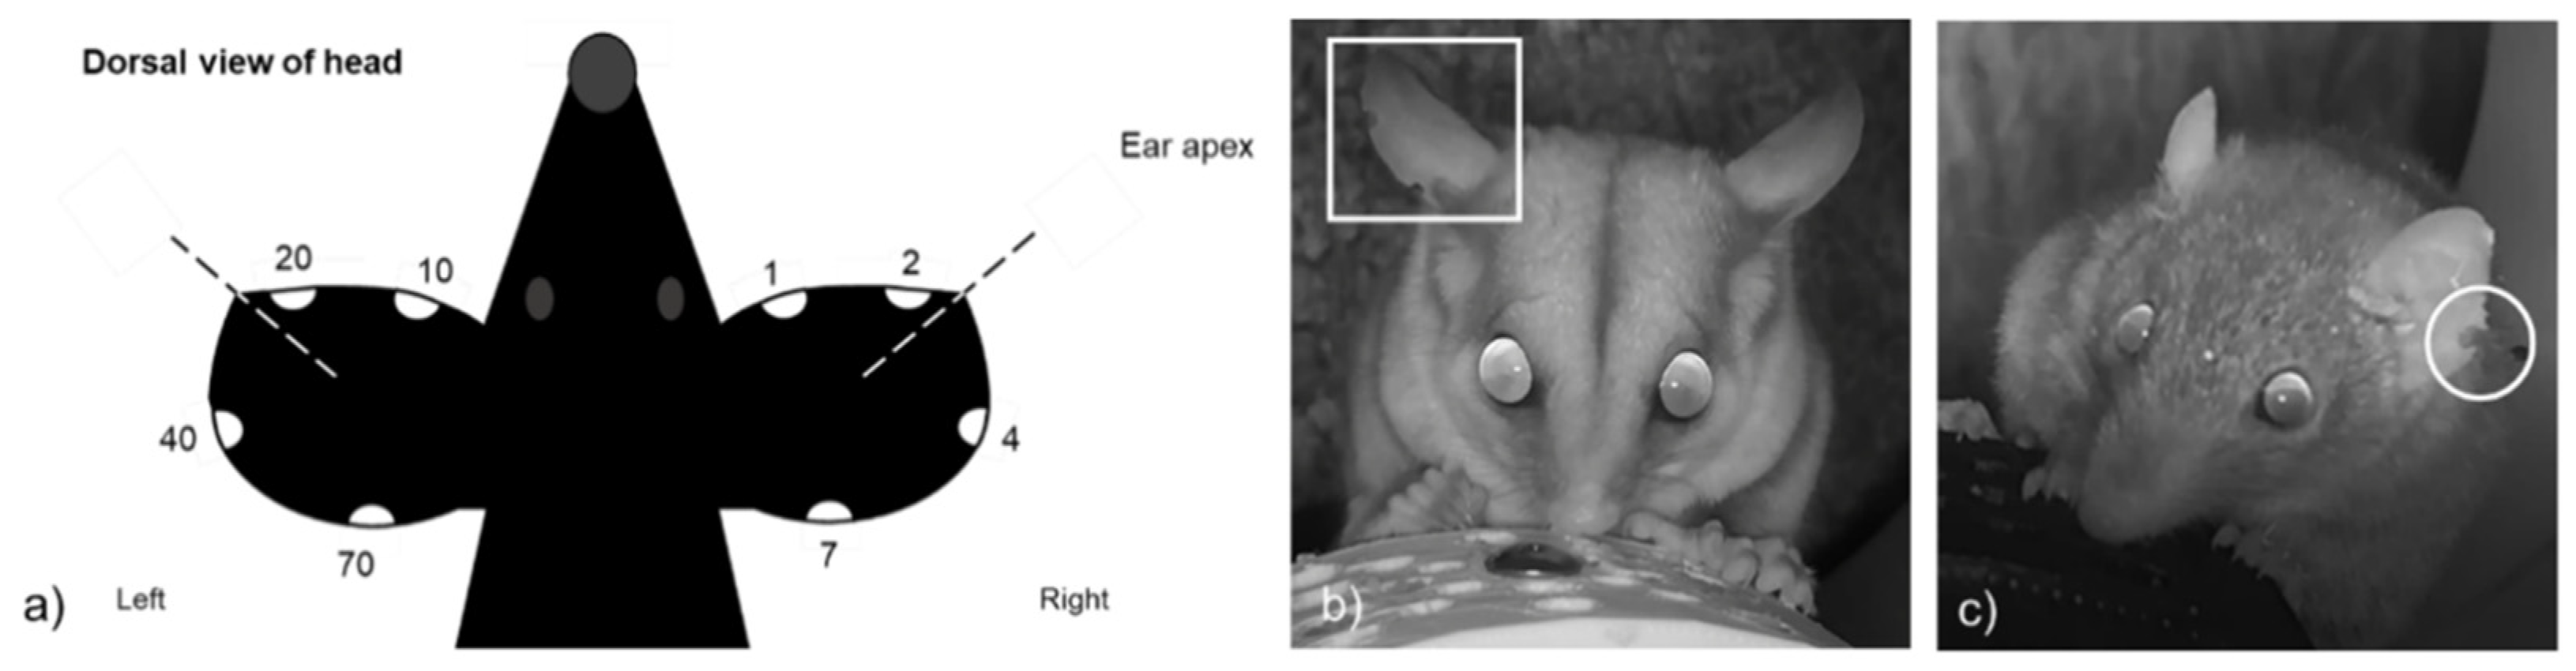
2.2. Live Trapping
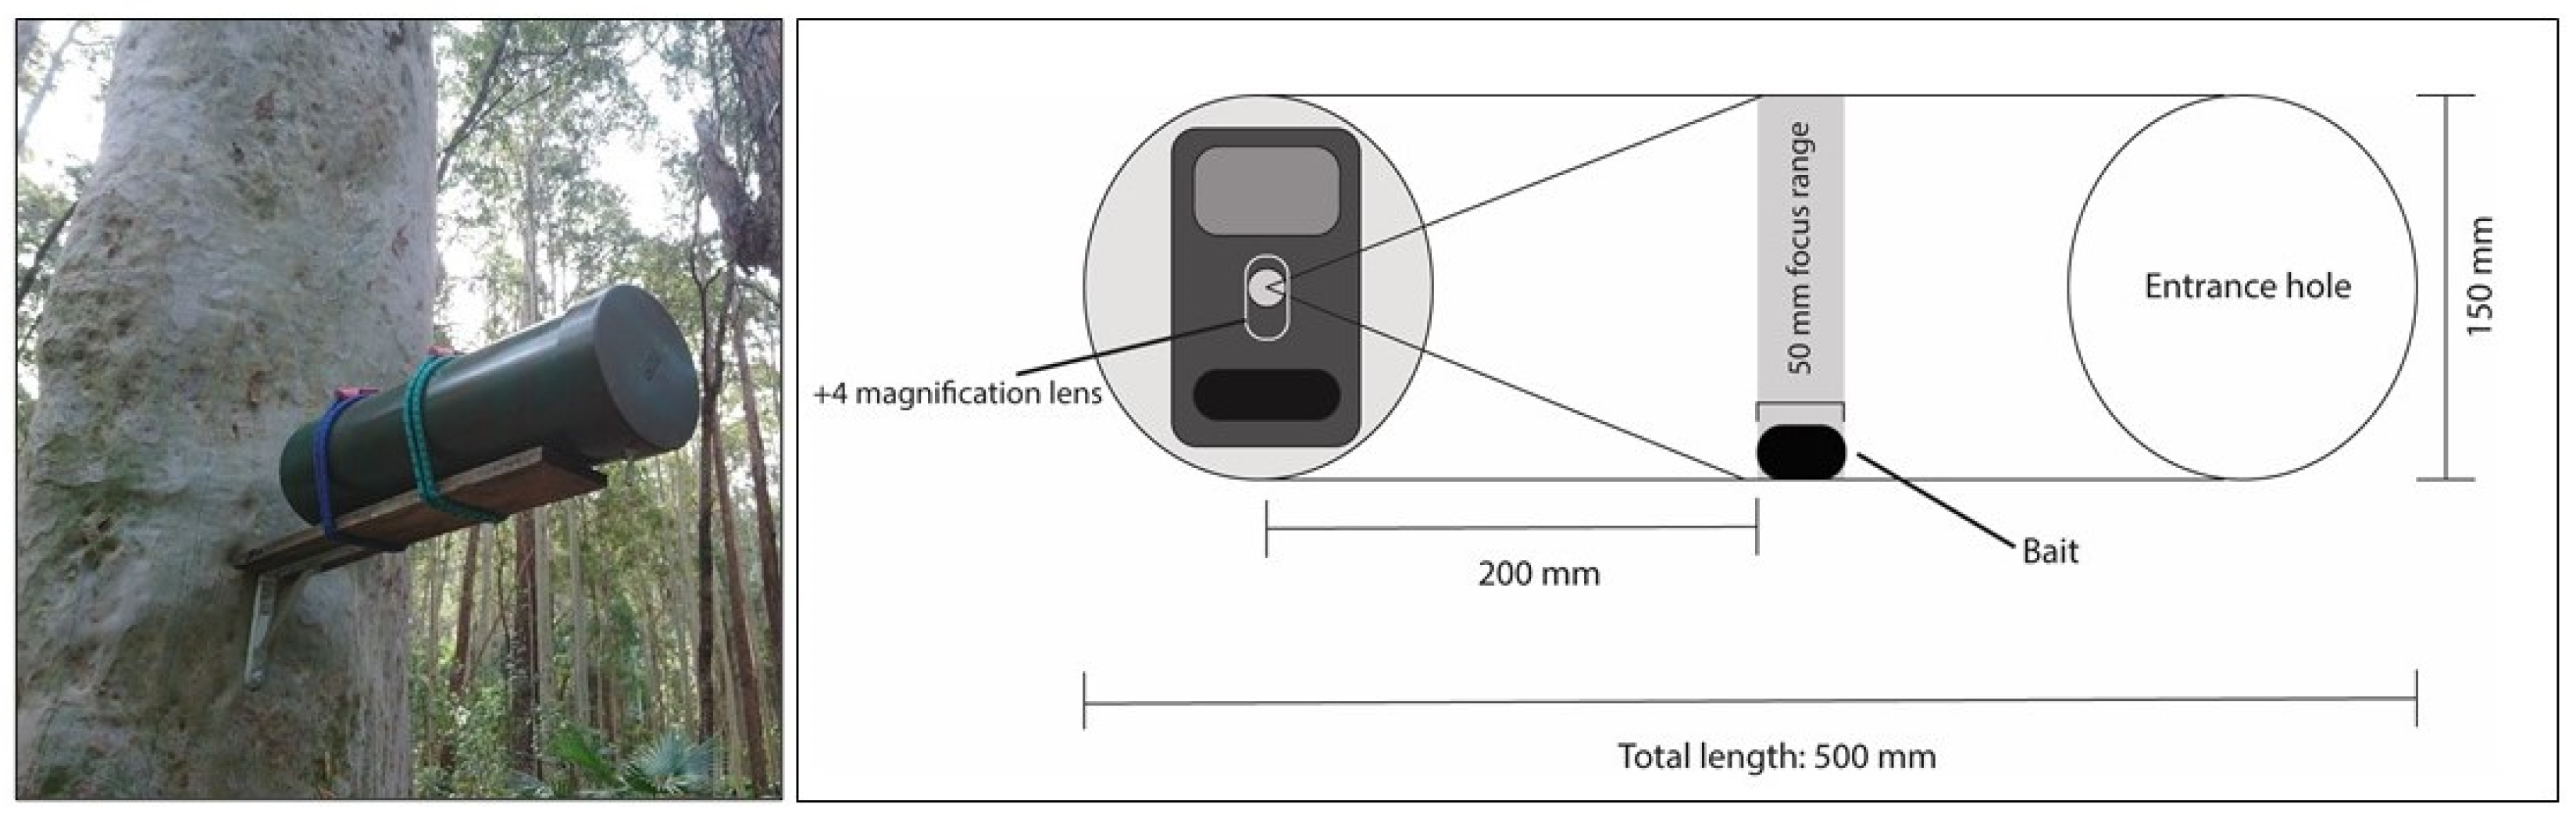
2.3. Camera Trapping
2.4. Analysis
3. Results
3.1. Recaptures
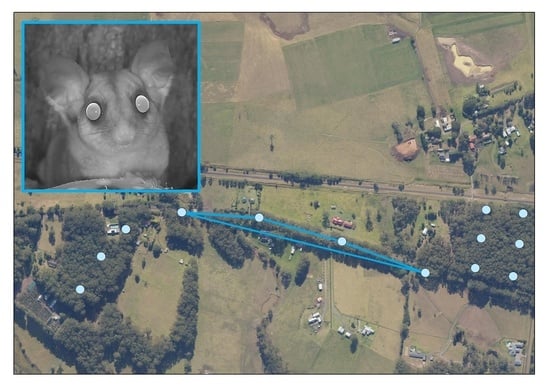
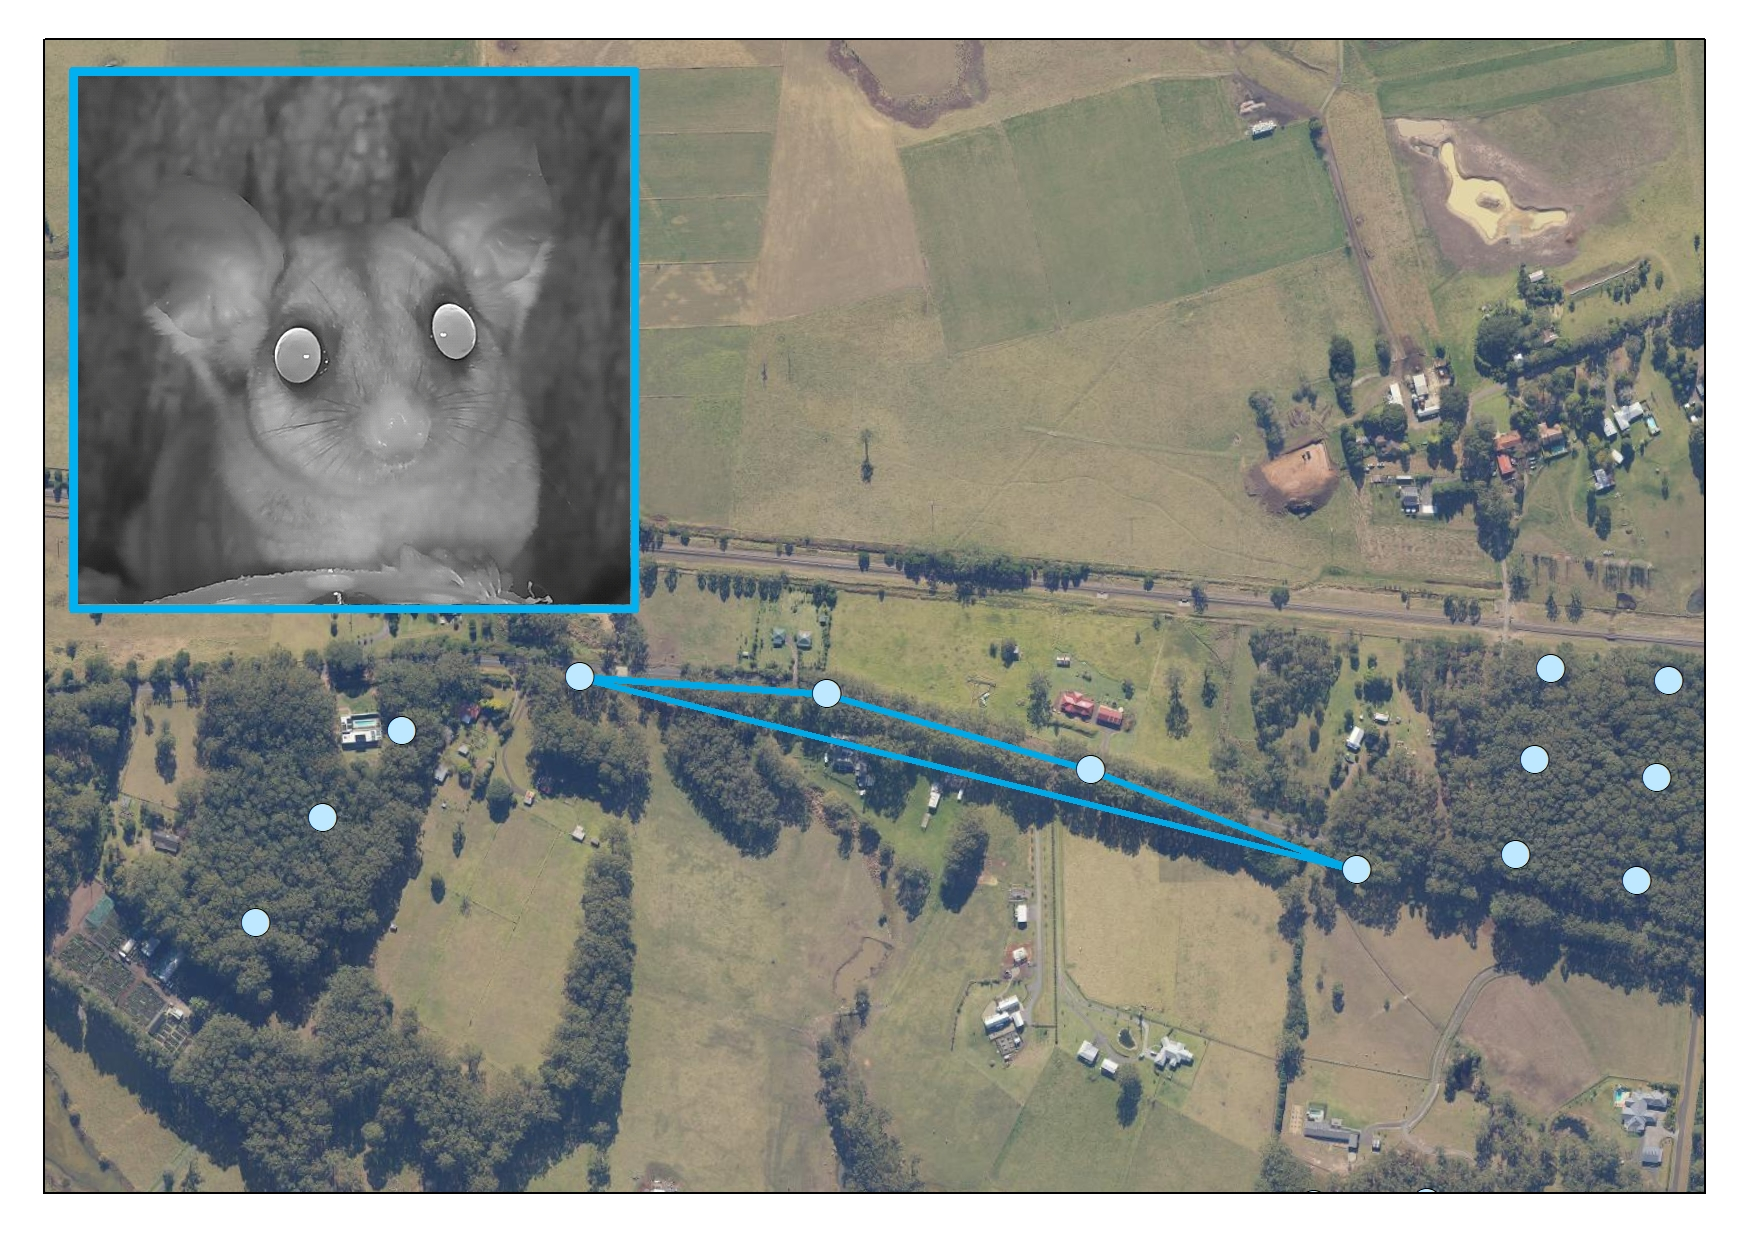
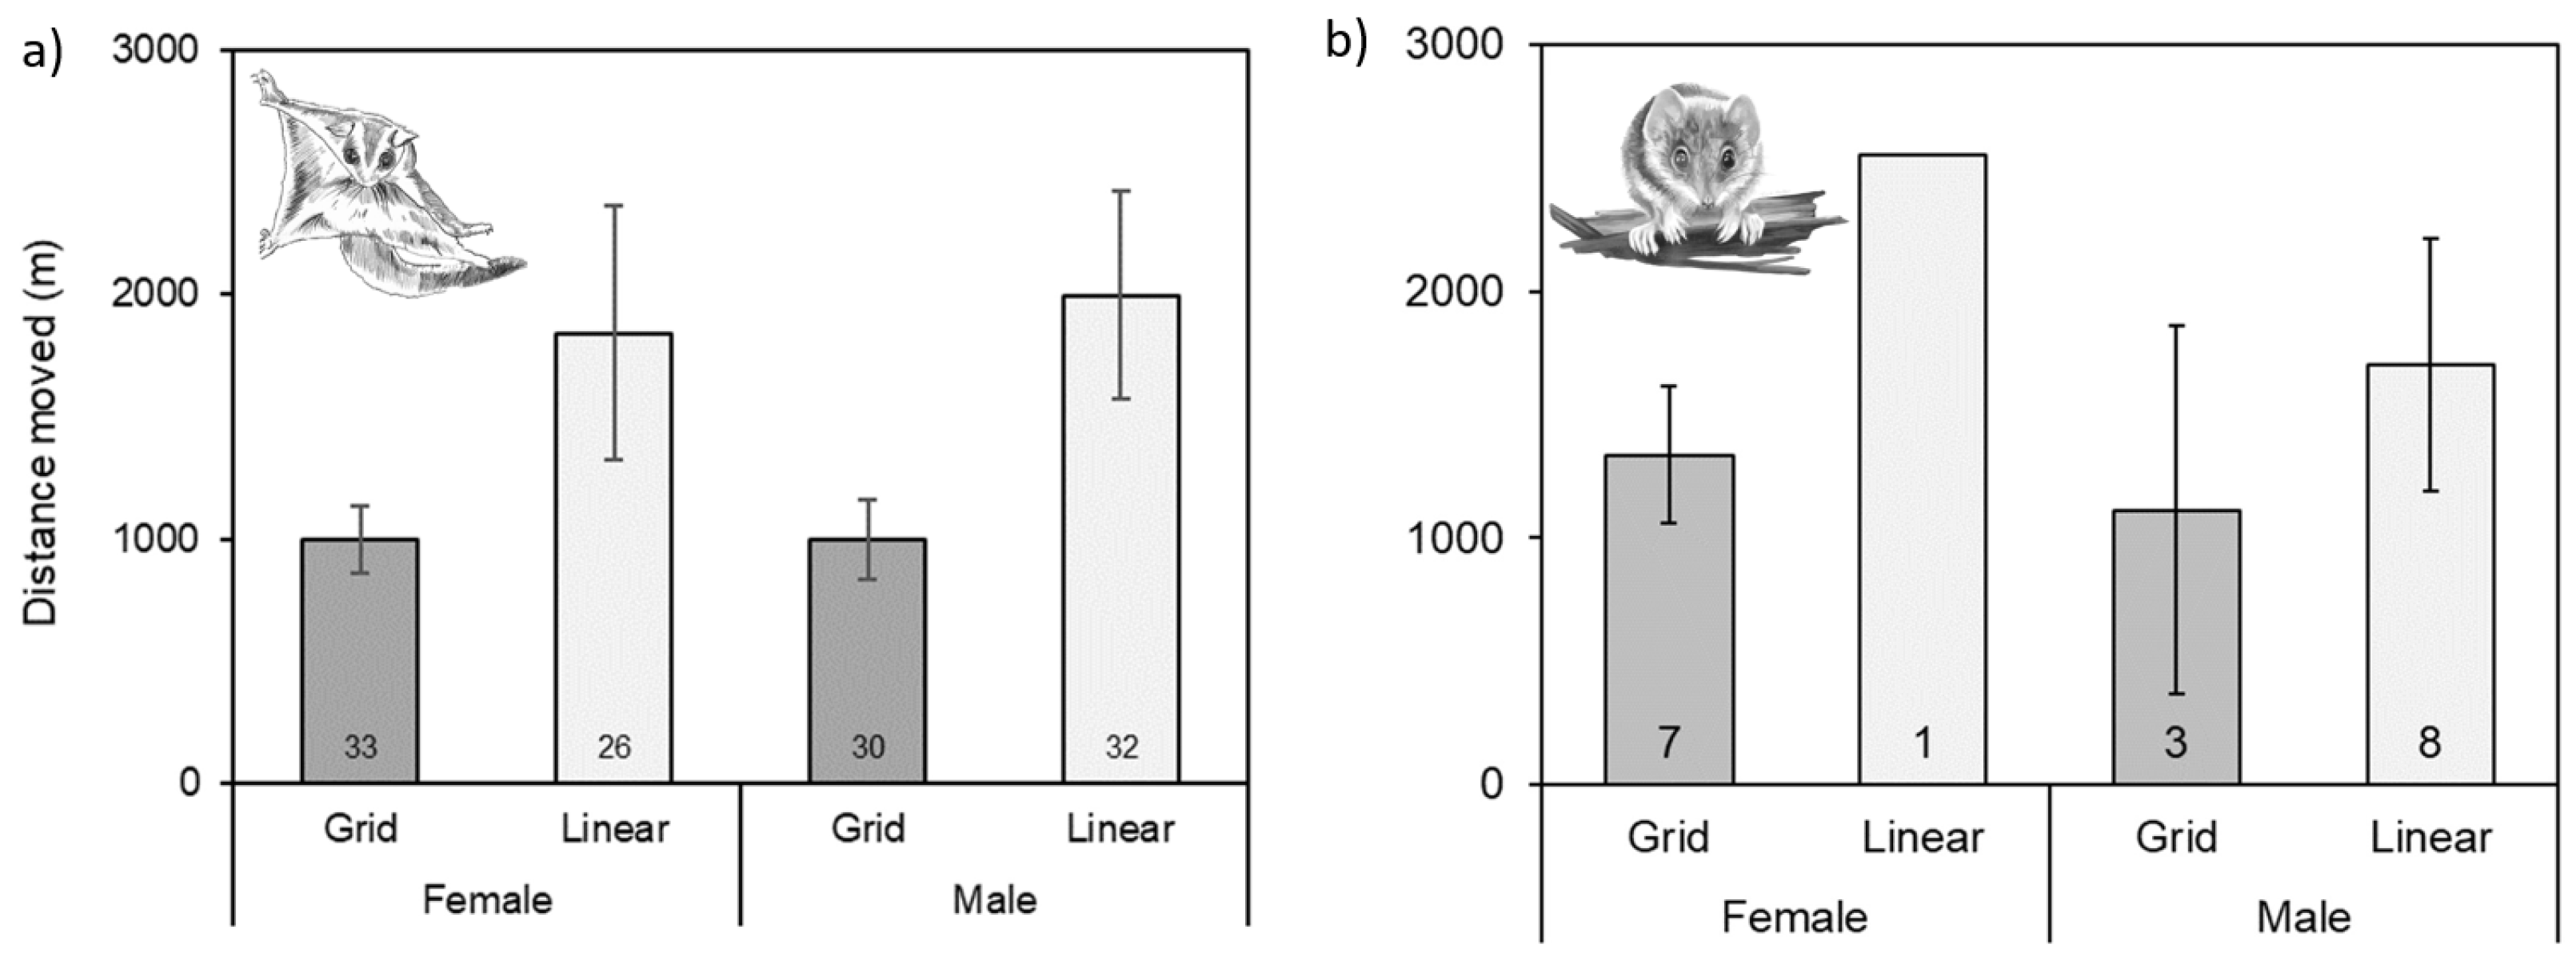
3.2. Movement: Straight Line Distances
3.3. Movements within and between Fragments of Habitat
3.4. Home ranges & Social Organisation of Sugar Gliders
4. Discussion
4.1. Recapture Rates
4.2. Movement: Straight Line Distances
4.3. Movements within and between Fragments of Habitat
4.4. Home Ranges & Social Organisation of Sugar Gliders
5. Conclusions
Supplementary Materials
Author Contributions
Funding
Institutional Review Board Statement
Informed Consent Statement
Data Availability Statement
Acknowledgments
Conflicts of Interest
References
- Demšar, U.; Buchin, K.; Cagnacci, F.; Safi, K.; Speckmann, B.; Van de Weghe, N.; Weiskopf, D.; Weibel, R. Analysis and visualisation of movement: An interdisciplinary review. Mov. Ecol. 2015, 3, 5. [Google Scholar] [CrossRef] [PubMed] [Green Version]
- Nathan, R.; Giuggioli, L. A milestone for movement ecology research. Mov. Ecol. 2013, 1, 1. [Google Scholar] [CrossRef] [PubMed] [Green Version]
- Fraser, K.C.; Davies, K.T.A.; Davy, C.M.; Ford, A.T.; Flockhart, D.T.T.; Martins, E.G. Tracking the Conservation Promise of Movement Ecology. Front. Ecol. Evol. 2018, 6, 150. [Google Scholar] [CrossRef] [Green Version]
- McCall, S.C.; Cesarini, S.; van der Ree, R.; Soanes, K.; Harper, M.J.; McCarthy, M.A. Evidence that a Highway Reduces Apparent Survival Rates of Squirrel Gliders. Ecol. Soc. 2017, 15, 27. [Google Scholar] [CrossRef] [Green Version]
- Ng, S.J.; Dole, J.W.; Sauvajot, R.M.; Riley, S.P.D.; Valone, T.J. Use of highway undercrossings by wildlife in southern California. Biol. Conserv. 2004, 115, 499–507. [Google Scholar] [CrossRef]
- Wilson, R.F.; Marsh, H.; Winter, J. Importance of canopy connectivity for home range and movements of the rainforest arboreal ringtail possum (Hemibelideus lemuroides). Wildl. Res. 2007, 34, 177–184. [Google Scholar] [CrossRef] [Green Version]
- Van Dyck, H.; Baguette, M. Dispersal behaviour in fragmented landscapes: Routine or special movements? Basic Appl. Ecol. 2005, 6, 535–545. [Google Scholar] [CrossRef]
- Vasudev, D.; Fletcher, R.J. Incorporating movement behavior into conservation prioritization in fragmented landscapes: An example of western hoolock gibbons in Garo Hills, India. Biol. Conserv. 2015, 181, 124–132. [Google Scholar] [CrossRef]
- Malekian, M.; Cooper, S.J.B.; Saint, K.M.; Lancaster, M.L.; Taylor, A.C.; Carthew, S.M. Effects of landscape matrix on population connectivity of an arboreal mammal, Petaurus breviceps. Ecol. Evol. 2015, 5, 3939–3953. [Google Scholar] [CrossRef] [Green Version]
- Van Der Ree, R.; Bennett, A.F.; Gilmore, D.C. Gap-crossing by gliding marsupials: Thresholds for use of isolated woodland patches in an agricultural landscape. Biol. Conserv. 2004, 115, 241–249. [Google Scholar] [CrossRef]
- Lindenmayer, D.B.; Cunningham, R.B.; Matthew, L.P.; Donnelly, C. The response of arboreal marsupials to landscape context over time: A large-scale fragmentation study revisited. J. Biogeogr. 2013, 40, 2082–2093. [Google Scholar] [CrossRef]
- Huang, Z.; Yuan, P.; Huang, H.; Tang, X.; Xu, W.; Huang, C.; Zhou, Q. Effect of habitat fragmentation on ranging behavior of white-headed langurs in limestone forests in Southwest China. Primates 2017, 58, 423–434. [Google Scholar] [CrossRef] [PubMed]
- Allan, B.M.; Nimmo, D.G.; Arnould, J.P.Y.; Martin, J.K.; Ritchie, E.G. The secret life of possums: Data loggers reveal the movement ecology of an arboreal mammal. J. Mammal. 2019, 100, 158–168. [Google Scholar] [CrossRef]
- Gracanin, A.; Cappelletti, C.; Knipler, M.; Dallas, R.K.K.; Mikac, K.M. Exploring new grounds: Arboreal sugar gliders frequently observed spending time on the ground as seen on camera traps. Aust. Mammal. 2019, 42, 10–13. [Google Scholar] [CrossRef]
- Vanhelden, B.E.; Close, P.G.; Stewart, B.A.; Speldewinde, P.C.; Comer, S.J. Going to ground: Implications of ground use for the conservation of an arboreal marsupial. Aust. Mammal. 2019, 42, 106–109. [Google Scholar] [CrossRef]
- Lindenmayer, D.B.; Pope, M.L.; Cunningham, R.B. Patch use by the greater glider (Petauroides volans) in a fragmented forest ecosystem. II. Characteristics of den trees and preliminary data on den-use patterns. Wildl. Res. 2004, 31, 569. [Google Scholar] [CrossRef]
- Braden, A.W.; Lopez, R.R.; Roberts, C.W.; Silvy, N.J.; Owen, C.B.; Frank, P.A. Florida Key deer Odocoileus virginianus clavium underpass use and movements along a highway corridor. Wildlife Biol. 2008, 14, 155–163. [Google Scholar] [CrossRef] [Green Version]
- Smith, G.C.; Means, K.; Churchill, S. Aspects of the ecology of the Atherton antechinus (Antechinus godmani) living in sympatry with the rusty antechinus (A. adustus) in the Wet Tropics, Queensland—A trapping and radio-tracking study. Aust. Mammal. 2018, 40, 16–25. [Google Scholar] [CrossRef]
- Henry, S.R. Social organisation of the greater glider (Petauroides volans) in Victoria. In Possums and Gliders; Smith, A.P., Hume, I.D., Eds.; Surrey Beatty and Sons: Chipping Norton, UK, 1984; pp. 221–228. [Google Scholar]
- Goldingay, R.L.; Kavanagh, R.P. Home-range estimates and habitat of the yellow-bellied glider (Petaurus australis) at Waratah Creek, New South Wales. Wildl. Res. 1993, 20, 387–403. [Google Scholar] [CrossRef]
- Rathbun, G.B.; Dumbacher, J.P. Home range and use of diurnal shelters by the Etendeka round-eared sengi, a newly discovered Namibian endemic desert mammal. PeerJ 2015, 3, e1302. [Google Scholar] [CrossRef]
- Trolle, M.; Noss, A.J.; De Lima, E.S.; Dalponte, J.C. Camera-trap studies of maned wolf density in the Cerrado and the Pantanal of Brazil. In Vertebrate Conservation and Biodiversity; Springer: New York, NY, USA, 2006; pp. 371–378. [Google Scholar]
- Ridout, M.S.; Linkie, M. Estimating overlap of daily activity patterns from camera trap data. J. Agric. Biol. Environ. Stat. 2009, 14, 322–337. [Google Scholar] [CrossRef]
- Popescu, V.D.; de Valpine, P.; Sweitzer, R.A. Testing the consistency of wildlife data types before combining them: The case of camera traps and telemetry. Ecol. Evol. 2014, 4, 933–943. [Google Scholar] [CrossRef] [PubMed]
- Srivathsa, A.; Kumar, N.; Karanth, K.U. Home range size of the dhole estimated from cameratrap surveys. Canid Biol. Conserv. 2017, 20, 1–4. [Google Scholar]
- Pallemaerts, L.; Adul, I.P.; Jeffers, K.A.; Macdonald, D.W.; Cheyne, S.M. Bornean clouded leopard minimum home range analysis. Indonesian Borneo. Cat News 2019, 70, 32–35. [Google Scholar]
- Soisalo, M.K.; Cavalcanti, S.M.C. Estimating the density of a jaguar population in the Brazilian Pantanal using camera-traps and capture–recapture sampling in combination with GPS radio-telemetry. Biol. Conserv. 2006, 129, 487–496. [Google Scholar] [CrossRef]
- Pérez, J.; Valenzuela, G.; Torralba, B.; Martín, J.M.; Rodríguez-Siles, J.; Garrote, G.; Simón-Mata, M.Á.; Bueno, J.; Moral, M.; Gil-Sánchez, J.M.; et al. The use of camera trapping for estimating Iberian lynx (Lynx pardinus) home ranges. Eur. J. Wildl. Res. 2011, 57, 1203–1211. [Google Scholar] [CrossRef]
- Kumbhojkar, S.; Yosef, R.; Mehta, A.; Rakholia, S. A camera-trap home-range analysis of the indian leopard (Panthera pardus fusca) in Jaipur, India. Animals 2020, 10, 1600. [Google Scholar] [CrossRef]
- Gray, E.L.; Dennis, T.E.; Baker, A.M. Can remote infrared cameras be used to differentiate small, sympatric mammal species? A case study of the black-tailed dusky antechinus, Antechinus arktos and co-occurring small mammals in Southeast Queensland, Australia. PLoS ONE 2017, 12, e0181592. [Google Scholar] [CrossRef] [Green Version]
- De Bondi, N.; White, J.G.; Stevens, M.; Cooke, R. A comparison of the effectiveness of camera trapping and live trapping for sampling terrestrial small-mammal communities. Wildl. Res. 2010, 37, 456–465. [Google Scholar] [CrossRef]
- Dundas, S.J.; Ruthrof, K.X.; Hardy, G.E.S.J.; Fleming, P.A. Pits or pictures: A comparative study of camera traps and pitfall trapping to survey small mammals and reptiles. Wildl. Res. 2019, 46, 104–113. [Google Scholar] [CrossRef]
- McCleery, R.A.; Zweig, C.L.; Desa, M.A.; Hunt, R.; Kitchens, W.M.; Percival, H.F. A novel method for camera-trapping small mammals. Wildl. Soc. Bull. 2014, 38, 887–891. [Google Scholar] [CrossRef]
- Gracanin, A.; Gracanin, V.; Mikac, K.M. The selfie trap: A novel camera trap design for accurate small mammal identification. Ecol. Manag. Restor. 2018, 20, 156–158. [Google Scholar] [CrossRef] [Green Version]
- Marchesan, D.; Carthew, S.M. Autecology of the yellow-footed antechinus (Antechinus flavipes) in a fragmented landscape in southern Australia. Wildl. Res. 2004, 31, 273–282. [Google Scholar] [CrossRef]
- Kirk, J.; Smith, G.C.; Agnew, G. Trial radio-tracking of feathertail gliders Acrobates pygmaeus. Aust. Mammal. 2000, 22, 129–131. [Google Scholar]
- Millspaugh, J.; Marzluff, J.M. Radio Tracking and Animal Populations; Academic Press: Cambridge, MA, USA, 2001; ISBN 0080540228. [Google Scholar]
- Soanes, K.; Lobo, M.C.; Van Der Ree, R. Radio-collared squirrel glider (Petaurus norfolcensis) struck by vehicle and transported 500km along freeway. Aust. Mammal. 2016, 38, 127–129. [Google Scholar] [CrossRef]
- Gracanin, A.; Minchinton, T.E.; Mikac, K.M.; University of Wollongong, Wollongong, Australia. Estimating the density of small mammals using the selfie trap is an effective camera trapping method. 2022; manuscript submitted for publication. [Google Scholar]
- Quin, D.G.; Smith, A.P.; Green, S.W.; Hines, H.B. Estimating the home ranges of sugar gliders (Petaurus breviceps) (Marsupialia: Petauridae), from grid-trapping and radiotelemetry. Wildl. Res. 1992, 19, 471–487. [Google Scholar] [CrossRef]
- GER The Great Eastern Ranges. Available online: https://ger.org.au/ (accessed on 23 March 2021).
- Gracanin, A.; Mikac, K.M. Camera traps reveal overlap and seasonal variation in the diel activity of arboreal and semi-arboreal mammals. Mamm. Biol. 2022, 1–15. [Google Scholar] [CrossRef]
- Australian Bureau of Meteorology Climate Data Online. Available online: http://www.bom.gov.au/climate/data/ (accessed on 2 December 2021).
- Tasker, E.M.; Dickman, C.R. A review of elliott trapping methods for small mammals in Australia. Aust. Mammal. 2001, 23, 77–87. [Google Scholar] [CrossRef] [Green Version]
- Suckling, G.C.; Macfarlane, M.A. Introduction of the sugar glider, Petaurus breviceps, into re-established forest of the Tower Hill State Game Reserve, Vic. Wildl. Res. 1983, 10, 249–258. [Google Scholar] [CrossRef]
- Campbell, C.D.; Sarre, S.D.; Stojanovic, D.; Gruber, B.; Medlock, K.; Harris, S.; MacDonald, A.J.; Holleley, C.E. When is a native species invasive? Incursion of a novel predatory marsupial detected using molecular and historical data. Divers. Distrib. 2018, 24, 831–840. [Google Scholar] [CrossRef] [Green Version]
- Jackson, M.S. Population dynamics and life history of the mahogany glider, Petaurus gracilis, and the sugar glider, Petaurus breviceps, in north Queensland. Wildl. Res. 2000, 27, 21–37. [Google Scholar] [CrossRef]
- Nowack, J.; Rojas, A.D.; Körtner, G.; Geiser, F. Snoozing through the storm: Torpor use during a natural disaster. Sci. Rep. 2015, 5, 11243. [Google Scholar] [CrossRef] [PubMed]
- Knipler, M.L.; Dowton, M.; Mikac, K.M. Genome-wide SNPs detect hybridisation of marsupial gliders (Petaurus breviceps breviceps × Petaurus norfolcensis) in the wild. Genes 2021, 12, 1327. [Google Scholar] [CrossRef] [PubMed]
- ESRI. ArcGIS Desktop: Release 10.7.1; Environmental Systems Research Institute: Redlands, CA, USA, 2011. [Google Scholar]
- Nilsen, E.B.; Pedersen, S.; Linnell, J.D.C. Can minimum convex polygon home ranges be used to draw biologically meaningful conclusions? Ecol. Res. 2008, 23, 635–639. [Google Scholar] [CrossRef]
- Barry, R.P.; McIntyre, J. Estimating animal densities and home range in regions with irregular boundaries and holes: A lattice-based alternative to the kernel density estimator. Ecol. Modell. 2011, 222, 1666–1672. [Google Scholar] [CrossRef] [Green Version]
- R Core Team. R: A Language and Environment for Statistical Computing; R Foundation for Statistical Computing: Vienna, Austria, 2022. [Google Scholar]
- JMP®, Version Pro 15; SAS Institute Inc.: Cary, NC, USA, 2021.
- Smith, A.P.; Phillips, K. A systematic technique for census of sugar gliders and other small arboreal mammals. Wildl. Res. 1984, 11, 83–87. [Google Scholar] [CrossRef]
- Quin, D.G. Population ecology of the squirrel glider (Petaurus norfolcensis) and the sugar glider (P. breviceps) (Maruspialia: Petauridae) at Limeburners Creek, on the central north coast of New South Wales. Wildl. Res. 1995, 22, 471–505. [Google Scholar] [CrossRef]
- Gray, E.L.; Baker, A.M.; Firn, J. Autecology of a new species of carnivorous marsupial, the endangered black-tailed dusky antechinus (Antechinus arktos), compared to a sympatric congener, the brown antechinus (Antechinus stuartii). Mammal Res. 2017, 62, 47–63. [Google Scholar] [CrossRef]
- Suckling, G.C. Population ecology of the sugar glider, petaurus breviceps, in a system of fragmented habitats. Wildl. Res. 1984, 11, 49–75. [Google Scholar] [CrossRef]
- Sharpe, D.J.; Goldingay, R.L. Home range of the Australian squirrel glider, Petaurus norfolcensis (Diprotodontia). J. Mammal. 2007, 88, 1515–1522. [Google Scholar] [CrossRef] [Green Version]
- Jackson, S.M. Home-range and den use of the mahogany glider, Petaurus gracilis. Wildl. Res. 2000, 27, 49–60. [Google Scholar] [CrossRef]
- Caryl, F.M.; Thomson, K.; Van Der Ree, R. Permeability of the urban matrix to arboreal gliding mammals: Sugar gliders in Melbourne, Australia. Austral Ecol. 2013, 38, 609–613. [Google Scholar] [CrossRef]
- Goldingay, R.L.; Taylor, B.D.; Parkyn, J.L. Use of tall wooden poles by four species of gliding mammal provides further proof of concept for habitat restoration. Aust. Mammal. 2018, 41, 255–261. [Google Scholar] [CrossRef]
- Marchesan, D.; Carthew, S.M. Use of space by the yellow-footed antechinus, Antechinus flavipes, in a fragmented landscape in South Australia. Landsc. Ecol. 2008, 23, 741–752. [Google Scholar] [CrossRef]
- Law, B.S.; Chidel, M.; Turner, G. The use by wildlife of paddock trees in farmland. Pacific Conserv. Biol. 2000, 6, 130–143. [Google Scholar] [CrossRef]
- Knight, E.H.; Fox, B.J. Does habitat structure mediate the effects of forest fragmentation and human-induced disturbance on the abundance of Antechinus stuartii? Aust. J. Zool. 2000, 48, 577–595. [Google Scholar] [CrossRef]
- Lindenmayer, D.B.; Cunningham, R.B.; Pope, M.L. A large-scale “experiment” to examine the effects of landscape context and habitat fragmentation on mammals. Biol. Conserv. 1999, 88, 387–403. [Google Scholar] [CrossRef]
- Carthew, S.M. Foraging Behaviour of Marsupial Pollinators in a Population of Banksia spinulosa. Oikos 1994, 69, 133–139. [Google Scholar] [CrossRef]
- Howard, J. Diet of Petaurus breviceps (Marsupialia: Petauridae) in a mosaic of coastal woodland and heath. Aust. Mammal. 1989, 12, 15–21. [Google Scholar] [CrossRef]
- Stobo-Wilson, A.M.; Cremona, T.; Murphy, B.P.; Carthew, S.M. Resource availability drives variation in a marsupial glider’s home-range size. J. Zool. 2021, 315, 199–212. [Google Scholar] [CrossRef]
- Zabel, C.J.; McKelvey, K.; Ward, J.P., Jr. Influence of primary prey on home-range size and habitat-use patterns of northern spotted owls (Strix occidentalis caurina). Can. J. Zool. 1995, 73, 433–439. [Google Scholar] [CrossRef]
- Herfindal, I.; Linnell, J.D.C.; Odden, J.; Nilsen, E.B.; Andersen, R. Prey density, environmental productivity and home-range size in the Eurasian lynx (Lynx lynx). J. Zool. 2005, 265, 63–71. [Google Scholar] [CrossRef] [Green Version]
- Lindenmayer, D. Gliders of Australia: A Natural History; UNSW Press: Kensington, Australia, 2002; ISBN 086840523X. [Google Scholar]
- Van Der Ree, R.; Bennett, A.F. Home range of the squirrel glider (Petaurus norfolcensis) in a network of remnant linear habitats. J. Zool. 2003, 259, 327–336. [Google Scholar] [CrossRef]
- Pope, M.L.; Lindenmayer, D.B.; Cunningham, R.B. Patch use by the greater glider (Petauroides volans) in a fragmented forest ecosystem. I. Home range size and movements. Wildl. Res. 2004, 31, 559. [Google Scholar] [CrossRef]
- O’Donnell, K.; Delbarco-Trillo, J. Changes in the home range sizes of terrestrial vertebrates in response to urban disturbance: A meta-analysis. J. Urban Ecol. 2020, 6, juaa014. [Google Scholar] [CrossRef]
- Sadler, L.M.; Ward, S.J. Coalitions in male sugar gliders: Are they natural? J. Zool. 1999, 248, 91–96. [Google Scholar] [CrossRef]
- Goldingay, R.L.; Sharpe, D.J.; Dobson, M.D.J. Variation in the home-range size of the squirrel glider (Petaurus norfolcensis). Aust. Mammal. 2010, 32, 183. [Google Scholar] [CrossRef]
- Jacques, C.N.; Zweep, J.S.; Jenkins, S.E.; Klaver, R.W. Home range use and survival of southern flying squirrels in fragmented forest landscapes. J. Mammal. 2017, 98, 1479–1488. [Google Scholar] [CrossRef]
- Schultze-Westrum, T.G. Social communication by chemical signals in flying phalangers (Petaurus breviceps papuanus). Olfaction Tast. 1969, 3, 268–277. [Google Scholar]
- Nowak, R.M. Walker’s Mammals of the World: Monotremes, Marsupials, Afrotherians, Xenarthrans, and Sundatherians; JHU Press: Baltimore, MD, USA, 2018; ISBN 1421424673. [Google Scholar]


| Female | Male | Unknown Sex | Total | Capture Success | |
|---|---|---|---|---|---|
| Area 1 | |||||
| Petaurus breviceps | 265 | 251 | 15 | 531 | 43% |
| Antechinus stuartii | 40 | 115 | 9 | 164 | 13% |
| Rattus fuscipes | 0 | 2 | 0 | 2 | 0% |
| Rattus norvegicus | 4 | 22 | 1 | 27 | 2% |
| Area 2 | |||||
| Petaurus breviceps | 529 | 351 | 5 | 885 | 70% |
| Antechinus stuartii | 248 | 14 | 15 | 277 | 2% |
| Rattus fuscipes | 18 | 48 | 1 | 67 | 1% |
| Rattus norvegicus | 6 | 0 | 0 | 6 | 1% |
| Area 3 | |||||
| Petaurus breviceps | 172 | 108 | 41 | 321 | 29% |
| Antechinus stuartii | 34 | 0 | 0 | 34 | 3% |
| Rattus norvegicus | 15 | 16 | 8 | 39 | 3% |
| Area 4 | |||||
| Petaurus breviceps | 11 | 1 | 0 | 12 | 1% |
| Antechinus stuartii | 306 | 0 | 0 | 306 | 27% |
| Rattus fuscipes | 35 | 0 | 0 | 35 | 3% |
| Rattus norvegicus | 20 | 13 | 0 | 33 | 3% |
| N | Mean Recapture Rate | S.E. | |
|---|---|---|---|
| Petaurus breviceps | |||
| Female | 87 | 11.2 | 0.6 |
| Male | 77 | 9.0 | 0.6 |
| Antechinus stuartii | |||
| Female | 49 | 14.9 | 1.5 |
| Male | 21 | 6.4 | 1.2 |
| Rattus fuscipes | |||
| Female | 4 | 14.8 | 5.0 |
| Male | 7 | 8.0 | 2.5 |
| Rattus norvegicus | |||
| Female | 9 | 6.3 | 1.4 |
| Male | 8 | 7.0 | 1.4 |
| N | Mean Number of Sites Detected at | S.E. | Mean Distance Travelled (m) | S.E. | Maximum Distance Observed (m) | |
|---|---|---|---|---|---|---|
| Petaurus breviceps | ||||||
| Female | 87 | 2.41 | 0.13 | 1013 | 200 | 14,661 |
| Male | 77 | 2.68 | 0.17 | 1167 | 205 | 12,015 |
| Antechinus stuartii | ||||||
| Female | 49 | 1.27 | 0.09 | 243 | 91 | 2555 |
| Male | 21 | 2.19 | 0.32 | 861 | 292 | 4237 |
| Rattus fuscipes | ||||||
| Female | 4 | 1.00 | 0.00 | 0 | 0 | 0 |
| Male | 7 | 1.57 | 0.20 | 394 | 264 | 1902 |
| Rattus norvegicus | ||||||
| Female | 9 | 1.00 | 0.00 | 0 | 0 | 0 |
| Male | 8 | 1.38 | 0.18 | 344 | 190 | 1283 |
| N | Number of Sites Detected at | Recapture Rate | Distance Moved (m) | KDE Home Range 95% (ha) | KDE Home Range 50% (ha) | MCP Home Range (ha) | |
|---|---|---|---|---|---|---|---|
| Grid | |||||||
| Female | 9 | 4.3 (0.2) | 15.0 (1.8) | 1697 (224) | 4.6 (0.4) | 1.1 (0.1) | 1.3 (0.1) |
| Male | 8 | 4.6 (0.3) | 11.3 (1.7) | 1503 (328) | 6.9 (0.9) | 1.4 (0.3) | 2.0 (0.4) |
| Linear | |||||||
| Female | 6 | 4.7 (0.3) | 18.2 (2.8) | 5027 (2208) | 5.6 (1.4) | 1.5 (0.4) | 1.2 (0.2) |
| Male | 11 | 4.8 (0.4) | 11.8 (1.7) | 4000 (954) | 7.5 (1.2) | 2.1 (0.4) | 2.7 (0.5) |
Publisher’s Note: MDPI stays neutral with regard to jurisdictional claims in published maps and institutional affiliations. |
© 2022 by the authors. Licensee MDPI, Basel, Switzerland. This article is an open access article distributed under the terms and conditions of the Creative Commons Attribution (CC BY) license (https://creativecommons.org/licenses/by/4.0/).
Share and Cite
Gracanin, A.; Mikac, K.M. The Use of Selfie Camera Traps to Estimate Home Range and Movement Patterns of Small Mammals in a Fragmented Landscape. Animals 2022, 12, 912. https://doi.org/10.3390/ani12070912
Gracanin A, Mikac KM. The Use of Selfie Camera Traps to Estimate Home Range and Movement Patterns of Small Mammals in a Fragmented Landscape. Animals. 2022; 12(7):912. https://doi.org/10.3390/ani12070912
Chicago/Turabian StyleGracanin, Ana, and Katarina M. Mikac. 2022. "The Use of Selfie Camera Traps to Estimate Home Range and Movement Patterns of Small Mammals in a Fragmented Landscape" Animals 12, no. 7: 912. https://doi.org/10.3390/ani12070912