
Island Life: Use of Activity Budgets and Visibility to Evaluate a Multi-Species Within-Zoo Exhibit Move

 , , ,
, , ,
Abstract
:Simple Summary
Abstract
1. Introduction
2. Materials and Methods
2.1. Study Individuals
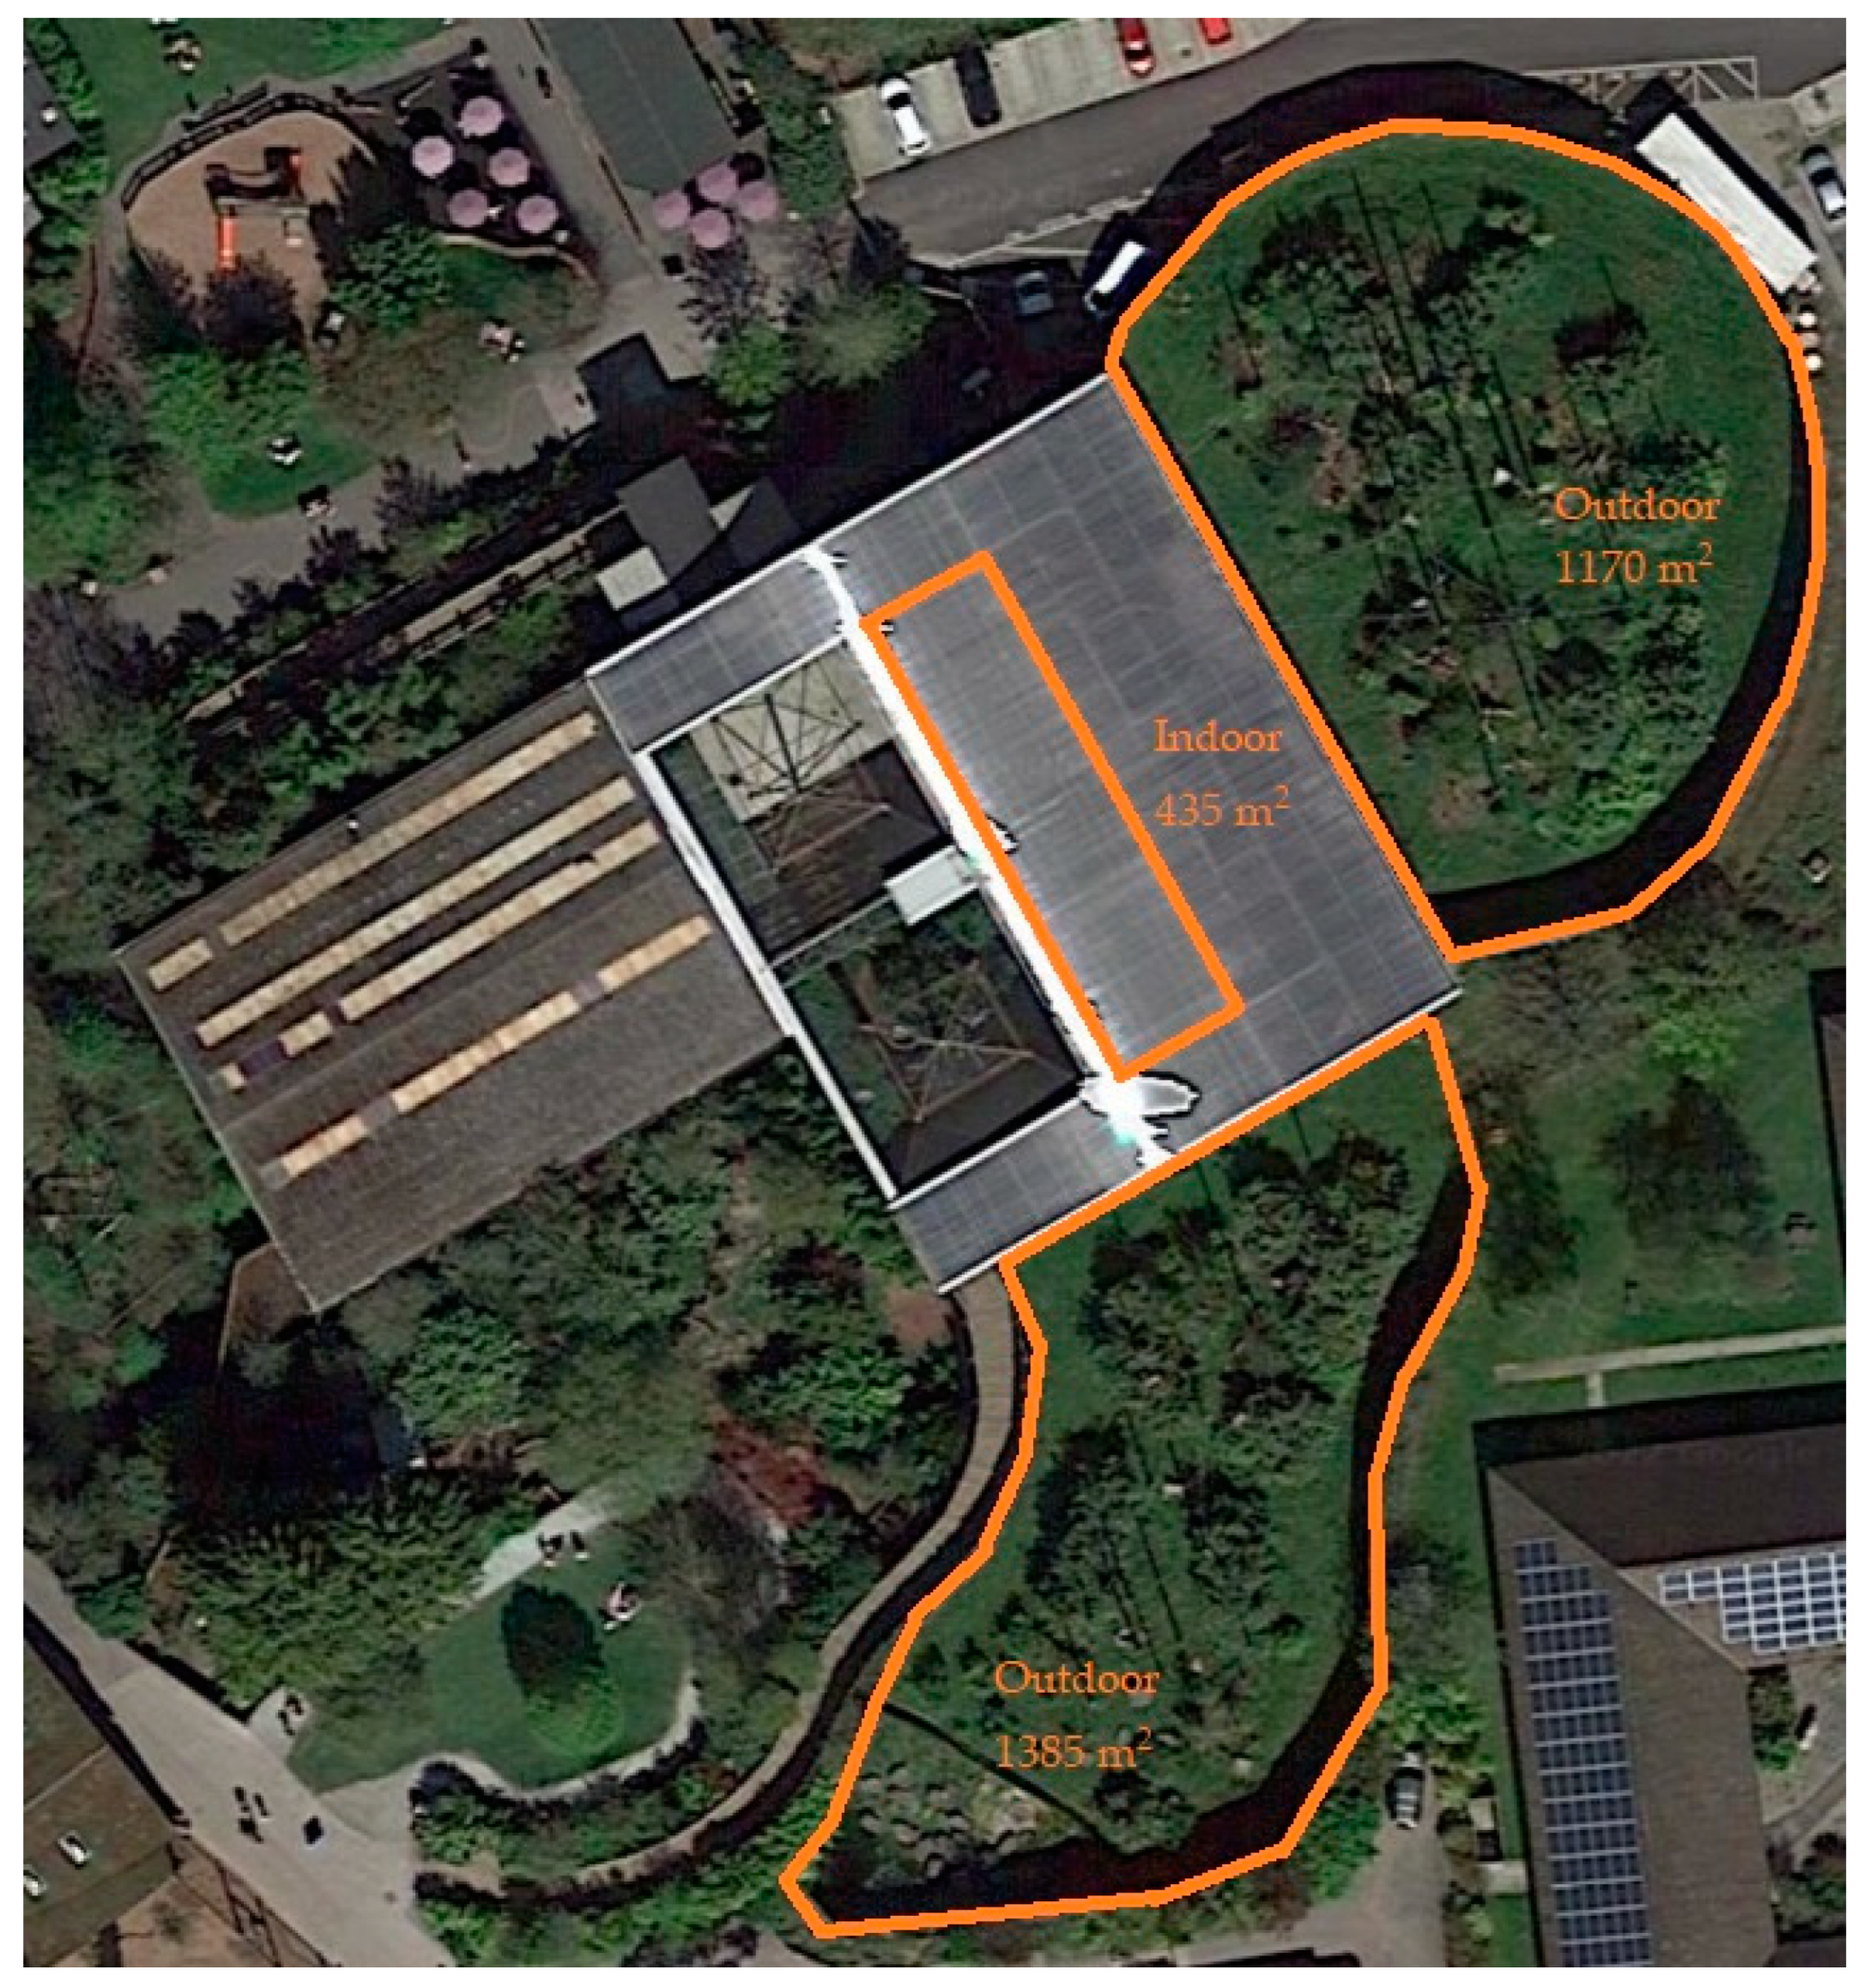
2.2. Exhibit Information
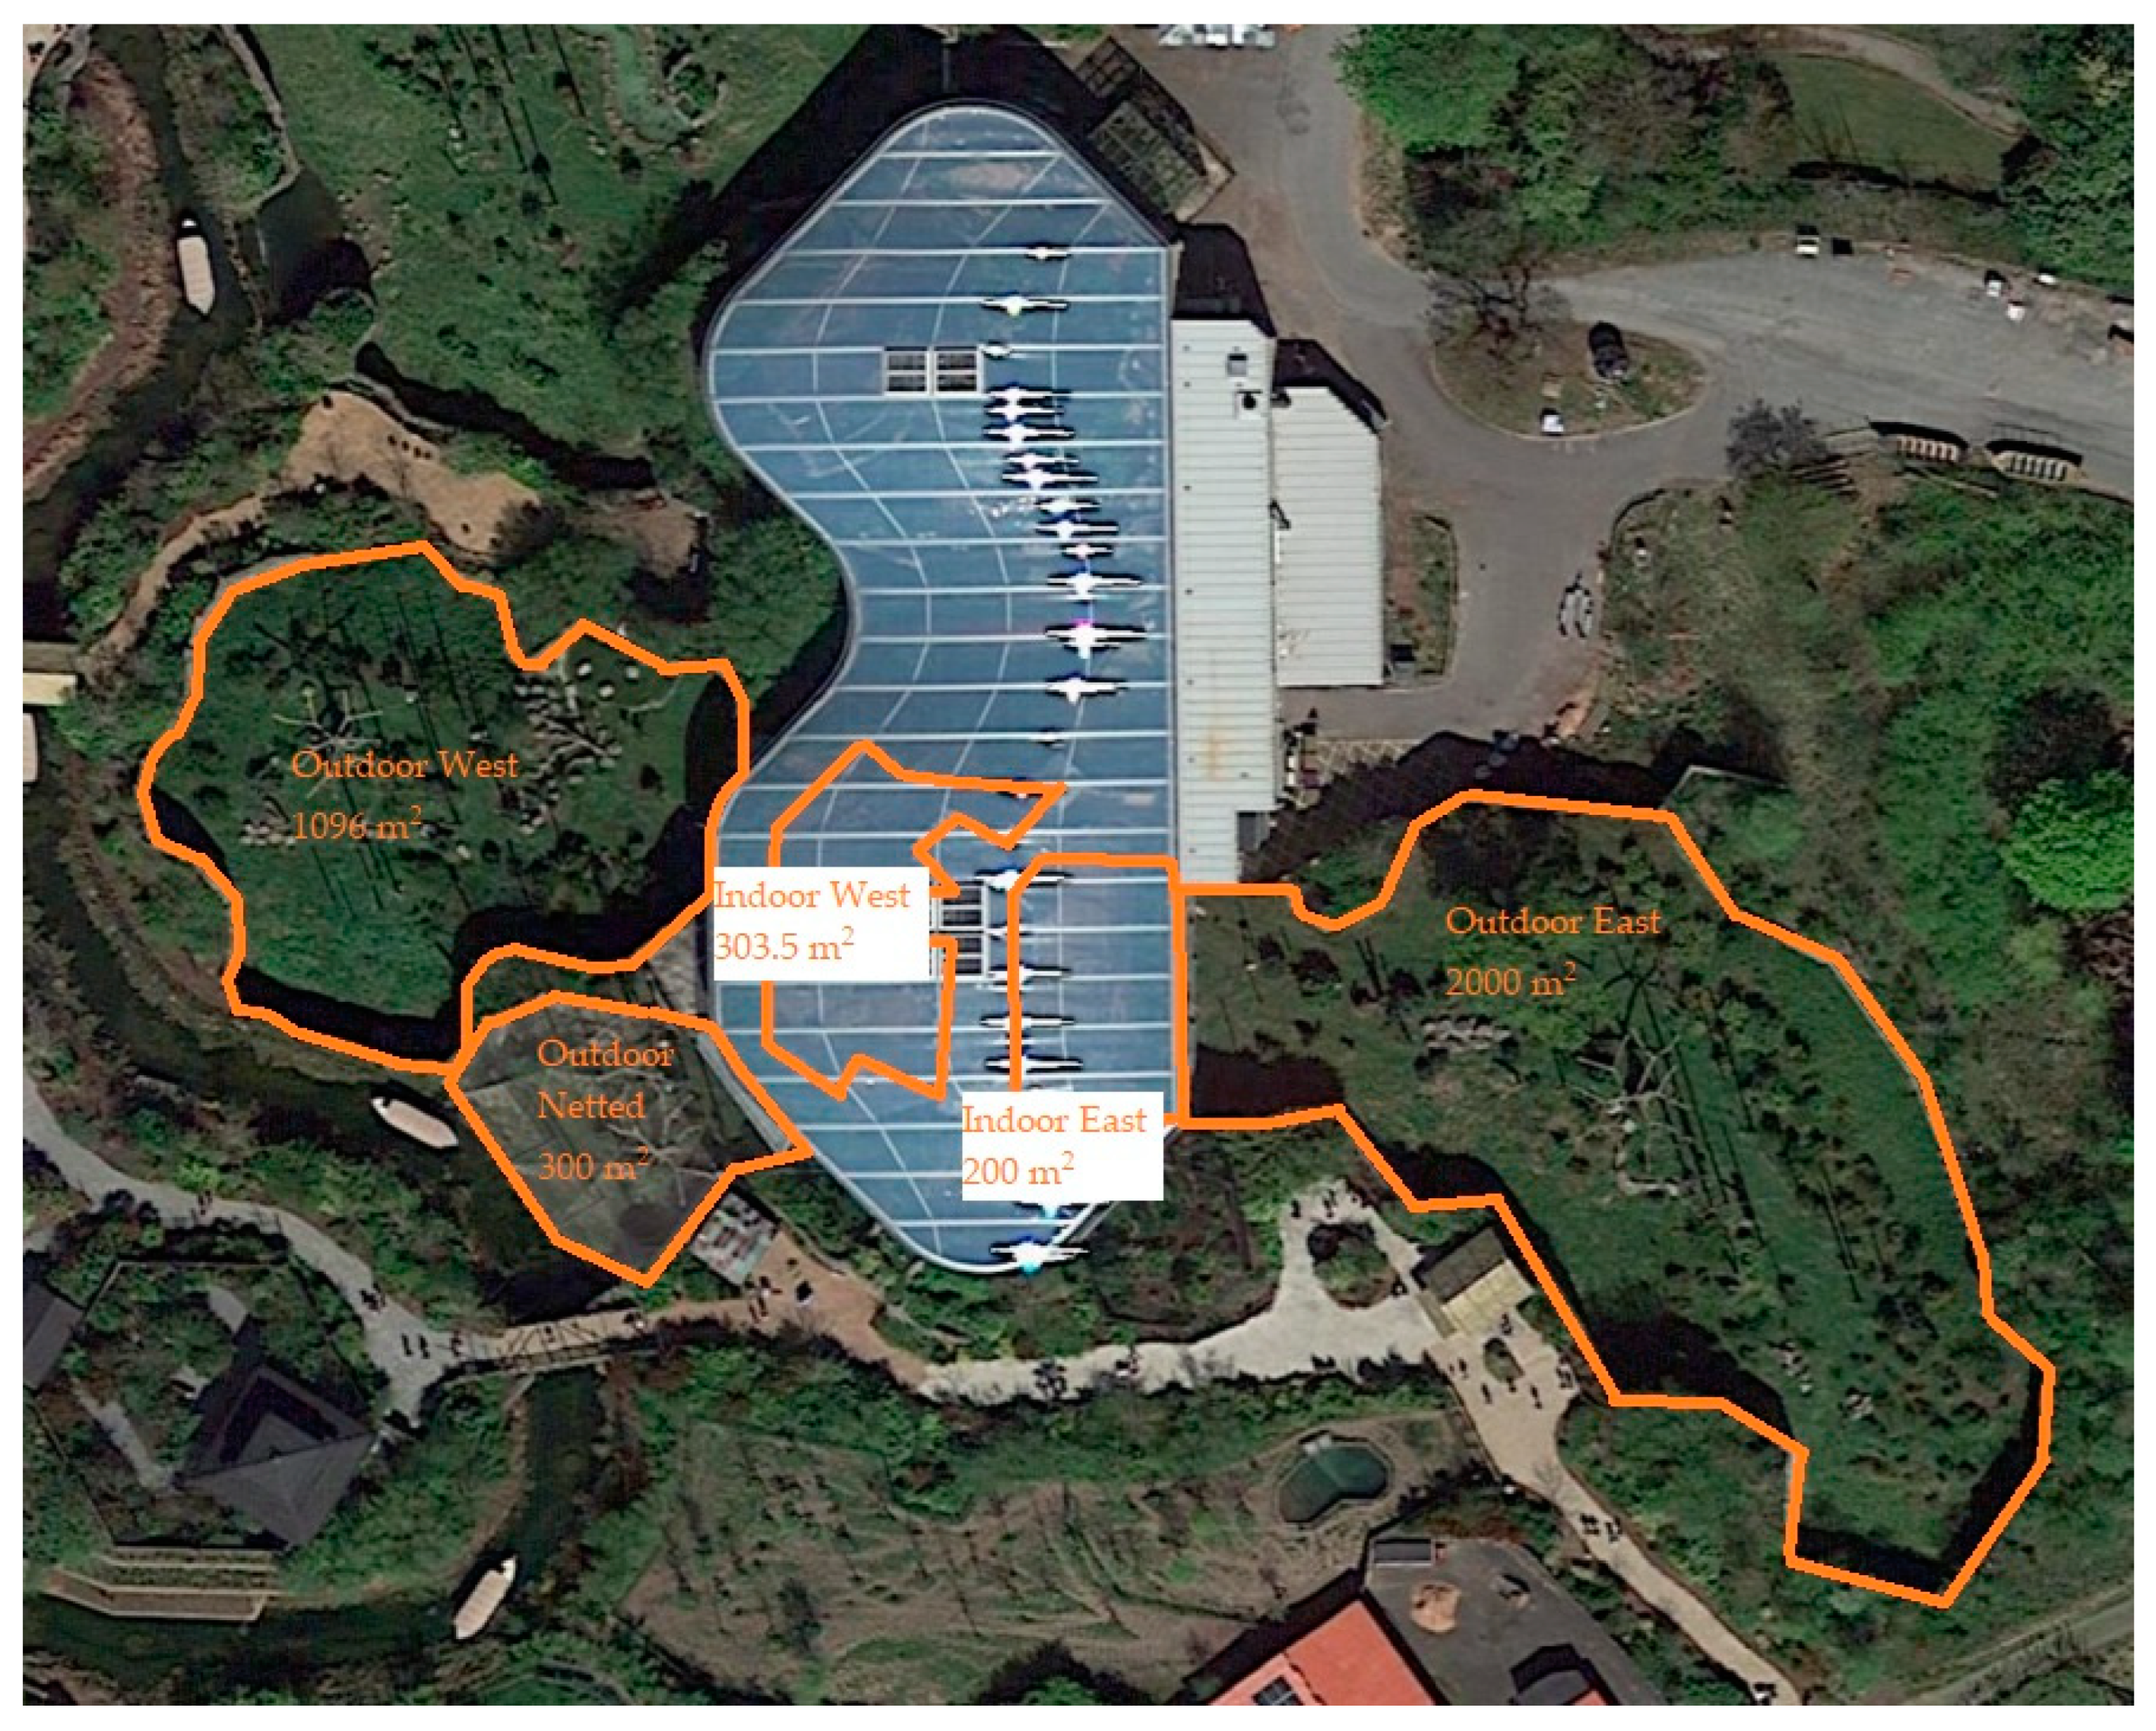
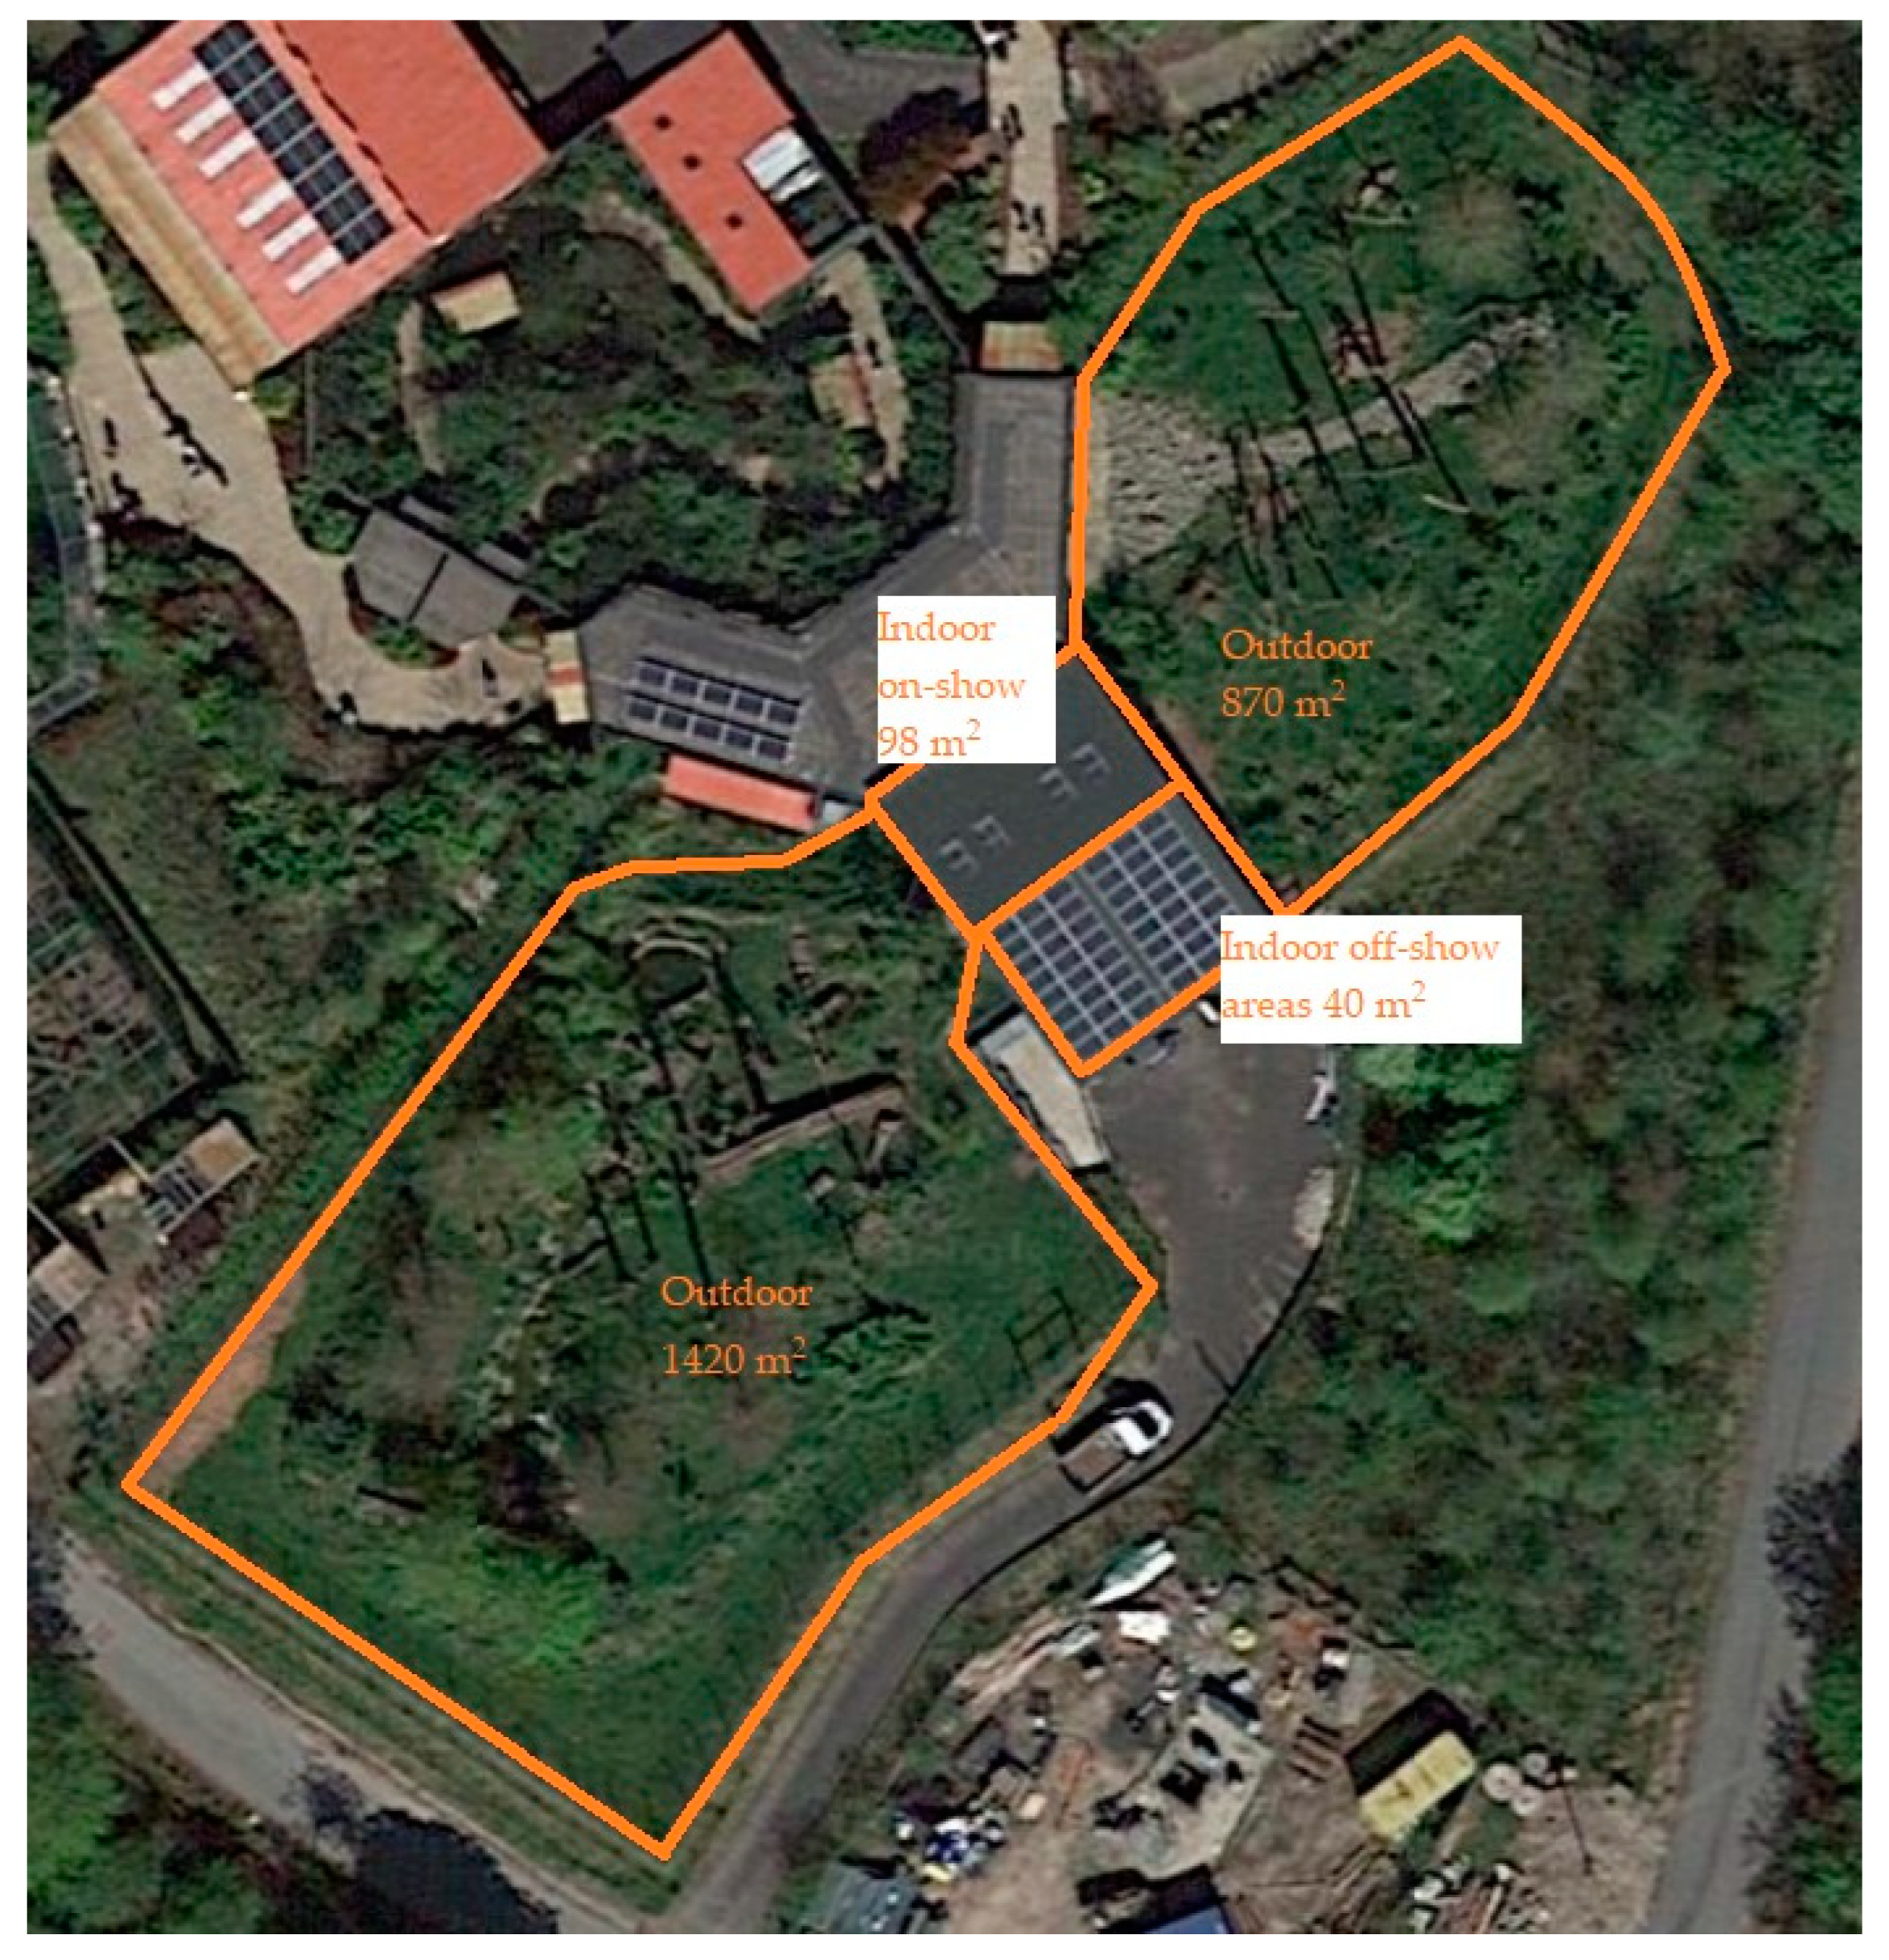
2.2.1. Sumatran Orangutan Exhibit Information
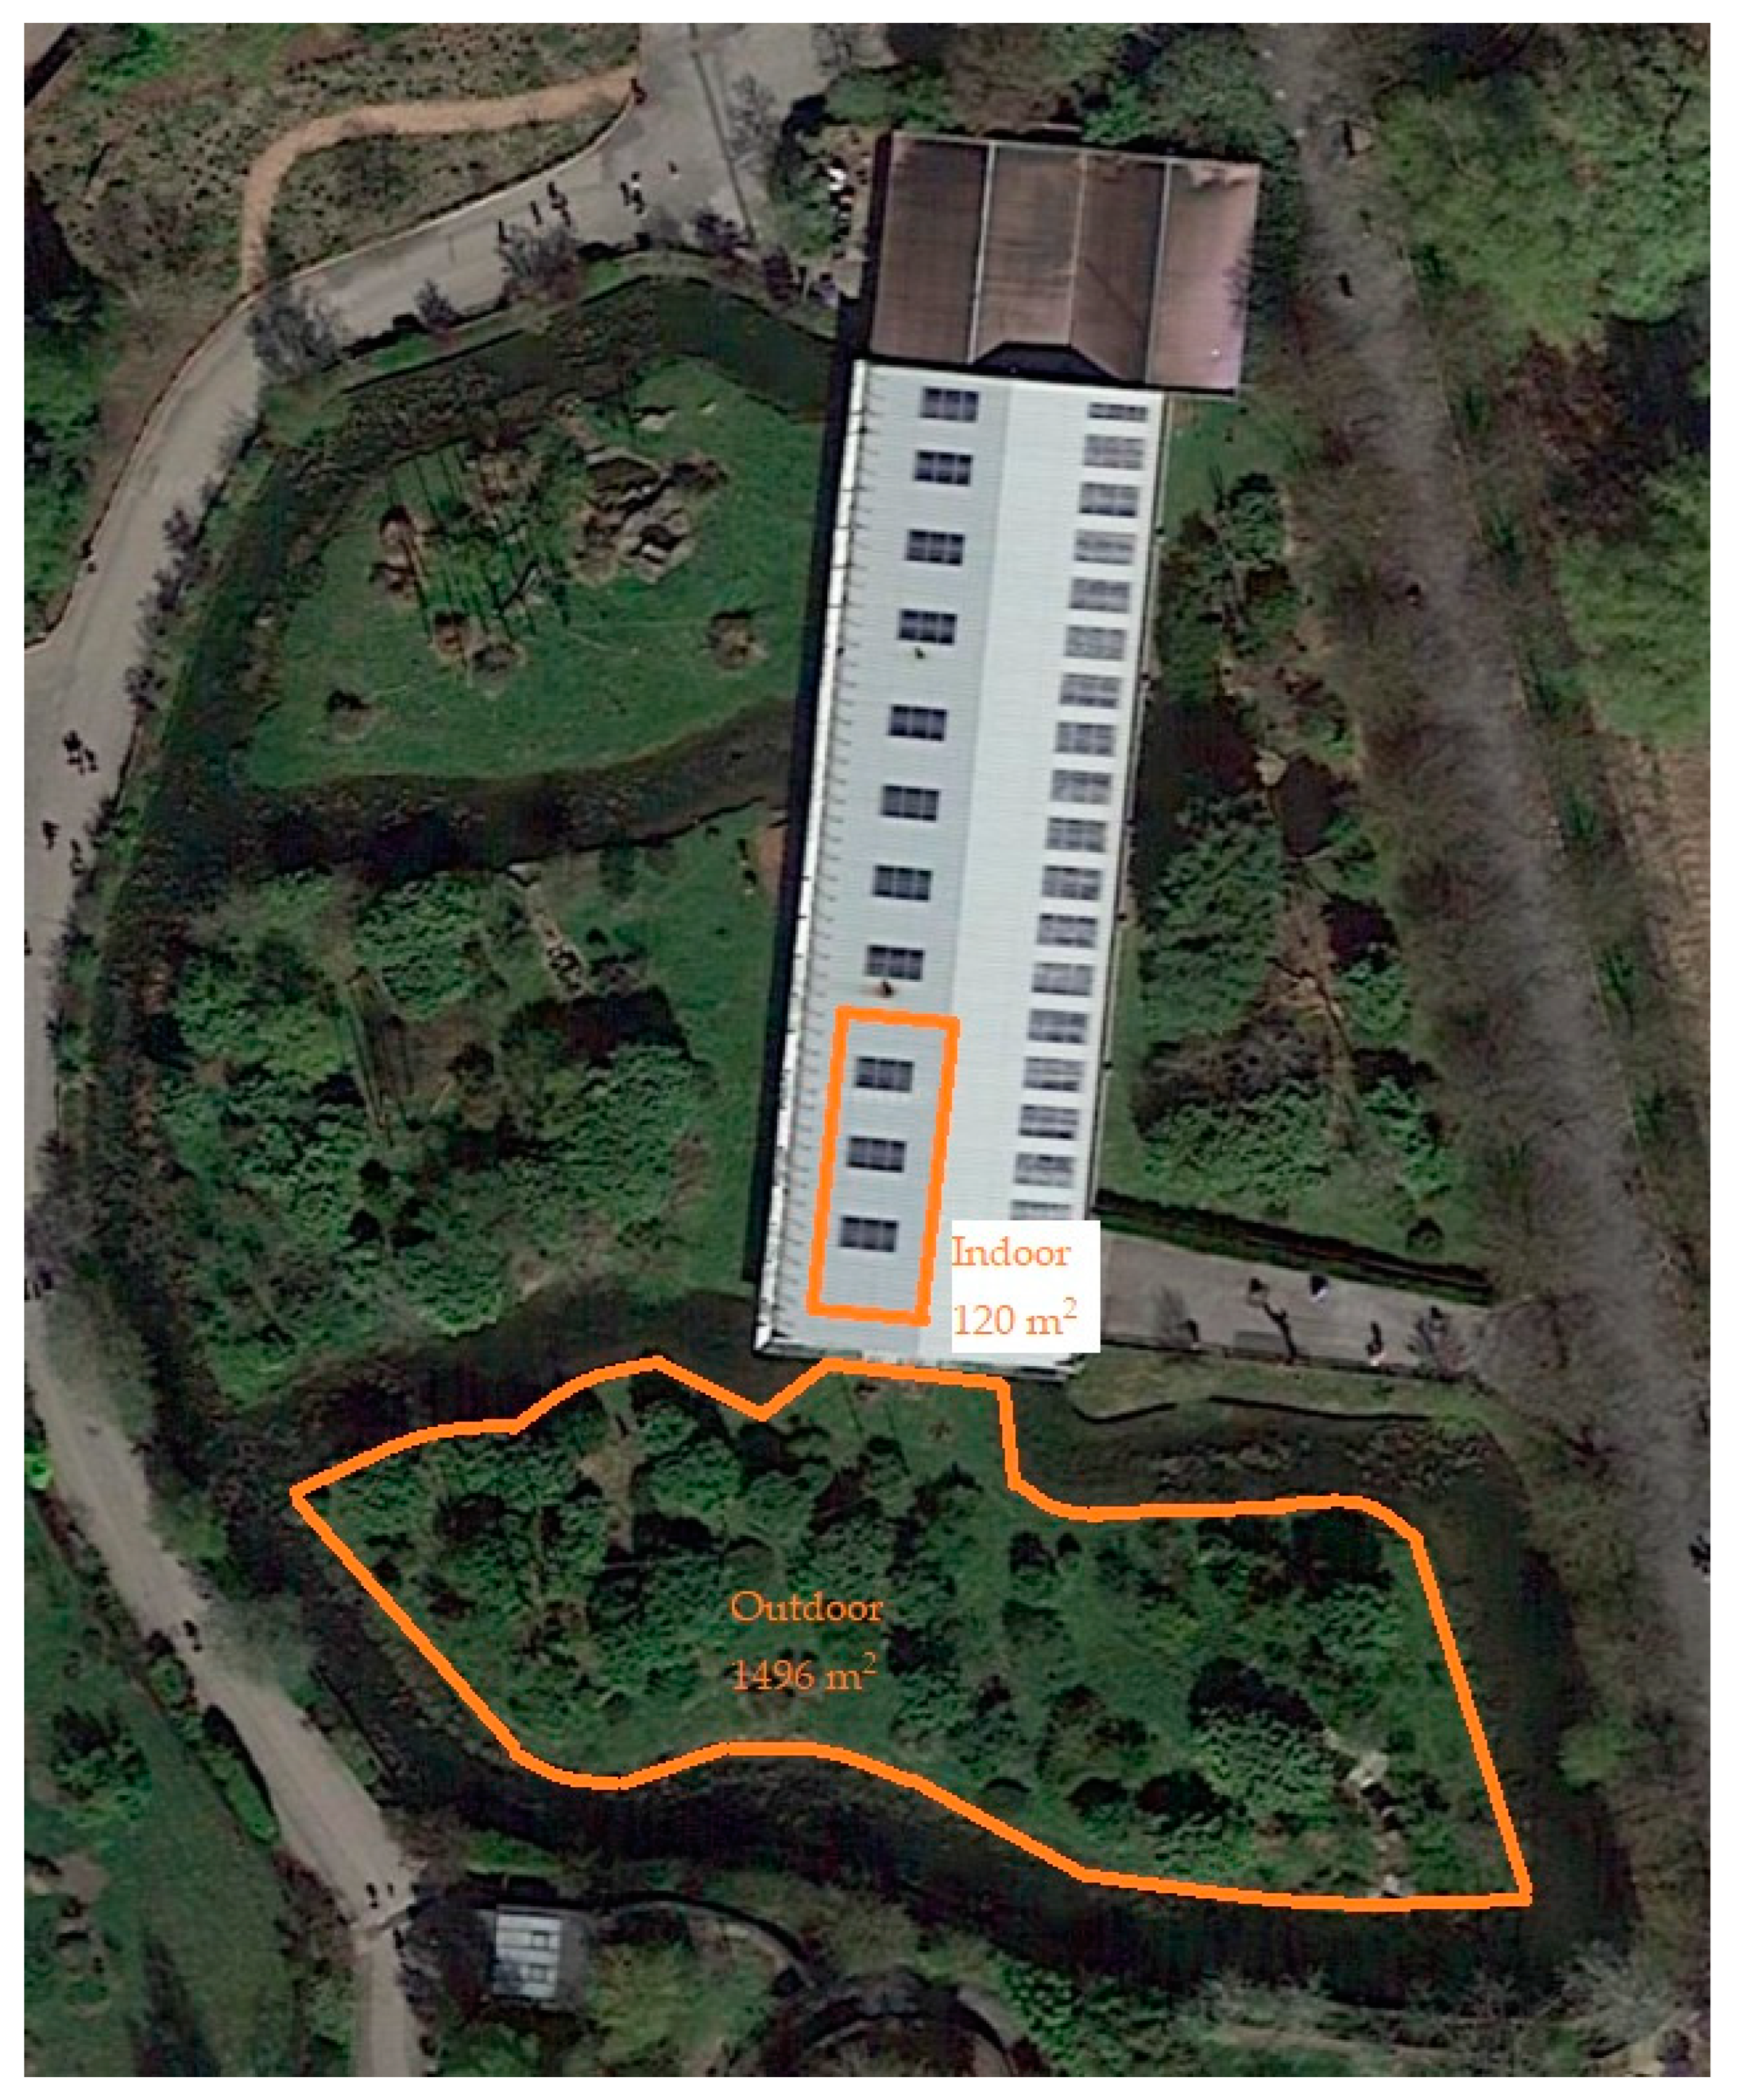
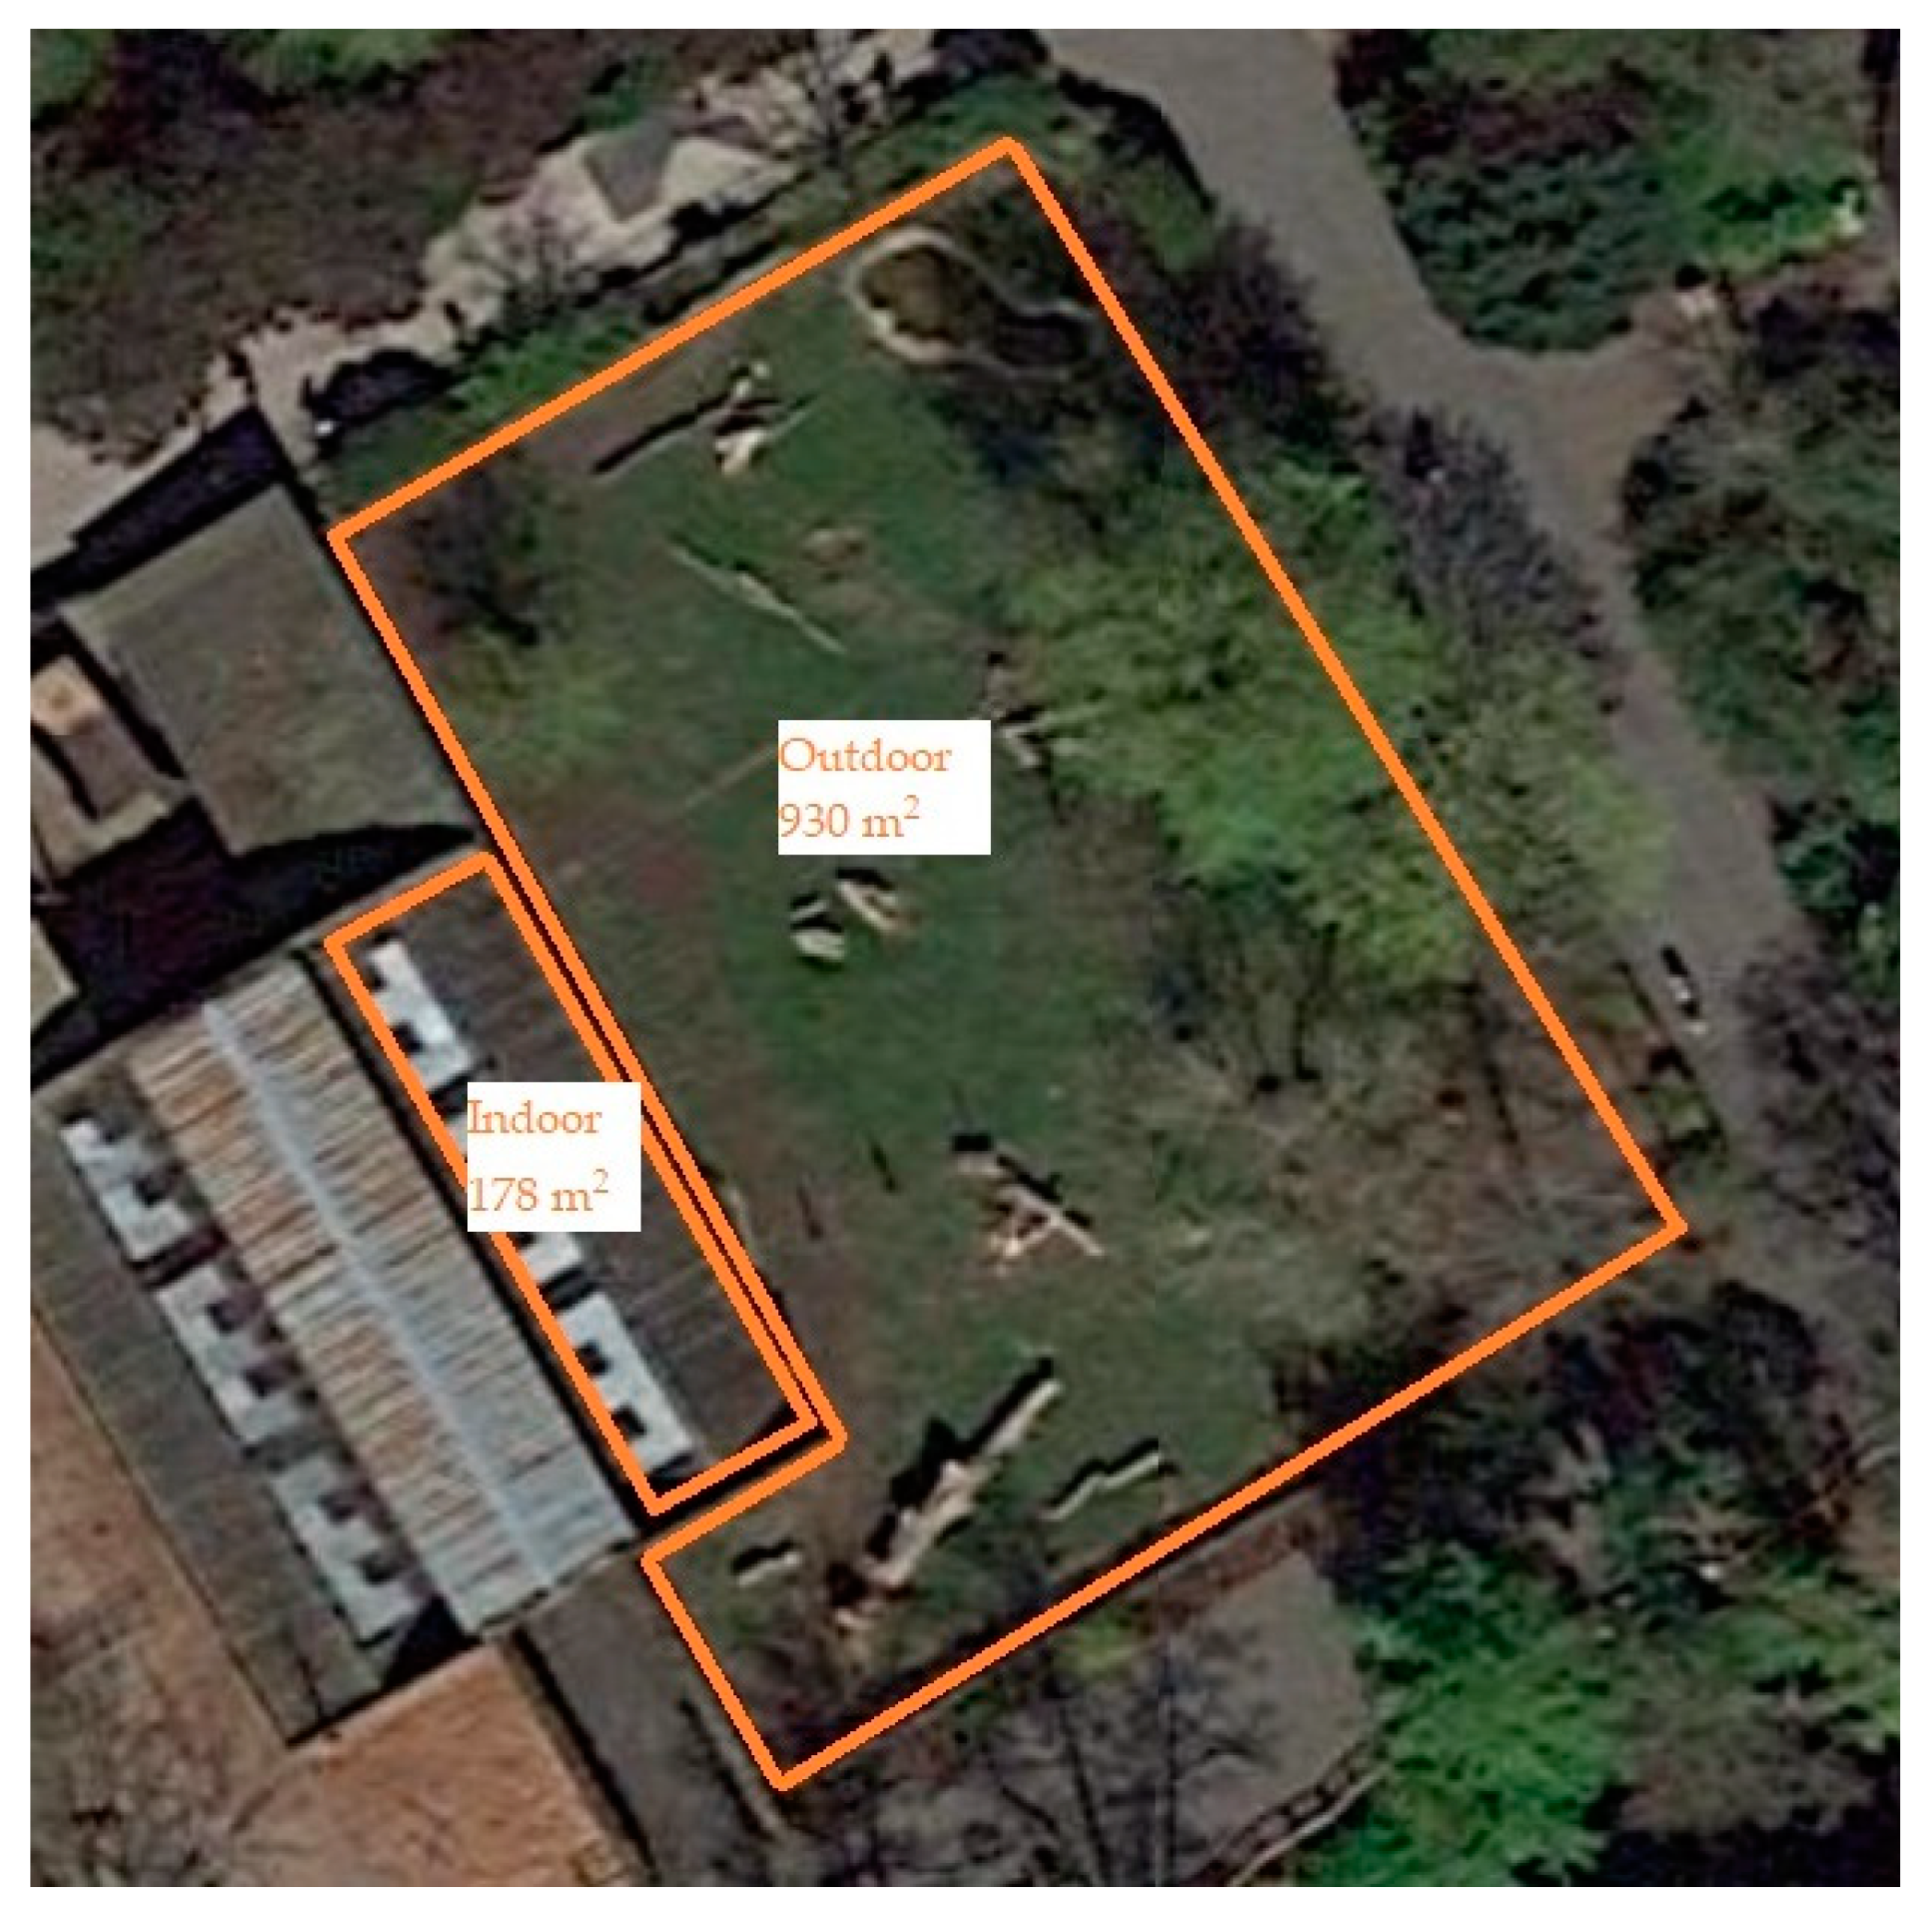
2.2.2. Crested Macaque Exhibit Information
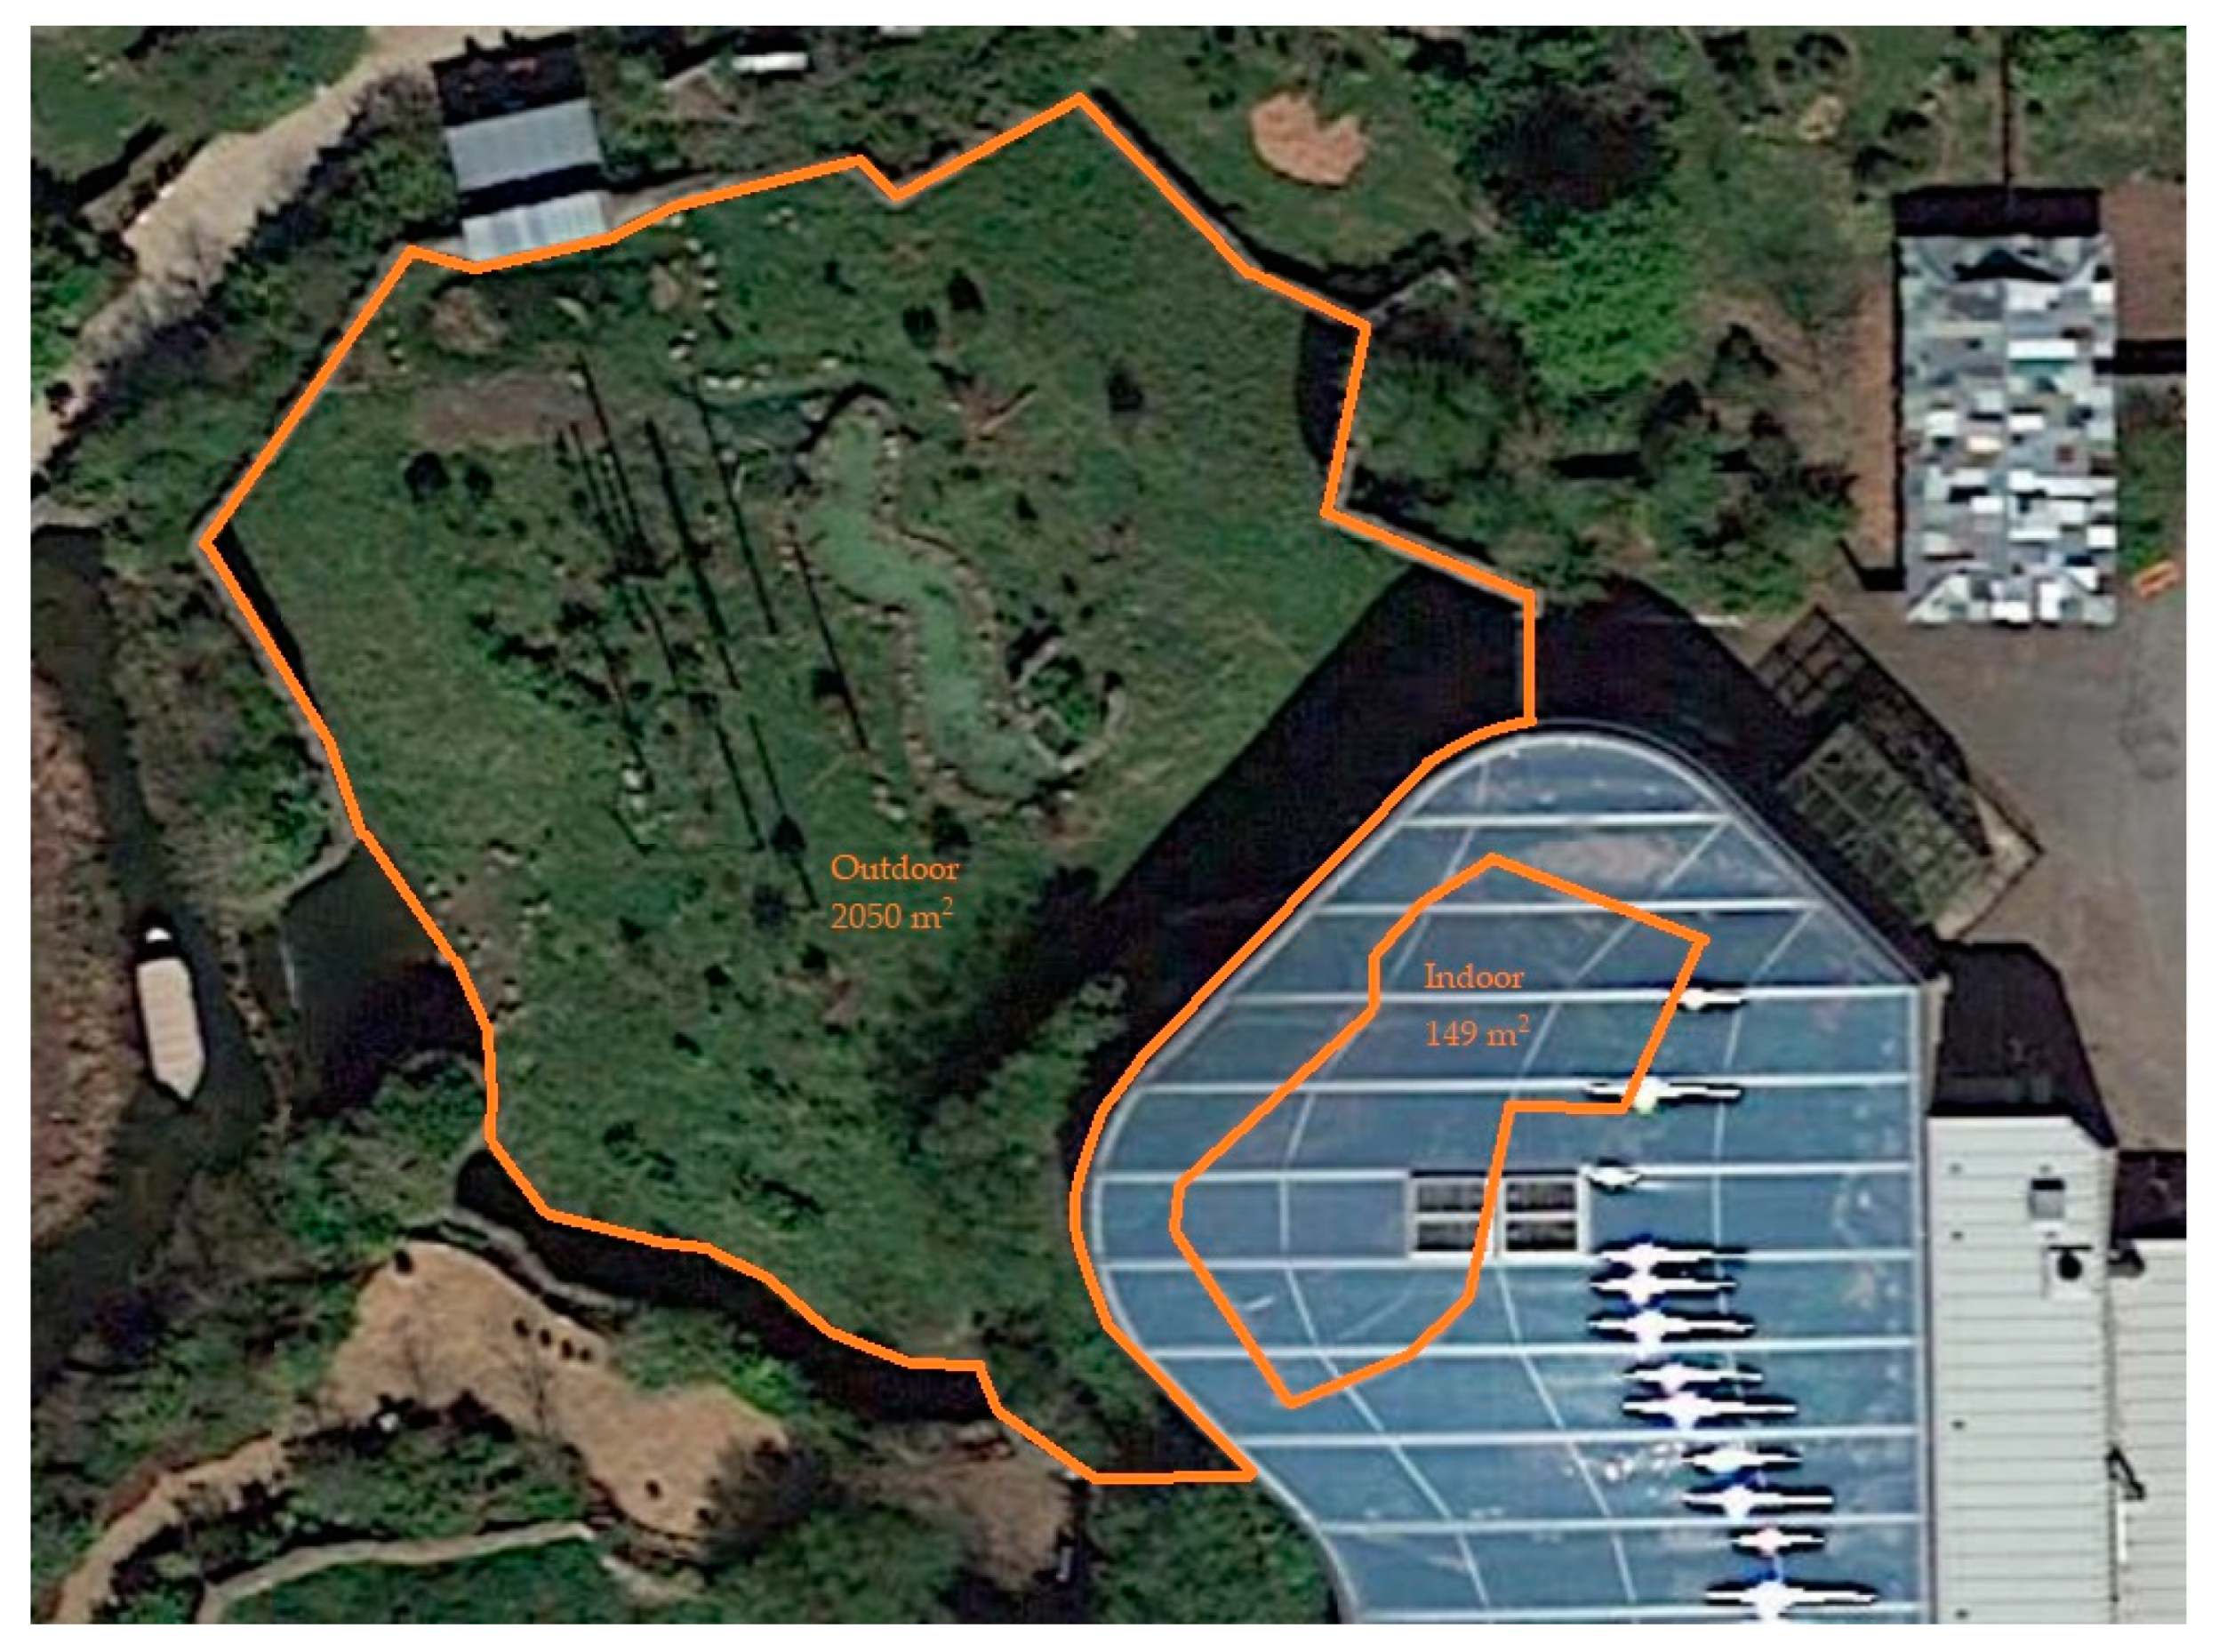
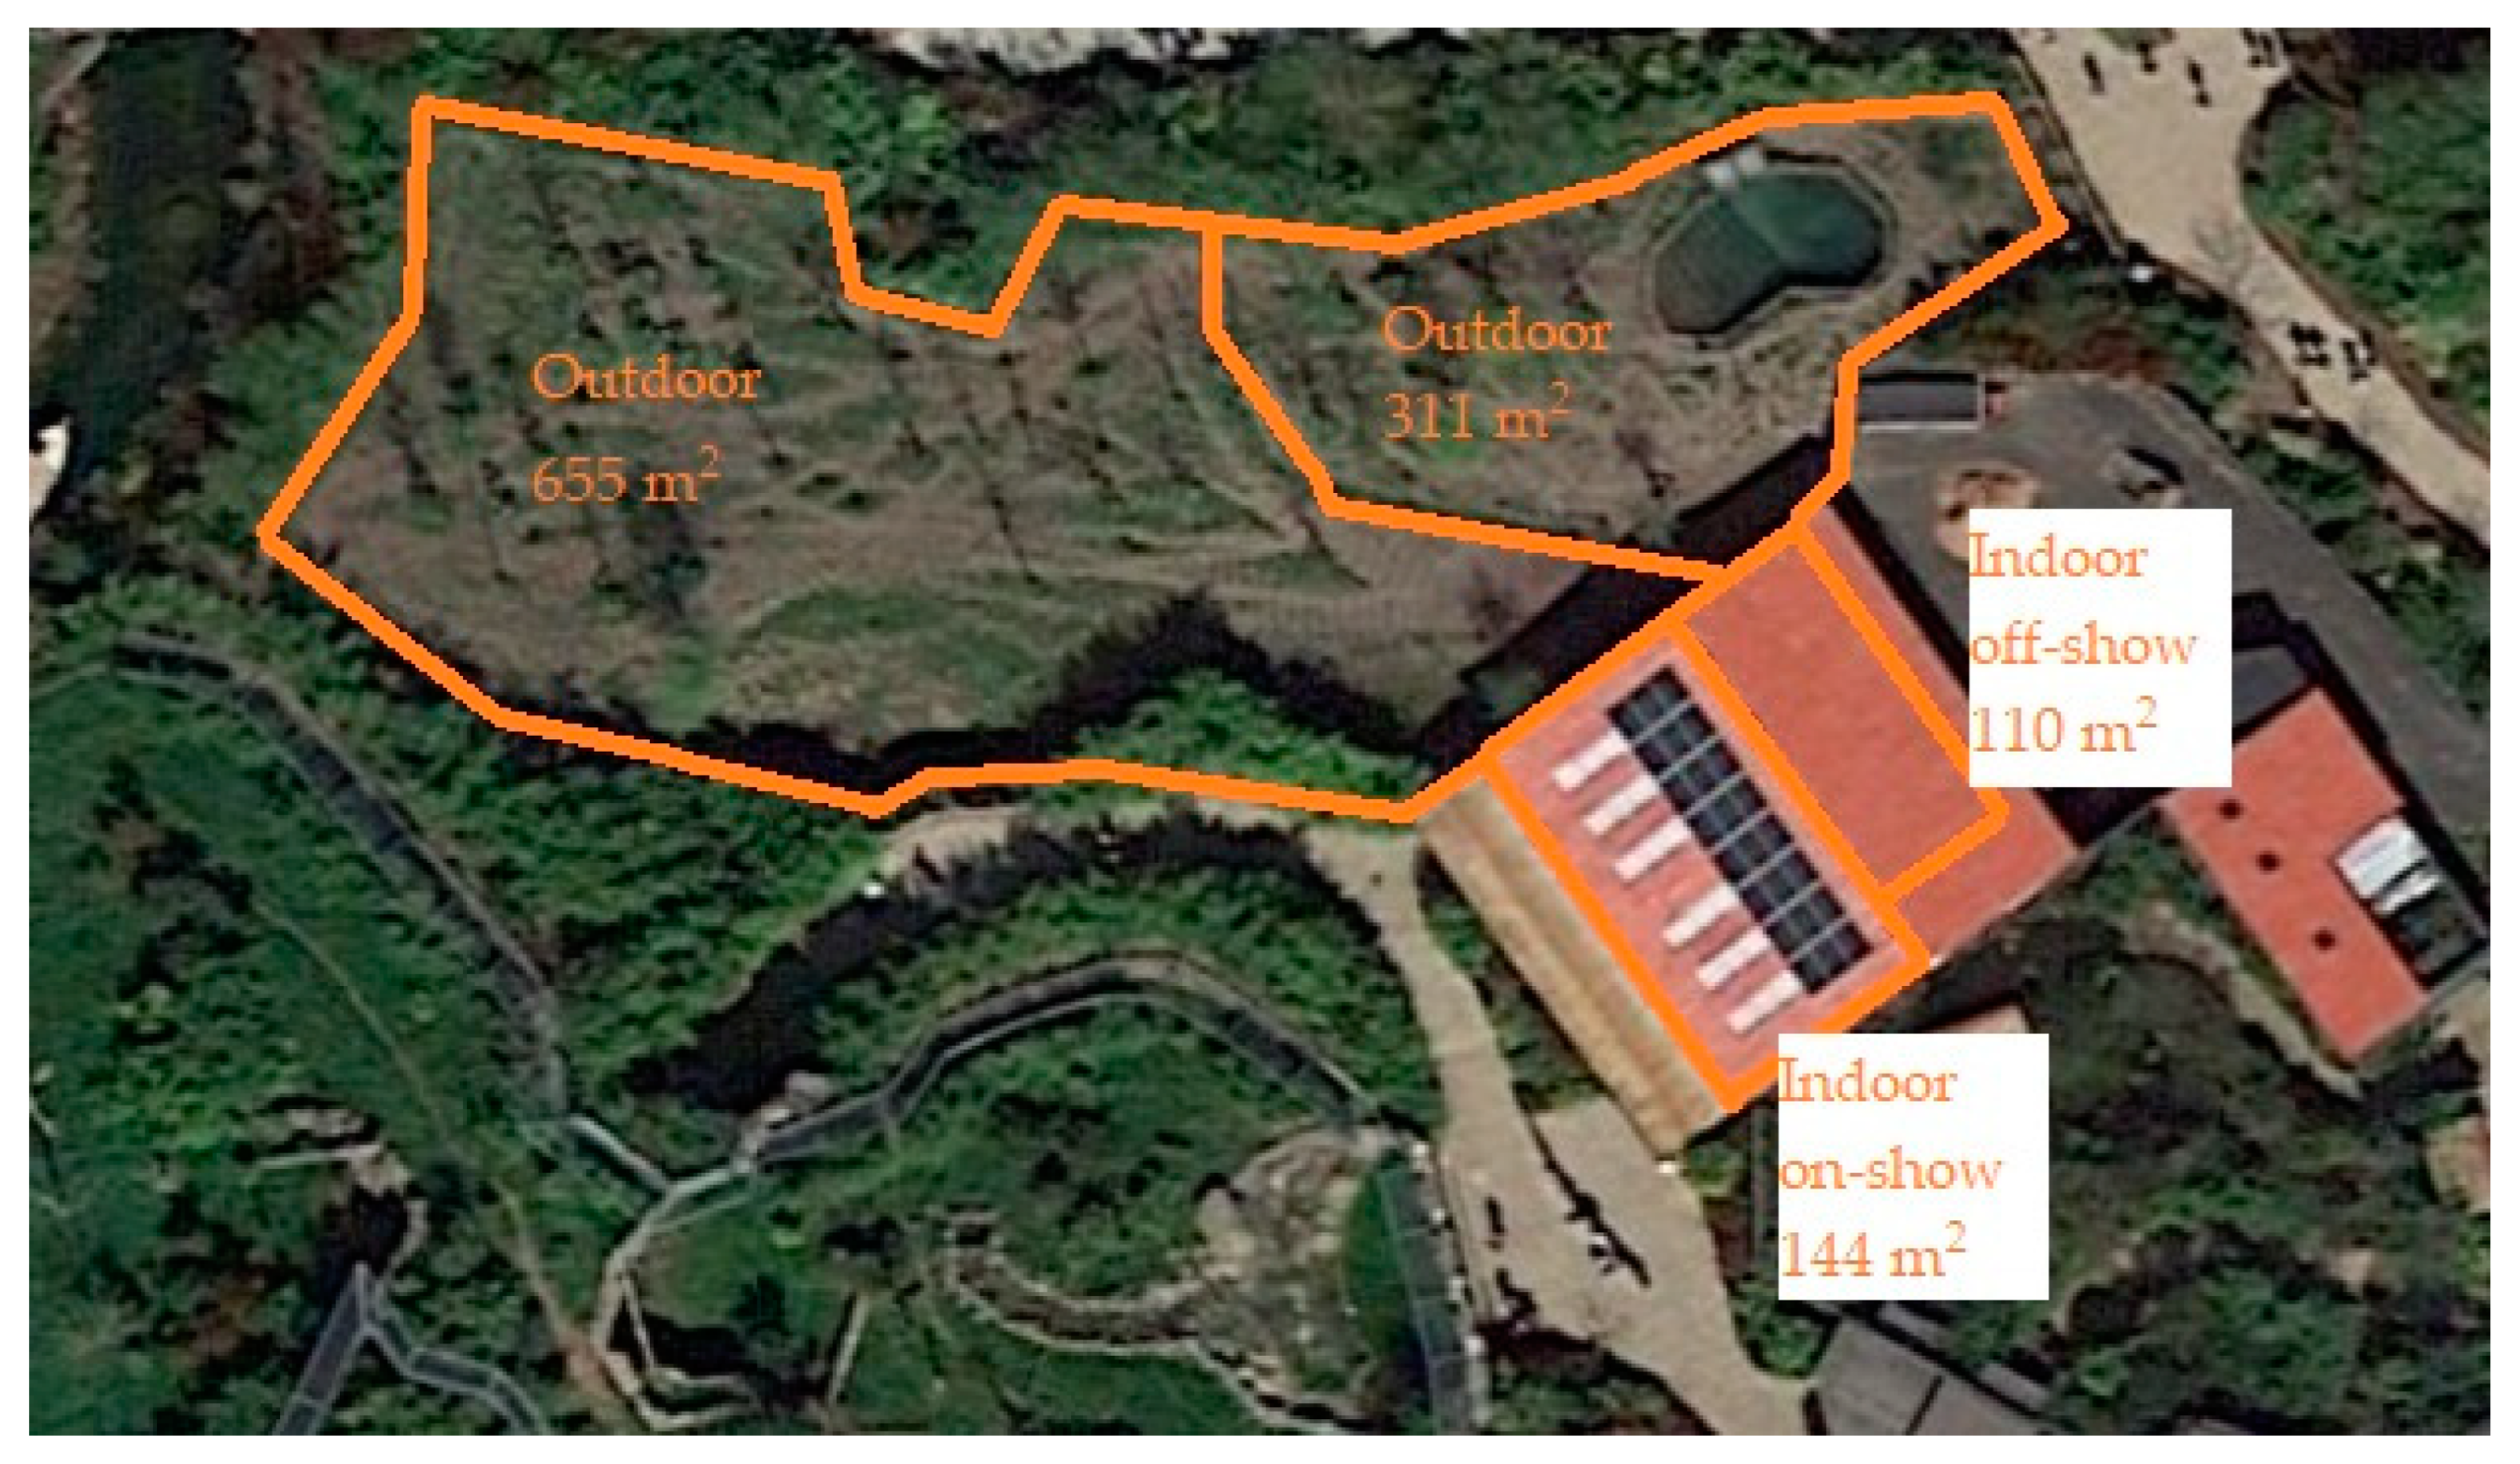
2.2.3. Malayan Sun Bear Exhibit Information
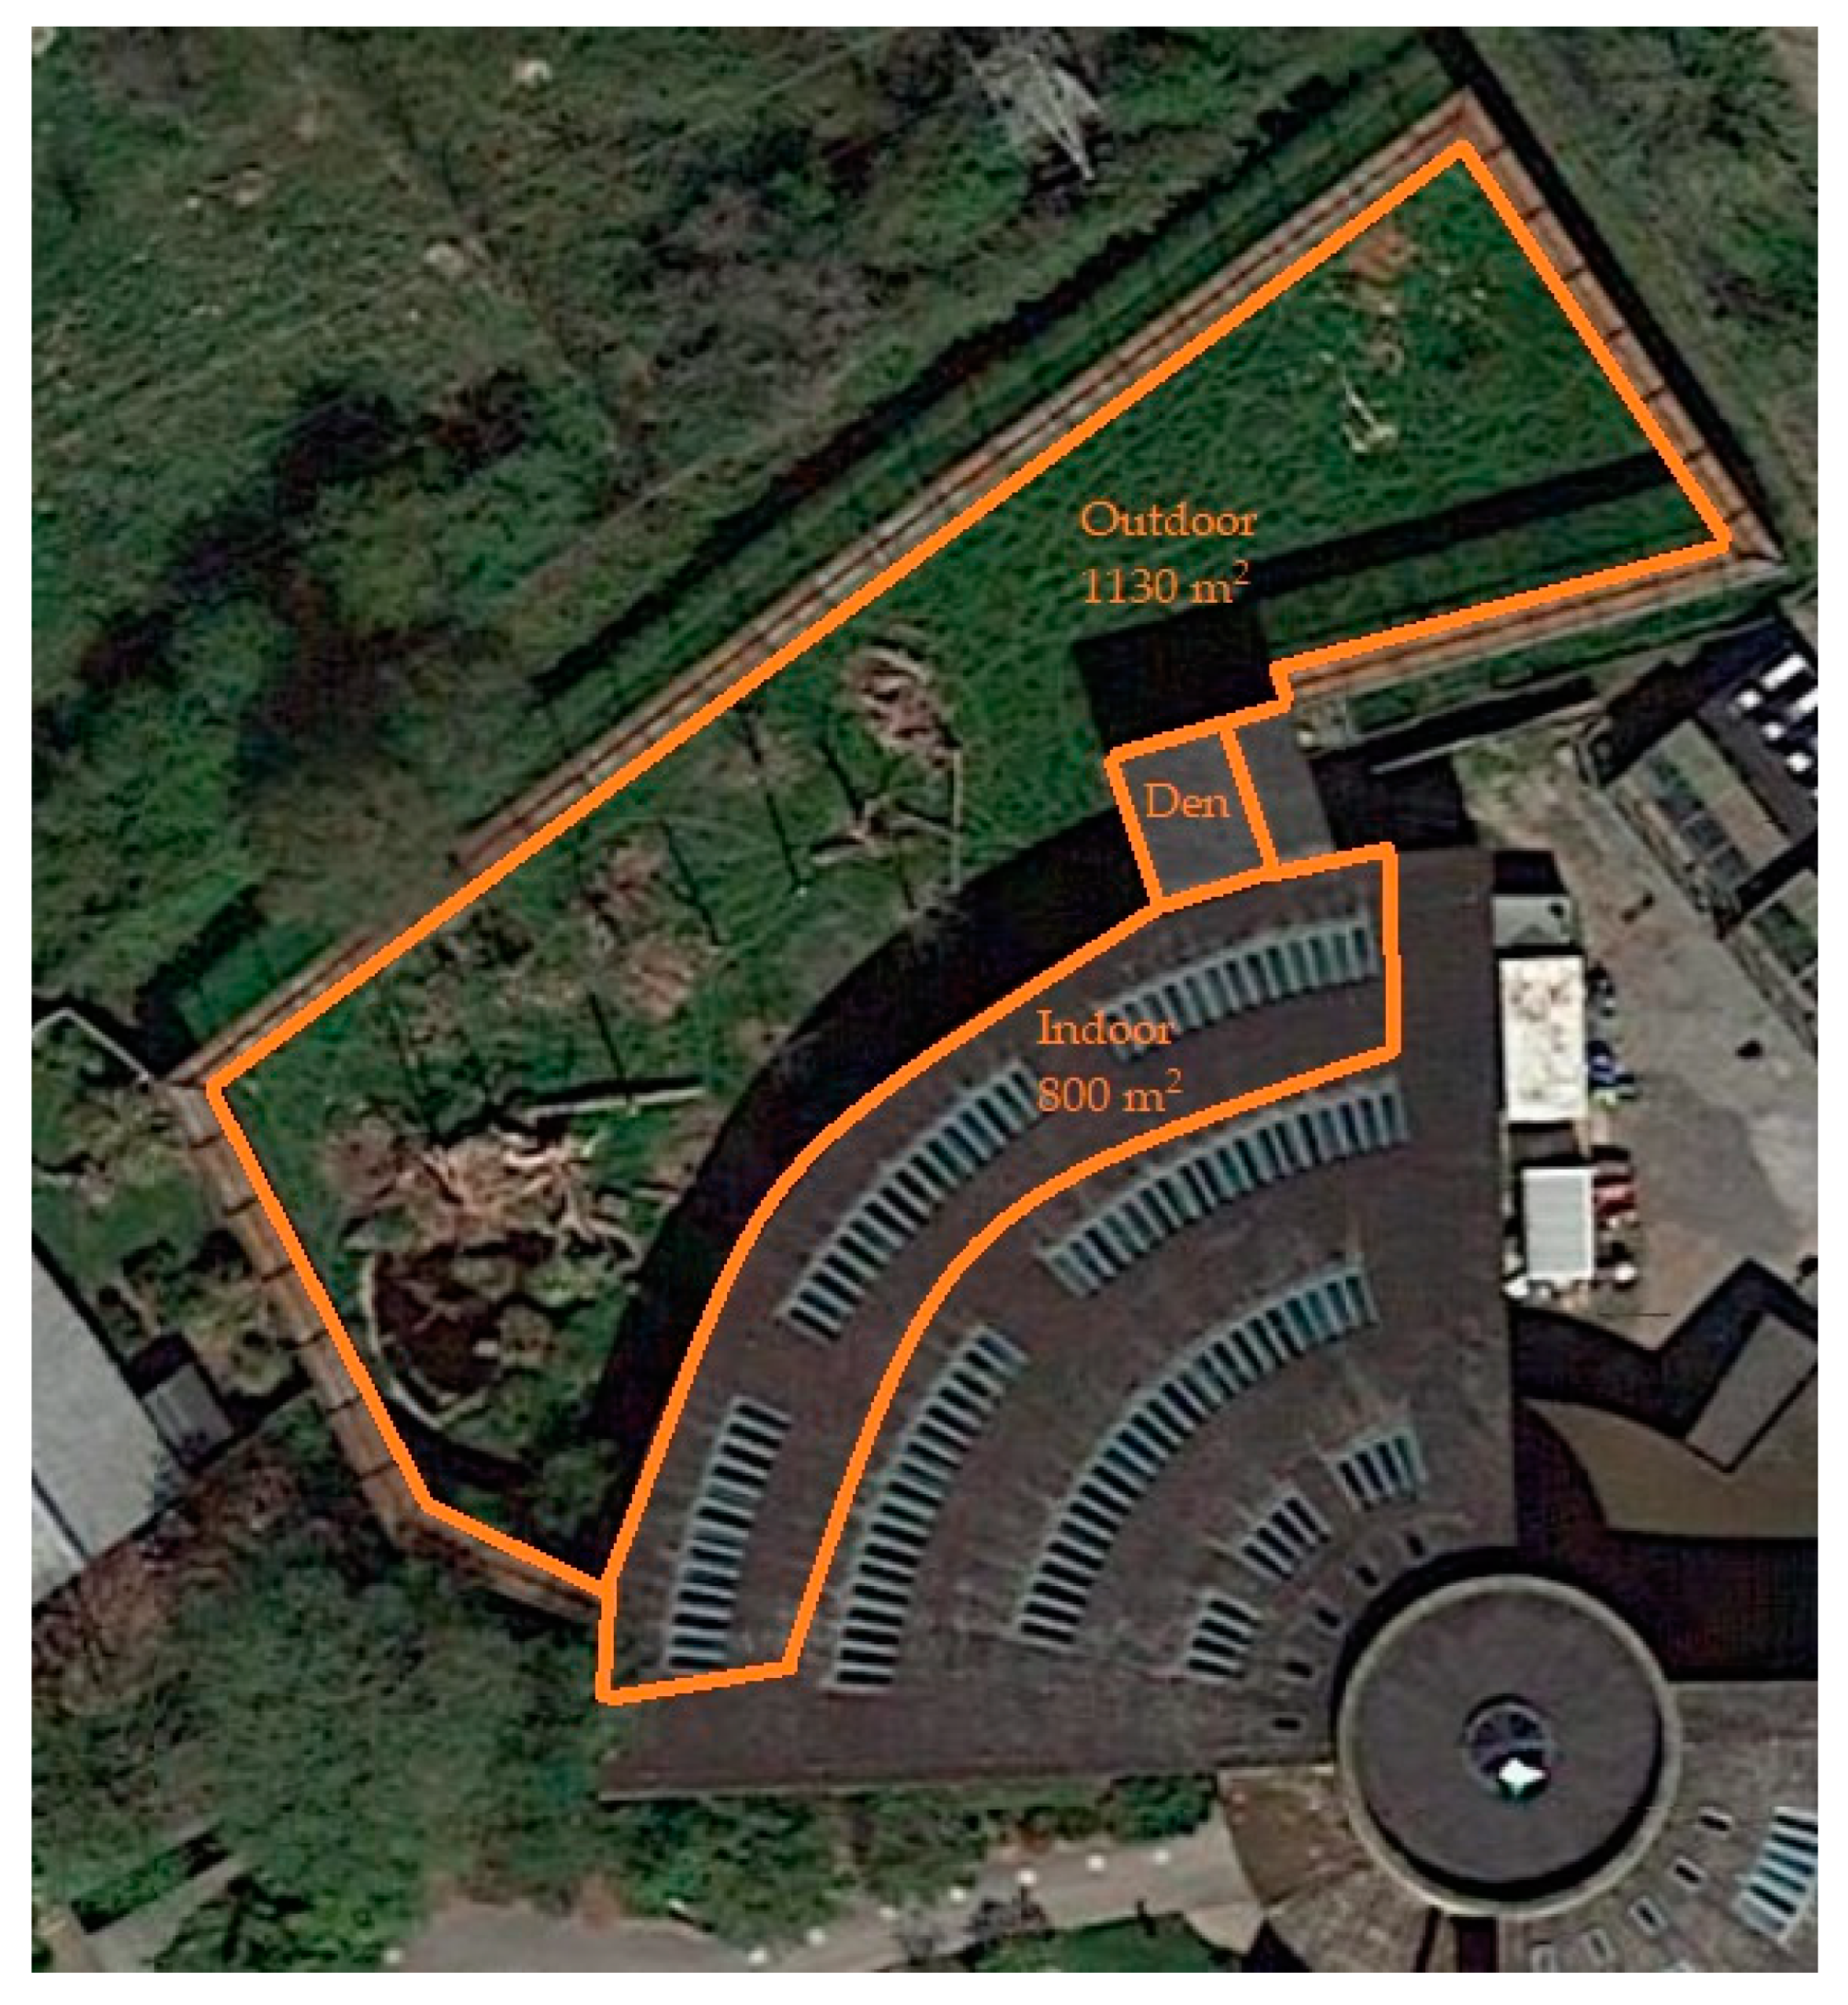
2.2.4. Malayan Tapir Exhibit Information
2.3. Data Collection and Preparation
2.4. Data Analysis
2.4.1. Activity Budget Approach (Models 1 to 4)
2.4.2. Choice and Control Approach (Models 5 to 8)
2.4.3. Model Control Variables
2.4.4. Model Assumptions and Additional Information
3. Results
3.1. Effect of the Enclosure Move on the Activity Budgets (Activity Budget Approach)
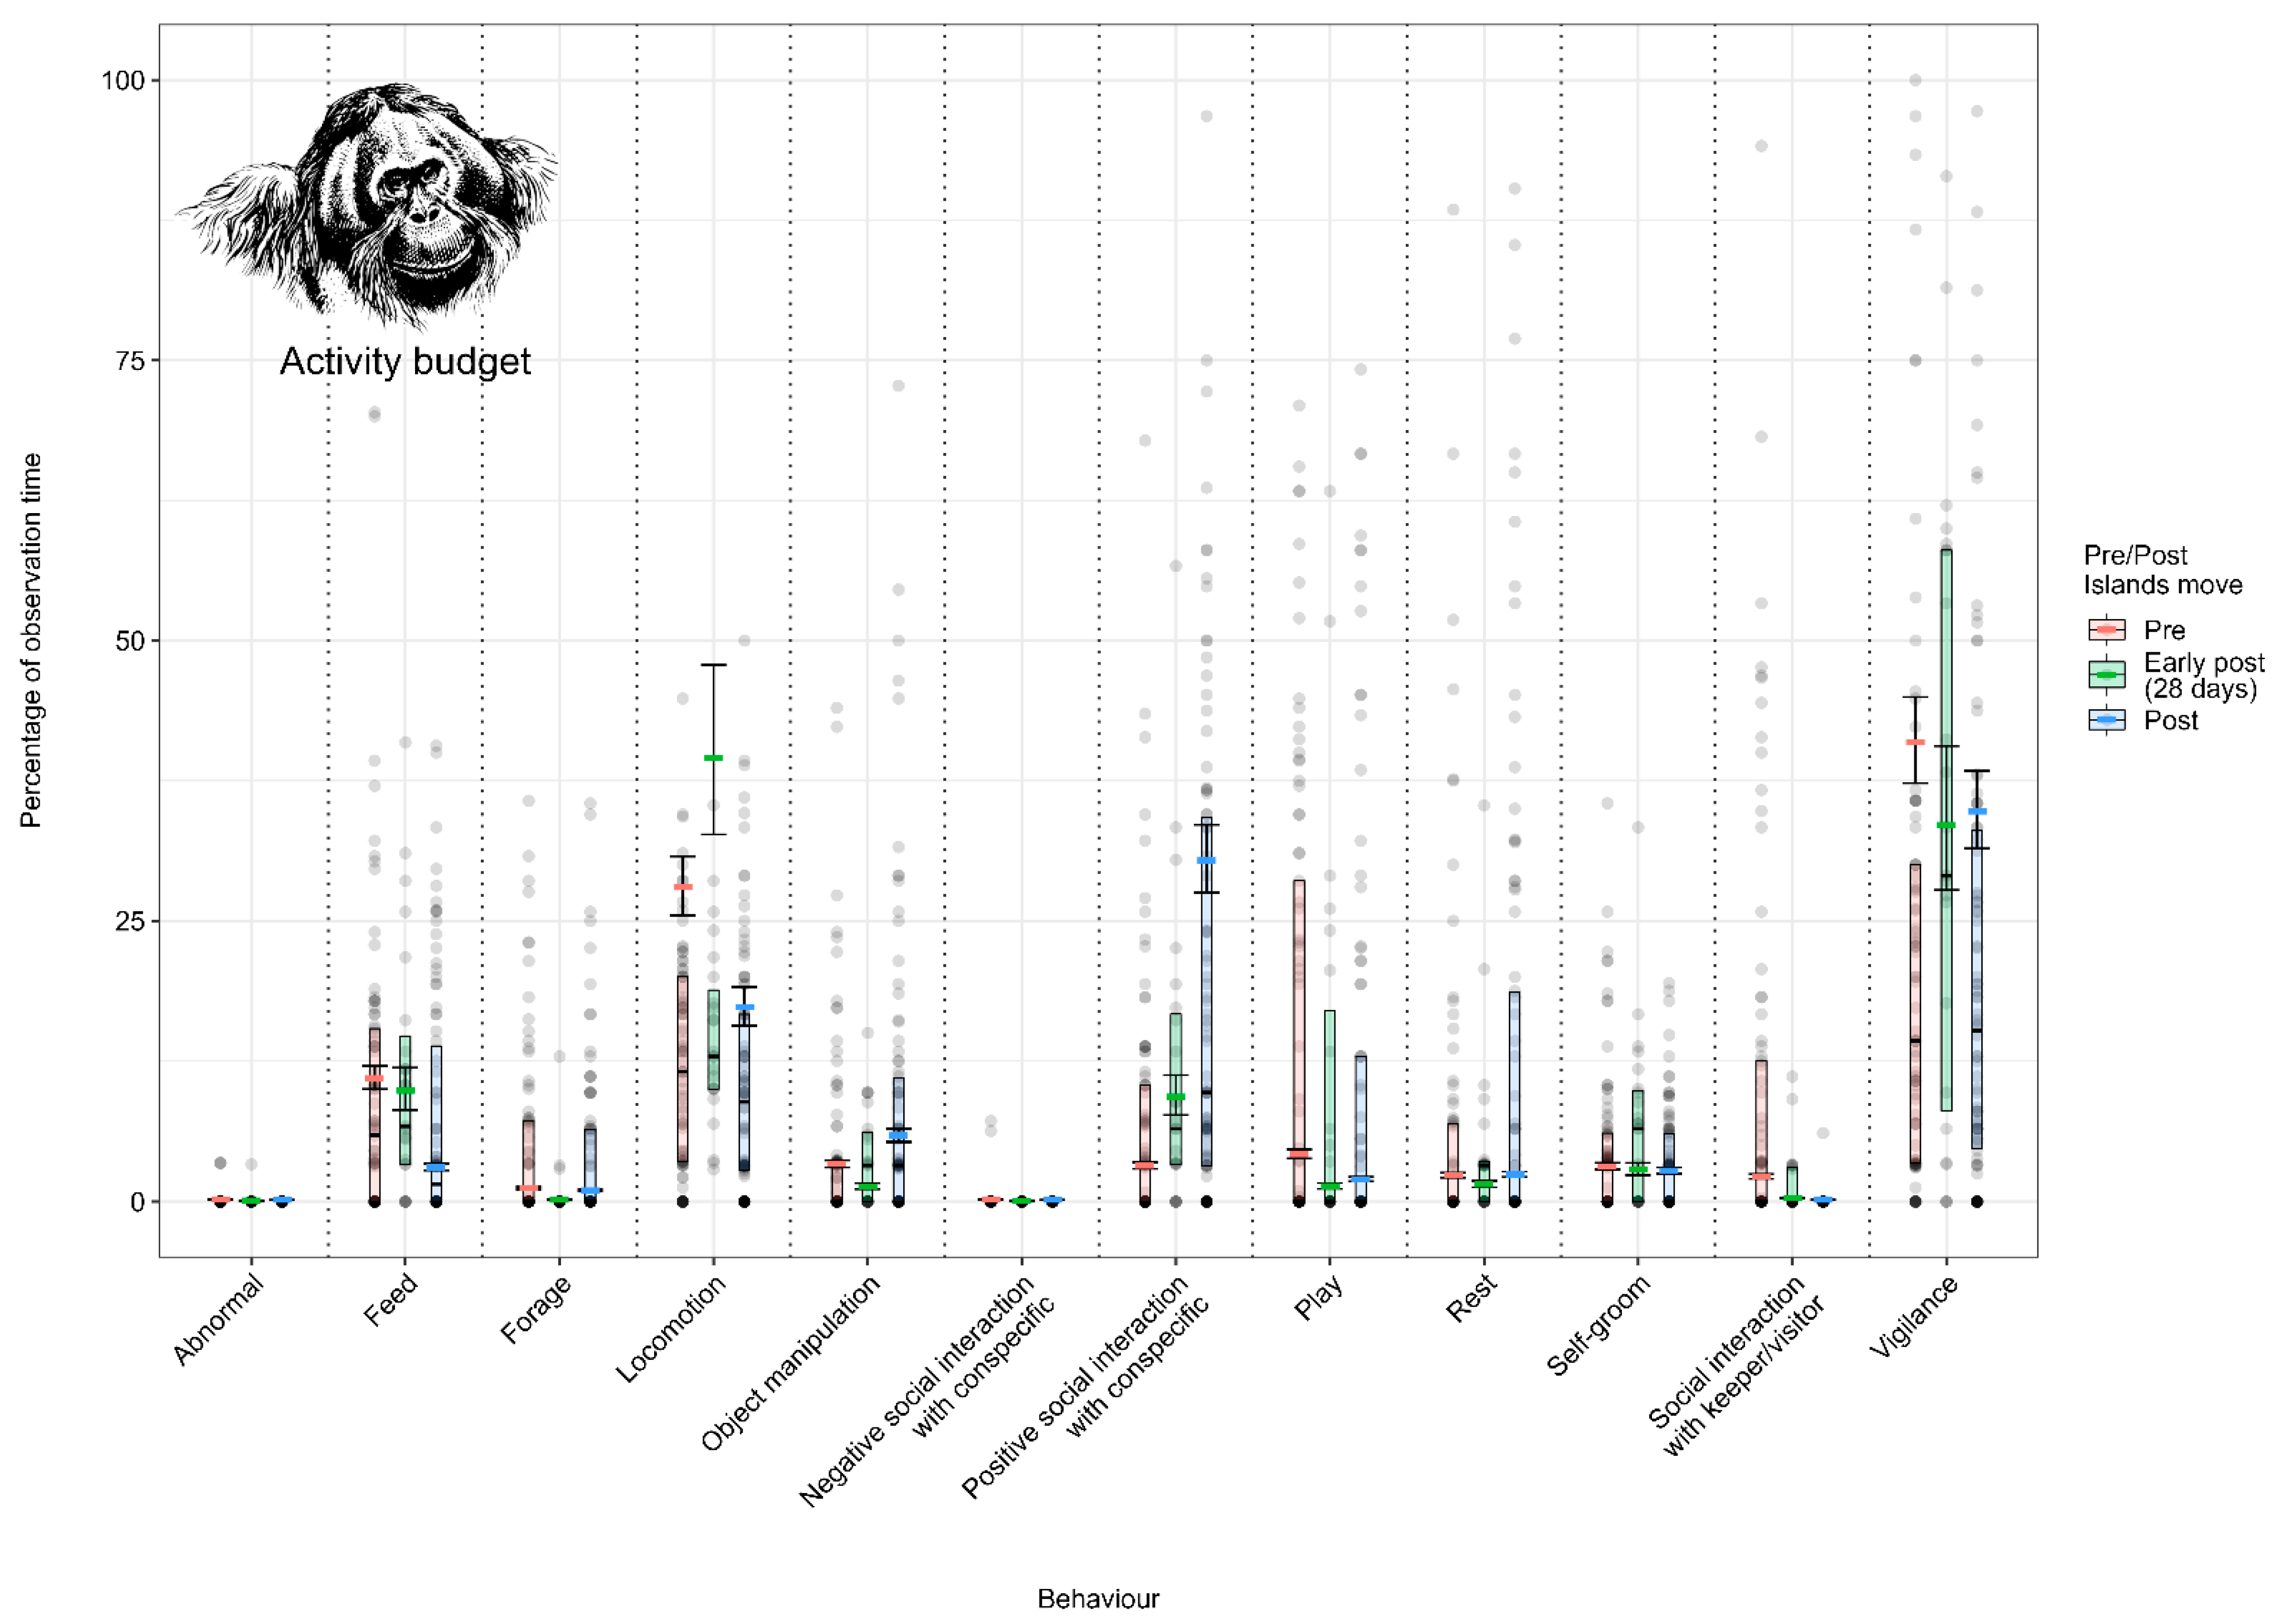
3.1.1. Model 1: Effect of the Enclosure Move on the Sumatran Orangutan Activity Budget
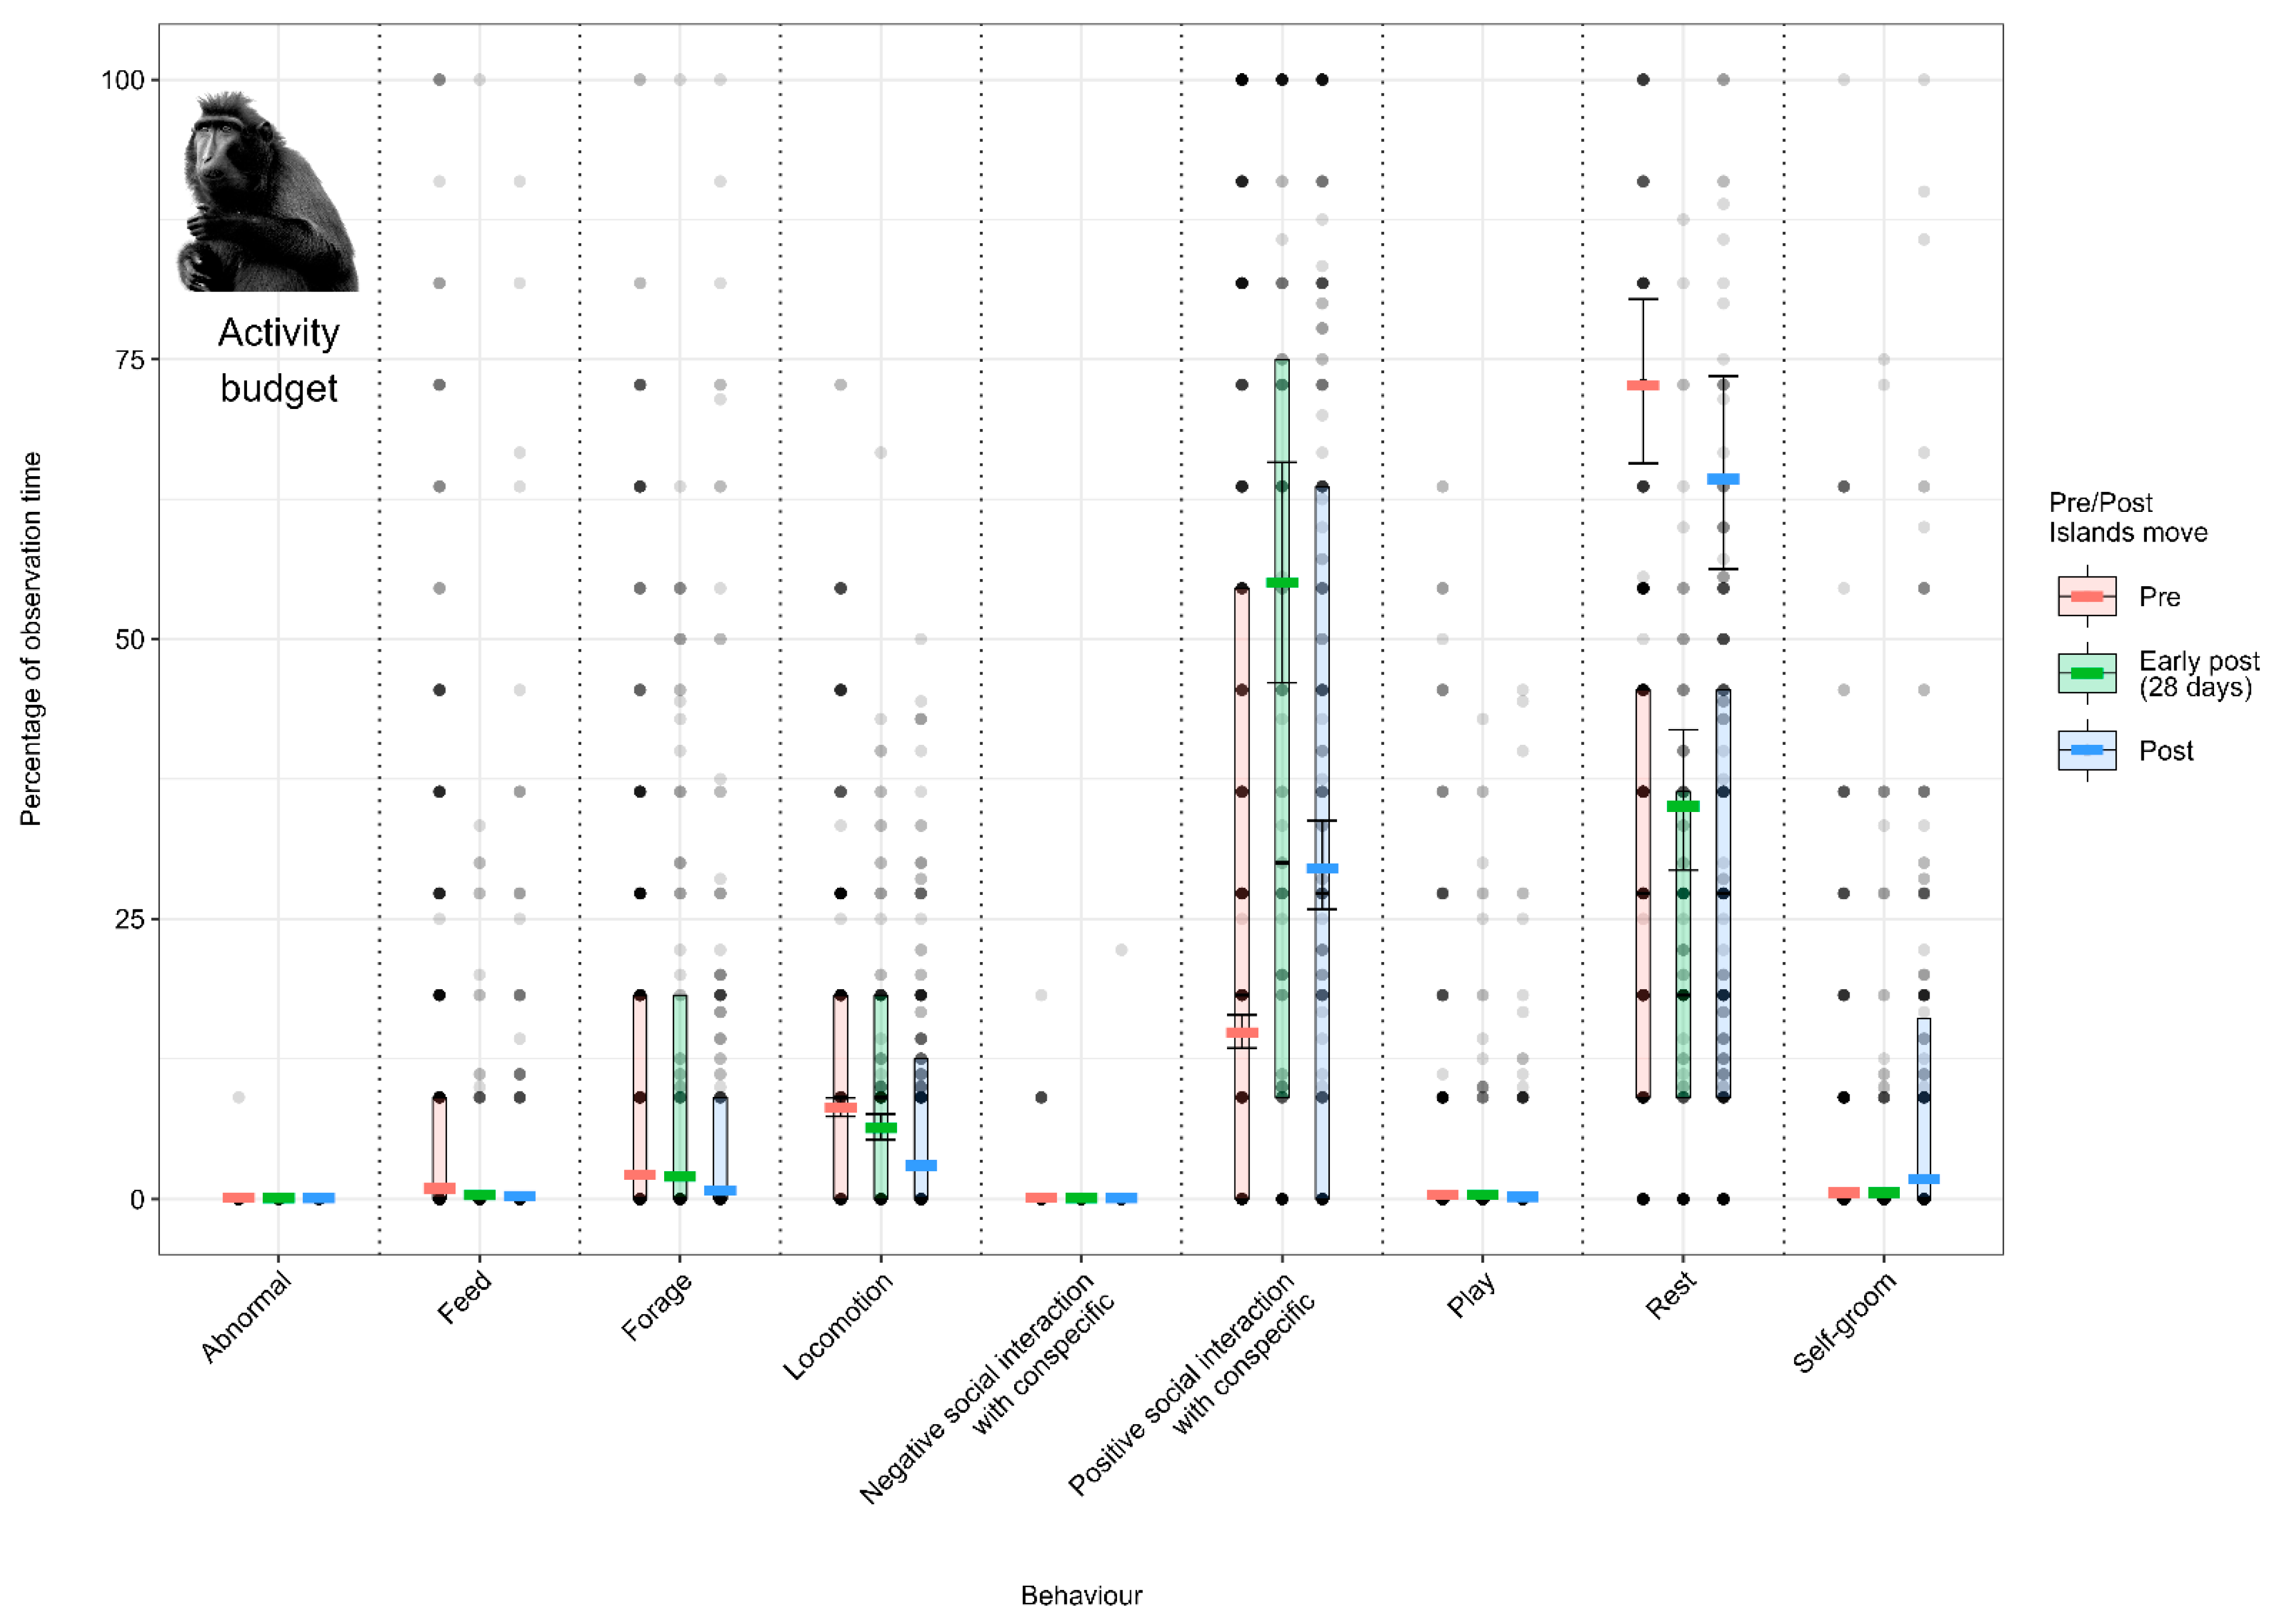
3.1.2. Model 2: Effect of the Enclosure Move on the Crested Macaque Activity Budget
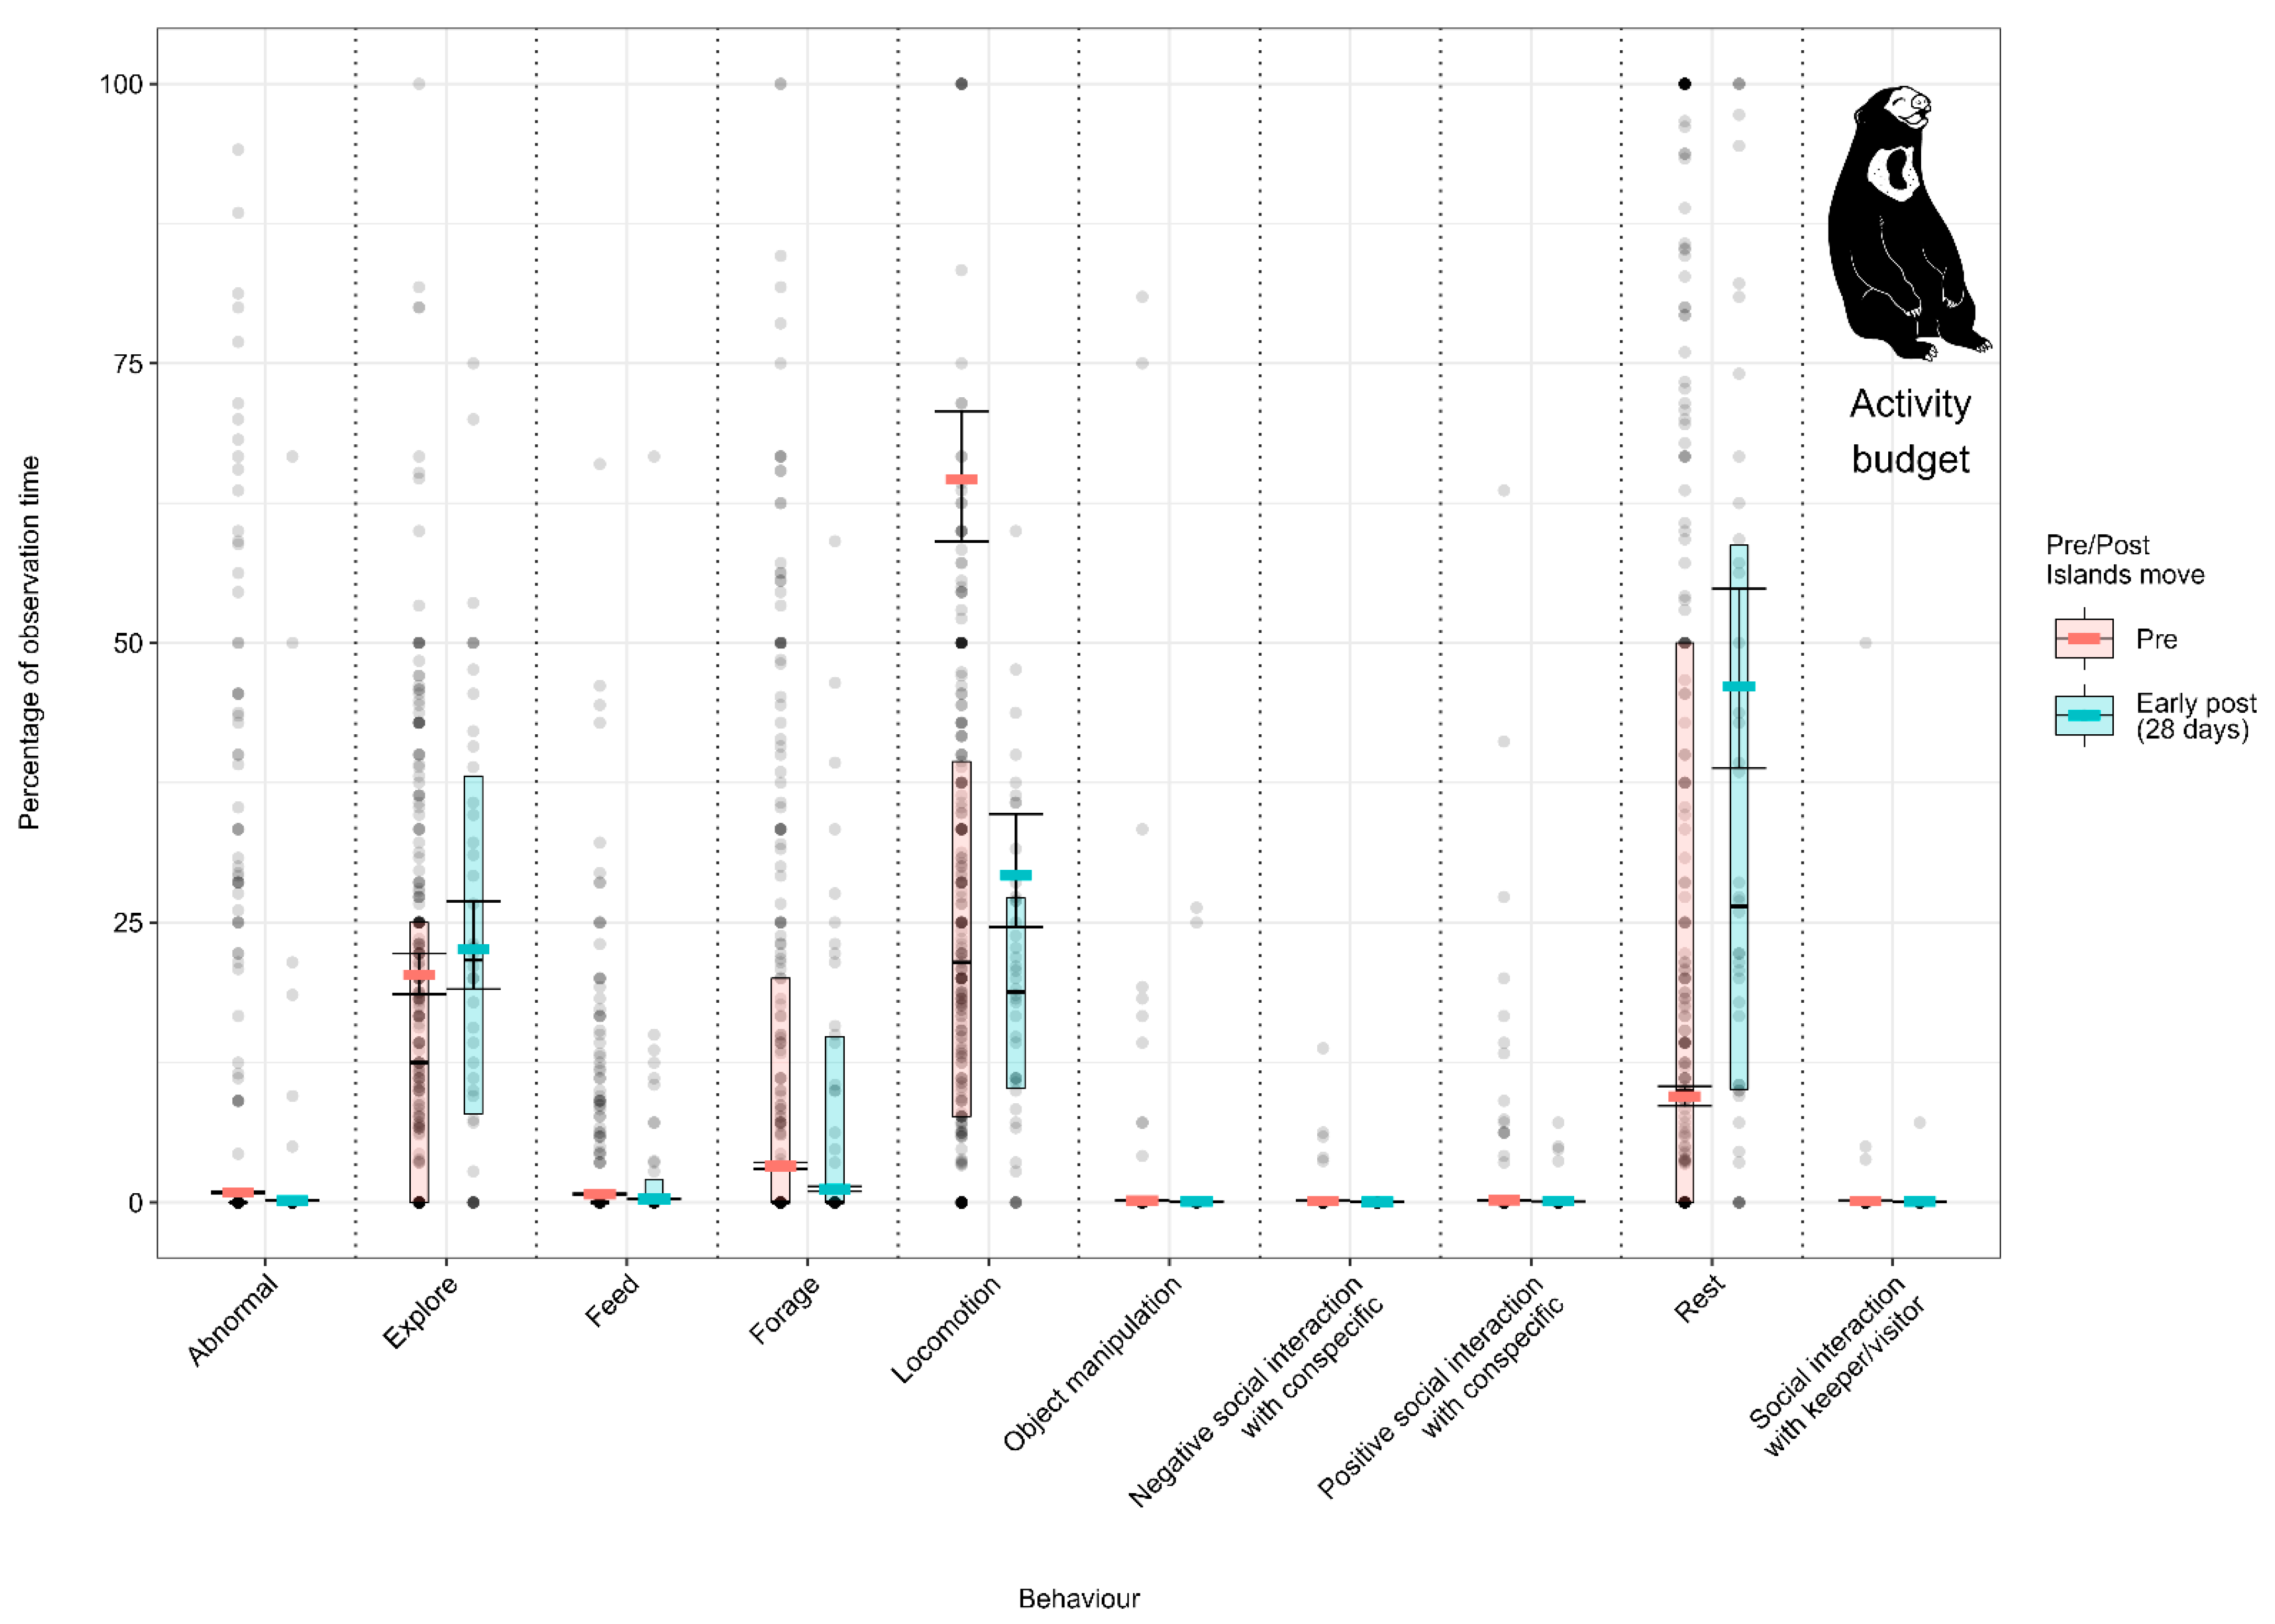
3.1.3. Model 3: Effect of the Enclosure Move on the Malayan Sun Bear Activity Budget
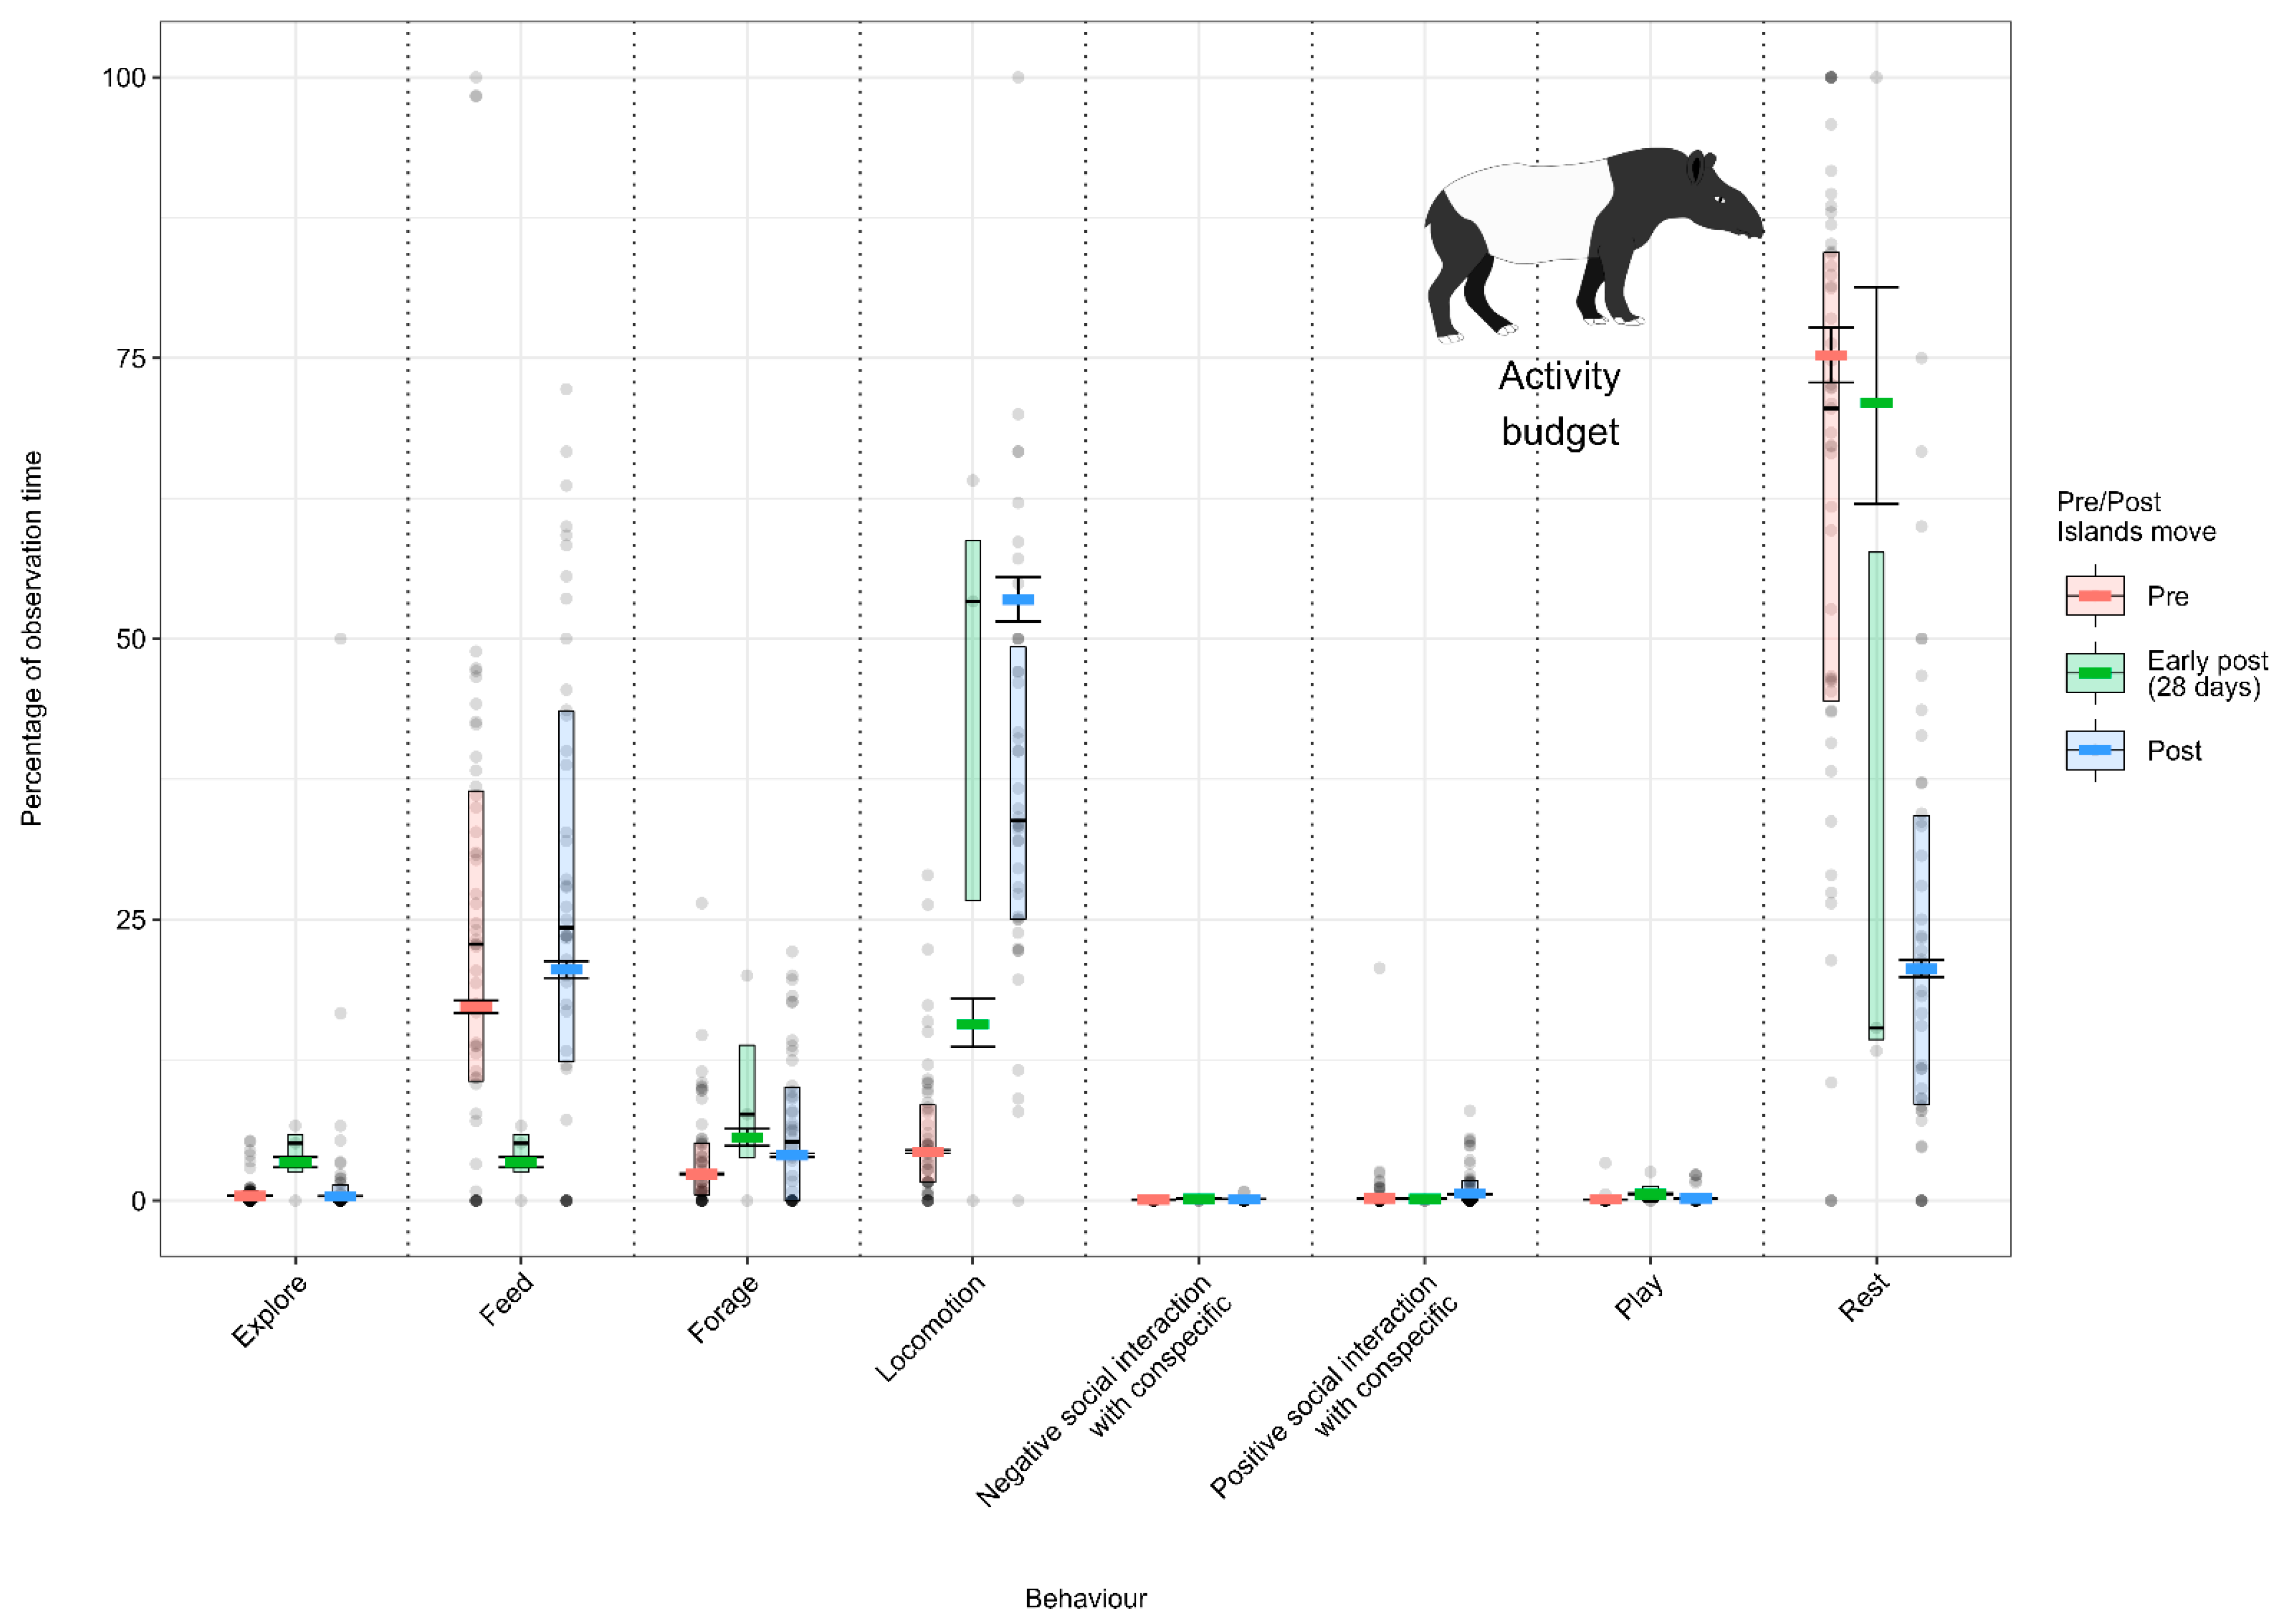
3.1.4. Model 4: Effect of the Enclosure Move on the Malayan Tapir Activity Budget
3.2. Effect of the Enclosure Move on the Visibility (Choice and Control Approach)
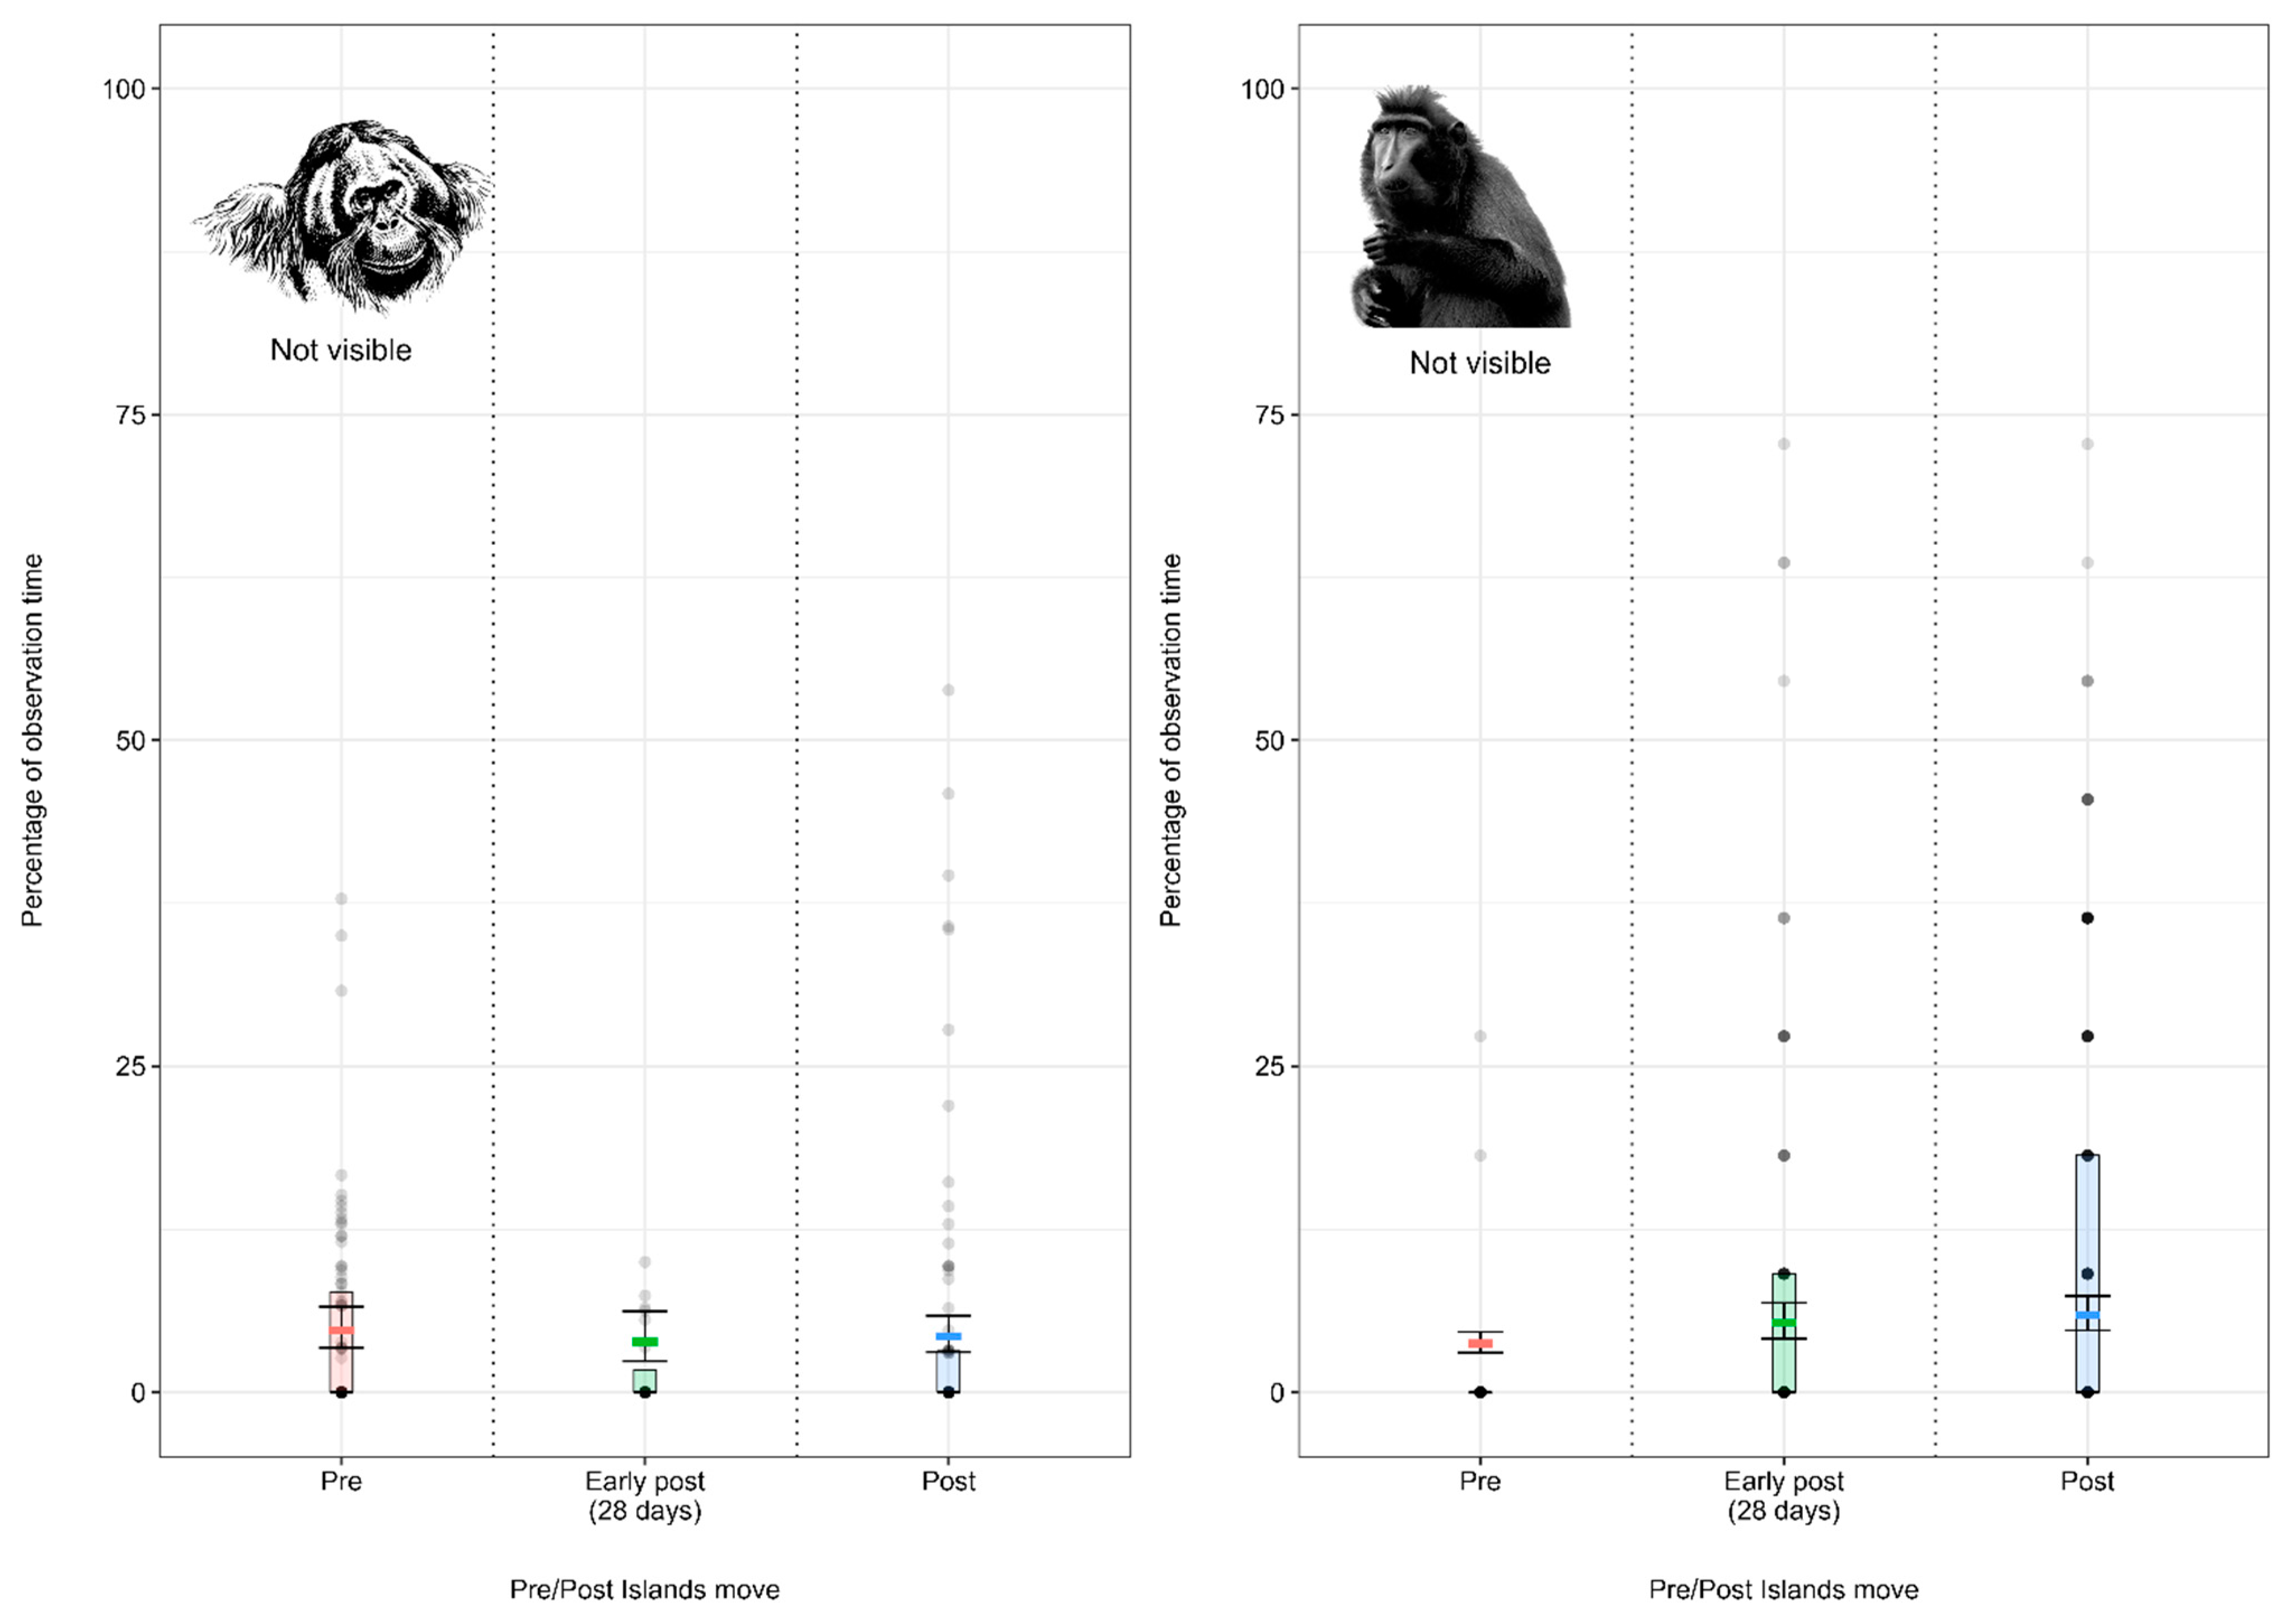
3.2.1. Model 5: Effect of the Enclosure Move on the Sumatran Orangutan Visibility
3.2.2. Model 6: Effect of the Enclosure Move on the Crested Macaque Visibility
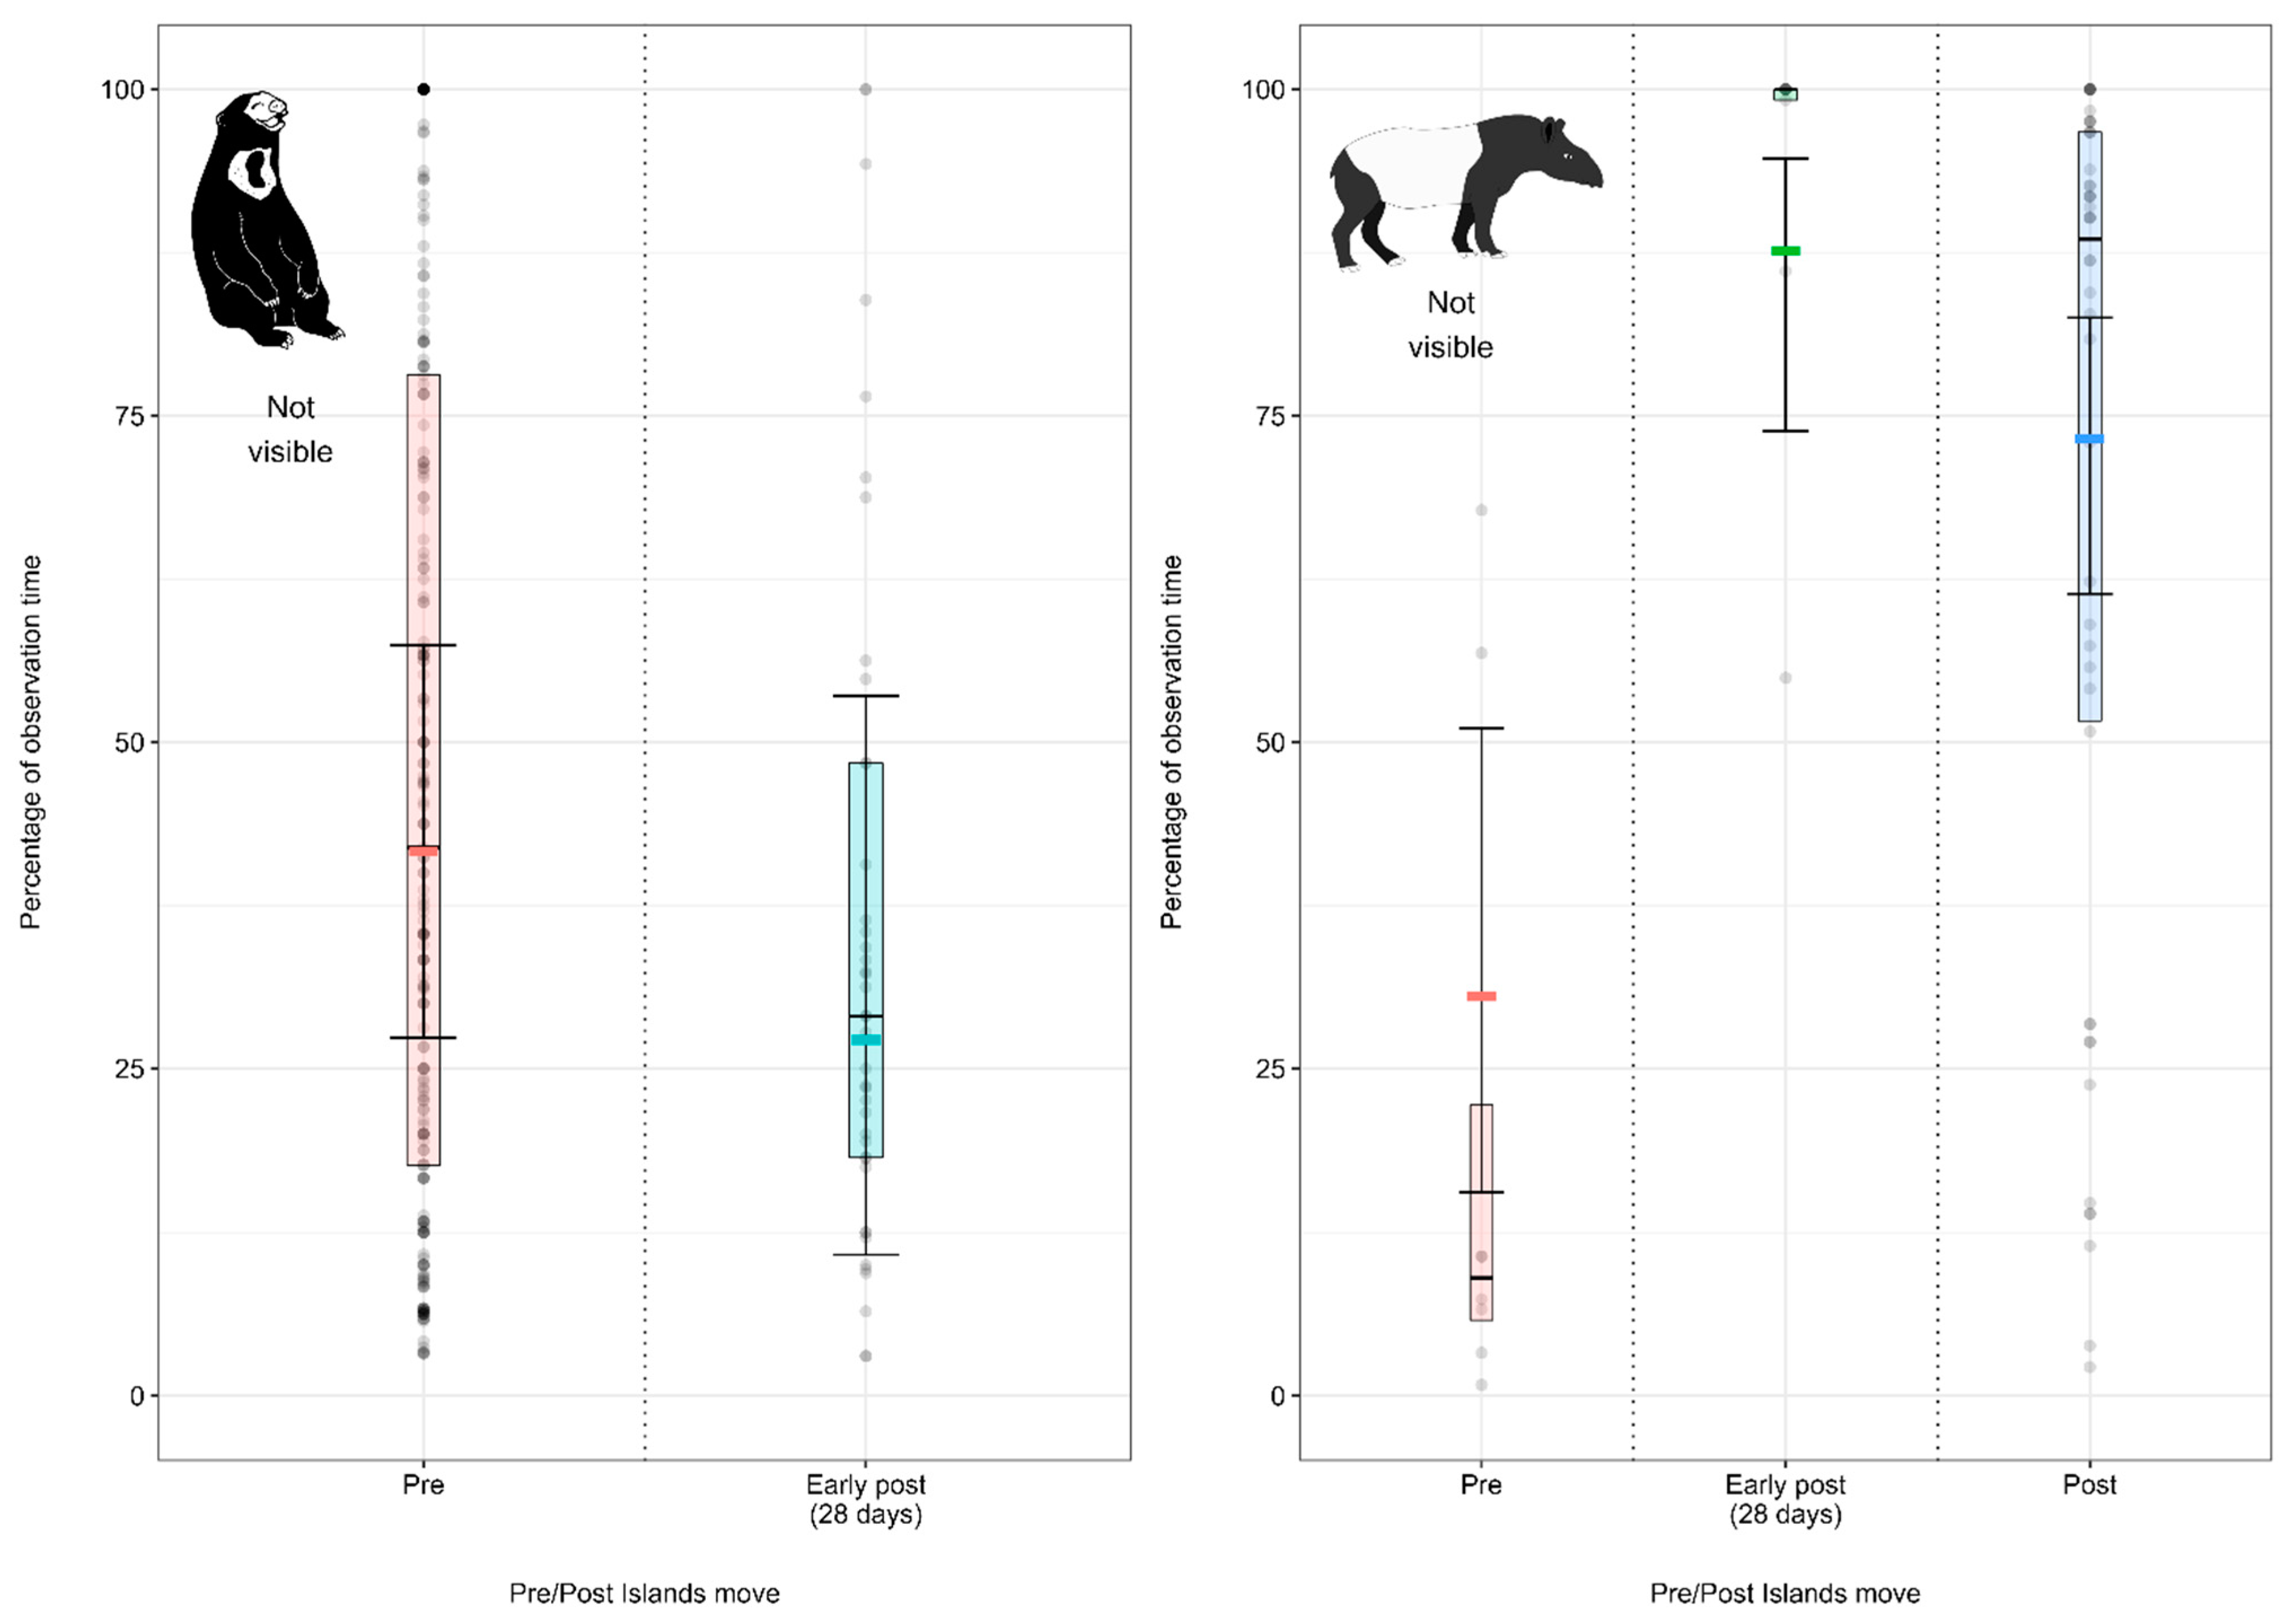
3.2.3. Model 7: Effect of the Enclosure Move on the Malayan Sun Bear Visibility
3.2.4. Model 8: Effect of the Enclosure Move on the Malayan Tapir Visibility
4. Discussion
4.1. Activity Budget Approach
4.1.1. Sumatran Orangutan Activity Budget
4.1.2. Crested Macaque Activity Budget
4.1.3. Malayan Sun Bear Activity Budget
4.1.4. Malayan Tapir Activity Budget
4.2. Choice and Control Approach
5. Conclusions
Author Contributions
Funding
Institutional Review Board Statement
Informed Consent Statement
Data Availability Statement
Acknowledgments
Conflicts of Interest
Appendix A

| Behaviour | Definition | Combined Behaviour Category |
|---|---|---|
| Alert | Observing and aware of surroundings; if face cannot be seen, head is visibly moving. | Vigilance |
| Affiliative social interaction | Other social behaviour not outlined which maintains or improves group cohesion, can include food/resource sharing or non-maternal carrying from another individual. | Positive social interaction with conspecifics |
| Agonistic social interaction | Behaviour which reduces group cohesion, can include slapping, biting, wrestling or grabbing. Also includes non-contact interaction such as displacement, lunging or chasing. | Negative social interaction with conspecifics |
| Being groomed | Having fur picked through or gently scratched by another orangutan. | Positive social interaction with conspecifics |
| Consumption | Actively drinking, chewing or eating food. | Feed |
| Excretion | The elimination of urine or faeces from the body. | Other |
| Foraging | Searching for food, including taking berries from plants, and using fingers and/or mouth to retrieve food from mesh after a scatter feed. | Forage |
| Grooming others | Picking through or gently scratching the fur of another orangutan. | Positive social interaction with conspecifics |
| Grooming self | Picking through fur or teeth, scratching and rubbing against objects to try to clean skin or hair. | Self-groom |
| Keeper interaction | Looking towards or placing objects or limbs into the keeper areas. | Social interaction with keeper/visitors |
| Locomotion | Moving from one point to another within the exhibit, can include the use of enclosure furnishings such as ropes, nets, sway poles. Includes bipedal and quadrupedal locomotion. | Locomotion |
| Maternal behavior | Actions related to the care of an infant, includes cradling, nursing or carrying. | Positive social interaction with conspecifics |
| Nest building | Manipulation of materials within exhibit to form a nest. | Object manipulation |
| Not visible | Individual and its behaviour cannot be seen by observers. | Not visible |
| Play | Excitable behaviour which has no specific outcome or objective, can include playful chasing, wrestling or swinging on ropes with another individual. | Play |
| Resting | Sp. is relaxed and displaying no alert or active behaviours, eyes can be open or closed. | Rest |
| Sexual | Includes heterosexual mounting and copulation, the presentation of the anogenital region to another individual or the inspection of the anogenital area to solicit mating. | Positive social interaction with conspecifics |
| Solitary play | Excitable behaviour which has no specific outcome or objective, includes swinging on ropes and interacting with enclosure resources in a playful manner. | Play |
| Tool use | Utilisation of objects within the environment to achieve a specific task. | Object manipulation |
| Visitor interaction | Sitting by or looking through visitor windows, includes reacting to visitors by banging the glass using fists or objects within the enclosure. | Social interaction with keeper/visitors |
| Vocalising | Exhibiting one or a combination of calls which could include a kiss squeak, long call, whimper or rolling call. | Other |
| Behaviour | Definition | Combined Behaviour Category |
|---|---|---|
| Active | Behaviours in which individuals are travelling slowly (walking) or quickly (running). This behavior can include vertical travelling (climbing). | Locomotion |
| Agonistic | An individual chases, slaps, grabs, hits, or bites another individual. This behavior is frequently accompanied with open mouth, bared teeth screams in which the mouth is open wide with corners retracted, exposing the teeth and sometimes the gums. This facial expression is accompanied by staring and screaming vocalizations. | Social negative |
| Allogrooming | An individual picking or slowly brushing the fur of another individual using the hands or mouth. | Social positive |
| Autogrooming | An individual picking or slowly brushing their own fur using the hands or mouth. | Autogroom |
| Away from public view | Individual is not visible from the public viewing areas. | Not visible |
| Contact-sit/Mutual embrace | An individual passes one or both hands, or one or both arms around the body of another in multiple combinations. There may be a simultaneous grasping of the fur and contact between heads or chests. Embracing may be mutual or unilateral. This behavior may be accompanied by lipsmacking. | Social positive |
| Environmental play | Individuals are observed engaged in play behavior with their physical surroundings, for example, with branches, mesh, or ropes. This behavior is distinguished from environmental manipulation by the absence of violent shaking of an object. | Play |
| Feeding | An individual ingesting food or water. Food ingestion is accompanied by chewing. | Feed |
| Foraging | Individuals moving substrates with their hands in search for food. | Forage |
| Hold-bottom | An individual clasps the haunches of a partner with both hands and grasps its legs with feet as in a mount. | Social positive |
| Huddle | Groups of ≥ three individuals embracing. | Social positive |
| Lipsmacking | The lips are pursed, and the lower jaw is moved up and down rapidly and rhythmically. The jaw may be thrust upward. The mouth may be slightly open with the tongue moving back and forth. The lips often produce an audible sound. Alternatively, the mouth may be closed, and sometimes the teeth knock together. Eyelids are generally half-lowered. The scalp may be retracted and the ears flattened. The display is used during affiliative interaction. It may also end a conflict and acts as an appeasement or reassurance signal. | Social positive |
| Mating | An individual climbs ventrodorsally upon a standing partner and inserts his erect penis in the female’s genitals. The mounter may or may not grip the legs of the partner. | Social positive |
| Play | An individual contacts another in the context of play. This may include touching, slapping, bumping, jostling, pushing, grasping, catching, chasing, pulling, nibbling, dragging, lifting, climbing or leaping over the partner, along with other patterns possibly occurring outside the context of play (e.g., mount, mouth approach). These patterns are accompanied by silent bared-teeth facial expressions. Play behavior is distinguished from conflict by a lack of loud vocalizations. | Play |
| Resting | Individual is observed sitting, lying, or standing without movement. Individuals are not interacting with others, but may be in physical contact with them. | Rest |
| Silent bared-teeth | The upper lip or both lips are vertically retracted, exposing the teeth and sometimes the gums. The corners of the mouth may be drawn back. The jaw may be either closed or opened to various degrees. The scalp is often raised and the ears flattened. This is an affiliative display; it is commonly observed during affiliative interactions and social play. | Social positive |
| Window licking | An individual is observed licking the glass-viewing panels. | Abnormal |
| Behaviour | Definition | Combined Behaviour Category |
|---|---|---|
| Charging | Swift and firm movement directly at a conspecific. | Social negative |
| Climbing | Vertical locomotion up or down tree/post or up and over logs. | Locomotion |
| Consumption | Voluntary ingestion of edible material and liquids. | Feed |
| Elimination | Elimination of urine and faeces from body. | Other |
| Foraging | Digging and manipulating objects in search of edible material. | Forage |
| Grooming | Includes licking, scratching, biting and rubbing of own body. | Autogroom |
| Interaction | Non-aggressive interaction with a conspecific; includes sniffing, leaning, nuzzling and grooming. | Social positive |
| Interaction with keeper(s) | Move towards and/or stands on hind limbs while facing the keeper(s), often with eye contact. | Interaction with humans |
| Interaction with visitor(s) | Move towards and/or stands on hind limbs while facing the visitor(s), often with eye contact. | Interaction with humans |
| Manipulation | Manipulation of object(s), e.g., branches, to create a nest. | Exploratory |
| Mating | Mounting or attempting to mount a conspecific. | Social positive |
| Not visible | Entire body is out of view. | Not visible |
| Other | Behaviour not described in ethogram. | Other |
| Other stereotypy | Repetitive behaviour including head sway/throw, foaming, pica, regurgitating, self-directed aggression and over-grooming, including licking, sucking, fur-plucking. | Abnormal |
| Pacing | Continuous walking back and forth in a repetitive way at least three times. Also includes forward–reverse pace (without turning the body) and weaving. | Abnormal |
| Playfighting | Includes non-aggressive pursuit, gentle/playful wrestling, biting and jawing (mouth to mouth in a playful context). | Play |
| Rest—awake | Sitting, lying, or leaning so that part or all of body is supported, while appearing attentive with head raised in air. | Rest |
| Rest—sleep | Sitting, lying, or leaning so that part or all of body is supported, with body motionless and head resting; does not appear alert. | Rest |
| Retreating | Walking or running away from a conspecific that is showing aggressive behaviour. | Social negative |
| Running | Horizontal locomotion where there is a period of time during each stride in which no limbs are in contact with the ground. | Locomotion |
| Sniffing | Briefly inhaling an object, ground, or air during olfactory investigation. | Exploratory |
| Standing | Maintaining an upright position on extended legs, with equal distribution of weight bipedally or quadrupedally. | Rest |
| Threatening | Snout wrinkled upwards with mouth open, showing canines, and often vocalising loudly. | Social negative |
| Unknown | Part or the body is obscured making accurate identification of behaviour impossible. | Other |
| Vocalisation | Opening the mouth and producing sound. May occur while solitary, at a conspecific, or at human(s). Not to be confused with threatening. | Other |
| Walking | Horizontal locomotion where at least one limb will be in contact with the ground at any given time. | Locomotion |
| Behaviour | Definition | Combined Behaviour Category |
|---|---|---|
| Aggression Given | Displaying aggressive behaviours such as biting and chasing shown to any other individual. | Social negative |
| Aggression Received | Any other individual displaying aggressive behaviours such as biting and chasing towards the focal animal. | Social negative |
| Defecation | Excreting faeces. | Other |
| Drinking | Ingesting water. | Feed |
| Eating | Ingesting food. | Feed |
| Foraging | Walking whilst actively searching for food on the ground and ingesting it. | Forage |
| Locomotion (run) | Moving around the enclosure at a fast pace. | Locomotion |
| Locomotion (walk) | Moving around the enclosure at a “normal” walking pace. | Locomotion |
| Not Visible | Out of sight of the researcher. | Not visible |
| Other | Any behaviour that is not listed on the ethogram. | Other |
| Play | Excitable behaviour often including running, bucking and vocalisation, can be shown alone or play with another individual. | Play |
| Resting (Lying Down) | Stationary with body on the ground, eyes open or closed with head moving or still. | Rest |
| Resting (Sitting) | Upright with hind legs on the ground, eyes open or closed with head moving or still. | Rest |
| Standing | Stationary in an upright standing position–potentially alert or resting. | Rest |
| Stereotypies | Any repetitive, unnatural behaviours that show no obvious goal or function to the individual. | Abnormal |
| Sniffing | Any visible movement of the nose excluding the flehmen response. | Exploratory |
| Social Interaction | Any behaviour shown between individuals including social grooming and contact. | Social positive |
| Suckling | When the juvenile tapir is feeding from the mother. | Social positive |
| Swimming | In water or pool (note: this behaviour may only be possible in the new enclosure). | Locomotion |
| Urination | Excreting urine. | Other |
| Vocalisation | Making audible sounds. | Other |
Appendix B


Appendix C
| Term | Estimate | SE | Lower CI | Upper CI |
|---|---|---|---|---|
| (Intercept) | −2.778 | 0.048 | −2.871 | −2.684 |
| Behaviour: | ||||
| (autogroom) | 2.862 | 0.066 | 2.733 | 2.99 |
| (feed) | 4.108 | 0.066 | 3.979 | 4.236 |
| (forage) | 1.894 | 0.066 | 1.765 | 2.023 |
| (locomotion) | 5.045 | 0.066 | 4.916 | 5.174 |
| (object manipulation) | 2.924 | 0.066 | 2.795 | 3.052 |
| (play) | 3.155 | 0.066 | 3.026 | 3.283 |
| (rest) | 2.568 | 0.066 | 2.439 | 2.696 |
| (social human) | 2.515 | 0.066 | 2.387 | 2.644 |
| (social negative) | −0.04 | 0.066 | −0.169 | 0.088 |
| (social positive) | 2.878 | 0.066 | 2.749 | 3.007 |
| (vigilance) | 5.425 | 0.066 | 5.296 | 5.553 |
| Enclosure-move condition: | ||||
| (early-post-move) | −0.136 | 0.107 | −0.345 | 0.073 |
| (post-move) | 0.04 | 0.068 | −0.092 | 0.173 |
| Sex: | ||||
| (female) | 0 | 0.02 | −0.038 | 0.038 |
| Age (days) | 0 | 0.009 | −0.018 | 0.018 |
| Behaviour * Enclosure-move condition: | ||||
| (autogroom * early-post-move) | 0.632 | 0.151 | 0.336 | 0.927 |
| (feed * early-post-move) | 0.622 | 0.151 | 0.327 | 0.917 |
| (forage * early-post-move) | −1.358 | 0.151 | −1.653 | −1.062 |
| (locomotion * early-post-move) | 1.075 | 0.151 | 0.780 | 1.371 |
| (object manipulation) * early-post-move) | −0.176 | 0.151 | −0.471 | 0.120 |
| (play * early-post-move) | −0.392 | 0.151 | −0.687 | −0.097 |
| (rest * early-post-move) | 0.31 | 0.151 | 0.015 | 0.606 |
| (social human * early-post-move) | −1.223 | 0.151 | −1.518 | −0.927 |
| (social negative * early-post-move) | −0.19 | 0.151 | −0.485 | 0.106 |
| (social positive * early-post-move) | 1.794 | 0.151 | 1.498 | 2.089 |
| (vigilance * early-post-move) | 0.532 | 0.151 | 0.236 | 0.827 |
| (autogroom * post-move) | 0.098 | 0.096 | −0.089 | 0.285 |
| (feed * post-move) | −1.042 | 0.096 | −1.229 | −0.855 |
| (forage * post-move) | 0.046 | 0.096 | −0.141 | 0.234 |
| (locomotion * post-move) | −0.253 | 0.096 | −0.44 | −0.066 |
| (object manipulation * post-move) | 0.785 | 0.096 | 0.598 | 0.972 |
| (play * post-move) | −0.52 | 0.096 | −0.707 | −0.333 |
| (rest * post-move) | 0.262 | 0.096 | 0.075 | 0.449 |
| (social human * post-move) | −2.444 | 0.096 | −2.631 | −2.257 |
| (social negative * post-move) | 0.04 | 0.096 | −0.147 | 0.228 |
| (social positive * post-move) | 2.478 | 0.096 | 2.290 | 2.665 |
| (vigilance * post-move) | 0.065 | 0.096 | −0.122 | 0.252 |
| Random Effects: | ||||
| Residual variance | 6.24 | |||
| (individual) variance | 0 | |||
| (individual) standard deviation | 0 | |||
| (observation session) variance | 0 | |||
| (observation session) standard deviation | 0 | |||
| N (individual) | 6 | |||
| N (observation session) | 190 | |||
| Observations | 2280 | |||
| Marginal R2/Conditional R2 | 0.341/NA |
| Term | Estimate | SE | Lower CI | Upper CI |
|---|---|---|---|---|
| (Intercept) | −2.717 | 0.051 | −2.818 | −2.616 |
| Behaviour: | ||||
| (autogroom) | 1.729 | 0.066 | 1.599 | 1.859 |
| (feed) | 2.239 | 0.066 | 2.109 | 2.369 |
| (forage) | 3.069 | 0.066 | 2.939 | 3.199 |
| (locomotion) | 4.392 | 0.066 | 4.262 | 4.523 |
| (play) | 1.298 | 0.066 | 1.168 | 1.428 |
| (rest) | 6.576 | 0.066 | 6.446 | 6.706 |
| (social negative) | 0.158 | 0.066 | 0.028 | 0.289 |
| (social positive) | 4.989 | 0.066 | 4.859 | 5.119 |
| Enclosure-move condition: | ||||
| (early-post-move) | −0.03 | 0.1 | −0.225 | 0.166 |
| (post-move) | 0.07 | 0.08 | −0.087 | 0.228 |
| Sex: | ||||
| (female) | 0 | 0.028 | −0.054 | 0.054 |
| Age (days) | 0 | 0.012 | −0.023 | 0.023 |
| Behaviour * Enclosure-move condition: | ||||
| (autogroom * early-post-move) | 0.159 | 0.141 | −0.118 | 0.436 |
| (feed * early-post-move) | −0.821 | 0.141 | −1.098 | −0.544 |
| (forage * early-post-move) | 0.083 | 0.141 | −0.194 | 0.359 |
| (locomotion * early-post-move) | −0.092 | 0.141 | −0.369 | 0.185 |
| (play * early-post-move) | 0.192 | 0.141 | −0.085 | 0.469 |
| (rest * early-post-move) | −0.568 | 0.141 | −0.845 | −0.291 |
| (social negative * early-post-move) | −0.158 | 0.141 | −0.435 | 0.118 |
| (social positive * early-post-move) | 1.471 | 0.141 | 1.194 | 1.747 |
| (autogroom * post-move) | 1.365 | 0.113 | 1.143 | 1.587 |
| (feed * post-move) | −0.952 | 0.113 | −1.175 | −0.730 |
| (forage * post-move) | −0.841 | 0.113 | −1.063 | −0.618 |
| (locomotion * post-move) | −0.773 | 0.113 | −0.995 | −0.550 |
| (play * post-move) | −0.346 | 0.113 | −0.568 | −0.123 |
| (rest * post-move) | 0.11 | 0.113 | −0.112 | 0.332 |
| (social negative * post-move) | −0.116 | 0.113 | −0.338 | 0.106 |
| (social positive * post-move) | 0.919 | 0.113 | 0.697 | 1.141 |
| Random Effects: | ||||
| Residual variance | 8.637 | |||
| (individual) variance | 0 | |||
| (individual) standard deviation | 0 | |||
| (observation session) variance | 0 | |||
| (observation session) standard deviation | 0 | |||
| N (individual) | 13 | |||
| N (observation session) | 645 | |||
| Observations | 5805 | |||
| Marginal R2/Conditional R2 | 0.356/NA |
| Term | Estimate | SE | Lower CI | Upper CI |
|---|---|---|---|---|
| (Intercept) | −0.419 | 0.048 | −0.513 | −0.324 |
| Behaviour: | ||||
| (explore) | 3.121 | 0.045 | 3.033 | 3.209 |
| (feed) | −0.198 | 0.045 | −0.285 | −0.110 |
| (forage) | 1.292 | 0.045 | 1.204 | 1.38 |
| (locomotion) | 4.278 | 0.045 | 4.191 | 4.366 |
| (object manipulation) | −1.6 | 0.045 | −1.688 | −1.512 |
| (rest) | 2.359 | 0.045 | 2.271 | 2.446 |
| (social human) | −1.797 | 0.045 | −1.885 | −1.709 |
| (social negative) | −1.748 | 0.045 | −1.836 | −1.660 |
| (social positive) | −1.519 | 0.045 | −1.607 | −1.432 |
| Enclosure-move condition: | ||||
| (early-post-move) | −1.089 | 0.077 | −1.24 | −0.937 |
| Sex | ||||
| (female) | 0 | 0.079 | −0.156 | 0.156 |
| Age (days) | 0 | 0.041 | −0.081 | 0.081 |
| Behaviour * Enclosure-move condition: | ||||
| (explore * early-post-move) | 1.733 | 0.103 | 1.531 | 1.934 |
| (feed * early-post-move) | 0.798 | 0.103 | 0.597 | 0.999 |
| (forage * early-post-move) | 0.623 | 0.103 | 0.422 | 0.824 |
| (locomotion)* early-post-move) | 0.83 | 0.103 | 0.629 | 1.032 |
| (object manipulation * early-post-move) | 0.935 | 0.103 | 0.733 | 1.136 |
| (rest * early-post-move) | 3.207 | 0.103 | 3.006 | 3.409 |
| (social human * early-post-move) | 0.942 | 0.103 | 0.741 | 1.143 |
| (social negative * early-post-move) | 0.76 | 0.103 | 0.559 | 0.961 |
| (social positive * early-post-move) | 1.06 | 0.103 | 0.858 | 1.261 |
| Random Effects | ||||
| Residual variance | 5.964 | |||
| (observation session) variance | 0 | |||
| (observation session) standard deviation | 0 | |||
| N (observation session) | 279 | |||
| Observations | 2790 | |||
| Marginal R2/Conditional R2 | 0.444/NA |
| Term | Estimate | SE | Lower CI | Upper CI |
|---|---|---|---|---|
| (Intercept) | −1.135 | 0.017 | −1.168 | −1.103 |
| Behaviour: | ||||
| (feed) | 3.667 | 0.022 | 3.625 | 3.71 |
| (forage) | 1.682 | 0.022 | 1.639 | 1.725 |
| (locomotion) | 2.293 | 0.022 | 2.250 | 2.336 |
| (play) | −1.375 | 0.022 | −1.418 | −1.332 |
| (rest) | 5.143 | 0.022 | 5.100 | 5.185 |
| (social negative) | −1.531 | 0.022 | −1.574 | −1.488 |
| (social positive) | −0.796 | 0.022 | −0.839 | −0.753 |
| Enclosure-move condition: | ||||
| (early-post-move) | 1.475 | 0.071 | 1.336 | 1.614 |
| (post-move) | −0.59 | 0.023 | −0.636 | −0.544 |
| Sex: | ||||
| (female) | 0 | 0.009 | −0.019 | 0.019 |
| Age (days) | 0 | 0.004 | −0.009 | 0.009 |
| Behaviour * Enclosure-move condition: | ||||
| (feed * early-post-move) | −3.667 | 0.1 | −3.863 | −3.471 |
| (forage * early-post-move) | −1.184 | 0.1 | −1.38 | −0.988 |
| (locomotion * early-post-move) | −0.764 | 0.1 | −0.96 | −0.568 |
| (play * early-post-move) | −0.397 | 0.1 | −0.593 | −0.201 |
| (rest * early-post-move) | −2.104 | 0.1 | −2.3 | −1.908 |
| (social negative * early-post-move) | −1.474 | 0.1 | −1.67 | −1.278 |
| (social positive * early-post-move) | −2.209 | 0.1 | −2.405 | −2.013 |
| (feed * post-move) | 0.282 | 0.033 | 0.218 | 0.347 |
| (forage * post-move) | 0.646 | 0.033 | 0.581 | 0.711 |
| (locomotion * post-move) | 2.615 | 0.033 | 2.550 | 2.68 |
| (play * post-move) | 0.677 | 0.033 | 0.612 | 0.741 |
| (rest * post-move) | −1.187 | 0.033 | −1.252 | −1.123 |
| (social negative * post-move) | 0.477 | 0.033 | 0.412 | 0.541 |
| (social positive * post-move) | 1.213 | 0.033 | 1.148 | 1.277 |
| Random Effects: | ||||
| Residual variance | 1.743 | |||
| (observation session) variance | 0 | |||
| (observation session) standard deviation | 0 | |||
| N (observation session) | 96 | |||
| Observations | 768 | |||
| Marginal R2/Conditional R2 | 0.744/NA |
| Species | Behaviour | Pre (% (SE) n) | Early Post (% (SE) n) | Post (% (SE) n) | |||
|---|---|---|---|---|---|---|---|
| Sumatran orangutan | Abnormal | 0 (0.0) | 81 | 0.1 (0.1) | 23 | 0 (0) | 86 |
| Autogroom | 4.8 (0.8) | 81 | 6.7 (1.6) | 23 | 3.4 (0.5) | 86 | |
| Explore | 0 (0.0) | 81 | 0 (0) | 23 | 0 (0) | 86 | |
| Feed | 11 (1.8) | 81 | 11.2 (2.4) | 23 | 0 (0) | 86 | |
| Forage | 4.8 (0.9) | 81 | 0.8 (0.6) | 23 | 7.5 (1.2) | 86 | |
| Interaction with humans | 10.2 (2.0) | 81 | 1.6 (0.6) | 23 | 4.1 (0.8) | 86 | |
| Locomotion | 12.5 (1.1) | 81 | 14.8 (1.7) | 23 | 0.1 (0.1) | 86 | |
| Negative social | 0.2 (0.1) | 81 | 0 (0) | 23 | 11 (1.2) | 86 | |
| Object manipulation | 4.9 (1.0) | 81 | 2.7 (0.9) | 23 | 0 (0) | 86 | |
| Play | 14.8 (2.3) | 81 | 10.6 (3.7) | 23 | 8.7 (1.5) | 86 | |
| Positive social | 7.5 (1.3) | 81 | 11.5 (2.9) | 23 | 11.3 (2.1) | 86 | |
| Rest | 6.8 (1.7) | 81 | 4.7 (1.7) | 23 | 19.6 (2.3) | 86 | |
| Vigilance | 22.3 (2.6) | 81 | 34.3 (5.7) | 23 | 12.8 (2.4) | 86 | |
| Crested macaque | Abnormal | 0 (0) | 358 | 0 (0) | 23 | 21.4 (2.4) | 86 |
| Autogroom | 4.8 (0.7) | 358 | 5.7 (1.3) | 101 | 0 (0) | 186 | |
| Explore | 0 (0) | 358 | 0 (0) | 101 | 10.5 (1.3) | 186 | |
| Feed | 9.2 (1.0) | 358 | 4 (1.2) | 101 | 0 (0) | 186 | |
| Forage | 11.0 (1.0) | 358 | 12.3 (2.0) | 101 | 4.3 (1.0) | 186 | |
| Interaction with humans | 0 (0) | 358 | 0 (0) | 101 | 8.1 (1.3) | 186 | |
| Locomotion | 11.4 (0.7) | 358 | 10.4 (1.3) | 101 | 0 (0) | 186 | |
| Negative social | 0.3 (0.1) | 358 | 0 (0) | 101 | 8.5 (0.8) | 186 | |
| Object manipulation | 0 (0) | 358 | 0 (0) | 101 | 0.1 (0.1) | 186 | |
| Play | 3.7 (0.6) | 358 | 3.7 (0.9) | 101 | 0 (0) | 186 | |
| Positive social | 28.8 (1.8) | 358 | 41.4 (3.7) | 101 | 2.1 (0.5) | 186 | |
| Rest | 30.8 (1.4) | 358 | 22.6 (2.0) | 101 | 36.7 (2.5) | 186 | |
| Vigilance | 0 (0) | 358 | 0 (0) | 101 | 29.7 (1.8) | 186 | |
| Malayan sun bear | Abnormal | 9.6 (1.3) | 237 | 4.1 (2) | 101 | 0 (0) | 186 |
| Autogroom | 0 (0) | 237 | 0 (0) | - | - | - | |
| Explore | 17.5 (1.2) | 237 | 24.1 (3.1) | - | - | - | |
| Feed | 3.7 (0.6) | 237 | 3.7 (1.7) | - | - | - | |
| Forage | 13.3 (1.4) | 237 | 9.2 (2.2) | - | - | - | |
| Interaction with humans | 0.2 (0.2) | 237 | 0.2 (0.2) | - | - | - | |
| Locomotion | 26.2 (1.5) | 237 | 19.9 (2.2) | - | - | - | |
| Negative social | 0.1 (0.1) | 237 | 0 (0) | - | - | - | |
| Object manipulation | 1.2 (0.5) | 237 | 1.2 (0.9) | - | - | - | |
| Play | 0 (0) | 237 | 0 (0) | - | - | - | |
| Positive social | 1 (0.4) | 237 | 0.5 (0.2) | - | - | - | |
| Rest | 27.1 (2.3) | 237 | 37.2 (5) | - | - | - | |
| Vigilance | 0 (0) | 237 | 0 (0) | - | - | - | |
| Tapir | Abnormal | 0 (0) | 51 | 0 (0) | - | - | - |
| Autogroom | 0 (0) | 51 | 0 (0) | 3 | 0 (0) | 42 | |
| Explore | 0.8 (0.2) | 51 | 3.9 (2.0) | 3 | 0 (0) | 42 | |
| Feed | 25.7 (3.3) | 51 | 3.9 (2.0) | 3 | 2.3 (1.2) | 42 | |
| Forage | 3.8 (0.7) | 51 | 9.2 (5.8) | 3 | 28.2 (3.3) | 42 | |
| Interaction with humans | 0 (0) | 51 | 0 (0) | 3 | 6.7 (1.0) | 42 | |
| Locomotion | 6.2 (0.9) | 51 | 39.1 (19.8) | 3 | 0 (0.0) | 42 | |
| Negative social | 0 (0) | 51 | 0 (0) | 3 | 37.9 (3.0) | 42 | |
| Object manipulation | 0 (0) | 51 | 0 (0) | 3 | 0 (0) | 42 | |
| Play | 0.1 (0.1) | 51 | 0.9 (0.9) | 3 | 0 (0) | 42 | |
| Positive social | 0.7 (0.4) | 51 | 0 (0) | 3 | 0.2 (0.1) | 42 | |
| Rest | 62.7 (3.9) | 51 | 42.9 (28.6) | 3 | 1.4 (0.3) | 42 | |
| Vigilance | 0 (0) | 51 | 0 (0) | 3 | 23.3 (2.9) | 42 | |
| Term | Estimate | SE | Lower CI | Upper CI |
|---|---|---|---|---|
| (Intercept) | 0.162 | 0.031 | 0.112 | 0.235 |
| Enclosure-move condition: | ||||
| (early-post-move) | 0.725 | 0.251 | 0.368 | 1.431 |
| (post-move) | 1.164 | 0.228 | 0.793 | 1.708 |
| Sex: | ||||
| (female) | 0.919 | 0.191 | 0.611 | 1.382 |
| Age (days) | 0.958 | 0.089 | 0.798 | 1.149 |
| Random Effects: | ||||
| (individual) variance | 0 | |||
| (individual) standard deviation | 0 | |||
| N (individual) | 6 | |||
| Observations | 63 | |||
| Marginal R2/Conditional R2 | 0.055/NA |
| Term | Estimate | SE | Lower CI | Upper CI |
|---|---|---|---|---|
| (Intercept) | 0.275 | 0.151 | 0.094 | 0.805 |
| Enclosure-move condition: | ||||
| (early-post-move) | 1.024 | 0.552 | 0.356 | 2.948 |
| (post-move) | 1.209 | 0.64 | 0.428 | 3.414 |
| Sex: | ||||
| (female) | 1.213 | 0.206 | 0.870 | 1.691 |
| Age (days) | 0.936 | 0.072 | 0.806 | 1.088 |
| Random Effects | ||||
| (individual) variance | 0 | |||
| (individual) standard deviation | 0 | |||
| N (individual) | 13 | |||
| Observations | 98 | |||
| Marginal R2/Conditional R2 | 0.088/NA |
| Term | Estimate | SE | Lower CI | Upper CI |
|---|---|---|---|---|
| (Intercept) | 0.713 | 0.232 | 0.377 | 1.348 |
| Enclosure-move condition: | ||||
| (early-post-move) | 0.524 | 0.162 | 0.285 | 0.962 |
| Sex: | ||||
| (female) | 2.789 | 1.886 | 0.741 | 10.5 |
| Age (days) | 1.414 | 0.494 | 0.712 | 2.805 |
| Observations | 266 |
| Term | Estimate | SE | Lower CI | Upper CI |
|---|---|---|---|---|
| (Intercept) | 0.439 | 0.194 | 0.184 | 1.044 |
| Enclosure-move condition: | ||||
| (early-post-move) | 16.194 | 9.514 | 5.120 | 51.217 |
| (post-move) | 6.237 | 2.853 | 2.545 | 15.289 |
| Sex: | ||||
| (female) | 0.717 | 0.235 | 0.378 | 1.362 |
| Age (days) | 0.936 | 0.15 | 0.684 | 1.282 |
| Observations | 63 |
References
- Choo, Y.; Todd, P.A.; Li, D. Visitor Effects on Zoo Orangutans in Two Novel, Naturalistic Enclosures. Appl. Anim. Behav. Sci. 2011, 133, 78–86. [Google Scholar] [CrossRef]
- Clubb, R.; Mason, G.J. Natural Behavioural Biology as a Risk Factor in Carnivore Welfare: How Analysing Species Differences Could Help Zoos Improve Enclosures. Appl. Anim. Behav. Sci. 2007, 102, 303–328. [Google Scholar] [CrossRef]
- Mallapur, A.; Qureshi, Q.; Chellam, R. Enclosure Design and Space Utilization by Indian Leopards (Panthera pardus) in Four Zoos in Southern India. J. Appl. Anim. Welf. Sci. 2002, 5, 111–124. [Google Scholar] [CrossRef] [PubMed]
- Melfi, V.A.; McCormick, W.; Gibbs, A. A Preliminary Assessment of How Zoo Visitors Evaluate Animal Welfare According to Enclosure Style and the Expression of Behavior. Anthrozoös 2004, 17, 98–108. [Google Scholar] [CrossRef]
- Wall, E.L.; Hartley, M. Assessing Enclosure Design and Husbandry Practices for Successful Keeping and Breeding of the Burmese Brow Antlered Deer (Eld’s Deer, Rucervus eldii thamin) in European Zoos. Zoo Biol. 2017, 36, 201–212. [Google Scholar] [CrossRef]
- Hogan, L.A.; Tribe, A. Prevalence and cause of stereotypy behaviour in common wombats (Vombatus ursinus) residing in Australian zoos. Appl. Anim. Behav. Sci. 2007, 105, 180–191. [Google Scholar] [CrossRef]
- Morfeld, K.A.; Meehan, C.L.; Hogan, J.N.; Brown, J.L. Assessment of Body Condition in African (Loxodonta africana) and Asian (Elephas maximus) Elephants in North American Zoos and Management Practices Associated with High Body Condition Scores. PLoS ONE 2016, 11, e0155146. [Google Scholar] [CrossRef]
- Lindburg, D.G.; Fitch-Snyder, H. Use of Behavior to Evaluate Reproductive Problems in Captive Mammals. Zoo Biol. 1994, 13, 433–445. [Google Scholar] [CrossRef]
- Mendyk, R.W.; Newton, A.L.; Baumer, M. A Retrospective Study of Mortality in Varanid Lizards (Reptilia:Squamata:Varanidae) at the Bronx Zoo: Implications for Husbandry and Reproductive Management in Zoos: Varanid Mortality at the Bronx Zoo. Zoo. Biol. 2013, 32, 152–162. [Google Scholar] [CrossRef]
- Ross, S.R.; Wagner, K.E.; Schapiro, S.J.; Hau, J.; Lukas, K.E. Transfer and Acclimatization Effects on the Behavior of Two Species of African Great Ape (Pan troglodytes and Gorilla gorilla gorilla) Moved to a Novel and Naturalistic Zoo Environment. Int. J. Primat. 2011, 32, 99–117. [Google Scholar] [CrossRef]
- Kelling, A.S.; Gaalema, D.E. Postoccupancy Evaluations in Zoological Settings. Zoo Biol. 2011, 30, 597–610. [Google Scholar] [CrossRef] [PubMed]
- Ross, S.R.; Calcutt, S.; Schapiro, S.J.; Hau, J. Space Use Selectivity by Chimpanzees and Gorillas in an Indoor-Outdoor Enclosure. Am. J. Primatol. 2011, 73, 197–208. [Google Scholar] [CrossRef] [PubMed]
- Chang, T.R.; Forthman, D.L.; Maple, T.L. Comparison of Confined Mandrill (Mandrillus sphinx) Behavior in Traditional and Ecologically Representative Exhibits. Zoo Biol. 1999, 18, 163–176. [Google Scholar] [CrossRef]
- White, B.C.; Houser, L.A.; Fuller, J.A.; Taylor, S.; Elliott, J.L.L. Activity-based exhibition of five mammalian species: Evaluation of behavioural changes. Zoo Biol. 2003, 22, 269–285. [Google Scholar] [CrossRef]
- Perkins, L.A. Variables That Influence the Activity of Captive Orangutans. Zoo Biol. 1992, 11, 177–186. [Google Scholar] [CrossRef]
- Little, K.A.; Sommer, V. Change of Enclosure in Langur Monkeys: Implications for the Evaluation of Environmental Enrichment. Zoo Biol. 2002, 21, 549–559. [Google Scholar] [CrossRef]
- Spain, M.S.; Fuller, G.; Allard, S.M. Effects of habitat modifications on behavioural indicators of welfare for Madagascan Giant Hognose Snakes (Leioheterodon madagascariensis). Anim. Behav. Cogn. 2020, 7, 70–81. [Google Scholar] [CrossRef]
- Wolfensohn, S.; Shotton, J.; Bowley, H.; Davies, S.; Thompson, S.; Justice, W.S.M. Assessment of Welfare in Zoo Animals: Towards Optimum Quality of Life. Animals 2018, 8, 110. [Google Scholar] [CrossRef]
- Sherwen, S.L.; Hemsworth, L.M.; Beausoleil, N.J.; Embury, A.; Mellor, D.J. An Animal Welfare Risk Assessment Process for Zoos. Animals 2018, 8, 130. [Google Scholar] [CrossRef]
- Mellor, D.J.; Beausoleil, N.J.; Littlewood, K.E.; McLean, A.N.; McGreevy, P.D.; Jones, B.; Wilkins, C. The 2020 Five Domains Model: Including Human–Animal Interactions in Assessments of Animal Welfare. Animals 2020, 10, 1870. [Google Scholar] [CrossRef]
- Greggor, A.L.; Vicino, G.A.; Swaisgood, R.R.; Fidgett, A.; Brenner, D.; Kinney, M.E.; Farabaugh, S.; Masuda, B.; Lamberski, N. Animal Welfare in Conservation Breeding: Applications and Challenges. Front. Vet. Sci. 2018, 5, 323. [Google Scholar] [CrossRef] [PubMed]
- Veasey, J.D.; Waran, N.K.; Young, R.J. On comparing the behaviour of zoo housed animals with wild conspecifics as a welfare indicator. Anim. Welf. 1996, 5, 13–24. [Google Scholar]
- Fernandez, E.J.; Ramirez, M.; Hawkes, N.C. Activity and Pool Use in Relation to Temperature and Water Changes in Zoo Hippopotamuses (Hippopotamus Amphibious). Animals 2020, 10, 1022. [Google Scholar] [CrossRef] [PubMed]
- Earl, S.C.; Hopper, L.M.; Ross, S.R. Same Space, Different Species: The Influence of Exhibit Design on the Expression of Zoo-Housed Apes’ Species-Typical Retiring Behaviors. Animals 2020, 10, 836. [Google Scholar] [CrossRef] [PubMed]
- Williams, E.; Carter, A.; Rendle, J.; Ward, S.J. Understanding Impacts of Zoo Visitors: Quantifying Behavioural Changes of Two Popular Zoo Species during COVID-19 Closures. Appl. Anim. Behav. Sci. 2021, 236, 105253. [Google Scholar] [CrossRef]
- Finch, K.; Williams, L.; Holmes, L. Using Longitudinal Data to Evaluate the Behavioural Impact of a Switch to Carcass Feeding on an Asiatic Lion (Panthera leo persica). J. Zoo Aquar. Res. 2020, 8, 283–287. [Google Scholar] [CrossRef]
- Anderson, C.; Arun, A.S.; Jensen, P. Habituation to Environmental Enrichment in Captive Sloth Bears-Effect on Stereotypies. Zoo Biol. 2010, 29, 705–714. [Google Scholar] [CrossRef]
- Della Costa, N.S.; Lèche, A.; Guzmán, D.A.; Navarro, J.L.; Marin, R.H.; Martella, M.B. Behavioral Responses to Short-Term Transport in Male and Female Greater Rheas (Rhea americana) Reared in Captivity. Poult. Sci. 2013, 92, 849–857. [Google Scholar] [CrossRef]
- Hebert, P.L.; Bard, K. Orangutan Use of Vertical Space in an Innovative Habitat. Zoo Biol. 2000, 19, 239–251. [Google Scholar] [CrossRef]
- Samson, D.R.; Shumaker, R. Pre-Sleep and Sleeping Platform Construction Behavior in Captive Orangutans (Pongo spp.): Implications for Ape Health and Welfare. Folia Primatol. 2015, 86, 187–202. [Google Scholar] [CrossRef]
- Samson, D.R.; Shumaker, R.W. Orangutans (Pongo spp.) Have Deeper, More Efficient Sleep than Baboons (Papio papio) in Captivity: Orangutan and Baboon Sleep Efficiency. Am. J. Phys. Anthropol. 2015, 157, 421–427. [Google Scholar] [CrossRef] [PubMed]
- Melfi, V.A.; Feistner, A.T.C. A Comparison of the Activity Budgets of Wild and Captive Sulawesi Black Crested Macaques (Macaca nigra). Anim. Welf. 2002, 11, 213–222. [Google Scholar]
- Hanna, J.B.; Schmitt, D. Interpreting the Role of Climbing in Primate Locomotor Evolution: Are the Biomechanics of Climbing Influenced by Habitual Substrate Use and Anatomy? Int J. Primatol. 2011, 32, 430–444. [Google Scholar] [CrossRef]
- Renner, M.J.; Lussier, J.P. Environmental Enrichment for the Captive Spectacled Bear (Tremarctos ornatus). Pharmacol. Biochem. Behav. 2002, 73, 279–283. [Google Scholar] [CrossRef]
- Hwang, M.; Ditmer, M.A.; Teo, S.; Wong, S.T.; Garshelis, D.L. Sun Bears Use 14-year-old Previously Logged Forest More than Primary Forest in Sabah, Malaysia. Ecosphere 2021, 12, e03769. [Google Scholar] [CrossRef]
- Medici, E.P.; Mezzini, S.; Fleming, C.H.; Calabrese, J.M.; Noonan, M.J. Movement Ecology of Vulnerable Lowland Tapirs between Areas of Varying Human Disturbance. Mov. Ecol. 2022, 10, 14. [Google Scholar] [CrossRef] [PubMed]
- Barongi, R.A. Husbandry and Conservation of Tapirs Tapirus spp. Int. Zoo Yearb. 2007, 32, 7–15. [Google Scholar] [CrossRef]
- Altmann, J. Observational Study of Behavior: Sampling Methods. Behaviour 1974, 49, 227–266. [Google Scholar] [CrossRef] [PubMed]
- R Core Team. R: A Language and Environment for Statistical Computing; R Foundation for Statistical Computing: Vienna, Austria, 2021. [Google Scholar]
- Brooks, M.E.; Kristensen, K.; van Benthem, K.J.; Magnusson, A.; Berg, C.W.; Nielsen, A.; Skaug, H.J.; Maechler, M.; Bolker, B.M. GlmmTMB Balances Speed and Flexibility Among Packages for Zero-Inflated Generalized Linear Mixed Modeling. R J. 2017, 9, 378–400. [Google Scholar] [CrossRef]
- Smithson, M.; Verkuilen, J. A Better Lemon Squeezer? Maximum-Likelihood Regression with Beta Distributed Dependent Variables. Psychol. Methods 2006, 11, 54–71. [Google Scholar] [CrossRef]
- Zuur, A.F.; Ieno, E.N.; Walker, N.J.; Saveliev, A.A.; Smith, G.M. Mixed Effects Models and Extensions in Ecology with R; Springer: Berlin/Heidelberg, Germany, 2009; Volume 574. [Google Scholar]
- Douma, J.C.; Weedon, J.T. Analysing Continuous Proportions in Ecology and Evolution: A Practical Introduction to Beta and Dirichlet Regression. Methods Ecol. Evol. 2019, 10, 1412–1430. [Google Scholar] [CrossRef]
- Hartig, F. DHARMa: Residual Diagnostics for Hierarchical (Multi-Level/Mixed) Regression Models. 2021. Available online: https://cran.r-project.org/web/packages/DHARMa/index.html (accessed on 1 June 2022).
- Lenth, R.V. Emmeans: Estimated Marginal Means, Aka Least-Squares Means; R Foundation for Statistical Computing: Vienna, Austria, 2021. [Google Scholar]
- Huettner, T.; Dollhaeupl, S.; Simon, R.; Baumgartner, K.; von Fersen, L. Activity Budget Comparisons Using Long-Term Observations of a Group of Bottlenose Dolphins (Tursiops truncatus) under Human Care: Implications for Animal Welfare. Animals 2021, 11, 2107. [Google Scholar] [CrossRef] [PubMed]
- Mason, G.J.; Latham, N.R. Can’t stop, won’t stop: Is stereotypy a reliable animal welfare indicator? Anim. Welf. 2004, 13, S57–S69. [Google Scholar]
- Lyons, J.; Young, R.J.; Deag, J.M. The Effects of Physical Characteristics of the Environment and Feeding Regime on the Behavior of Captive Felids. Zoo Biol. 1997, 16, 71–83. [Google Scholar] [CrossRef]
- Meehan, C.L.; Mench, J.A. The Challenge of Challenge: Can Problem Solving Opportunities Enhance Animal Welfare? Appl. Anim. Behav. Sci. 2007, 102, 246–261. [Google Scholar] [CrossRef]
- Nash, R.; Johnston, H.; Robbins, A.; Descovich, K. The Effect of Enrichment Filling and Engagement Time on Regurgitation and Reingestion Behaviour in Three Zoo-Housed Orangutans. J. Zool. Bot. Gard. 2021, 2, 10–20. [Google Scholar] [CrossRef]
- Bashaw, M.J. Consistency of Captive Giraffe Behavior under Two Different Management Regimes. Zoo Biol. 2011, 30, 371–378. [Google Scholar] [CrossRef]
- Fernandez, E.J.; Tamborski, M.A.; Pickens, S.R.; Timberlake, W. Animal–Visitor Interactions in the Modern Zoo: Conflicts and Interventions. Appl. Anim. Behav. Sci. 2009, 120, 1–8. [Google Scholar] [CrossRef]
- Swaisgood, R.R.; Shepherdson, D.J. Scientific Approaches to Enrichment and Stereotypies in Zoo Animals: What’s Been Done and Where Should We Go Next? Zoo Biol. 2005, 24, 499–518. [Google Scholar] [CrossRef]
- Berthier, J.M.; Semple, S. Observing Grooming Promotes Affiliation in Barbary Macaques. Proc. R. Soc. B 2018, 285, 20181964. [Google Scholar] [CrossRef]
- Aureli, F.; Yates, K. Distress Prevention by Grooming Others in Crested Black Macaques. Biol. Lett. 2010, 6, 27–29. [Google Scholar] [CrossRef] [PubMed]
- Testard, C.; Larson, S.M.; Watowich, M.M.; Kaplinsky, C.H.; Bernau, A.; Faulder, M.; Marshall, H.H.; Lehmann, J.; Ruiz-Lambides, A.; Higham, J.P. Rhesus Macaques Build New Social Connections after a Natural Disaster. Curr. Biol. 2021, 31, 2299–2309.e7. [Google Scholar] [CrossRef]
- Schaffner, C.M.; Smith, T.E. Familiarity May Buffer the Adverse Effects of Relocation on Marmosets (Callithrix kuhlii): Preliminary Evidence. Zoo Biol. 2005, 24, 93–100. [Google Scholar] [CrossRef]
- Matheson, M.D.; Fragaszy, D.M.; Johnson-Pynn, J.S. Response to Novel Housing in Two Groups of Captive Tufted Capuchin Monkeys (Cebus apella). Primates 2005, 46, 235–240. [Google Scholar] [CrossRef] [PubMed]
- Chamove, A.S.; Hosey, G.R.; Schaetzel, P. Visitors Excite Primates in Zoos. Zoo Biol. 1988, 7, 359–369. [Google Scholar] [CrossRef]
- Todd, P.A.; Macdonald, C.; Coleman, D. Visitor-Associated Variation in Captive Diana Monkey (Cercopithecus diana diana) Behaviour. Appl. Anim. Behav. Sci. 2007, 107, 162–165. [Google Scholar] [CrossRef]
- Fox, E.A.; van Schaik, C.P.; Sitompul, A.; Wright, D.N. Intra-and Interpopulational Differences in Orangutan (Pongo Pygmaeus) Activity and Diet: Implications for the Invention of Tool Use. Am. J. Phys. Anthropol. 2004, 125, 162–174. [Google Scholar] [CrossRef]
- Law, G.; Reid, A. Enriching the Lives of Bears in Zoos. Int. Zoo Yearb. 2010, 44, 65–74. [Google Scholar] [CrossRef]
- Laméris, D.W.; Berlo, E.; Sterck, E.H.M.; Bionda, T.; Kret, M.E. Low Relationship Quality Predicts Scratch Contagion during Tense Situations in Orangutans (Pongo pygmaeus). Am. J. Primatol. 2020, 82, e23138. [Google Scholar] [CrossRef]
- Troisi, A.; Schino, G.; D’Antoni, M.; Pandolfi, N.; Aureli, F.; D’Amato, F.R. Scratching as a Behavioral Index of Anxiety in Macaque Mothers. Behav. Neural Biol. 1991, 56, 307–313. [Google Scholar] [CrossRef]
- Graham, K.E.; Wilke, C.; Lahiff, N.J.; Slocombe, K.E. Scratching beneath the Surface: Intentionality in Great Ape Signal Production. Philos. Trans. R. Soc. B Biol. Sci. 2020, 375, 20180403. [Google Scholar] [CrossRef] [PubMed]
- Peignot, P.; Jankowski, F.; Anderson, J.R. On Self-Scratching in Captive Mandrills (Mandrillus sphinx). IJFP 2004, 75, 160–164. [Google Scholar] [CrossRef] [PubMed]
- Whitehouse, J.; Micheletta, J.; Waller, B.M. Stress Behaviours Buffer Macaques from Aggression. Sci. Rep. 2017, 7, 11083. [Google Scholar] [CrossRef] [PubMed]
- Kikusui, T.; Winslow, J.T.; Mori, Y. Social Buffering: Relief from Stress and Anxiety. Philos. Trans. R. Soc. B Biol. Sci. 2006, 361, 2215–2228. [Google Scholar] [CrossRef]
- Lukas, K.E.; Hoff, M.P.; Maple, T.L. Gorilla Behavior in Response to Systematic Alternation between Zoo Enclosures. Appl. Anim. Behav. Sci. 2003, 81, 367–386. [Google Scholar] [CrossRef]
- Rangel-Negrín, A.; Dias, P.A.D.; Canales-Espinosa, D. Impact of translocation on the behavior and health of black howlers. In Perspectivas en Primatología Mexicana; Gama-Campillo, L., Pozo-Montuy, G., Contreras-Sánchez, W.M., Arriaga-Weiss, S.L., Eds.; Universidad Juárez Autónoma de Tabasco: Villahermosa, Mexico, 2011; pp. 271–288. [Google Scholar]
- Johnson, B.; Langton, J. Behaviour Change in Amur Tigers Panthera tigris altaica after an Enclosure Move. J. Zoo Aquar. Res. 2021, 9, 186–192. [Google Scholar] [CrossRef]
- Tan, H.M.; Ong, S.M.; Langat, G.; Bahaman, A.R.; Sharma, R.S.K.; Sumita, S. The Influence of Enclosure Design on Diurnal Activity and Stereotypic Behaviour in Captive Malayan Sun Bears (Helarctos malayanus). Res. Vet. Sci. 2013, 94, 228–239. [Google Scholar] [CrossRef]
- Forthman, D.L.; Bakeman, R. Environmental and Social Influences on Enclosure Use and Activity Patterns of Captive Sloth Bears (Ursus ursinus). Zoo Biol. 1992, 11, 405–415. [Google Scholar] [CrossRef]
- Shepherdson, D.; Lewis, K.D.; Carlstead, K.; Bauman, J.; Perrin, N. Individual and Environmental Factors Associated with Stereotypic Behavior and Fecal Glucocorticoid Metabolite Levels in Zoo Housed Polar Bears. Appl. Anim. Behav. Sci. 2013, 147, 268–277. [Google Scholar] [CrossRef]
- Mahler, A.E. Activity Budgets and Use of Exhibit Space by South American Tapir (Tapirus terrestris) in a Zoological Park Setting. Zoo Biol. 1984, 3, 35–46. [Google Scholar] [CrossRef]
- Arumugam, K. Influence of Enclosure Conditions and Visitors on the Behavior of Captive Malayan Tapir (Tapirus indicus): Implications for Ex-Situ Management and Conservation. IJSRP 2018, 8, 22–33. [Google Scholar] [CrossRef]
- Robbins, R.L.; Sheridan, J. Effect of Enclosure Expansion on the Activity Budgets of Eastern Black-and-white Colobus Monkeys, Colobus guereza. Zoo Biol. 2021, 40, 115–123. [Google Scholar] [CrossRef] [PubMed]
- Dufour, V.; Sueur, C.; Whiten, A.; Buchanan-Smith, H.M. The Impact of Moving to a Novel Environment on Social Networks, Activity and Wellbeing in Two New World Primates. Am. J. Primatol. 2011, 73, 802–811. [Google Scholar] [CrossRef]
- Moreira, N.; Brown, J.L.; Moraes, W.; Swanson, W.F.; Monteiro-Filho, E.L.A. Effect of Housing and Environmental Enrichment on Adrenocortical Activity, Behavior and Reproductive Cyclicity in the Female Tigrina (Leopardus tigrinus) and Margay (Leopardus wiedii). Zoo Biol. 2007, 26, 441–460. [Google Scholar] [CrossRef] [PubMed]
- Anderson, M.R. Reaching New Heights: The Effect of an Environmentally Enhanced Outdoor Enclosure on Gibbons in a Zoo Setting. J. Appl. Anim. Welf. Sci. 2014, 17, 216–227. [Google Scholar] [CrossRef]
- Newman, R.; McKeown, S.; Quirke, T.; O’Riordan, R.M. The Effect of a New Enclosure on the Behaviour of a Large Captive Group of Lion-Tailed Macaques Macaca Silenus. J. Zoo Aquar. Res. 2021, 9, 20–25. [Google Scholar] [CrossRef]
- Roberts, K.; Hemmings, A.J.; McBride, S.D.; Parker, M.O. Causal Factors of Oral versus Locomotor Stereotypy in the Horse. J. Vet. Behav. 2017, 20, 37–43. [Google Scholar] [CrossRef]
- Greco, B.J.; Meehan, C.L.; Heinsius, J.L.; Mench, J.A. Why Pace? The Influence of Social, Housing, Management, Life History, and Demographic Characteristics on Locomotor Stereotypy in Zoo Elephants. Appl. Anim. Behav. Sci. 2017, 194, 104–111. [Google Scholar] [CrossRef]
- Rose, P.; Roffe, S.; Jermy, M. Enrichment Methods Used for Tapirus indicus (Malayan tapir) at The East Midland Zoological Society: Twycross Zoo. Ratel 2006, 22, 8–13. [Google Scholar]
- Hosey, G. A Preliminary Model of Human–Animal Relationships in the Zoo. Appl. Anim. Behav. Sci. 2008, 109, 105–127. [Google Scholar] [CrossRef]
- Hosey, G.; Melfi, V. Are We Ignoring Neutral and Negative Human-Animal Relationships in Zoos? Zoo Biol. 2015, 34, 1–8. [Google Scholar] [CrossRef] [PubMed]
- Claxton, A.M. The Potential of the Human-Animal Relationship as an Environmental Enrichment for the Welfare of Zoo-Housed Animals. Appl. Anim. Behav. Sci. 2011, 133, 1–10. [Google Scholar] [CrossRef]
- Escobar-Ibarra, I.; Mota-Rojas, D.; Gual-Sill, F.; Sánchez, C.R.; Baschetto, F.; Alonso-Spilsbury, M. Conservation, Animal Behaviour, and Human-Animal Relationship in Zoos. Why Is Animal Welfare so Important? J. Anim. Behav. Biometeorol. 2021, 9, 1–17. [Google Scholar] [CrossRef]
- Hosey, G.; Birke, L.; Shaw, W.S.; Melfi, V. Measuring the Strength of Human–Animal Bonds in Zoos. Anthrozoös 2018, 31, 273–281. [Google Scholar] [CrossRef]
- Hosey, G.; Melfi, V. Human-Animal Bonds Between Zoo Professionals and the Animals in Their Care: Human-Animal Bonds in Zoos. Zoo Biol. 2012, 31, 13–26. [Google Scholar] [CrossRef]
- Patel, F.; Whitehouse-Tedd, K.; Ward, S. Redefining Human-Animal Relationships: An Evaluation of Methods to Allow Their Empirical Measurement in Zoos. Anim. Welf. 2019, 28, 247–259. [Google Scholar] [CrossRef]
- Carlstead, K. A Comparative Approach to the Study of Keeper-Animal Relationships in the Zoo. Zoo Biol. 2009, 28, 589–608. [Google Scholar] [CrossRef]
- Krebs, B.L.; Marrin, D.; Phelps, A.; Krol, L.; Watters, J.V. Managing Aged Animals in Zoos to Promote Positive Welfare: A Review and Future Directions. Animals 2018, 8, 116. [Google Scholar] [CrossRef]
- Ritzler, C.P.; Lukas, K.E.; Bernstein-Kurtycz, L.M.; Koester, D.C. The Effects of Choice-Based Design and Management on the Behavior and Space Use of Zoo-Housed Amur Tigers (Panthera tigris altaica). Appl. Anim. Welf. Sci. 2021, 6, 1–14. [Google Scholar] [CrossRef]
- Ross, S.R. Issues of Choice and Control in the Behaviour of a Pair of Captive Polar Bears (Ursus maritimus). Behav. Processes 2006, 73, 117–120. [Google Scholar] [CrossRef]
- Davey, G. Visitor Behavior in Zoos: A Review. Anthrozoös 2006, 19, 143–157. [Google Scholar] [CrossRef]
- Fàbregas, M.C.; Guillén-Salazar, F.; Garcés-Narro, C. Do Naturalistic Enclosures Provide Suitable Environments for Zoo Animals? Suitability in Naturalistic Enclosures. Zoo Biol. 2012, 31, 362–373. [Google Scholar] [CrossRef]
- Ozella, L.; Anfossi, L.; Di Nardo, F.; Pessani, D. Effect of Weather Conditions and Presence of Visitors on Adrenocortical Activity in Captive African Penguins (Spheniscus demersus). Gen. Comp. Endocrinol. 2017, 242, 49–58. [Google Scholar] [CrossRef] [PubMed]
- Posta, B.; Huber, R.; Moore III, D.E. The Effects of Housing on Zoo Elephant Behavior: A Quantitative Case Study of Diurnal and Seasonal Variation. Int. J. Comp. Psychol. 2013, 26, 37–52. [Google Scholar] [CrossRef]
- Rose, P.E.; Croft, D.P. Social Bonds in a Flock Bird: Species Differences and Seasonality in Social Structure in Captive Flamingo Flocks over a 12-Month Period. Appl. Anim. Behav. Sci. 2017, 193, 87–97. [Google Scholar] [CrossRef]
- Carlstead, K.; Seidensticker, J. Seasonal Variation in Stereotypic Pacing in an American Black Bear Ursus americanus. Behav. Processes 1991, 25, 155–161. [Google Scholar] [CrossRef]
- Watters, J.V.; Margulis, S.W.; Atsalis, S. Behavioral Monitoring in Zoos and Aquariums: A Tool for Guiding Husbandry and Directing Research. Zoo Biol. 2009, 28, 35–48. [Google Scholar] [CrossRef]
- Iredale, S.K.; Nevill, C.H.; Lutz, C.K. The Influence of Observer Presence on Baboon (Papio spp.) and Rhesus Macaque (Macaca mulatta) Behavior. Appl. Anim. Behav. Sci. 2010, 122, 53–57. [Google Scholar] [CrossRef]
- Sherwen, S.L.; Hemsworth, P.H. The Visitor Effect on Zoo Animals: Implications and Opportunities for Zoo Animal Welfare. Animals 2019, 9, 366. [Google Scholar] [CrossRef]
- Hashmi, A.; Sullivan, M. The Visitor Effect in Zoo-Housed Apes: The Variable Effect on Behaviour of Visitor Number and Noise. J. Zoo Aquar. Res. 2020, 8, 268–282. [Google Scholar] [CrossRef]
- Finch, K.; Leary, M.; Holmes, L.; Williams, L.J. Zoo Closure Does Not Affect Behavior and Activity Patterns of Palawan Binturong (Arctictis binturong whitei). J. Zool. Bot. Gard. 2022, 3, 398–408. [Google Scholar] [CrossRef]
- Goodenough, A.E.; McDonald, K.; Moody, K.; Wheeler, C. Are “Visitor Effects” Overestimated? Behaviour in Captive Lemurs Is Mainly Driven by Co-Variation with Time and Weather. J. Zoo Aquar. Res. 2019, 7, 59–66. [Google Scholar] [CrossRef]


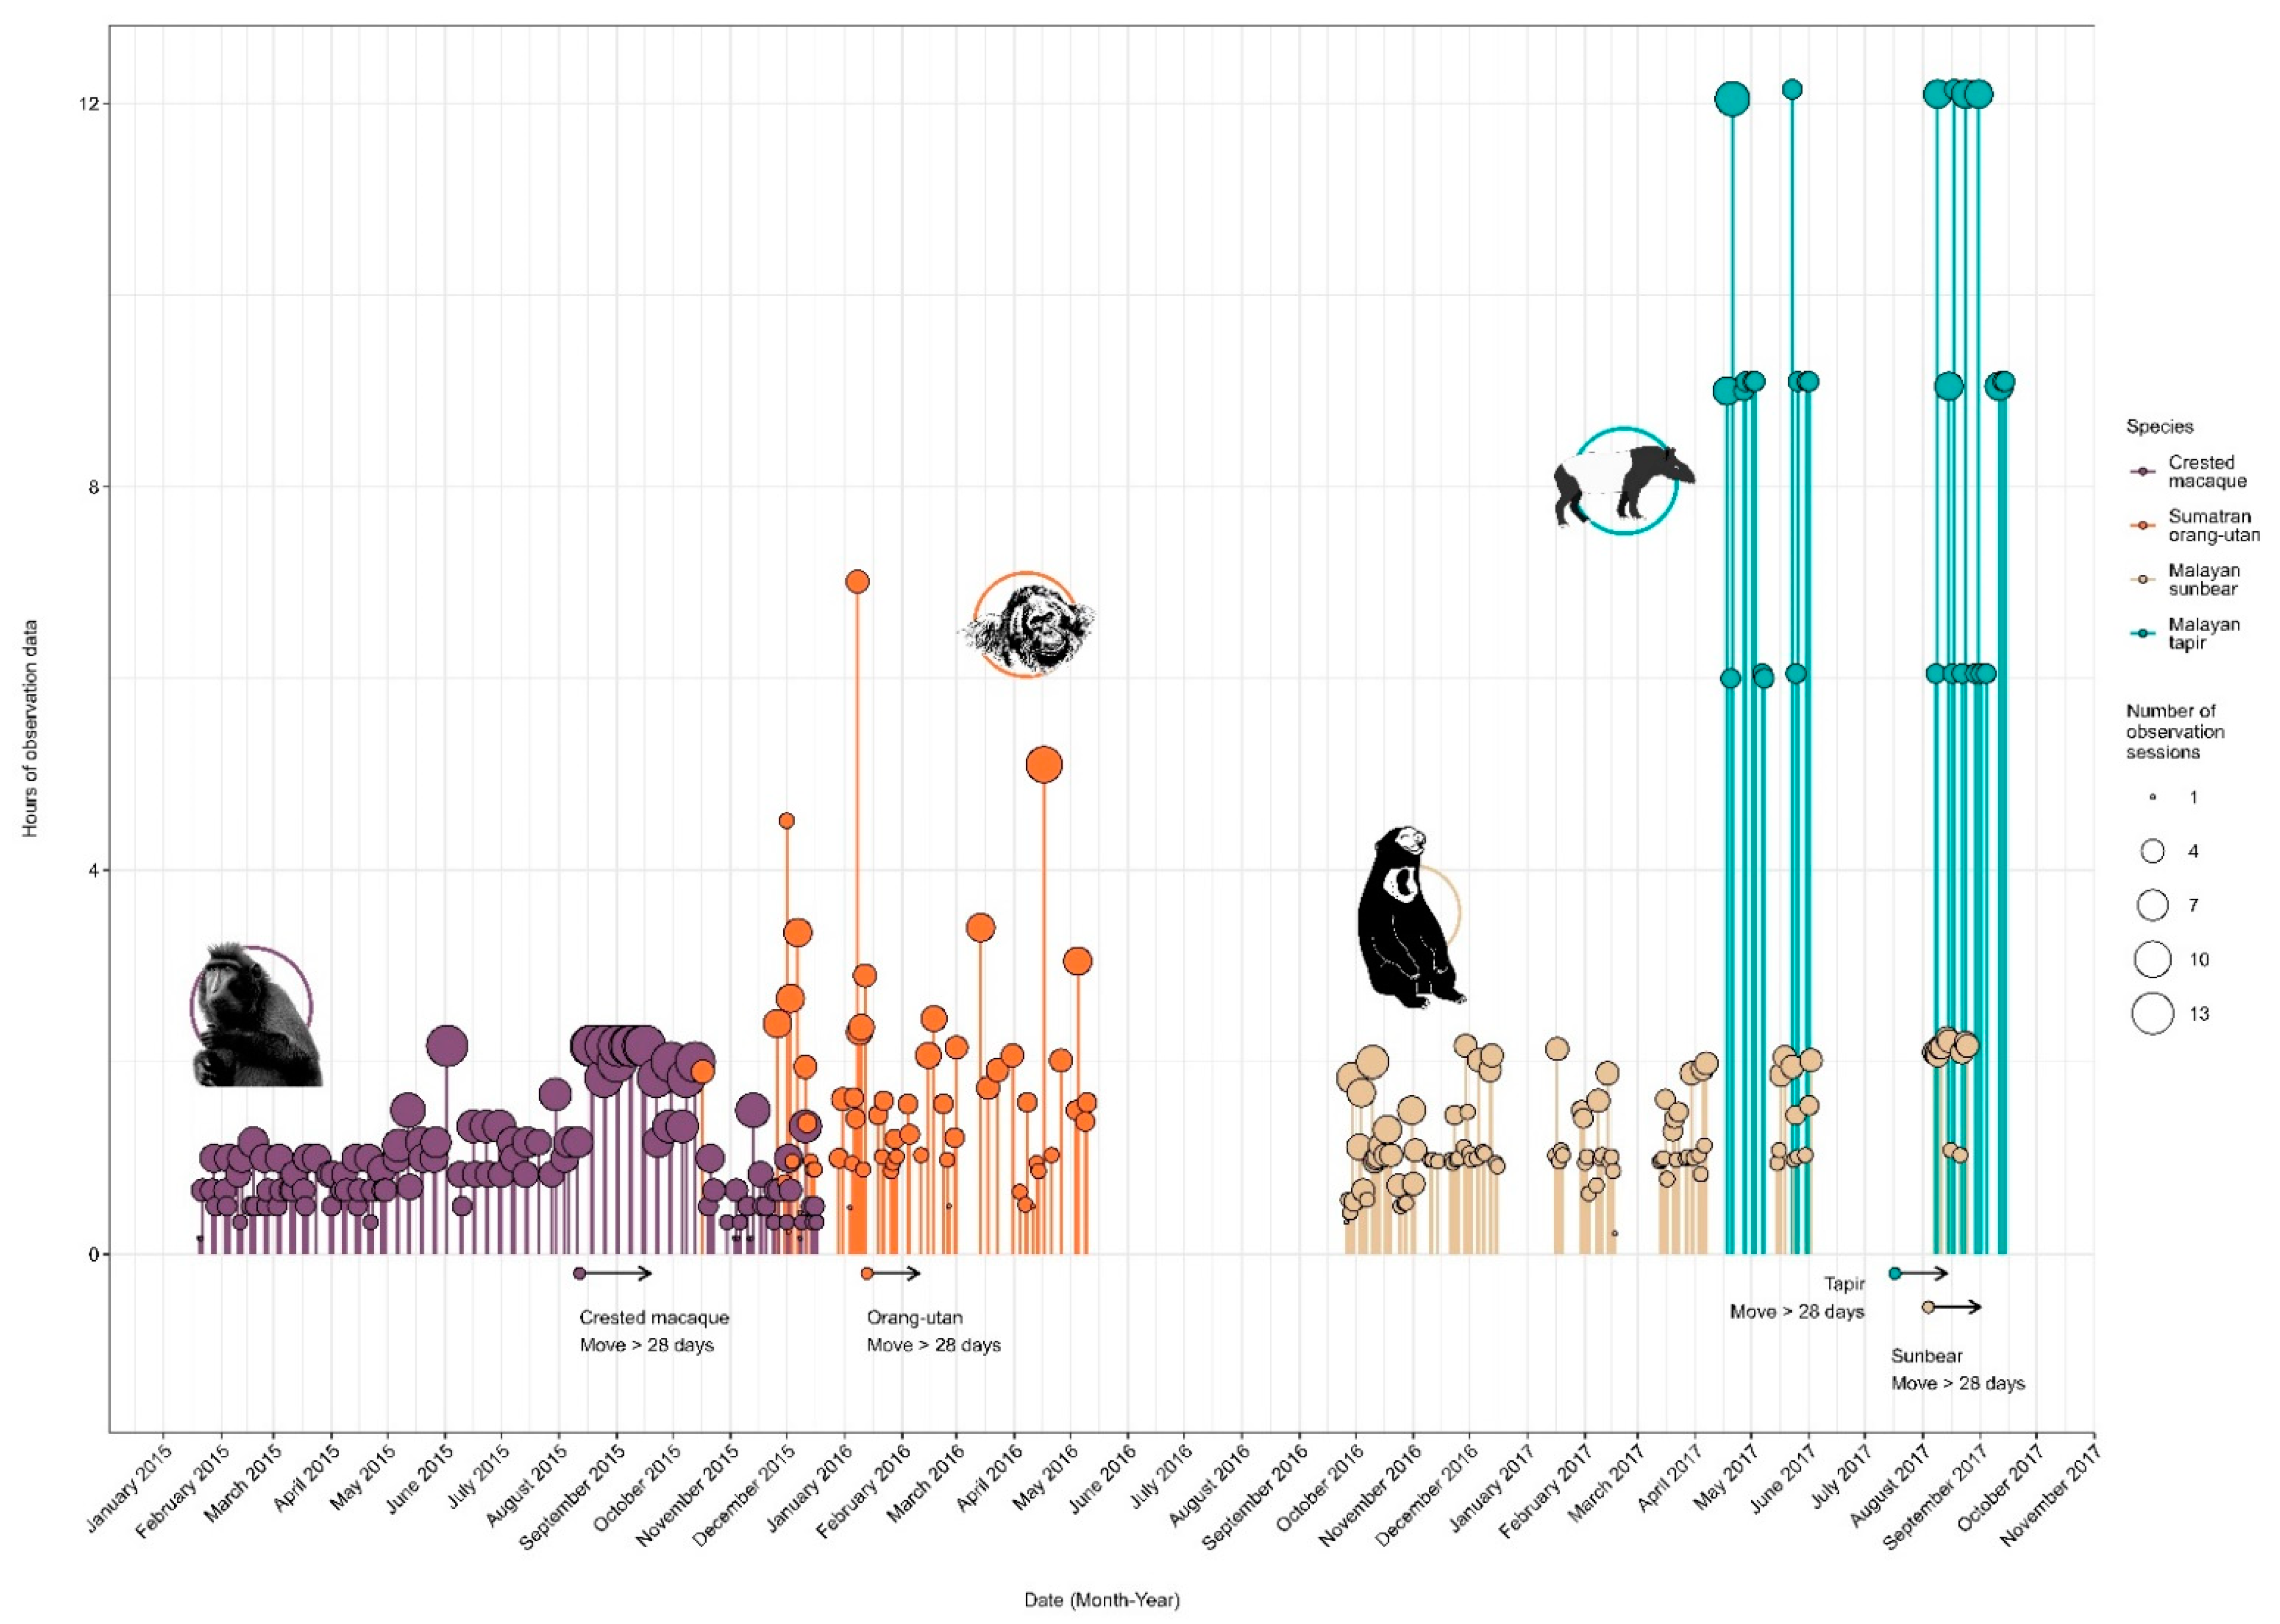
| Species | Adult | Sub-Adult | Moving Date (Y-M-D) | Pre-Move Data Collection | Post-Move Data Collection | ||
|---|---|---|---|---|---|---|---|
| ♀ | ♂ | ♀ | ♂ | ||||
| Sumatran orangutan | 3 | 1 | 1 | 1 | 13 January 2016 | 17 October 2015 to 12 January 2016 | 19 January 2016 to 10 May 2016 |
| Crested macaque | 8 | 3 | 2 | 0 | 12 August 2015 | 14 January 2015 to 11 August 2015 | 18 August 2015 to 17 December 2015 |
| Malayan sun bear | 1 | 1 | 0 | 0 | 4 August 2017 | 21 November 2016 to 2 June 2017 | 7 August 2017 to 31 August 2017 |
| Malayan tapir | 1 | 1 | 1 | 0 | 17 July 2017 | 18 April 2017 to 1 June 2017 | 8 August 2017 to 14 September 2017 |
| Behavioural Category | Cross-Species Definition |
|---|---|
| Abnormal | Any repetitive, unnatural, or stereotypical behaviours that show no obvious goal or function to the individual: Includes pacing, window licking, over-grooming, self-directed aggression, head swaying/throwing. |
| Autogroom | An individual picking, licking, scratching, biting, rubbing, or slow-brushing their own body. |
| Explore | Investigating and/or searching for things inside the enclosure: includes sniffing, scratching, staring and digging. |
| Feed | Ingesting food. |
| Forage | Actively searching for and/or manipulating food. |
| Interaction with humans | Move and/or direct attention towards human(s): Includes keepers and visitors and often involves eye-contact. |
| Locomotion | Moving from one place to another: Includes climbing, swimming and bi/quadrupedal movement. |
| Object manipulation | Actively or passively touching, playing with, sniffing, or otherwise engaging with an object: Includes nest-building and engagement with enrichment items/puzzle feeders. |
| Other | Any behaviour not subsumed in the other categories: includes excretion and vocalisation. |
| Play | Excitable, non-aggressive, playful behaviour: includes running, pursuit, mock-fighting, bucking and leaping. Can be alone or with another individual. |
| Rest | Individual is observed sitting, lying, or standing without movement. |
| Negative social interaction with conspecific | Aggressive and/or threatening behaviour between individuals. Includes slapping, hitting, displacement, charging and antagonistic facial expressions. |
| Positive social interaction with conspecific | Affiliative behaviour between individuals: Includes allogrooming, maternal behaviour, contact-sitting, nuzzling, mating and affiliative facial expressions. |
| Vigilance | Individual is observing/scanning and aware of surroundings; eyes and/or head in movement. |
| Not visible | Individual is not visible from observer’s viewing position. |
| Species | Number of Sampling Points (Hours:Minutes) | |||
|---|---|---|---|---|
| Pre-Move | Early-Post | Post-Move | Total | |
| Sumatran orangutan | 2894 (48:14) | 678 (11:18) | 2594 (43:14) | 6166 (102:46) |
| Crested macaque | 3916 (65:16) | 1111 (18:31) | 2046 (34:06) | 7073 (117:53) |
| Malayan sun bear | 6762 (112:42) | 1459 (24:19) | 0 (0:0) | 8221 (137:01) |
| Malayan tapir | 7305 (121:45) | 1098 (18:18) | 6222 (103:42) | 14,6225 (243:45) |
| Total | 20,877 (347:57) | 4346 (72:26) | 10,862 (181:02) | 36,085 (601:25) |
Publisher’s Note: MDPI stays neutral with regard to jurisdictional claims in published maps and institutional affiliations. |
© 2022 by the authors. Licensee MDPI, Basel, Switzerland. This article is an open access article distributed under the terms and conditions of the Creative Commons Attribution (CC BY) license (https://creativecommons.org/licenses/by/4.0/).
Share and Cite
Finch, K.; Waterman, J.O.; Cowl, V.B.; Marshall, A.; Underwood, L.; Williams, L.J.; Davis, N.; Holmes, L. Island Life: Use of Activity Budgets and Visibility to Evaluate a Multi-Species Within-Zoo Exhibit Move. Animals 2022, 12, 2123. https://doi.org/10.3390/ani12162123
Finch K, Waterman JO, Cowl VB, Marshall A, Underwood L, Williams LJ, Davis N, Holmes L. Island Life: Use of Activity Budgets and Visibility to Evaluate a Multi-Species Within-Zoo Exhibit Move. Animals. 2022; 12(16):2123. https://doi.org/10.3390/ani12162123
Chicago/Turabian StyleFinch, Katherine, James O. Waterman, Veronica B. Cowl, Ashleigh Marshall, Lydia Underwood, Leah J. Williams, Nick Davis, and Lisa Holmes. 2022. "Island Life: Use of Activity Budgets and Visibility to Evaluate a Multi-Species Within-Zoo Exhibit Move" Animals 12, no. 16: 2123. https://doi.org/10.3390/ani12162123