
Mapping of the Thermal Microenvironment for Dairy Cows in an Open Compost-Bedded Pack Barn System with Positive-Pressure Ventilation

 ,
,  , ,
, ,  , and
, and 
Abstract
:Simple Summary
Abstract
1. Introduction
2. Materials and Methods
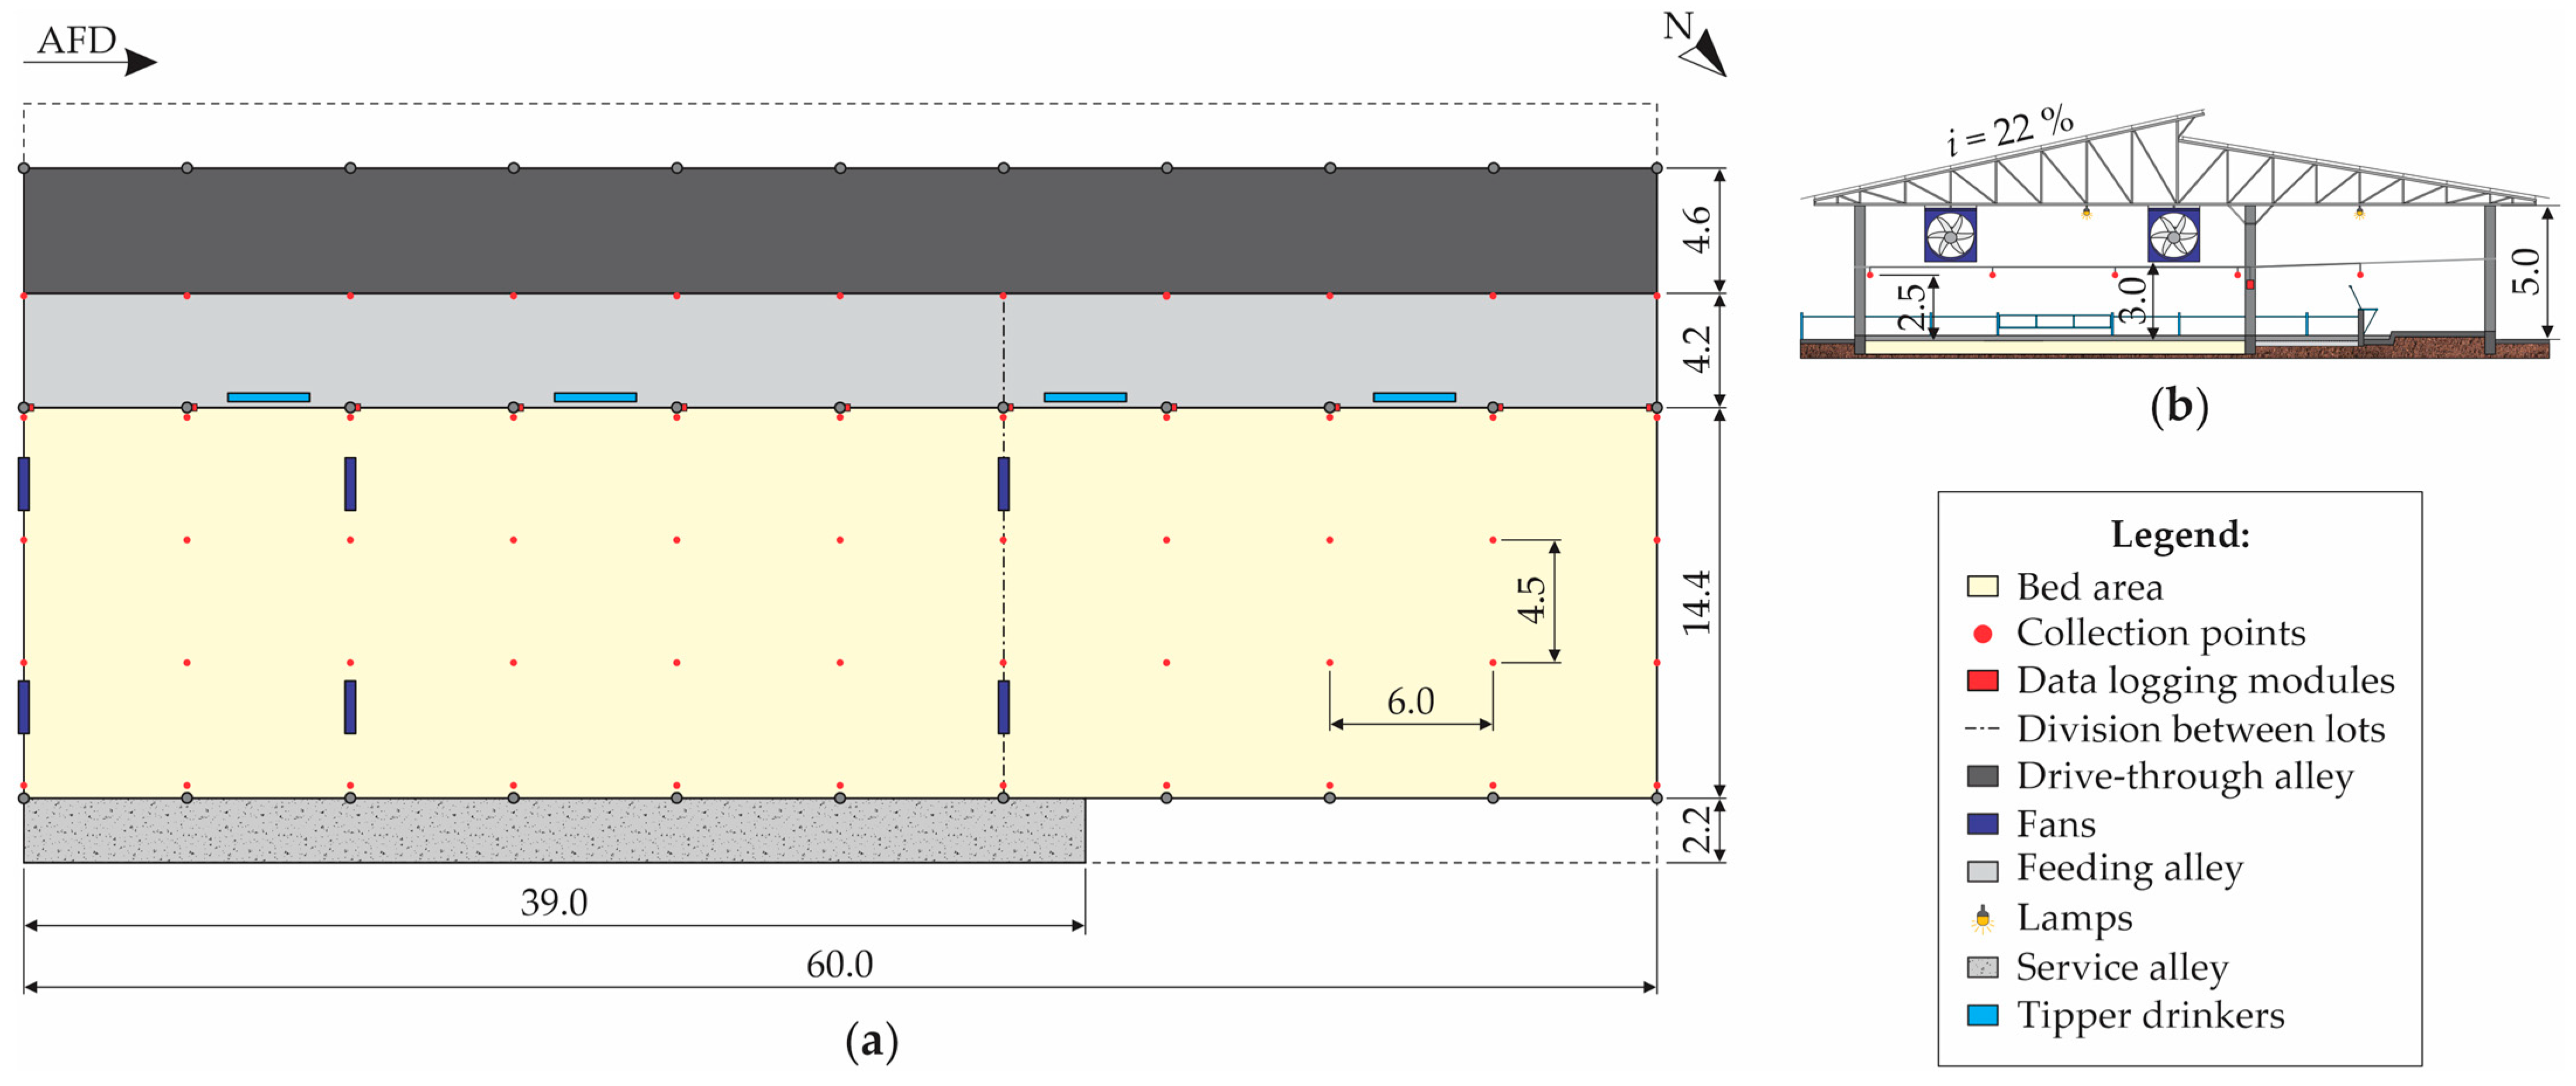
2.1. Characterization of the Facility and Management Techniques
2.2. Microclimatic Data Acquisition System
2.3. Thermal Comfort Evaluation
2.4. Statistical Analyses
2.4.1. Descriptive Analysis of Environmental Data
2.4.2. Analysis of Variability and Spatial Distribution
3. Results and Discussion
4. Conclusions
Author Contributions
Funding
Institutional Review Board Statement
Informed Consent Statement
Data Availability Statement
Acknowledgments
Conflicts of Interest
References
- Perissinotto, M.; Moura, D.J. Determinação do conforto térmico de vacas leiteiras utilizando a mineração de dados. Rev. Bras. Eng. Biossistemas 2007, 1, 117–126. [Google Scholar] [CrossRef]
- Damasceno, F.A. Compost Barn Como Uma Alternativa para a Pecuária Leiteira, 1st ed.; Adelante: Divinópolis, Brazil, 2020; p. 396. [Google Scholar]
- Passetti, R.A.C.; Eiras, C.E.; Gomes, L.C.; Santos, J.F.; Prado, I.N. Intensive dairy farming systems from Holland and Brazil: SWOT analyse comparison. Acta Sci. Anim. Sci. 2016, 38, 439–446. [Google Scholar] [CrossRef]
- Mee, J.F.; Boyle, L.A. Assessing whether dairy cow welfare is “better” in pasture-based than in confinement-based management systems. N. Z. Vet. J. 2020, 68, 168–177. [Google Scholar] [CrossRef] [PubMed]
- Galama, P.J.; Ouweltjes, W.; Endres, M.I.; Sprecher, J.R.; Leso, L.; Kuipers, A.; Klopčič, M. Symposium review: Future of housing for dairy cattle. J. Dairy Sci. 2020, 103, 5759–5772. [Google Scholar] [CrossRef]
- Bewley, J.M.; Robertson, L.M.; Eckelkamp, E.A. A 100-year review: Lactating dairy cattle housing management. J. Dairy Sci. 2017, 100, 10418–10431. [Google Scholar] [CrossRef]
- Leso, L.; Pellegrini, P.; Barbari, M. Effect of two housing systems on performance and longevity of dairy cows in Northern Italy. Agron. Res. 2019, 17, 574–581. [Google Scholar] [CrossRef]
- Leso, L.; Barbari, M.; Lopes, M.A.; Damasceno, F.A.; Galama, P.; Taraba, J.L.; Kuipers, A. Invited review: Compost-bedded pack barns for dairy cows. J. Dairy Sci. 2020, 103, 1072–1099. [Google Scholar] [CrossRef]
- Pilatti, J.A.; Vieira, F.M.C. Environment, behavior and welfare aspects of dairy cows reared in compost bedded pack barns system. J. Anim. Behav. Biometeorol. 2017, 5, 97–105. [Google Scholar] [CrossRef]
- Damasceno, F.A.; Oliveira, C.E.A.; Ferraz, G.A.S.; Nascimento, J.A.C.; Barbari, M.; Ferraz, P.F.P. Spatial distribution of thermal variables, acoustics and lighting in compost dairy barn with climate control system. Agron. Res. 2019, 17, 385–395. [Google Scholar] [CrossRef]
- Andrade, R.R.; Tinôco, I.F.F.; Damasceno, F.A.; Ferraz, G.A.S.; Freitas, L.C.S.R.; Ferreira, C.F.S.; Barbari, M.; Baptista, F.J.F.; Coelho, D.J.R. Spatial distribution of bed variables, animal welfare indicators, and milk production in a closed compost-bedded pack barn with a negative tunnel ventilation system. J. Therm. Biol. 2021, 23, 103111. [Google Scholar] [CrossRef]
- Sales, F.A.; Barbosa Filho, J.A.D.; Aquino, T.M.F.; Brito, I.F.; Carvalho, L.E. Monitoramento ambiental do perfil horizontal de um galpão para suínos, na fase de gestação, utilizando zootecnia de precisão. R. Cient. Prod. Anim. 2011, 13, 7–12. [Google Scholar] [CrossRef]
- Faria, F.F.; Moura, D.J.; Souza, Z.M.; Matarazzo, S.V. Variabilidade espacial do microclima de um galpão utilizado para confinamento de bovinos de leite. Cienc. Rural 2008, 38, 2498–2505. [Google Scholar] [CrossRef]
- Perissinotto, M.; Moura, D.J.; Cruz, V.F.; Souza, S.R.L.; Lima, K.A.O.; Mendes, A.S. Conforto térmico de bovinos leiteiros confinados em clima subtropical e mediterrâneo pela análise de parâmetros fisiológicos utilizando a teoria dos conjuntos fuzzy. Cienc. Rural 2009, 39, 1492–1498. [Google Scholar] [CrossRef]
- Baêta, F.C.; Souza, C.F. Ambiência em Edificações Rurais: Conforto Térmico, 2nd ed.; Editora UFV: Viçosa, Brazil, 2010; p. 269. [Google Scholar]
- Rodrigues, V.C.; Silva, I.J.O.; Vieira, F.M.C.; Nascimento, S.T. A correct enthalpy relationship as thermal comfort index for livestock. Int. J. Biometeorol. 2011, 55, 455–459. [Google Scholar] [CrossRef]
- Castro Júnior, S.L.; Silva, I.J.O. The specific enthalpy of air as an indicator of heat stress in livestock animals. Int. J. Biometeorol. 2021, 65, 149–161. [Google Scholar] [CrossRef]
- Borges, G.; Miranda, K.O.S.; Rodrigues, V.C.; Risi, N. Uso da geoestatística para avaliar a captação automática dos níveis de pressão sonora em instalações de creche para suínos. Eng. Agrícola 2010, 30, 377–385. [Google Scholar] [CrossRef]
- Cambardella, C.A.; Elliott, E.T. Particulate soil organic-matter changes across a grassland cultivation sequence. Soil Sci. Soc. Am. J. 1992, 56, 777–783. [Google Scholar] [CrossRef]
- Medeiros, B.B.L.; De Moura, D.J.; Massari, J.M.; Curi, T.M.R.; De, C.; Maia, A.P.D.A. Uso da geoestatística na avaliação de variáveis ambientais em galpão de suínos criados em sistema “wean to finish” na fase de terminação. Eng. Agrícola 2014, 34, 800–811. [Google Scholar] [CrossRef]
- Oliveira, C.E.A.; Damasceno, F.A.; Ferraz, P.F.P.; Nascimento, J.A.C.; Ferraz, G.A.S.; Barbari, M. Geostatistics applied to evaluation of thermal conditions and noise in compost dairy barns with different ventilation systems. Agron. Res. 2019, 17, 783–796. [Google Scholar] [CrossRef]
- Silva, M.V.; Pandorfi, H.; Almeida, G.L.P.; Jardim, A.M.R.F.; Batista, P.H.D.; Silva, R.A.B.; Lopes, I.; Oliveira, M.E.G.; Silva, J.L.B.; Moraes, A.S. Spatial variability and exploratory inference of abiotic factors in barn compost confinement for cattle in the semiarid. J. Therm. Biol. 2020, 94, 102782. [Google Scholar] [CrossRef]
- Oliveira, C.E.A.; Damasceno, F.A.; Ferraz, G.A.S.; Nascimento, J.A.C.; Vega, F.A.O.; Titôco, I.F.F.; Andrade, R.R. Assessment of spatial variability of bedding variables in compost bedded pack barns with climate control system. An. Acad. Bras. Cienc. 2021, 93, 20200384. [Google Scholar] [CrossRef] [PubMed]
- Vieira, F.M.C.; Soares, A.A.; Herbut, P.; Vismara, E.S.; Godyń, D.; Dos Santos, A.C.Z.; Lambertes, T.S.; Caetano, W.F. Spatio-thermal variability and behaviour as bio-thermal indicators of heat stress in dairy cows in a Compost Barn: A case study. Animals 2021, 11, 1197. [Google Scholar] [CrossRef] [PubMed]
- Sá Júnior, A.; Carvalho, L.G.; Silva, F.F.; Alves, M.C. Application of the Köppen classification for climatic zoning in the state of Minas Gerais, Brazil. Theor. Appl. Climatol. 2012, 108, 1–7. [Google Scholar] [CrossRef]
- Freitas, L.C.S.R.; Tinôco, I.F.F.; Gates, R.S.; Barbari, M.; Cândido, M.G.L.; Toledo, J.V. Development and validation of a data logger for thermal characterization in laying hen facilities. Rev. Bras. Eng. Agric. Ambient. 2019, 23, 787–793. [Google Scholar] [CrossRef]
- Andrade, R.R.; Tinôco, I.F.F.; Damasceno, F.A.; Ferraz, G.A.S.; Freitas, L.C.S.R.; Ferreira, C.F.S.; Barbari, M.; Teles Junior, C.G.S. Spatial analysis of microclimatic variables in compost-bedded pack barn with evaporative tunnel cooling. An. Acad. Bras. Cienc. 2022, 94, e20210226. [Google Scholar] [CrossRef]
- Berman, A.; Folman, Y.; Kaim, M.; Mamen, M.; Herz, Z.; Wolfenson, D.; Arieli, A.; Graber, Y. Upper critical temperatures and forced ventilation effects for high-yielding dairy cows in a subtropical climate. J. Dairy Sci. 1985, 68, 1488–1495. [Google Scholar] [CrossRef]
- Nääs, I.A. Princípios de Conforto Térmico na Produção Animal, 1st ed.; Editora Ícone: São Paulo, Brazil, 1989; p. 183. [Google Scholar]
- Bucklin, R.A.; Turner, L.W.; Beede, D.K.; Bray, D.R.; Hemken, R.W. Methods to relieve heat stress for dairy cows in hot, humid climates. Appl. Eng. Agric. 1991, 7, 241–247. [Google Scholar] [CrossRef]
- Igono, M.O.; Bjotvedt, G.; Sanford-Crane, H.T. Environmental profile and critical temperature effects on milk production of Holstein cows in desert climate. Int. J. Biometeorol. 1992, 36, 77–87. [Google Scholar] [CrossRef]
- Cortez, L.A.B.; Magalhães, P.S.G. Introdução à Engenharia Agrícola, 1st ed.; Editora Unicamp: Campinas, Brazil, 1993; p. 393. [Google Scholar]
- Roenfeldt, S. You can‘t afford to ignore heat stress. Dairy Herd. Manag. 1998, 35, 6–12. [Google Scholar]
- West, J.W. Effects of heat-stress on production in dairy cattle. J. Dairy Sci. 2003, 86, 2131–2144. [Google Scholar] [CrossRef]
- Mader, T.L.; Davis, M.S.; Brown-Brandl, T. Environmental factors influencing heat stress in feedlot cattle. J. Anim. Sci. 2006, 84, 712–719. [Google Scholar] [CrossRef] [PubMed]
- Warrick, W.A.; Nielsen, D.R. Spatial variability of soil physical properties in the field. In Application of Soil Physics, 1st ed.; Hillel, D., Ed.; Academic Press: New York, NY, USA, 1980; pp. 319–344. [Google Scholar]
- R Development Core Team. R: A Language and Environment for Statistical Computing; R Foundation for Statistical Computing: Vienna, Austria, 2016. [Google Scholar]
- Ribeiro Júnior, P.J.; Diggle, P.J. GeoR: A package for geostatistical analysis. R News 2011, 1, 14–18. [Google Scholar]
- Matheron, G. Traité de Géostatistique Appliquée, 14th ed.; Editions Technip: Paris, France, 1962; p. 333. [Google Scholar]
- Vieira, S.R.; Carvalho, J.R.P.; González, A.P. Jack knifing for semivariogram validation. Bragantia 2010, 69, 97–105. [Google Scholar] [CrossRef]
- Isaaks, E.H.; Srivastava, R.M. An Introduction to Applied Geostatistics; Oxford University Press: New York, NY, USA, 1989; p. 561. [Google Scholar]
- Cambardella, C.A.; Moorman, T.B.; Novak, J.M.; Parkin, T.B.; Karlen, D.L.; Turco, R.F.; Konopka, A.E. Field-scale variability of soil properties in central Iowa soils. Soil Sci. Soc. Am. J. 1994, 58, 1501–1511. [Google Scholar] [CrossRef]
- Endres, M.; Lobeck, K.; Janni, K.; Godden, S.; Fetrow, J. Barn environment study. In Minnesota Dairy Health Conference; University of Minnesota Press: St. Paul, MN, USA, 2011; pp. 47–56. [Google Scholar]
- Rosenberg, N.J.; Blad, B.L.; Verma, S.B. Human and animal biometeorology. In Microclimate: The Biological Environment, 2nd ed.; Wiley-Interscience Publication: New York, NY, USA, 1983. [Google Scholar]
- Akyuz, A.; Boyaci, S.; Cayli, A. Determination of critical period for dairy cows using temperature humidity index. J. Anim. Vet. Adv. 2010, 9, 1824–1827. [Google Scholar] [CrossRef]
- Mondaca, M.R.; Choi, C.Y.; Cook, N.B. Understanding microenvironments within tunnel-ventilated dairy cow freestall facilities: Examination using computational fluid dynamics and experimental validation. Biosyst. Eng. 2019, 183, 70–84. [Google Scholar] [CrossRef]
- Ferreira, R.A. Maior Produção com Melhor Ambiente para Aves, Suínos e Bovinos, 3rd ed.; Editora Aprenda Fácil: Viçosa, MG, Brazil, 2016; p. 528. [Google Scholar]
- Black, R.A.; Taraba, J.L.; Day, G.B.; Damasceno, F.A.; Newman, M.C.; Akers, K.A.; Wood, C.L.; Mcquerry, K.J.; Bewley, J.M. The relationship between compost bedded pack performance, management, and bacterial counts. J. Dairy Sci. 2014, 97, 2669–2679. [Google Scholar] [CrossRef]
- Pilatti, J.A.; Vieira, F.M.C.; Rankrape, F.; Vismara, E.S. Diurnal behaviors and herd characteristics of dairy cows housed in a compost-bedded pack barn system under hot and humid conditions. Animal 2019, 13, 399–406. [Google Scholar] [CrossRef]
- Little, T.M.; Hills, F.J. Agricultural Experimentation: Design and Analysis, 1st ed.; John Wiley & Sons: Hoboken, NJ, USA, 1978; p. 368. [Google Scholar]
- Webster, R.; Oliver, M.A. Geostatistics for Environmental Scientists, 2nd ed.; John Wiley & Sons: Chichester, West Sussex, 2007; p. 315. [Google Scholar]
- Ferraz, G.A.S.; Silva, F.M.; Oliveira, M.S.; Custódio, A.A.P.; Ferraz, P.F.P. Variabilidade espacial dos atributos da planta de uma lavoura cafeeira. Cienc. Agron. 2017, 48, 91. [Google Scholar] [CrossRef]
- Trangmar, B.B.; Yost, R.S.; Uehara, G. Application of geostatistics to spatial studies of soil properties. Adv. Agron. 1986, 38, 45–94. [Google Scholar] [CrossRef]
- Curi, T.M.R.C.; Conti, D.; Vercellino, R.A.; Massari, J.M.; Moura, D.J.; Souza, Z.M.; Montanari, R. Positioning of sensors for control of ventilation systems in broiler houses: A case study. Sci. Agric. 2017, 74, 101–109. [Google Scholar] [CrossRef]
- Andriotti, J.L.S. Fundamentos de Estatística e Geoestatística, 1st ed.; Editora Unisinos: São Leopoldo, RS, Brasil, 2003; p. 165. [Google Scholar]
- Ferraz, P.F.P.; Yanagi Junior, T.; Ferraz, G.A.S.; Damasceno, F.A. Distribuição espacial do índice de temperatura do globo e umidade em galpão de frangos na primeira semana de vida aquecido por fornalha industrial. Energia Agric. 2017, 32, 356–363. [Google Scholar] [CrossRef]
- Black, R.A.; Taraba, J.L.; Day, G.B.; Damasceno, F.A.; Bewley, J.M. Compost bedded pack dairy barn management, performance, and producer satisfaction. J. Dairy Sci. 2013, 96, 8060–8074. [Google Scholar] [CrossRef] [PubMed]
- Abreu, P.G.; Abreu, V.M.N. Ventilação na Avicultura de Corte, 1st ed.; Embrapa Suínos e Aves: Concórdia, SC, Brasil, 2000; p. 50. [Google Scholar]
- Mota, V.C.; Andrade, E.T.; Leite, D.F. Caracterização da variabilidade espacial dos índices de conforto animal em sistemas de confinamento Compost Barn. Pubvet 2019, 13, 170. [Google Scholar] [CrossRef]


| tdb (°C) | RH (%) | THI | h (kJ·kg of dry air−1) | Classification |
|---|---|---|---|---|
| tdb < 4.0 | RH < 30.0 | THI < 46.0 | h < 8.0 | Critical zone |
| 4.0 ≤ tdb < 12.0 | 30.0 ≤ RH < 50.0 | 46.0 ≤ THI < 55.0 | 8.0 ≤ h < 24.0 | Thermoneutral zone |
| 12.0 ≤ tdb < 18.0 | 50.0 ≤ RH < 60.0 | 55.0 ≤ THI < 63.0 | 24.0 ≤ h < 39.0 | Optimal zone |
| 18.0 ≤ tdb < 24.0 | 60.0 ≤ RH < 75.0 | 63.0 ≤ THI < 74.0 | 39 ≤ h < 62.0 | Thermoneutral zone |
| tdb ≥ 24.0 | RH ≥ 75.0 | THI ≥ 74.0 | h ≥ 62.0 | Critical zone |
| Variable | Period | Mean | Median | Minimum | Maximum | Standard Deviation | Coefficient of Variation | Kurtosis | Skewness |
|---|---|---|---|---|---|---|---|---|---|
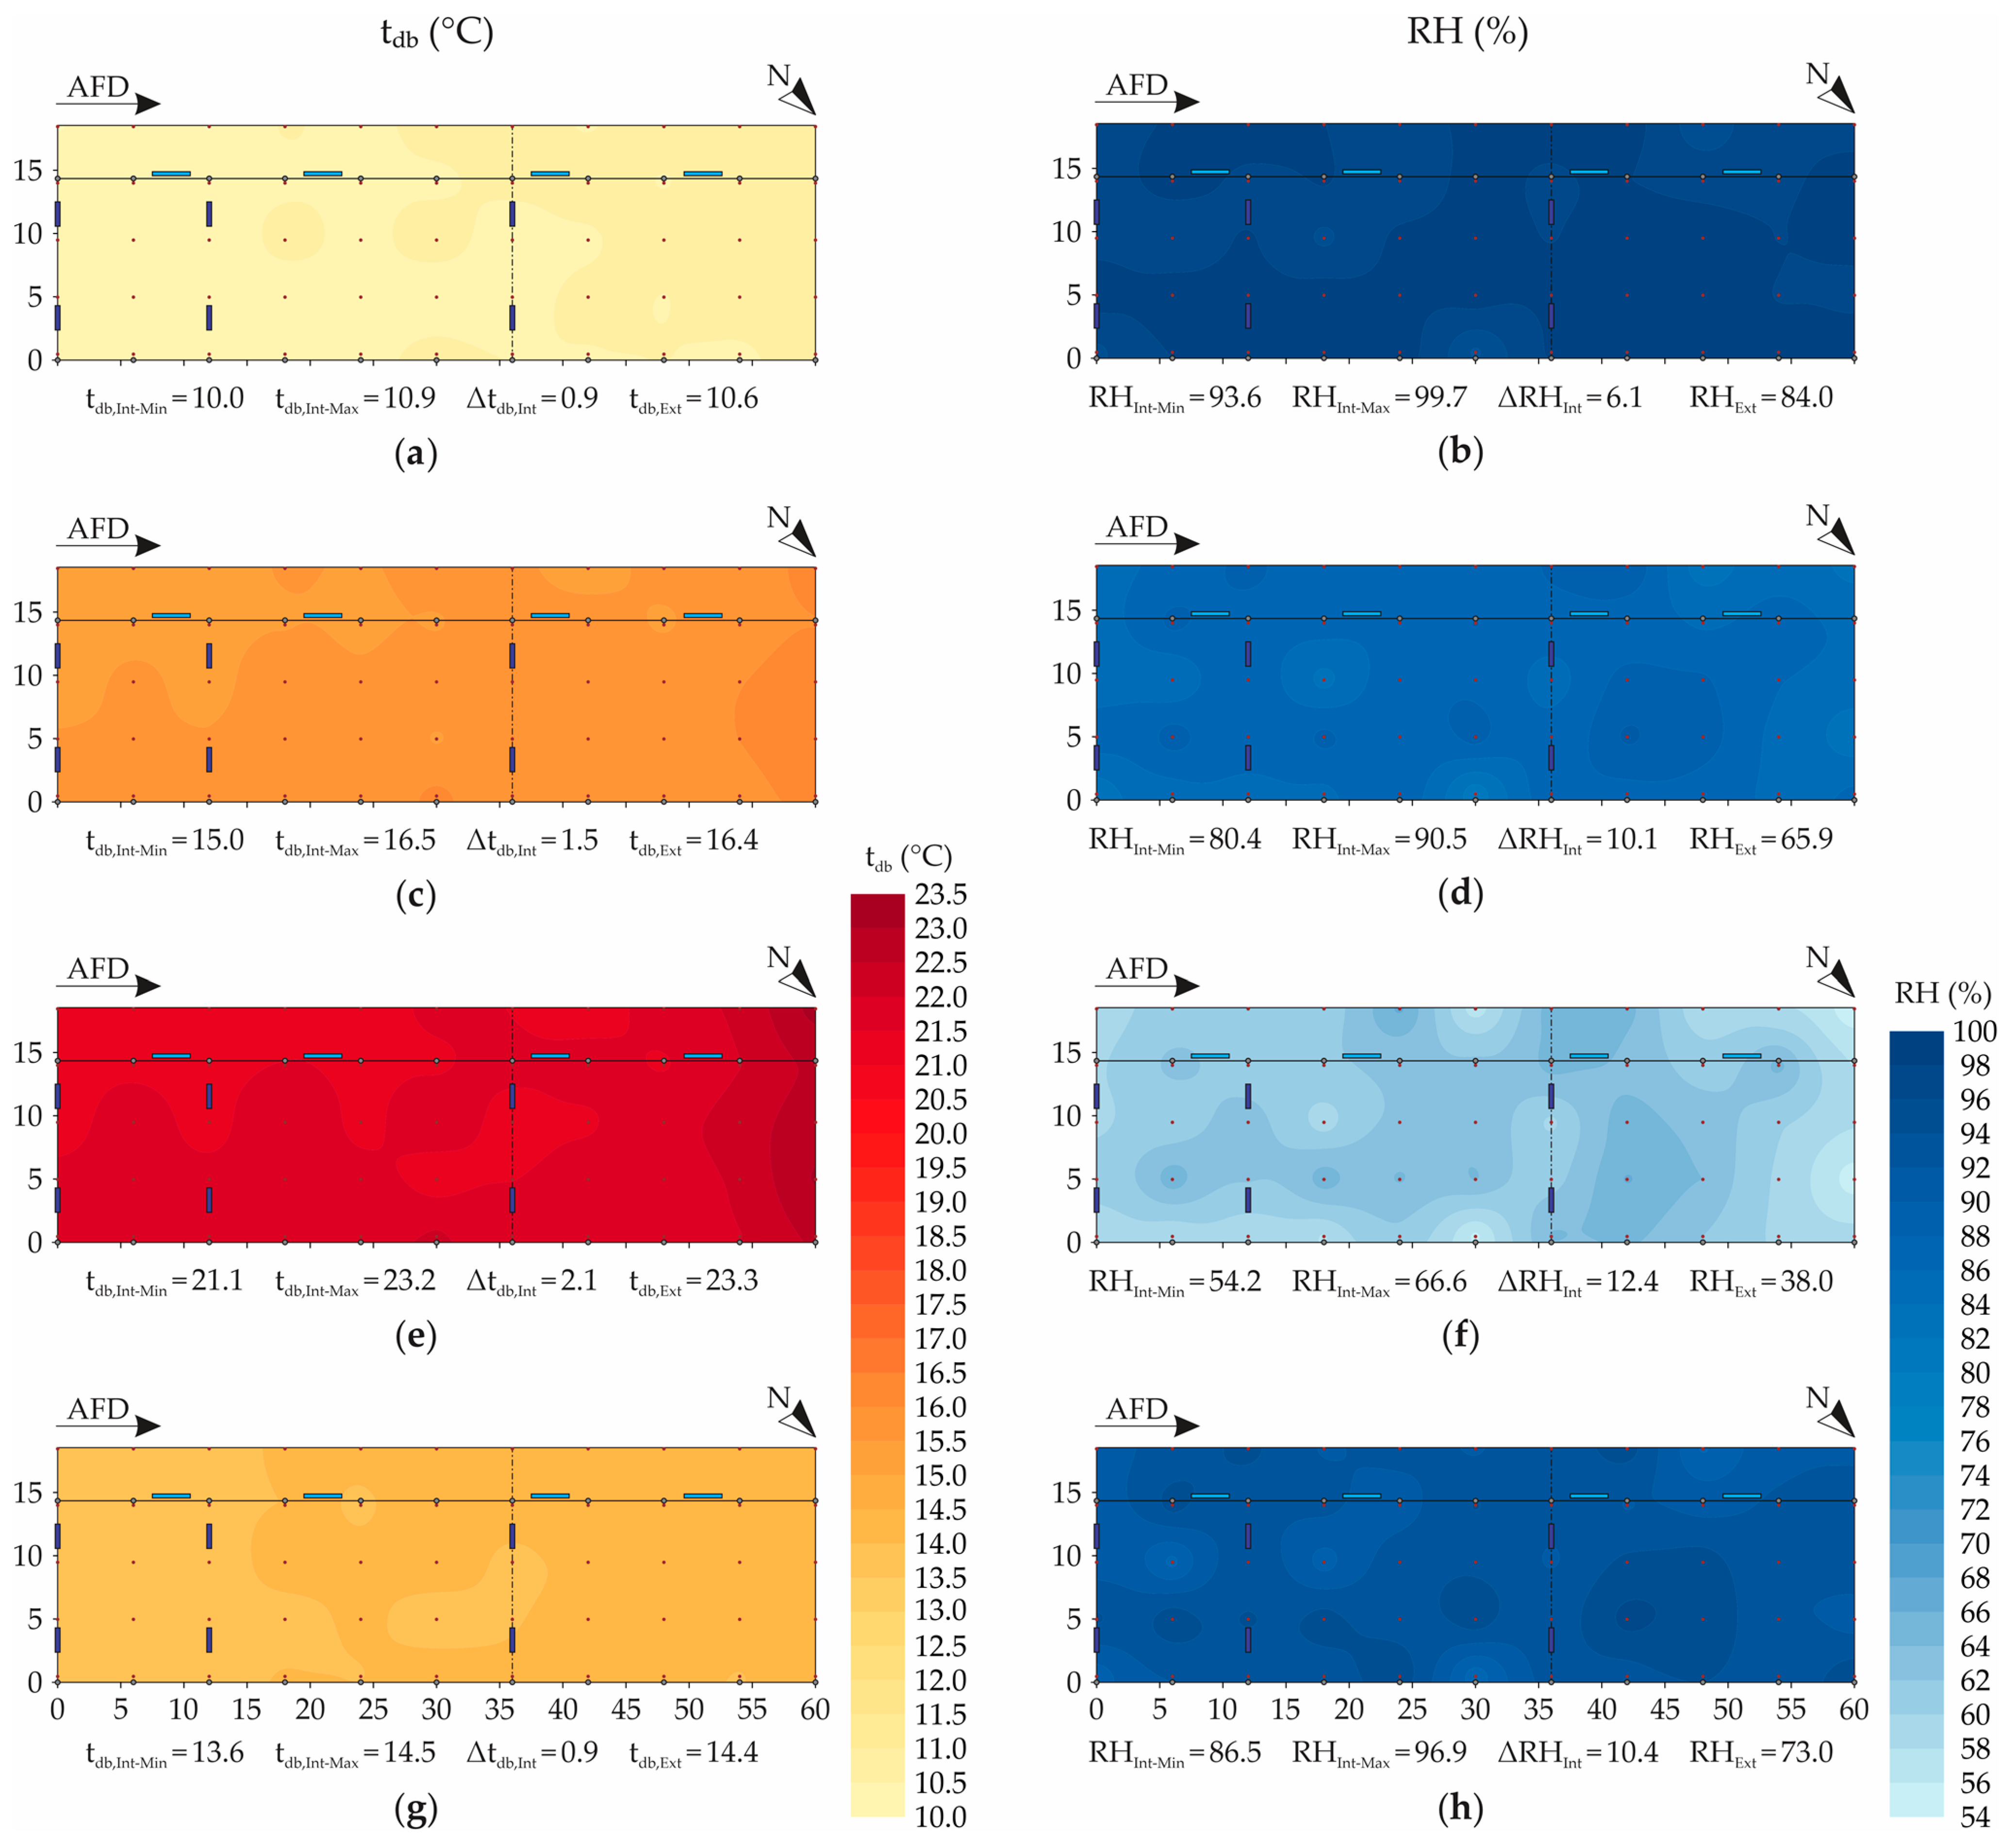
| tdb | Dawn | 10.5 | 10.5 | 10.0 | 10.9 | 0.2 | 0.02 | 2.28 | 0.04 |
| Morning | 15.7 | 15.6 | 15.0 | 16.4 | 0.2 | 0.01 | 3.60 | 0.43 | |
| Afternoon | 21.7 | 21.6 | 21.1 | 23.2 | 0.3 | 0.01 | 6.19 | 1.78 | |
| Night | 14.1 | 14.0 | 13.6 | 14.5 | 0.2 | 0.01 | 2.13 | 0.03 | |
| RH | Dawn | 98.1 | 98.2 | 93.6 | 99.7 | 0.7 | 0.01 | 6.85 | −1.38 |
| Morning | 86.7 | 86.9 | 80.4 | 90.5 | 1.2 | 0.01 | 3.91 | −0.46 | |
| Afternoon | 61.7 | 61.8 | 54.2 | 66.6 | 1.8 | 0.03 | 3.18 | −0.48 | |
| Night | 92.9 | 92.9 | 86.5 | 96.9 | 1.3 | 0.01 | 4.28 | −0.43 | |
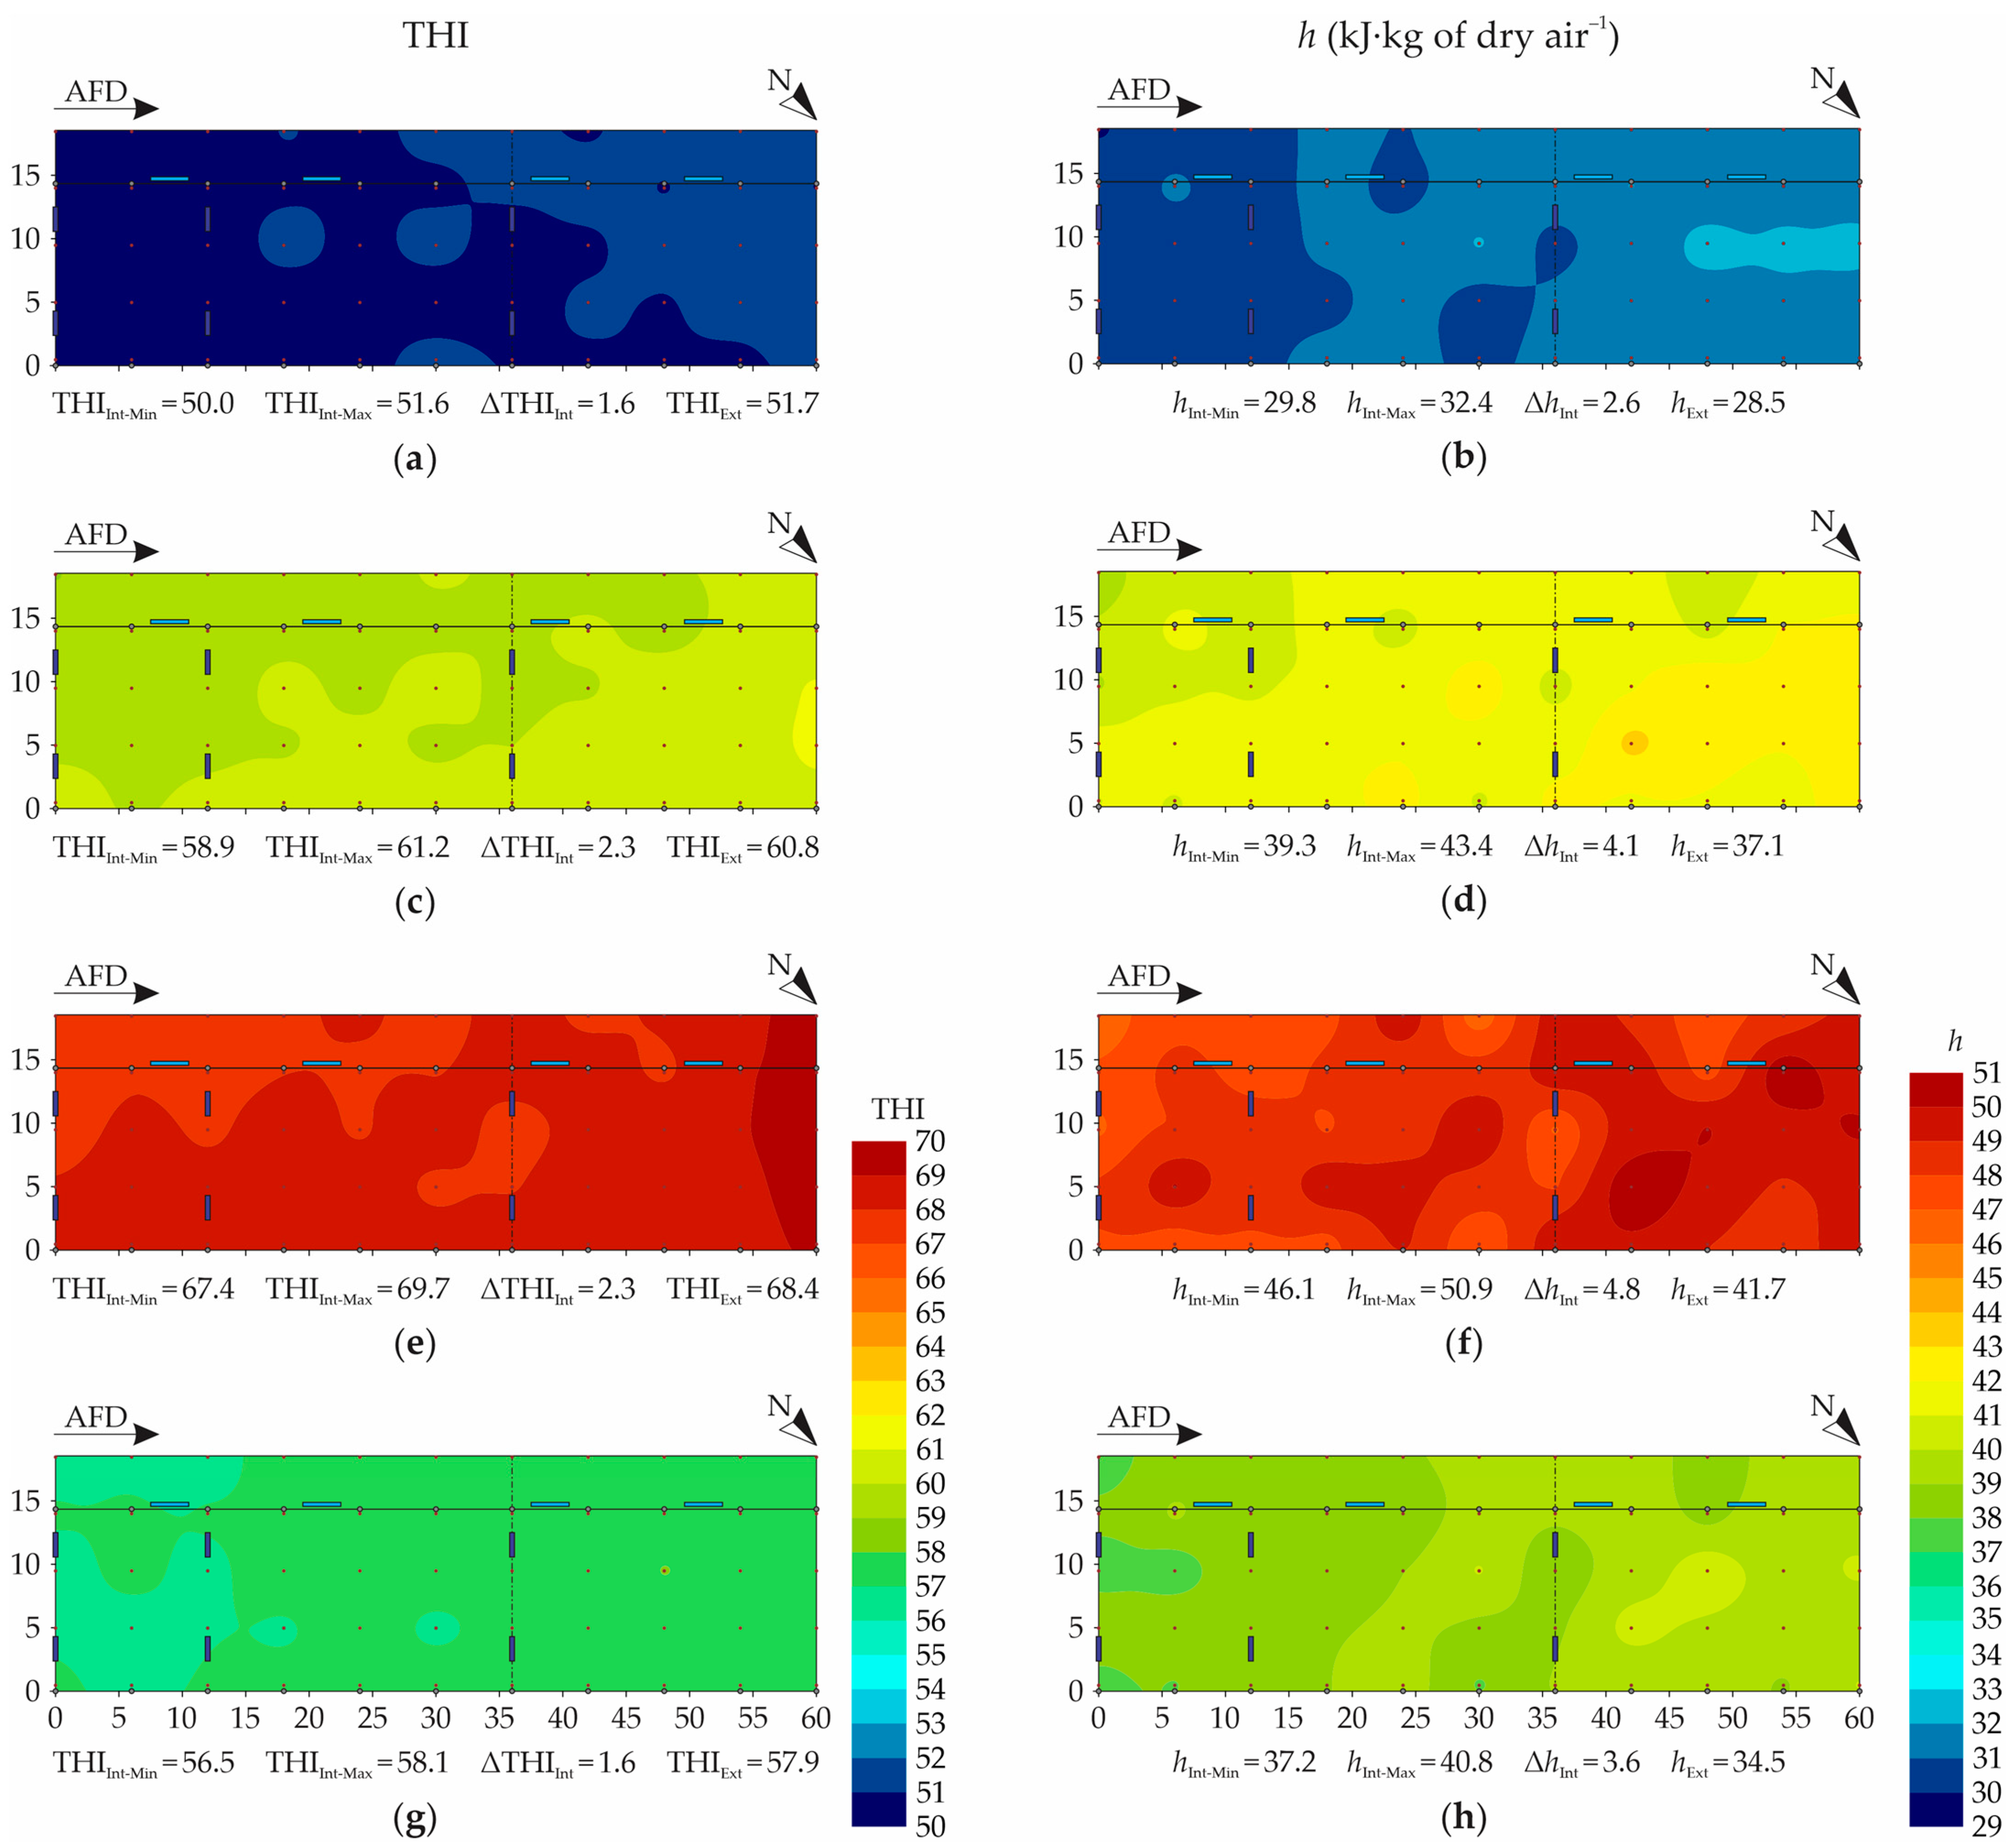
| THI | Dawn | 50.9 | 50.9 | 50.0 | 51.6 | 0.3 | 0.01 | 2.27 | 0.05 |
| Morning | 60.0 | 60.0 | 58.9 | 61.2 | 0.3 | 0.01 | 3.41 | 0.34 | |
| Afternoon | 68.3 | 68.2 | 67.3 | 69.7 | 0.4 | 0.01 | 4.42 | 1.17 | |
| Night | 57.3 | 57.3 | 56.5 | 58.1 | 0.3 | 0.01 | 2.15 | 0.03 | |
| h | Dawn | 31.2 | 31.2 | 29.8 | 32.4 | 0.4 | 0.01 | 2.23 | 0.14 |
| Morning | 41.5 | 41.5 | 39.3 | 43.4 | 0.6 | 0.01 | 2.86 | −0.03 | |
| Afternoon | 48.7 | 48.7 | 46.1 | 50.9 | 0.8 | 0.02 | 2.44 | −0.02 | |
| Night | 39.0 | 39.0 | 37.2 | 40.7 | 0.6 | 0.01 | 2.61 | 0.00 |
| Variable | Period | Method | Model | C0 | C1 | C0 + C1 | a | a’ | SDI | ME | SDM | RE | SDR |
|---|---|---|---|---|---|---|---|---|---|---|---|---|---|
| tdb | Dawn | OLS | Spherical | 0.0052 | 0.0371 | 0.0423 | 6.6380 | 6.6380 | 0.1229 | −0.0001 | 0.2274 | −0.0002 | 1.1110 |
| Morning | OLS | Spherical | 0.0097 | 0.0819 | 0.0916 | 5.8736 | 5.8736 | 0.1059 | 0.0000 | 0.2927 | 0.0001 | 0.9628 | |
| Afternoon | REML | Spherical | 0.0180 | 0.2166 | 0.2346 | 40.6683 | 40.6683 | 0.0767 | 0.0048 | 0.2517 | 0.0094 | 1.0209 | |
| Night | OLS | Spherical | 0.0056 | 0.0459 | 0.0515 | 5.0819 | 6.0819 | 0.1087 | 0.0000 | 0.2298 | 0.0000 | 1.0098 | |
| RH | Dawn | OLS | Spherical | 0.1528 | 1.3156 | 1.4684 | 5.4654 | 5.4654 | 0.1041 | −0.0003 | 1.2314 | −0.0001 | 1.0084 |
| Morning | OLS | Spherical | 0.5867 | 3.9106 | 4.4973 | 5.1147 | 5.1147 | 0.1305 | −0.0002 | 2.1239 | −0.0001 | 0.9929 | |
| Afternoon | OLS | Spherical | 0.0000 | 9.4850 | 9.4850 | 5.0397 | 5.0397 | 0.0000 | −0.0004 | 3.0743 | −0.0001 | 0.9895 | |
| Night | OLS | Spherical | 0.3491 | 4.5540 | 4.9031 | 5.2721 | 5.2721 | 0.0712 | −0.0004 | 2.2516 | −0.0001 | 1.0085 | |
| THI | Dawn | OLS | Spherical | 0.0003 | 0.1718 | 0.1721 | 5.8403 | 5.8403 | 0.0017 | −0.0001 | 0.4225 | −0.0001 | 1.0146 |
| Morning | OLS | Spherical | 0.0000 | 0.2418 | 0.2418 | 5.0215 | 5.0215 | 0.0000 | 0.0000 | 0.4939 | 0.0000 | 0.9957 | |
| Afternoon | OLS | Spherical | 0.0002 | 0.1731 | 0.1733 | 5.8705 | 5.8706 | 0.0012 | −0.0001 | 0.4892 | −0.0001 | 1.1706 | |
| Night | OLS | Spherical | 0.0075 | 0.1565 | 0.1640 | 5.3975 | 5.3975 | 0.0457 | 0.0000 | 0.4047 | 0.0000 | 0.9917 | |
| h | Dawn | OLS | Spherical | 0.0004 | 0.3014 | 0.3018 | 5.6248 | 5.6248 | 0.0013 | −0.0002 | 0.5615 | −0.0002 | 1.0160 |
| Morning | OLS | Exponential | 0.0000 | 0.5309 | 0.5309 | 5.0008 | 14.9812 | 0.0000 | −0.0056 | 0.6372 | −0.0046 | 1.0423 | |
| Afternoon | OLS | Spherical | 0.0000 | 1.2355 | 1.2355 | 6.5328 | 6.5328 | 0.0000 | −0.0033 | 1.1182 | −0.0015 | 1.0121 | |
| Night | OLS | Spherical | 0.0209 | 0.5211 | 0.5420 | 5.4957 | 5.4957 | 0.0386 | −0.0002 | 0.7542 | −0.0001 | 1.0173 |
Publisher’s Note: MDPI stays neutral with regard to jurisdictional claims in published maps and institutional affiliations. |
© 2022 by the authors. Licensee MDPI, Basel, Switzerland. This article is an open access article distributed under the terms and conditions of the Creative Commons Attribution (CC BY) license (https://creativecommons.org/licenses/by/4.0/).
Share and Cite
Oliveira, C.E.A.; Tinôco, I.d.F.F.; Damasceno, F.A.; Oliveira, V.C.d.; Ferraz, G.A.e.S.; Sousa, F.C.d.; Andrade, R.R.; Barbari, M. Mapping of the Thermal Microenvironment for Dairy Cows in an Open Compost-Bedded Pack Barn System with Positive-Pressure Ventilation. Animals 2022, 12, 2055. https://doi.org/10.3390/ani12162055
Oliveira CEA, Tinôco IdFF, Damasceno FA, Oliveira VCd, Ferraz GAeS, Sousa FCd, Andrade RR, Barbari M. Mapping of the Thermal Microenvironment for Dairy Cows in an Open Compost-Bedded Pack Barn System with Positive-Pressure Ventilation. Animals. 2022; 12(16):2055. https://doi.org/10.3390/ani12162055
Chicago/Turabian StyleOliveira, Carlos Eduardo Alves, Ilda de Fátima Ferreira Tinôco, Flávio Alves Damasceno, Victor Crespo de Oliveira, Gabriel Araújo e Silva Ferraz, Fernanda Campos de Sousa, Rafaella Resende Andrade, and Matteo Barbari. 2022. "Mapping of the Thermal Microenvironment for Dairy Cows in an Open Compost-Bedded Pack Barn System with Positive-Pressure Ventilation" Animals 12, no. 16: 2055. https://doi.org/10.3390/ani12162055