
Effects of Climate Change on the Habitat of the Leopard (Panthera pardus) in the Liupanshan National Nature Reserve of China

 ,
,
Abstract
:Simple Summary
Abstract
1. Introduction
2. Research methods
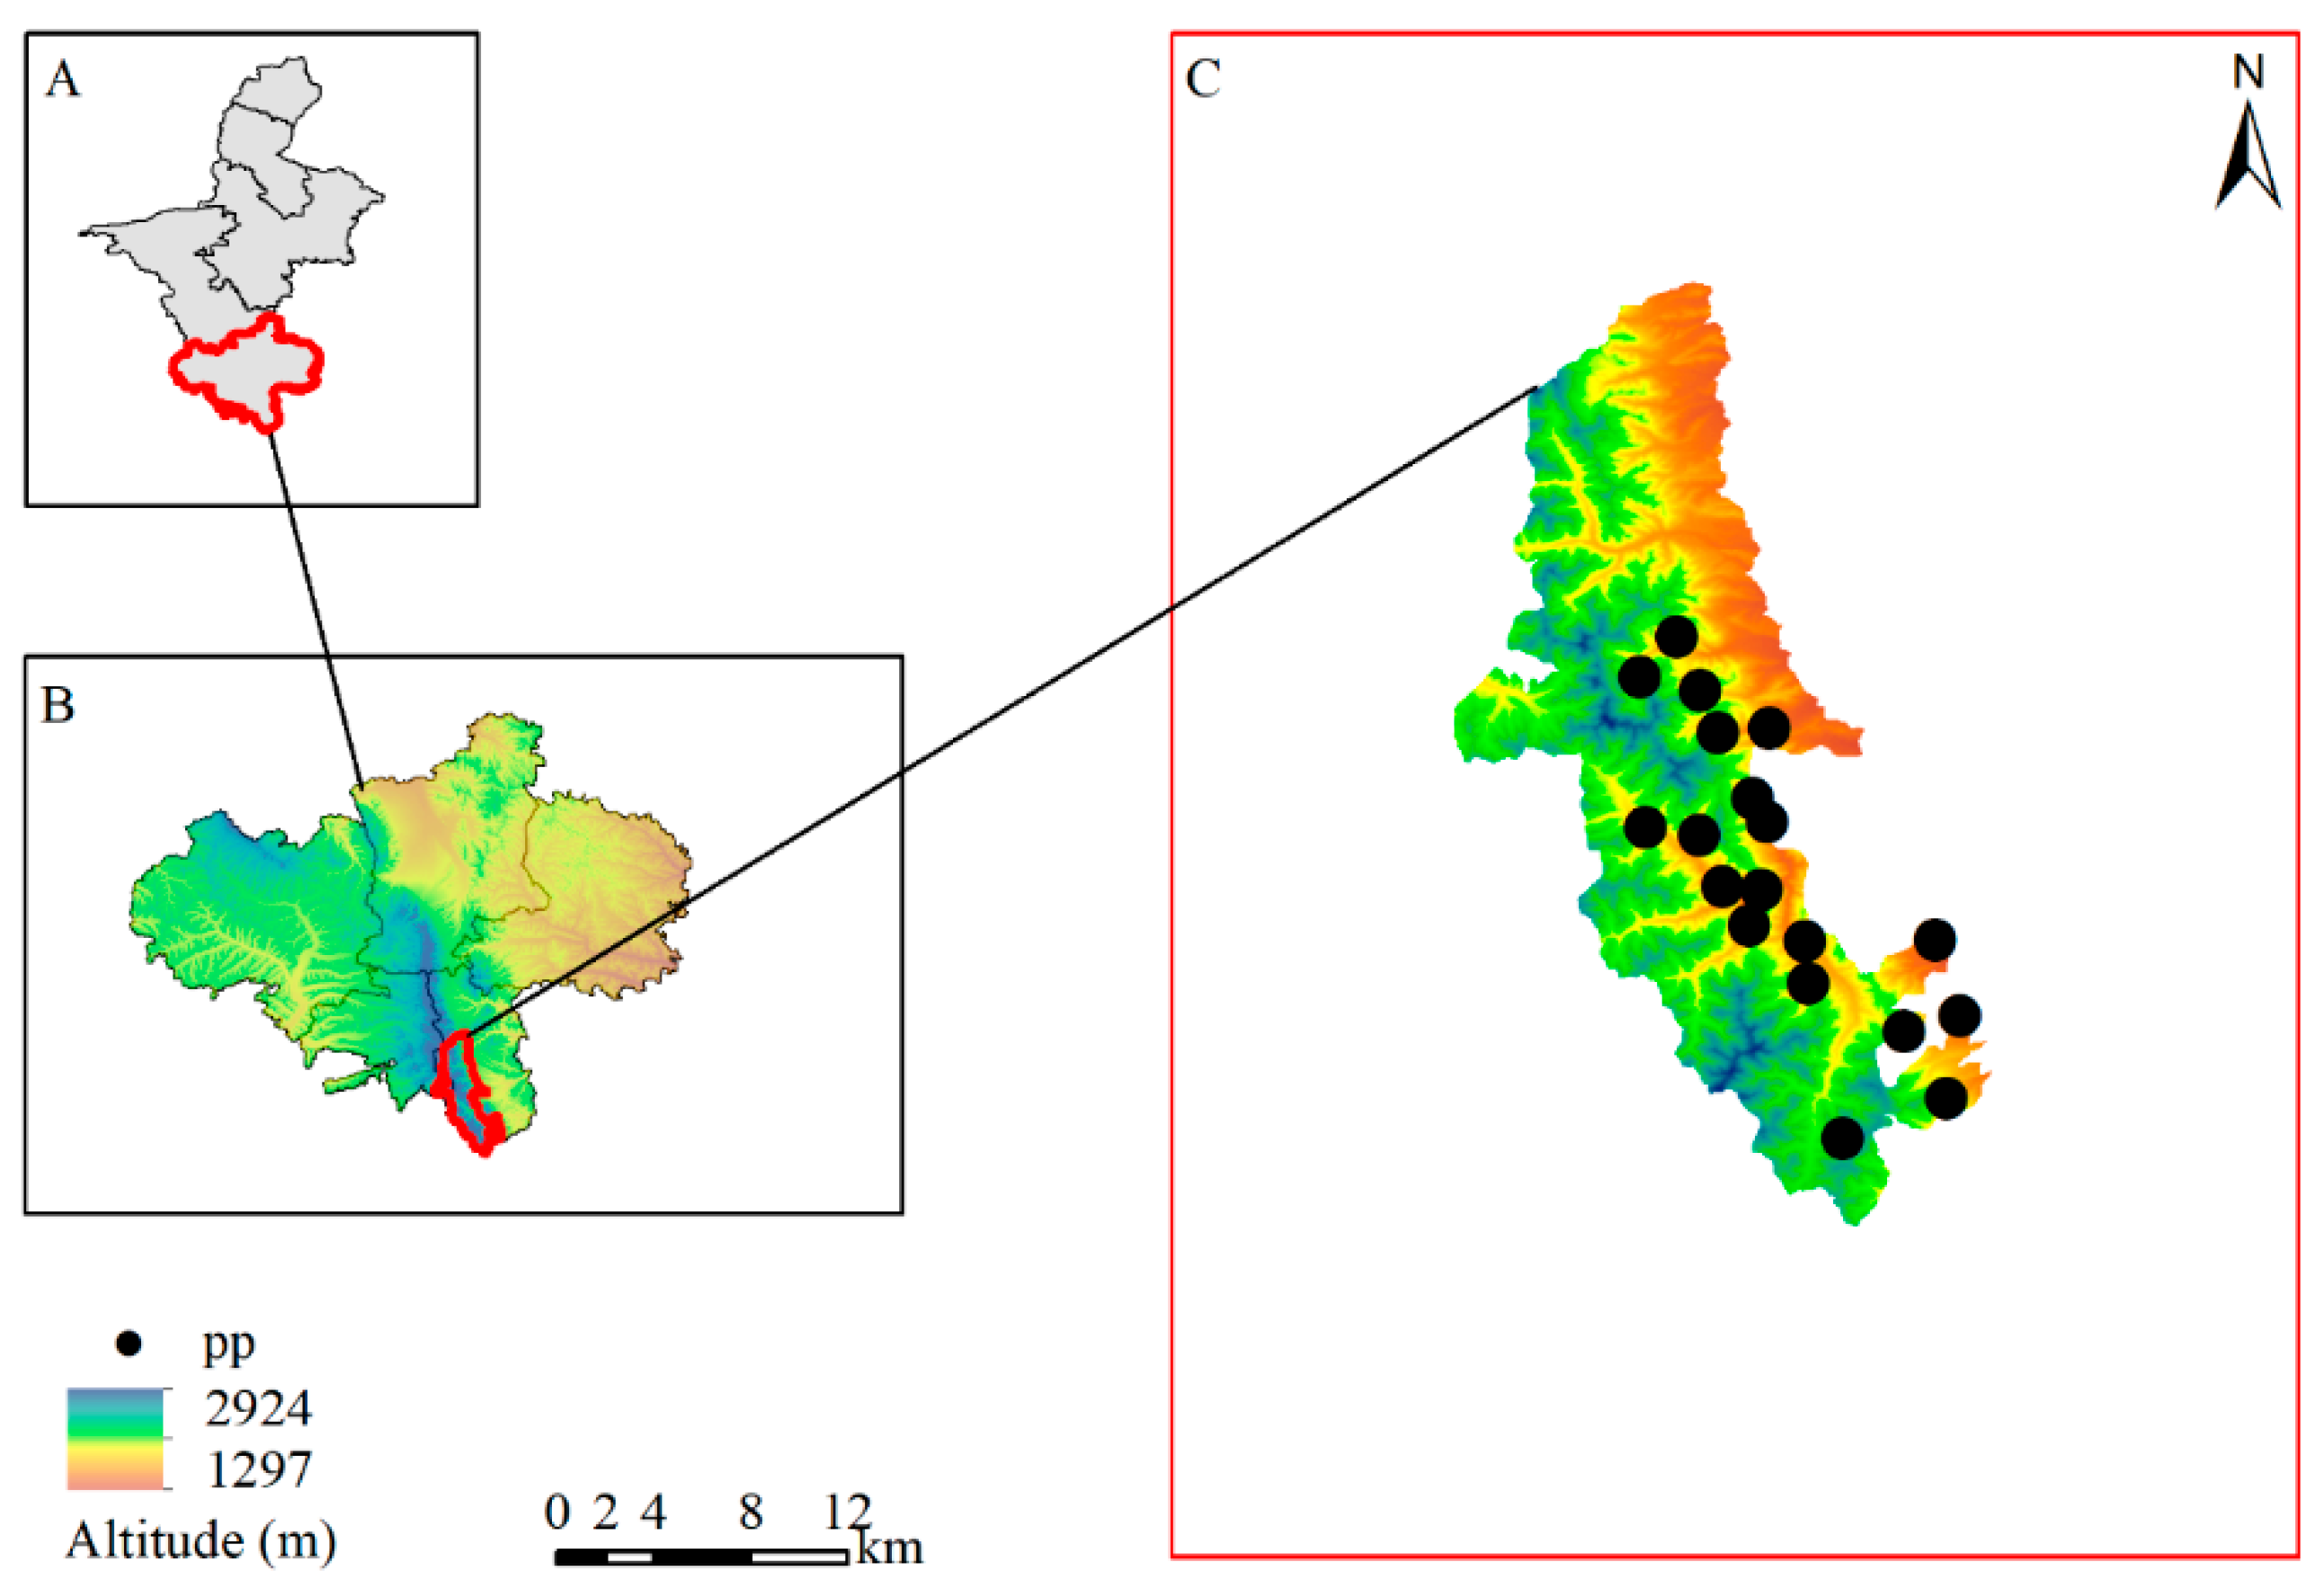
2.1. Study Area
2.2. Species Distribution Data
2.3. Environmental Data
2.4. Screening of Environmental Variables
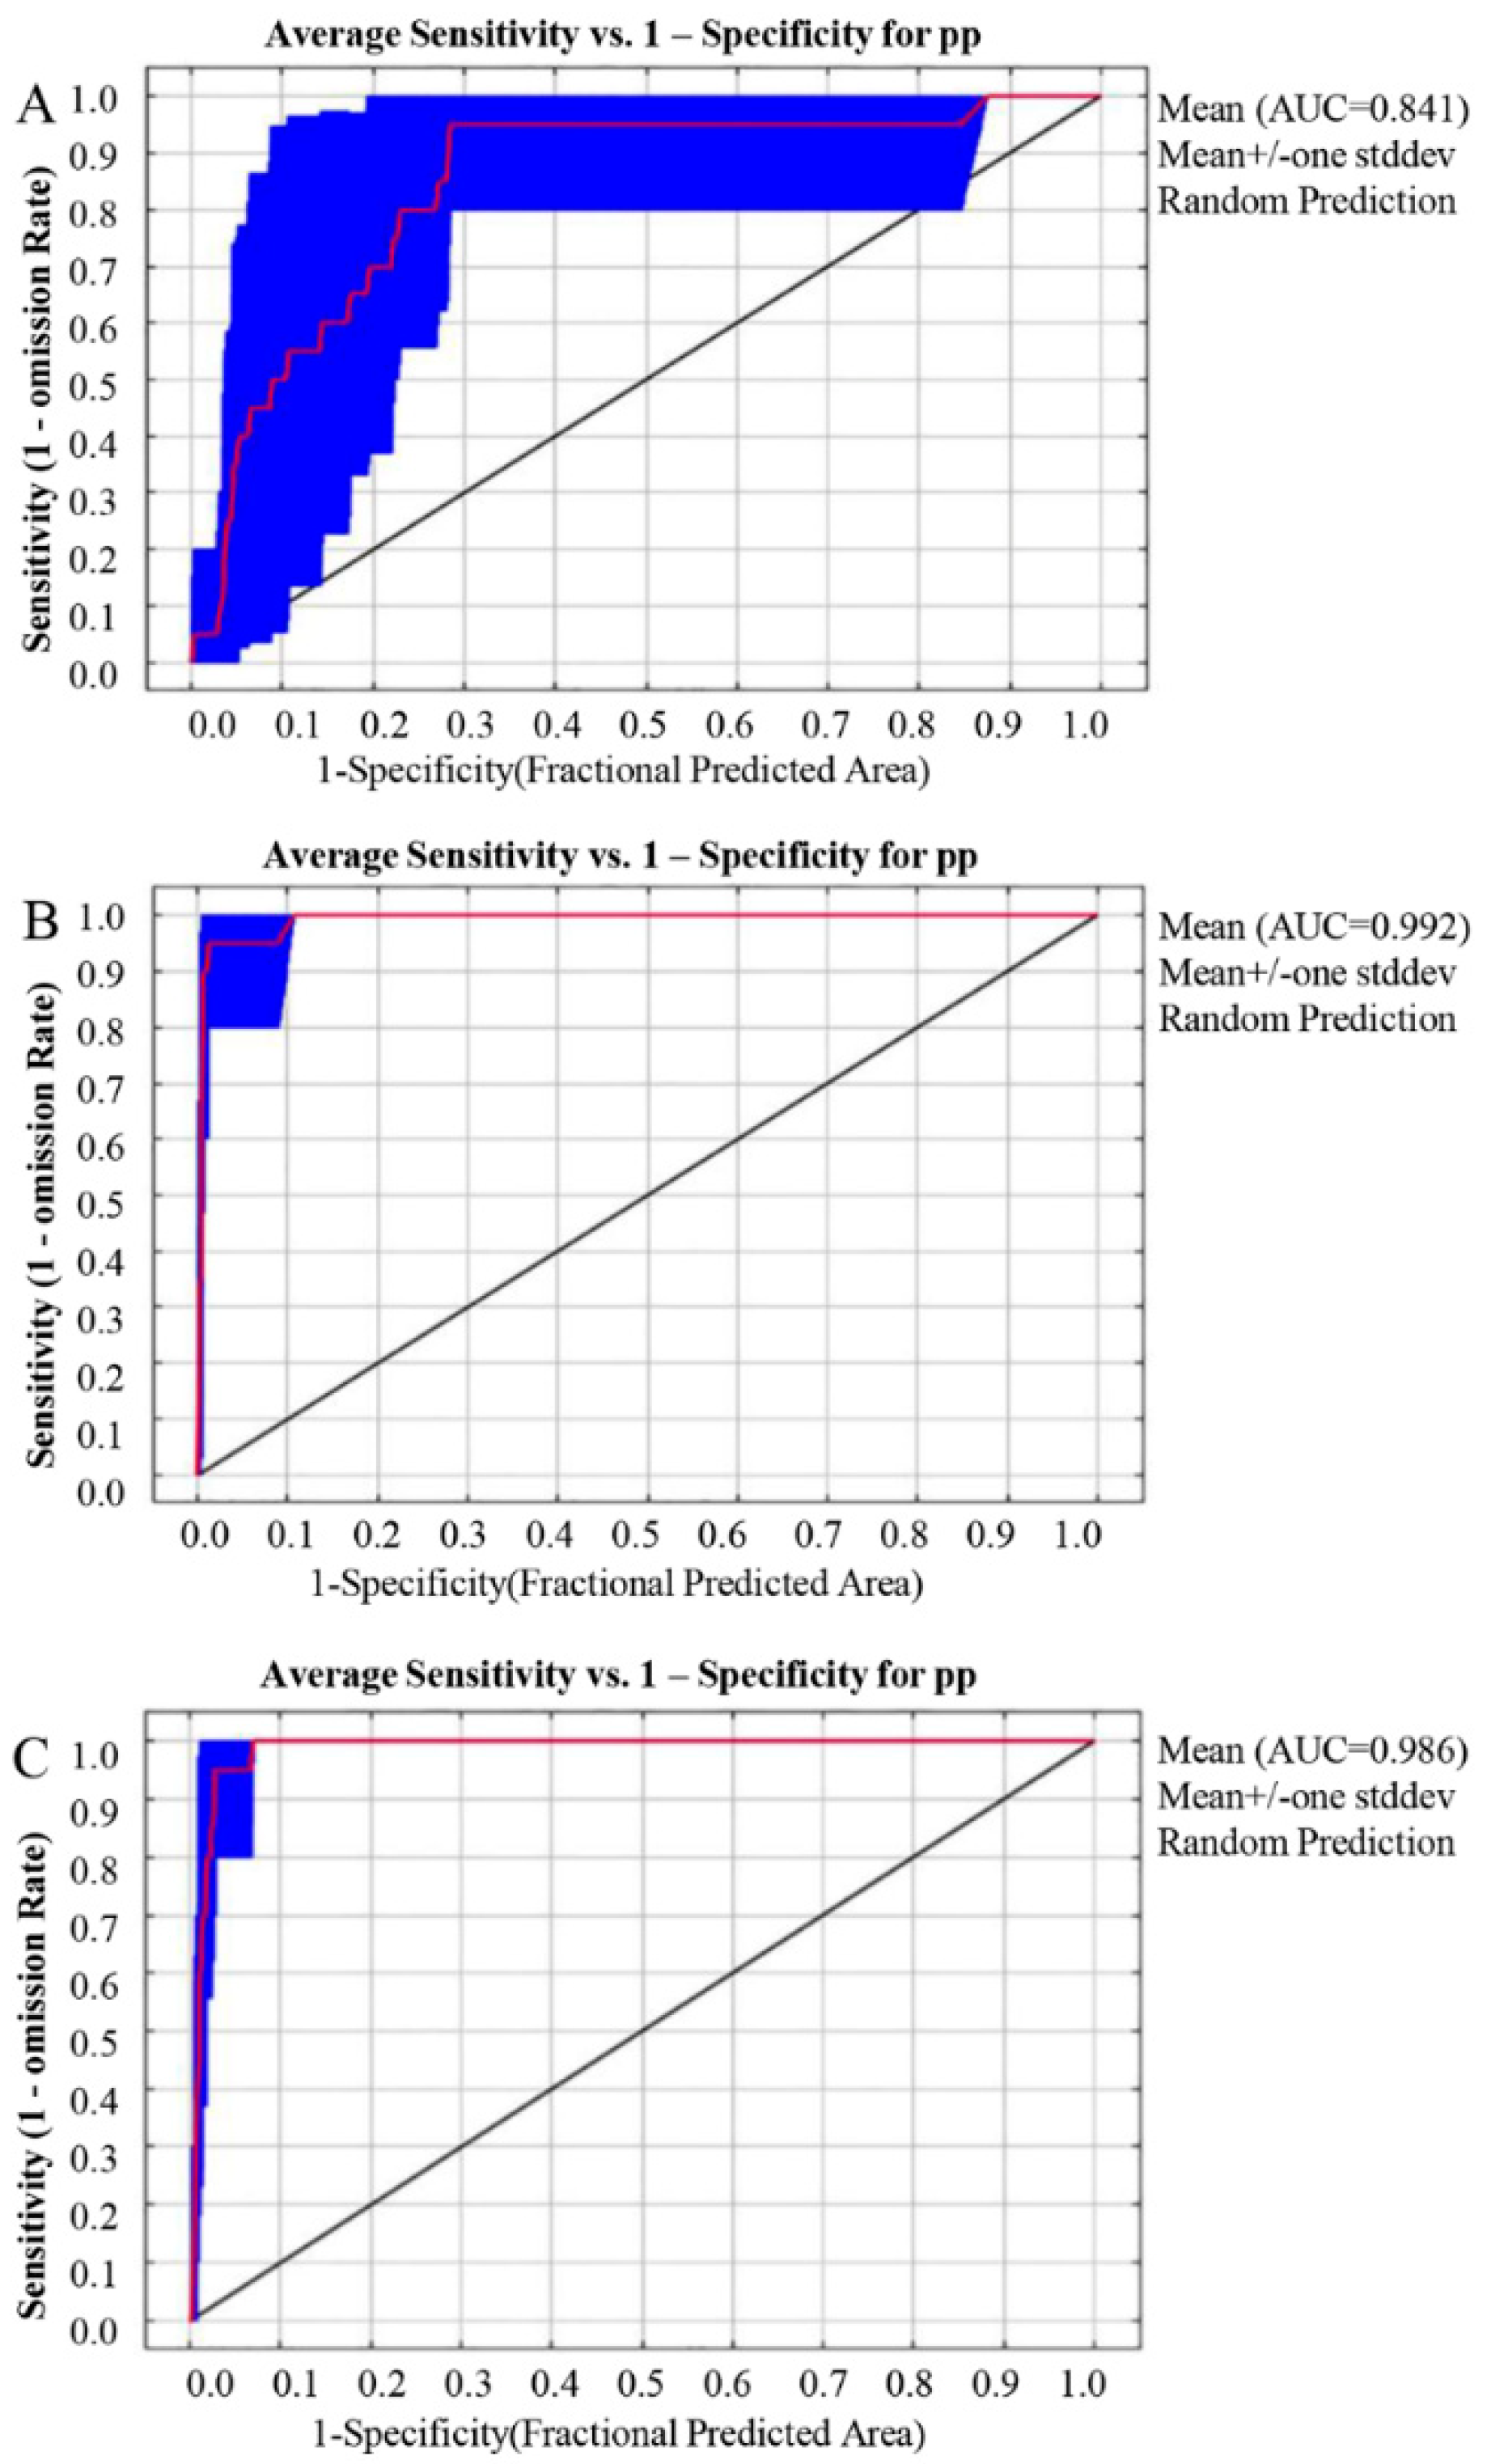
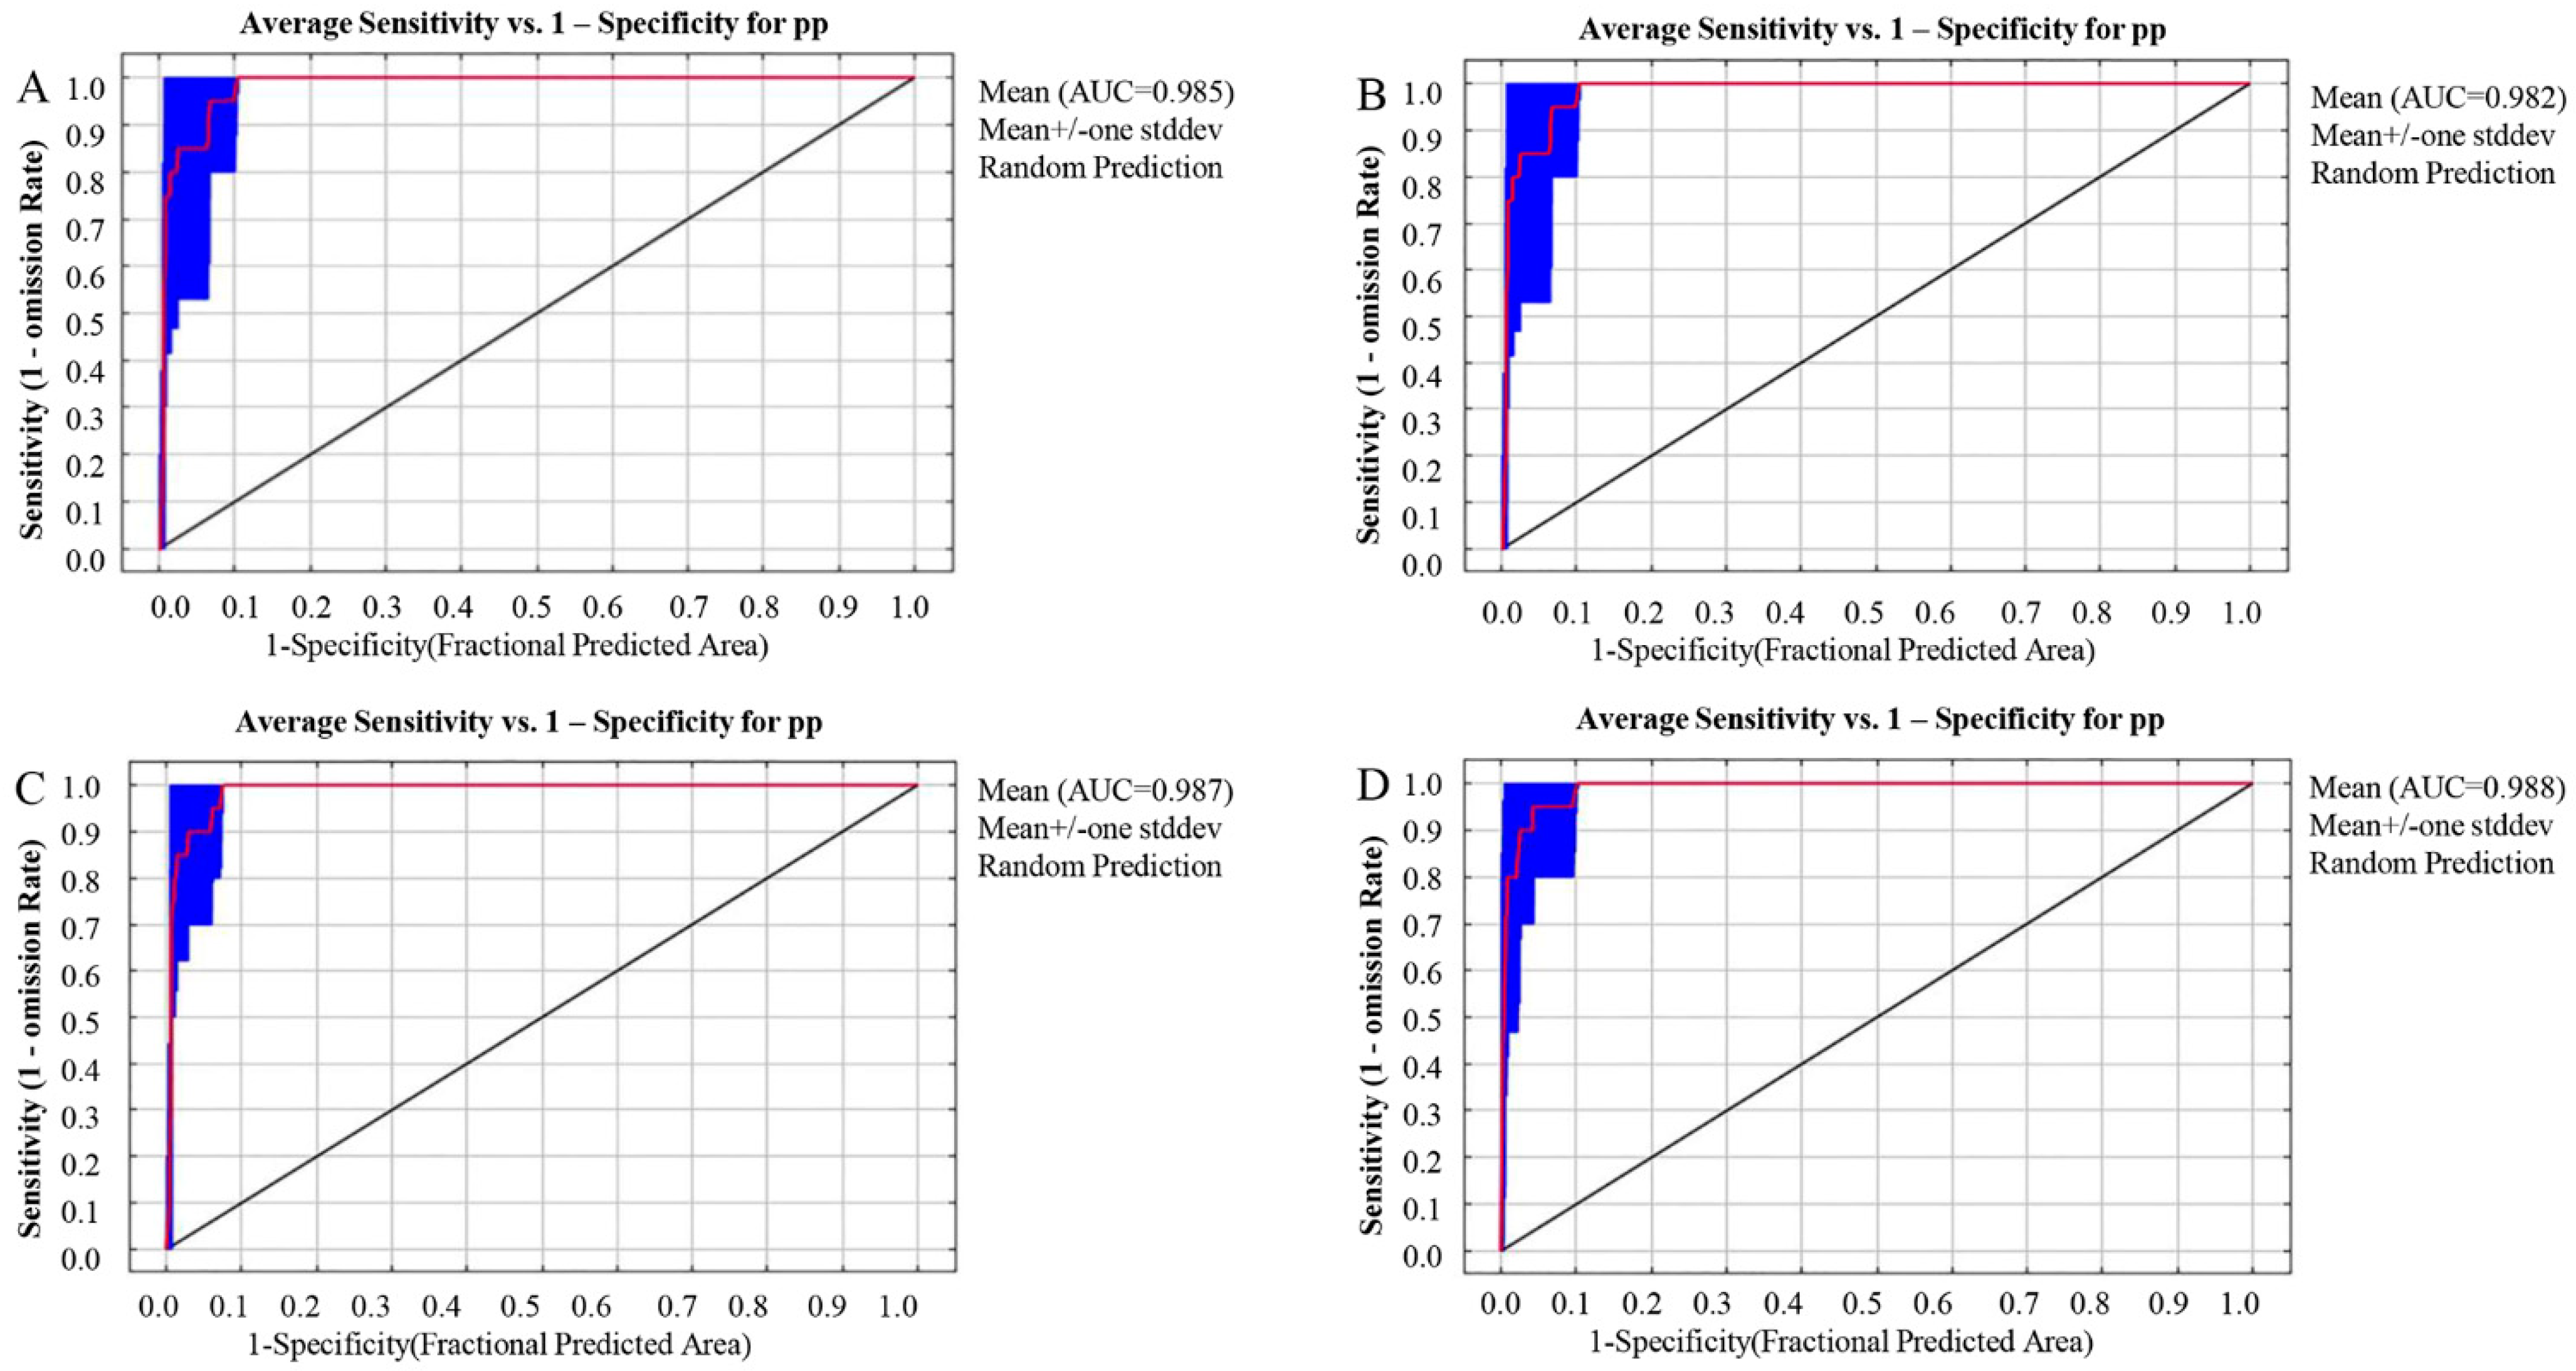
2.5. Results Evaluation
2.6. Classification of Suitable Birth Grades
3. Results
3.1. Prediction Results of the Model
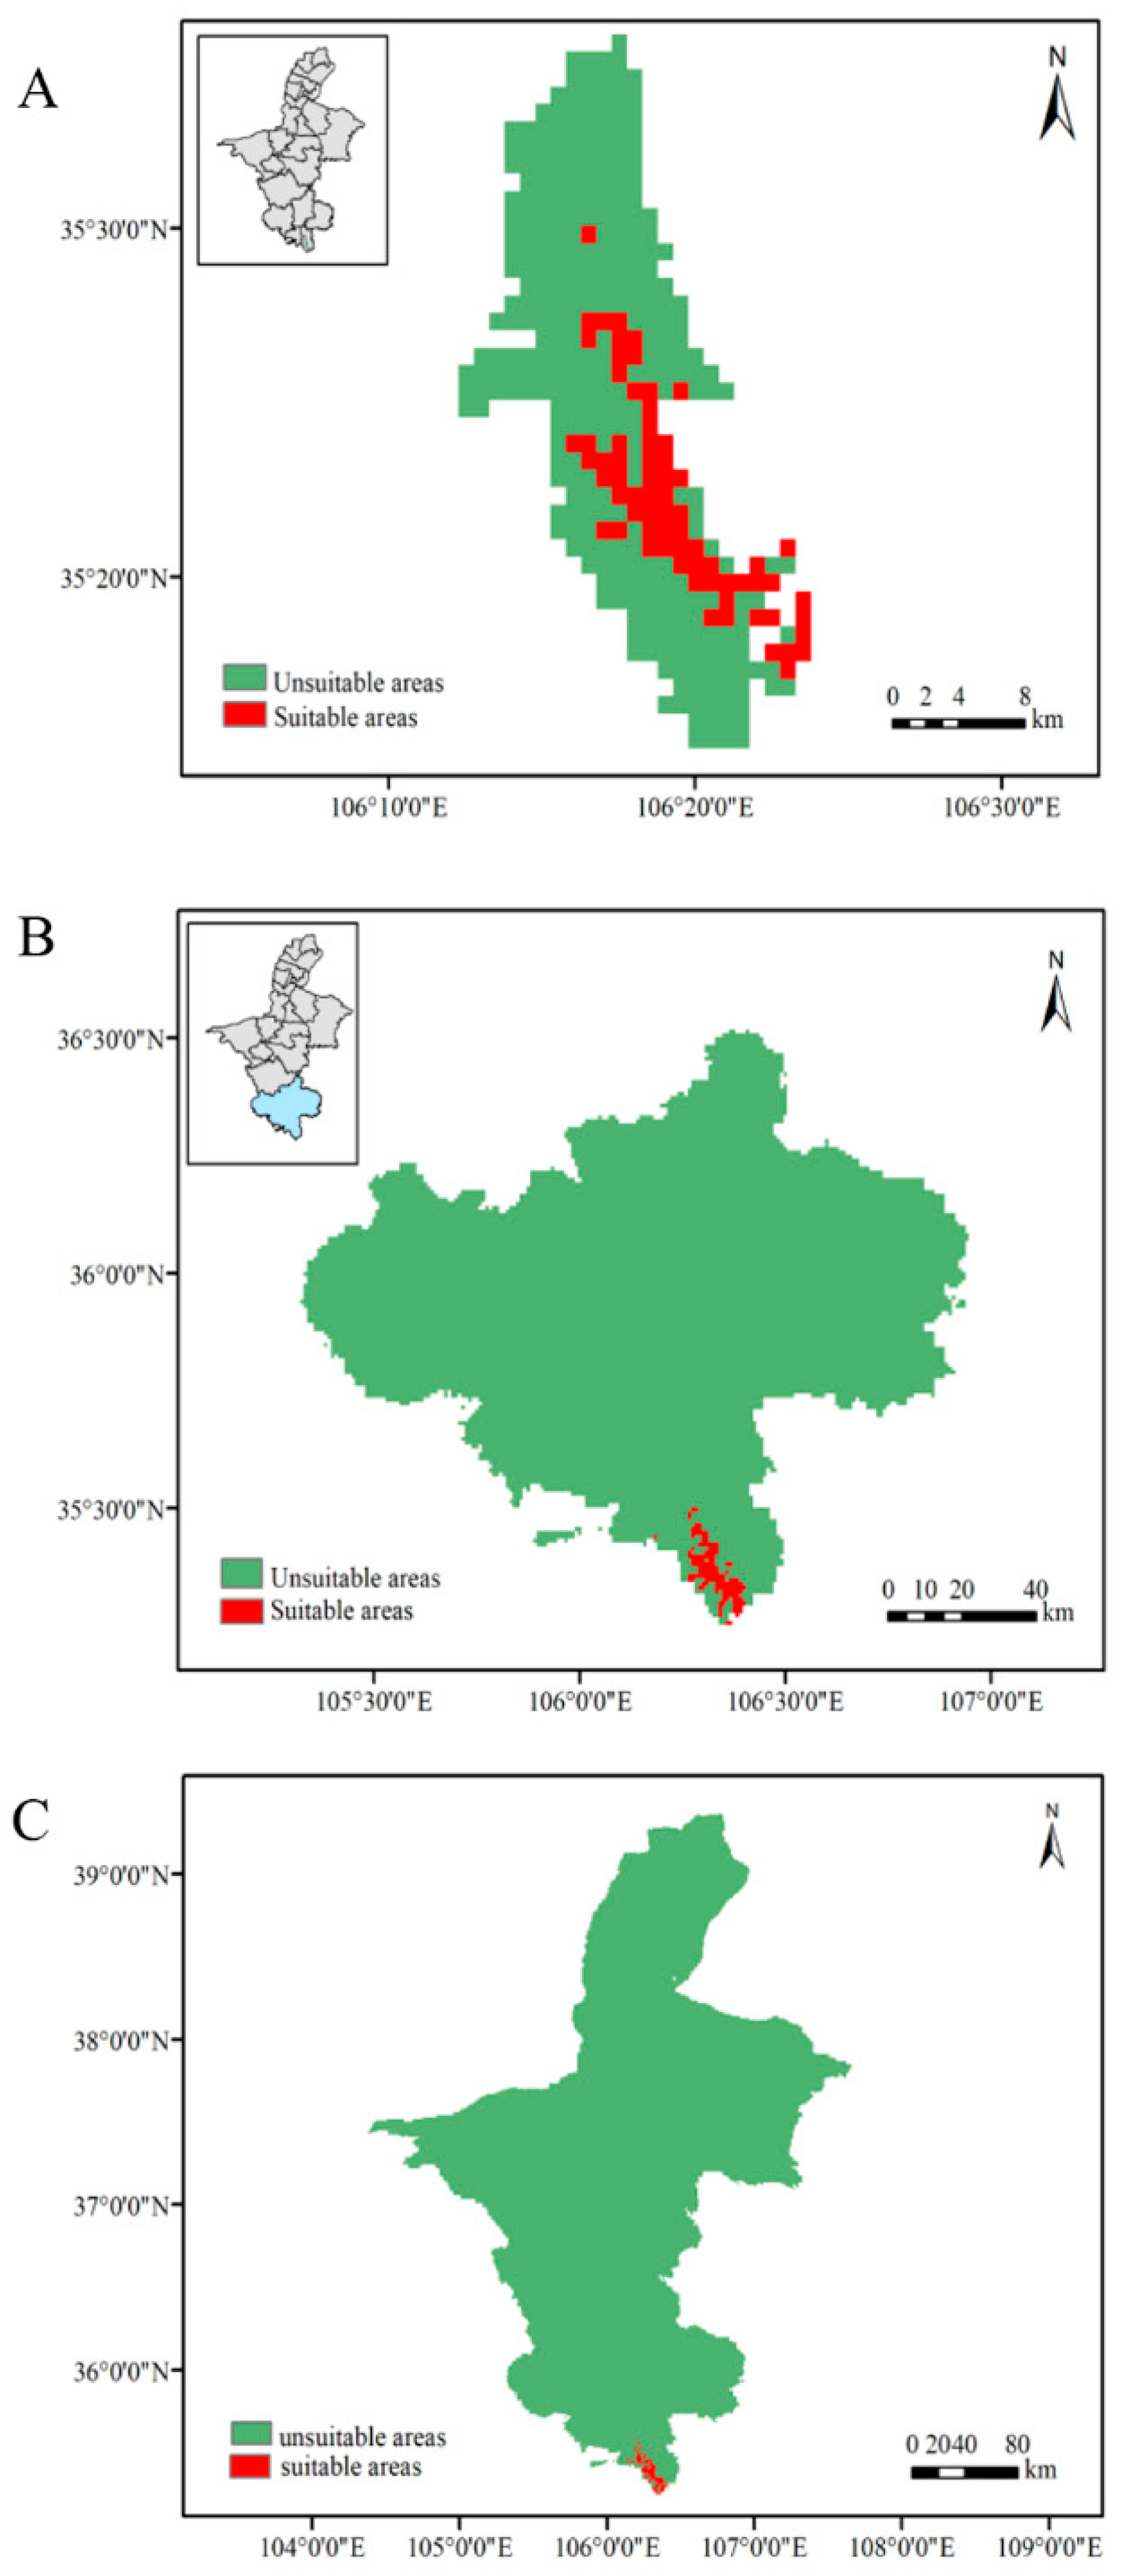
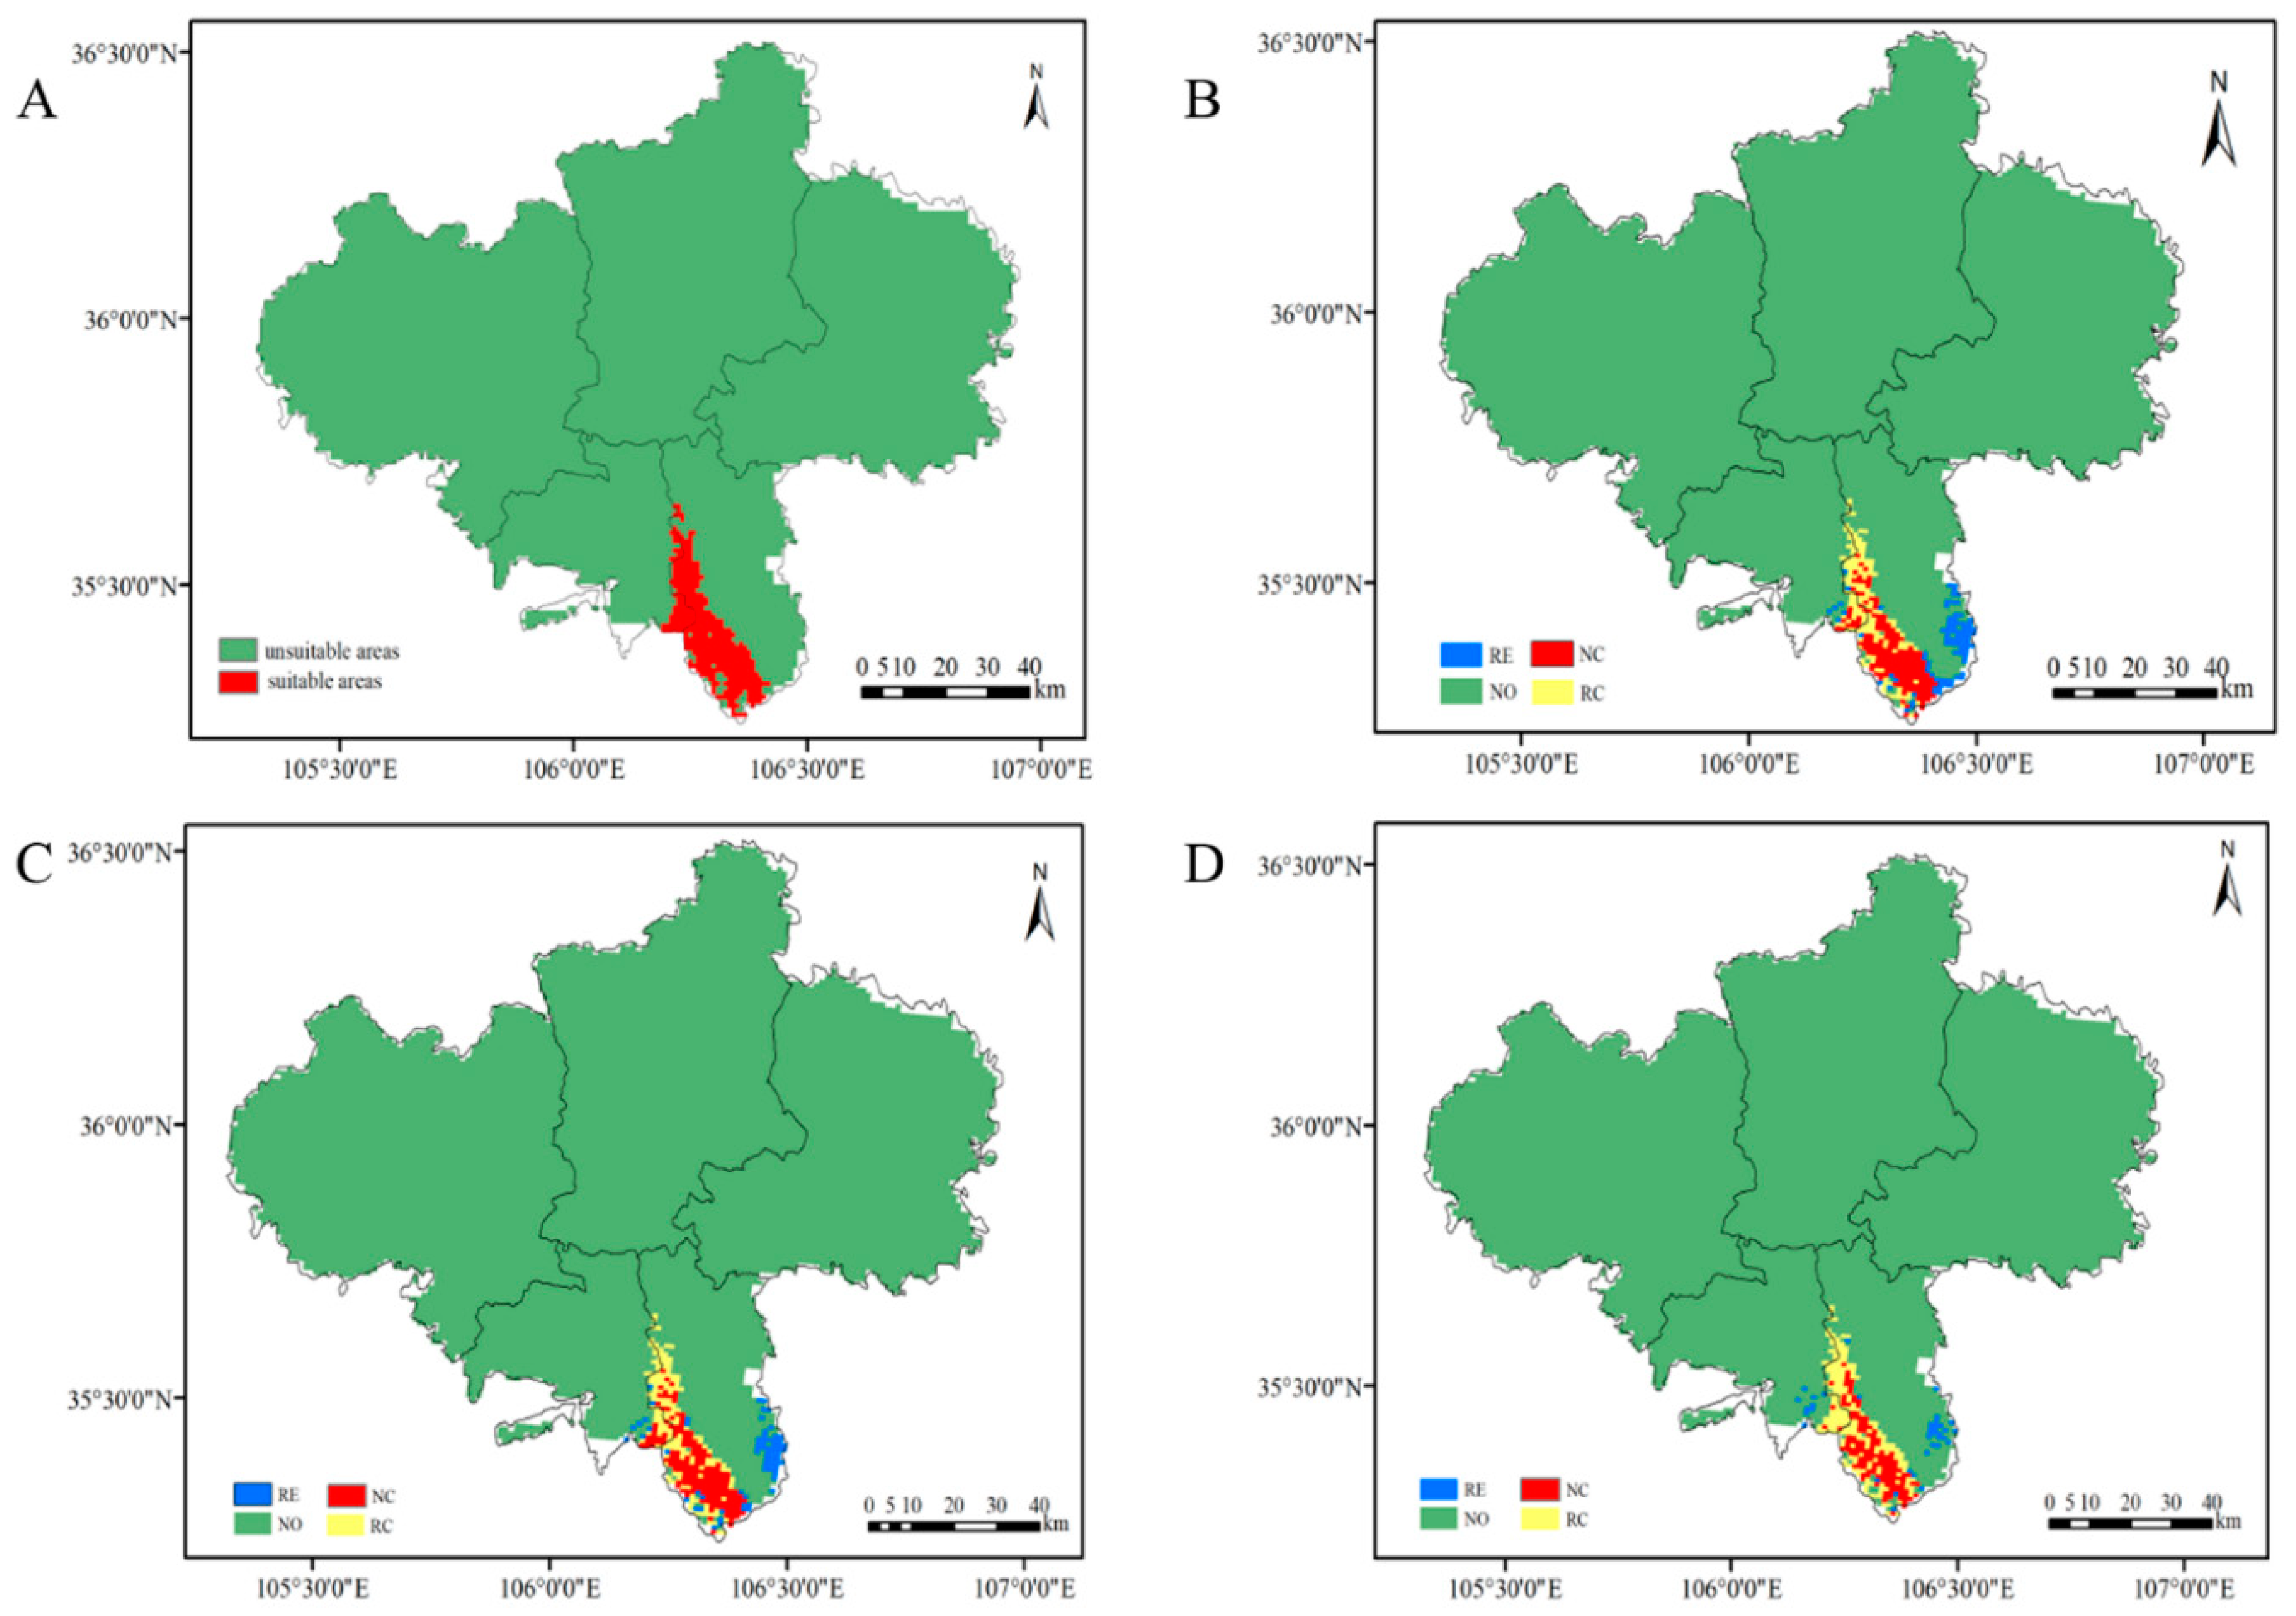
3.2. Distribution and Area of the Potentially Suitable Growth Area of the Leopard
3.3. Contribution Analysis of Environmental Variables to the Model
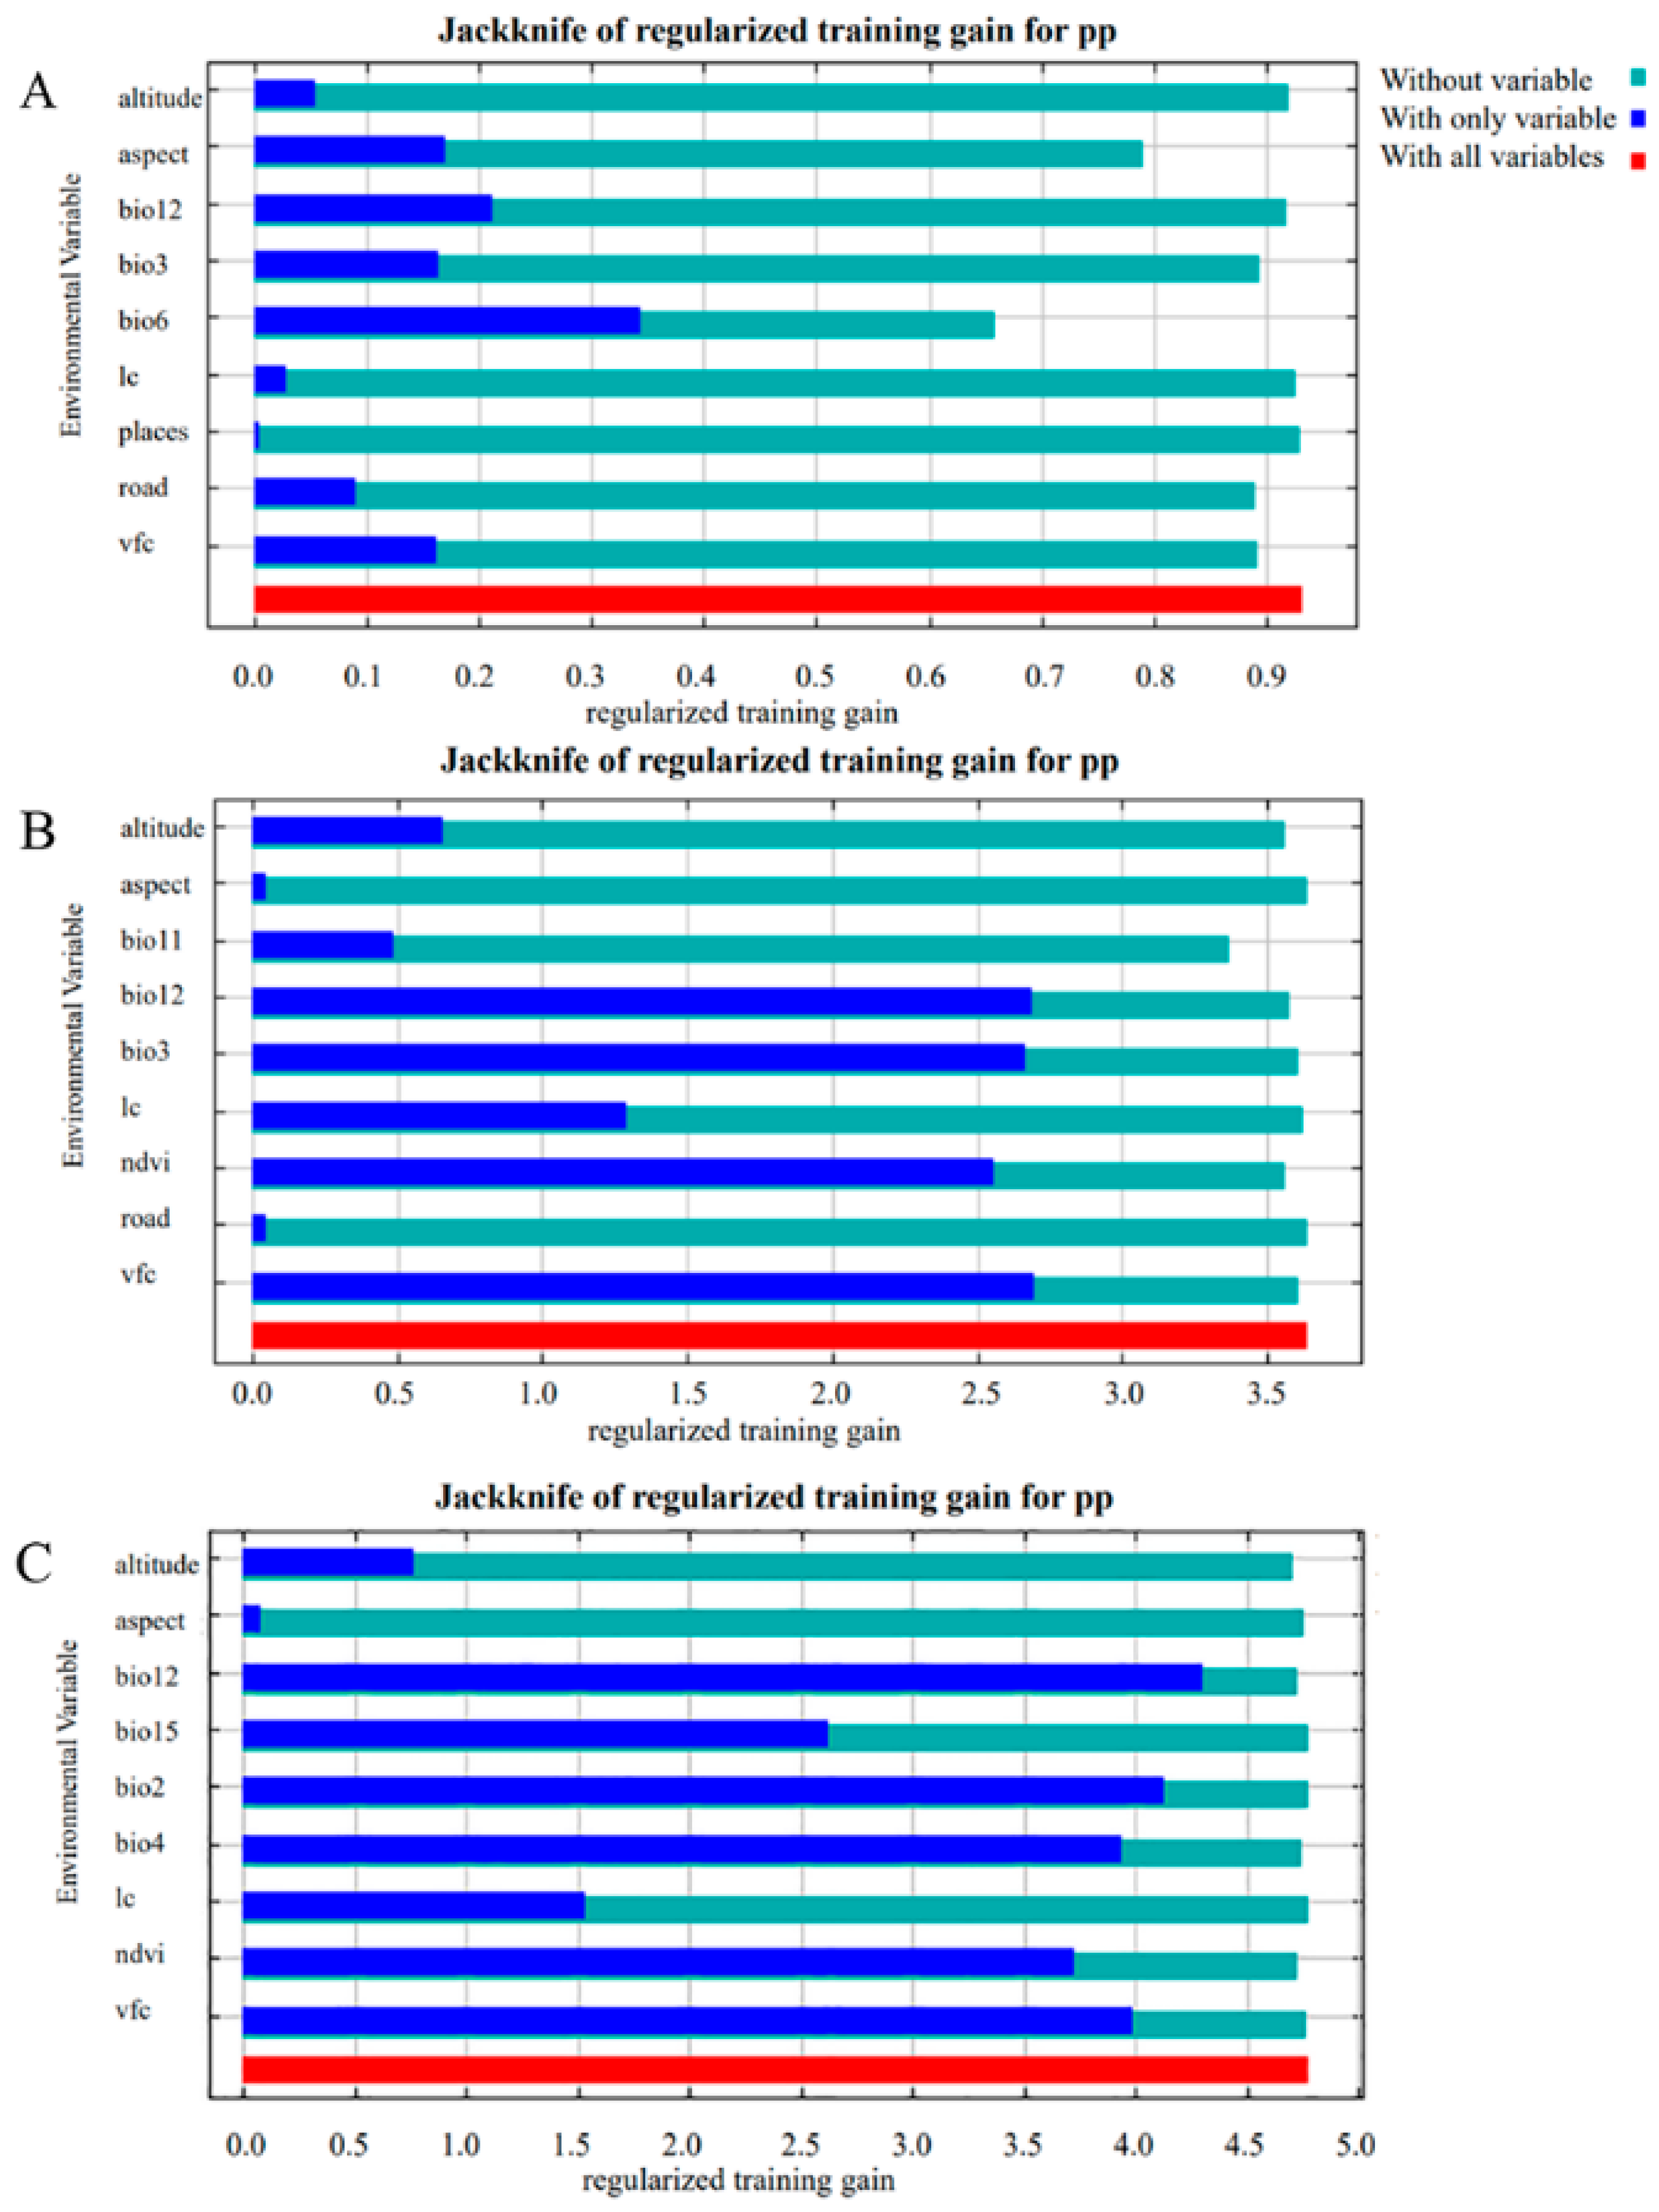
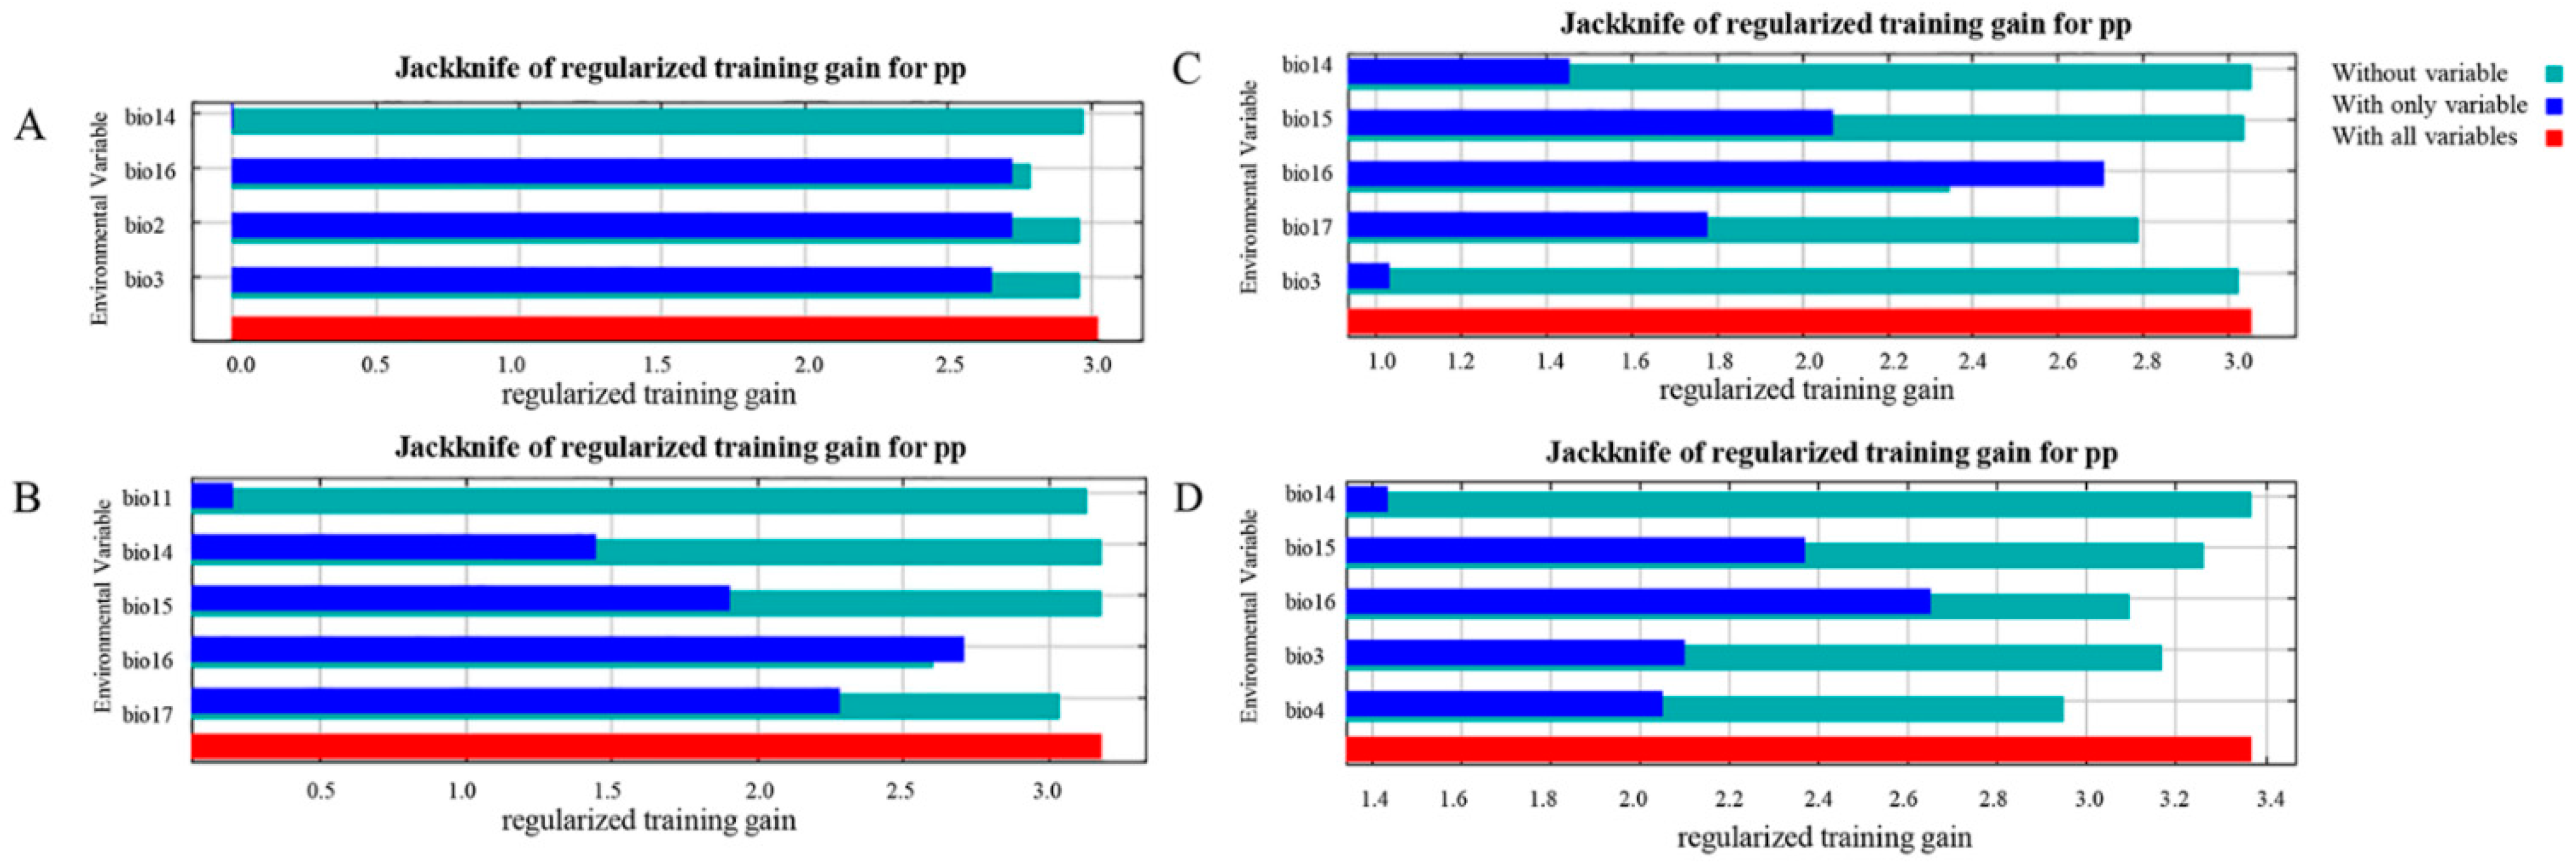
3.4. Jackknife Test Analysis of Environmental Factors
4. Discussion
4.1. The Impact of Different Geographical Scales on the Leopard’s Habitat Distribution
4.2. The Impact of Future Climate on the Leopard’s Habitat Distribution
4.3. Protection Suggestions for Leopard Habitat in the Reserve
5. Conclusions
Author Contributions
Funding
Institutional Review Board Statement
Informed Consent Statement
Data Availability Statement
Acknowledgments
Conflicts of Interest
References
- Sheehy, J.; Taylor, C.M.; McCann, K.S.; Norris, D.R. Optimal conservation planning for migratory animals: Integrating demographic information across seasons. Conserv. Lett. 2010, 3, 192–202. [Google Scholar] [CrossRef]
- Tilman, D.; May, R.M.; Lehman, C.L.; Nowak, M.A. Habitat destruction and the extinction debt. Nature 1994, 371, 65–66. [Google Scholar] [CrossRef]
- Roman-Palacios, C.; Wiens, J.J. Recent responses to climate change reveal the drivers of species extinction and survival. Proc. Natl. Acad. Sci. USA 2020, 117, 4211–4217. [Google Scholar] [CrossRef]
- Preston, K.; Rotenberry, J.T.; Redak, R.A.; Allen, M.F. Habitat shifts of endangered species under altered climate conditions: Importance of biotic interactions. Glob. Chang. Biol. 2008, 14, 2501–2515. [Google Scholar] [CrossRef]
- Guisan, A.; Zimmermann, N.E. Predictive habitat distribution models in ecology. Ecol. Model 2000, 135, 147–186. [Google Scholar] [CrossRef]
- Jiang, F.; Li, G.Y.; Qin, W.; Zhang, J.J.; Lin, G.H.; Cai, Z.Y.; Gao, H.M.; Zhang, T.Z. Setting priority conservation areas of wild Tibetan gazelle (Procapra picticaudata) in China’s first national park. Glob. Ecol. Conserv. 2019, 20, e00725. [Google Scholar] [CrossRef]
- Nagendra, H.; Lucas, R.; Honrado, J.P.; Jongman, R.H.G.; Tarantino, C.; Adamo, M.; Mairota, P. Remote sensing for conservation monitoring: Assessing protected areas, habitat extent, habitat condition, species diversity, and threats. Ecol. Indic. 2013, 33, 45–59. [Google Scholar] [CrossRef]
- Moya, W.; Jacome, G.; Yoo, C. Past, current, and future trends of red spiny lobster based on PCA with MaxEnt model in Galapagos Islands, Ecuador. Ecol. Evol. 2017, 7, 4881–4890. [Google Scholar] [CrossRef] [Green Version]
- Elith, J.; Graham, C.H.; Anderson, R.P.; Dudik, M.; Ferrier, S.; Guisan, A.; Hijmans, R.J.; Huettmann, F.; Leathwick, J.R.; Lehmann, A.; et al. Novel methods improve prediction of species’ distributions from occurrence data. Ecography 2006, 29, 129–151. [Google Scholar] [CrossRef] [Green Version]
- Wisz, M.S.; Hijmans, R.J.; Li, J.; Peterson, A.T.; Graham, C.H.; Guisan, A. Effects of sample size on the performance of species distribution models. Divers. Distrib. 2008, 14, 763–773. [Google Scholar] [CrossRef]
- Sillero, N.; Arenas-Castro, S.; Enriquez-Urzelai, U.; Vale, C.G.; Sousa-Guedes, D.; Martínez-Freiría, F.; Real, R.; Barbosa, A.M. Want to model a species niche? A step-by-step guideline on correlative ecological niche modelling. Ecol. Model 2021, 456, 109671. [Google Scholar] [CrossRef]
- Romero, D.; Olivero, J.; Brito, J.C.; Real, R. Comparison of approaches to combine species distribution models based on different sets of predictors. Ecography 2016, 39, 561–571. [Google Scholar] [CrossRef]
- Pearson, R.G.; Raxworthy, C.J.; Nakamura, M.; Peterson, A.T. Predicting species distributions from small numbers of occurrence records: A test case using cryptic geckos in Madagascar. J. Biogeogr. 2007, 34, 102–117. [Google Scholar] [CrossRef]
- Phillips, S.J.; Anderson, R.P.; Schapire, R.E. Maximum entropy modeling of species geographic distributions. Ecol. Model 2006, 190, 231–259. [Google Scholar] [CrossRef] [Green Version]
- Radosavljevic, A.; Anderson, R.P. Making better MAXENT models of species distributions: Complexity, overfitting and evaluation. J. Biogeogr. 2014, 41, 629–643. [Google Scholar] [CrossRef]
- Raxworthy, C.J.; Ingram, C.M.; Rabibisoa, N.; Pearson, R.G. Applications of ecological niche modeling for species delimitation: A review and empirical evaluation using day geckos (Phelsuma) from Madagascar. Syst. Biol. 2007, 56, 907–923. [Google Scholar] [CrossRef] [Green Version]
- Koo, K.S.; Choe, M. Distribution Change of Invasive American Bullfrogs (Lithobates catesbeianus) by Future Climate Threaten Endangered Suweon Treefrog (Hyla suweonensis) in South Korea. Animal 2021, 11, 2865. [Google Scholar] [CrossRef]
- Ebrahimi, A.; Farashi, A.; Rashki, A. Habitat suitability of Persian leopard (Panthera pardus saxicolor) in Iran in future. Environ. Earth Sci. 2017, 76, 697. [Google Scholar] [CrossRef]
- Rostro-García, S.; Kamler, J.F.; Ash, E.; Clements, G.R.; Gibson, L.; Lynam, A.J.; McEwing, R.; Naing, H.; Paglia, S. Endangered leopards: Range collapse of the Indochinese leopard (Panthera pardus delacouri) in Southeast Asia. Biol. Conserv. 2016, 201, 293–300. [Google Scholar] [CrossRef]
- Vitkalova, A.V.; Feng, L.; Rybin, A.N.; Gerber, B.D.; Miquelle, D.G.; Wang, T.; Yang, H.; Shevtsova, E.I.; Aramilev, V.V.; Ge, J. Transboundary cooperation improves endangered species monitoring and conservation actions: A case study of the global population of Amur leopards. Conserv. Lett. 2018, 11, e12574. [Google Scholar] [CrossRef]
- Smith, A.T.; Gemma, F.; Xie, Y.; Hoffmann, R.S.; Lunde, D.; Mackinnon, J. A Guide to the Mammals of China; Princeton University Press: Princeton, NJ, USA, 2008; pp. 1–669. [Google Scholar]
- Jiang, Z.; Jiang, J.; Wang, Y.; Zhang, E.; Zhang, Y.; Li, L.; Xie, F.; Cai, B.; Cao, L.; Zheng, G.; et al. Red List of China’s Vertebrates. Biodivers. Sci. 2016, 24, 500–551. [Google Scholar]
- De, Q.F. Investigation and study on Leopard population in Tieqiaoshan Provincial Nature Reserve. Shanxi For. 2020, 01, 26–48. [Google Scholar]
- Wang, S.; Zhang, H.; Wu, X.; Xu, X.; Zhang, W.; Hu, Y.; Su, L.; Xia, G.; Hu, H.; Gong, H.; et al. Investigation of Wild Animal Resources Such as Leopard in Liupanshan National Nature Reserve of Ningxia. Ningxia Hui Autonomous Region, Ningxia Liupanshan National Nature Reserve Administration. 2019. Available online: https://kns.cnki.net/KCMS/detail/detail.aspx?dbname=SNAD&filename=SNAD000001836425 (accessed on 7 July 2022).
- Laguardia, A.; Kamler, J.F.; Li, S.; Zhang, C.; Zhou, Z.; Shi, K. The current distribution and status of leopards Panthera pardus in China. Oryx 2015, 51, 153–159. [Google Scholar] [CrossRef] [Green Version]
- Hua, Y.; Cao, H.; Wang, J.; He, F.; Jiang, G. Gut microbiota and fecal metabolites in captive and wild North China leopard (Panthera pardus japonensis) by comparsion using 16 s rRNA gene sequencing and LC/MS-based metabolomics. BMC Vet. Res. 2020, 16, 363. [Google Scholar] [CrossRef]
- Wei, L.; Wu, X.; Zhu, L.; Jiang, Z. Mitogenomic analysis of the genus Panthera. Sci. China Life Sci. 2011, 54, 917–930. [Google Scholar] [CrossRef] [Green Version]
- Hebblewhite, M.; Miquelle, D.G.; Murzin, A.A.; Aramilev, V.V.; Pikunov, D.G. Predicting potential habitat and population size for reintroduction of the Far Eastern leopards in the Russian Far East. Biol. Conserv. 2011, 144, 2403–2413. [Google Scholar] [CrossRef]
- Liu, J.G.; Linderman, M.; Ouyang, Z.Y.; An, L.; Yang, J.; Zhang, H.M. Ecological degradation in protected areas: The case of Wolong Nature Reserve for giant pandas. Science 2001, 292, 98–101. [Google Scholar] [CrossRef] [Green Version]
- Caro, T.M.; O’Doherty, G. On the Use of Surrogate Species in Conservation Biology. Conserv. Biol. 1999, 13, 805–814. [Google Scholar] [CrossRef]
- Xiang, T.W. Scientific Investigation of Liupanshan Nature Reserve; Ningxia People’s Press: Yinchuan, China, 1988; pp. 1–356. [Google Scholar]
- Chen, Y.N.; Li, Z.; Fan, Y.T.; Wang, H.J.; Deng, H.J. Progress and prospects of climate change impacts on hydrology in the arid region of northwest China. Environ. Res. 2015, 139, 11–19. [Google Scholar] [CrossRef]
- Jin, Y.Z.; Jie, H.; Jing, S.S.; Ya, Q.W.; Zhi, H.G.; Sen, S.; Jia, Q.L. A Survey of Mammal and Bird Diversity Using Camera-trapping in Liupanshan National Nature Reserve in Ningxia. J. Ecol. Rural. Environ. 2022, 38, 209–216. [Google Scholar]
- Mortberg, U.M.; Balfors, B.; Knol, W.C. Landscape ecological assessment: A tool for integrating biodiversity issues in strategic environmental assessment and planning. J. Environ. Manag. 2007, 82, 457–470. [Google Scholar] [CrossRef] [PubMed]
- Xue, Y.D.; Li, J.; Zhang, Y.; Li, D.Q.; Yuan, L.; Cheng, Y.; Liu, S.C.; Hacker, C.E. Assessing the vulnerability and adaptation strategies of wild camel to climate change in the Kumtag Desert of China. Glob. Ecol. Conserv. 2021, 29, e01725. [Google Scholar] [CrossRef]
- Wani, I.A.; Verma, S.; Mushtaq, S.; Alsahli, A.A.; Alyemeni, M.N.; Tariq, M.; Pant, S. Ecological analysis and environmental niche modelling of Dactylorhiza hatagirea (D. Don) Soo: A conservation approach for critically endangered medicinal orchid. Saudi J. Biol. Sci. 2021, 28, 2109–2122. [Google Scholar] [CrossRef] [PubMed]
- Eyre, A.C.; Briscoe, N.J.; Harley, D.K.P.; Lumsden, L.F.; McComb, L.B.; Lentini, P.E. Using species distribution models and decision tools to direct surveys and identify potential translocation sites for a critically endangered species. Divers. Distrib. 2022, 28, 700–711. [Google Scholar] [CrossRef]
- Ruan, T.; Han, H.; Wei, W.; Qiu, L.; Hong, M.S.; Tang, J.F.; Zhou, H.; Zhang, Z.J. Habitat suitability evaluation for giant panda in Liziping National Nature Reserve, Sichuan Province. Glob. Ecol. Conserv. 2021, 30, e01780. [Google Scholar] [CrossRef]
- Peng, S.J.; Zhang, J.; Zhang, X.L.; Li, Y.Q.; Liu, Y.P.; Wang, Z.H. Conservation of woody species in China under future climate and land-cover changes. J. Appl. Ecol. 2022, 59, 141–152. [Google Scholar] [CrossRef]
- Yang, Z.; Bai, Y.; Alatalo, J.M.; Huang, Z.; Yang, F.; Pu, X.; Wang, R.; Yang, W.; Guo, X. Spatio-temporal variation in potential habitats for rare and endangered plants and habitat conservation based on the maximum entropy model. Sci. Total Environ. 2021, 784, 147080. [Google Scholar] [CrossRef]
- Chen, X.; Wang, X.; Li, J.; Kang, D. Integrating Livestock Grazing and Sympatric Takin to Evaluate the Habitat Suitability of Giant Panda in the Wanglang Nature Reserve. Animal 2021, 11, 2469. [Google Scholar] [CrossRef]
- Lobo, J.M.; Jiménez-Valverde, A.; Real, R. AUC: A misleading measure of the performance of predictive distribution models. Glob. Ecol. Biogeogr. 2008, 17, 145–151. [Google Scholar] [CrossRef]
- Tang, S.L.; Song, Y.B.; Zeng, B.; Dong, M. Potential distribution of the extremely endangered species Ostrya rehderiana (Betulaceae) in China under future climate change. Environ. Sci. Pollut. Res. Int. 2022, 29, 7782–7792. [Google Scholar] [CrossRef]
- Wang, F.; Li, M.; Zhang, Y.S.; Zhao, W.A.; Liu, D.N.; Zhang, Y.Z.; Zhang, H.; Ye, X.P.; Yu, X.P. Post-release dispersal and breeding site suitability of reintroduced populations of the Crested Ibis in Shaanxi Province, China. Restor. Ecol. 2021, 29, e13383. [Google Scholar] [CrossRef]
- Noviello, N.; McGonigle, C.; Jacoby, D.M.P.; Meyers, E.K.M.; Jimenez-Alvarado, D.; Barker, J. Modelling Critically Endangered marine species: Bias-corrected citizen science data inform habitat suitability for the angelshark (Squatina squatina). Aquat. Conserv. 2021, 31, 3451–3465. [Google Scholar] [CrossRef]
- Anderson, R.P.; Raza, A. The effect of the extent of the study region on GIS models of species geographic distributions and estimates of niche evolution: Preliminary tests with montane rodents (genus Nephelomys) in Venezuela. J. Biogeogr. 2010, 37, 1378–1393. [Google Scholar] [CrossRef]
- Ji, M.C. Comprehensive Scientific Investigation Report of Liupanshan National Nature Reserve; Science Press: Beijing, China, 2013; pp. 6–109. [Google Scholar]
- Zhu, M.; Zaman, M.; Wang, M.; Vitekere, K.; Ma, J.; Jiang, G. Population Density and Driving Factors of North China Leopards in Tie Qiao Shan Nature Reserve. Animal 2021, 11, 429. [Google Scholar] [CrossRef] [PubMed]
- Aryal, A.; Shrestha, U.B.; Ji, W.; Ale, S.B.; Shrestha, S.; Ingty, T.; Maraseni, T.; Cockfield, G.; Raubenheimer, D. Predicting the distributions of predator (snow leopard) and prey (blue sheep) under climate change in the Himalaya. Ecol. Evol. 2016, 6, 4065–4075. [Google Scholar] [CrossRef] [Green Version]
- Mondal, K.; Sankar, K.; Qureshi, Q. Factors influencing the distribution of leopard in a semiarid landscape of Western India. Acta Theriol. 2012, 58, 179–187. [Google Scholar] [CrossRef]
- Ciais, P.; Reichstein, M.; Viovy, N.; Granier, A.; Ogee, J.; Allard, V.; Aubinet, M.; Buchmann, N.; Bernhofer, C.; Carrara, A.; et al. Europe-wide reduction in primary productivity caused by the heat and drought in 2003. Nature 2005, 437, 529–533. [Google Scholar] [CrossRef]
- Wibisono, H.T.; Wahyudi, H.A.; Wilianto, E.; Pinondang, I.M.R.; Primajati, M.; Liswanto, D.; Linkie, M. Identifying priority conservation landscapes and actions for the Critically Endangered Javan leopard in Indonesia: Conserving the last large carnivore in Java Island. PLoS ONE 2018, 13, e0198369. [Google Scholar] [CrossRef]
- Barimalala, R.; Raholijao, N.; Pokam, W.; Reason, C.J.C. Potential impacts of 1.5 °C, 2 °C global warming levels on temperature and rainfall over Madagascar. Environ. Res. Lett. 2021, 16, 044019. [Google Scholar] [CrossRef]
- Blois, J.L.; Zarnetske, P.L.; Fitzpatrick, M.C.; Finnegan, S. Climate change and the past, present, and future of biotic interactions. Science 2013, 341, 499–504. [Google Scholar] [CrossRef] [Green Version]
- Steinmetz, R.; Seuaturien, N.; Chutipong, W. Tigers, leopards, and dholes in a half-empty forest: Assessing species interactions in a guild of threatened carnivores. Biol. Conserv. 2013, 163, 68–78. [Google Scholar] [CrossRef]


| Variable Abbreviation | Variable Description | Unit | Sources |
|---|---|---|---|
| bio 1 | annual mean temperature | °C | 1 |
| bio 2 | mean diurnal range (mean of monthly [max temp − min temp]) | °C | 1 |
| bio 3 | isothermality (bio2/bio7) (×100) | % | 1 |
| bio 4 | temperature seasonality (standard deviation × 100) | °C/100 | 1 |
| bio 5 | max temperature of warmest month | °C | 1 |
| bio 6 | min temperature of coldest month | °C | 1 |
| bio 7 | temperature annual range (bio 5–bio 6) | °C | 1 |
| bio 8 | mean temperature of wettest quarter | °C | 1 |
| bio 9 | mean temperature of driest quarter | °C | 1 |
| bio 10 | mean temperature of warmest quarter | °C | 1 |
| bio 11 | mean temperature of coldest quarter | °C | 1 |
| bio 12 | annual precipitation | mm | 1 |
| bio 13 | precipitation of wettest month | mm | 1 |
| bio 14 | precipitation of driest month | mm | 1 |
| bio 15 | precipitation seasonality (coefficient of variation) | % | 1 |
| bio 16 | precipitation of wettest quarter | mm | 1 |
| bio 17 | precipitation of driest quarter | mm | 1 |
| bio 18 | precipitation of warmest quarter | mm | 1 |
| bio19 | precipitation of coldest quarter | mm | 1 |
| lc | land cover type | 2 | |
| ndvi | normalized differential vegetation index | 2 | |
| vfc | vegetation fractional cover | % | 2 |
| places | distance to villages | m | 3 |
| road | distance to roads | m | 3 |
| water | distance to water | m | 3 |
| slope | slope | ° | 4 |
| altitude | altitude | m | 4 |
| aspect | aspect | ° | 4 |
| bio3 | bio6 | bio12 | lc | Places | Road | vfc | Altitude | |
|---|---|---|---|---|---|---|---|---|
| bio6 | 0.308 | |||||||
| bio12 | −0.391 | −0.410 | ||||||
| lc | −0.321 | −0.364 | 0.161 | |||||
| places | 0.650 | −0.267 | −0.409 | −0.110 | ||||
| road | −0.303 | −0.343 | −0.223 | 0.448 | 0.190 | |||
| vfc | −0.273 | 0.005 | −0.366 | 0.435 | 0.059 | 0.580 | ||
| altitude | −0.269 | −0.430 | 0.442 | −0.126 | −0.049 | −0.211 | −0.025 | |
| aspect | −0.215 | 0.200 | −0.175 | −0.110 | −0.102 | 0.122 | 0.108 | −0.165 |
| Environmental Factor | Contribution Rate | ||||||
|---|---|---|---|---|---|---|---|
| Natural Reserve | Guyuan | Ningxia | Guyuan (Modern) | rcp2.6 | rcp4.5 | rcp8.5 | |
| bio1 | |||||||
| bio2 | 3.5 | 60.3 | |||||
| bio3 | 8.3 | 7.8 | 25.6 | 2.5 | 11.5 | ||
| bio4 | 0.8 | 12.4 | |||||
| bio5 | |||||||
| bio6 | 45.5 | ||||||
| bio7 | |||||||
| bio8 | |||||||
| bio9 | |||||||
| bio10 | |||||||
| bio11 | 8.2 | 1.2 | |||||
| bio12 | 2.9 | 8.4 | 9.3 | ||||
| bio13 | |||||||
| bio14 | 1.4 | 21.8 | 18.5 | 19.9 | |||
| bio15 | 5.4 | 3.8 | 1.1 | 8.2 | |||
| bio16 | 12.7 | 62.4 | 60.4 | 48 | |||
| bio17 | 9.5 | 18.8 | |||||
| bio18 | |||||||
| bio19 | |||||||
| lc | 1 | 0.5 | 0.3 | ||||
| ndvi | 42.3 | 43 | |||||
| vfc | 15.6 | 27.6 | 34.2 | ||||
| places | 0.4 | ||||||
| road | 5.3 | 0.3 | |||||
| water | |||||||
| slope | |||||||
| altitude | 2.4 | 4.8 | 2.7 | ||||
| aspect | 18.6 | 0.1 | 0.8 | ||||
Publisher’s Note: MDPI stays neutral with regard to jurisdictional claims in published maps and institutional affiliations. |
© 2022 by the authors. Licensee MDPI, Basel, Switzerland. This article is an open access article distributed under the terms and conditions of the Creative Commons Attribution (CC BY) license (https://creativecommons.org/licenses/by/4.0/).
Share and Cite
Zeng, J.; Hu, J.; Shi, Y.; Li, Y.; Guo, Z.; Wang, S.; Song, S. Effects of Climate Change on the Habitat of the Leopard (Panthera pardus) in the Liupanshan National Nature Reserve of China. Animals 2022, 12, 1866. https://doi.org/10.3390/ani12141866
Zeng J, Hu J, Shi Y, Li Y, Guo Z, Wang S, Song S. Effects of Climate Change on the Habitat of the Leopard (Panthera pardus) in the Liupanshan National Nature Reserve of China. Animals. 2022; 12(14):1866. https://doi.org/10.3390/ani12141866
Chicago/Turabian StyleZeng, Jinyuan, Jie Hu, Yurou Shi, Yueqi Li, Zhihong Guo, Shuanggui Wang, and Sen Song. 2022. "Effects of Climate Change on the Habitat of the Leopard (Panthera pardus) in the Liupanshan National Nature Reserve of China" Animals 12, no. 14: 1866. https://doi.org/10.3390/ani12141866