Article

Transcriptome Sequencing to Identify Important Genes and lncRNAs Regulating Abdominal Fat Deposition in Ducks

Key Laboratory of Animal Genetics and Breeding and Molecular Design of Jiangsu Province, Yangzhou University, Yangzhou 225009, China
*
Authors to whom correspondence should be addressed.
Animals 2022, 12(10), 1256; https://doi.org/10.3390/ani12101256
Submission received: 3 April 2022 / Revised: 2 May 2022 / Accepted: 10 May 2022 / Published: 13 May 2022

Abstract

:

Simple Summary

Abdominal fat deposition affects the quality of duck meat and the feed conversion ratio. Here, we performed transcriptome sequencing of the abdominal adipose tissue of ducks with high and low abdominal fat rate by RNA sequencing, exploring the key regulatory genes and lncRNAs related to abdominal fat deposition. As a result, several candidate genes, lncRNAs, and pathways related to abdominal fat deposition in ducks were retrieved. This study lays the foundations for exploring molecular mechanisms underlying the regulation of abdominal fat deposition in ducks, providing a theoretical reference for breeding high-quality meat-producing ducks.

Abstract

Abdominal fat deposition is an important trait in meat-producing ducks. F2 generations of 304 Cherry Valley and Runzhou Crested White ducks were studied to identify genes and lncRNAs affecting abdominal fat deposition. RNA sequencing was used to study abdominal fat tissue of four ducks each with high or low abdominal fat rates. In all, 336 upregulated and 297 downregulated mRNAs, and 95 upregulated and 119 downregulated lncRNAs were identified. Target gene prediction of differentially expressed lncRNAs identified 602 genes that were further subjected to Gene Ontology and KEGG pathway analysis. The target genes were enriched in pathways associated with fat synthesis and metabolism and participated in biological processes, including Linoleic acid metabolism, lipid storage, and fat cell differentiation, indicating that these lncRNAs play an important role in abdominal fat deposition. PPAPA, FOXO3, FASN, PNPLA2, FKBP5, TCF7L2, BMP2, FGF2, LIFR, ZBTB16, SIRT, GYG2, NCOR1, and NR3C1 were involved in the regulation of abdominal fat deposition. PNPLA2, TCF7L2, FGF2, LIFR, BMP2, FKBP5, GYG2, and ZBTB16 were regulated by the lncRNAs TCONS_00038080, TCONS_0033547, TCONS_00066773, XR_001190174.3, XR_003492471.1, XR_003493494.1, XR_001192142.3, XR_002405656.2, XR_002401822.2, XR_003497063.1, and so on. This study lays foundations for exploring molecular mechanisms underlying the regulation of abdominal fat deposition in ducks and provides a theoretical basis for breeding high-quality meat-producing ducks.

1. Introduction

Ducks reared for meat have a short feeding cycle, fast growth rate, high meat production rate, and good meat quality, and occupy an important position among poultry meats. Abdominal fat deposition is a complex quantitative trait and an important economic trait in the duck meat industry. It is closely associated with the animal’s genetic background, developmental stage, and nutritional level. It is regulated by a cascade of genetic factors, including transcription factors, functional genes, long non-coding RNAs (lncRNAs), and adipogenic-related signaling pathways. Fats are composed of a variety of fatty acids that affect meat flavor, pH, tenderness, and juiciness [1]. The abdomen is an important location for the deposition of duck fat. Abdominal fat deposits negatively influence the taste of duck meat and reduce their feed conversion rate, hence affecting the economic benefit to the breeding industry. Therefore, research has focused on effectively controlling abdominal fat deposition in ducks and identifying the underlying genetic mechanisms.
LncRNAs are a class of non-coding RNAs with lengths greater than 200 bp [2] and almost no protein-coding capability [3]. Most lncRNAs have significant spatio-temporal expression specificity [4,5], low sequence conservation across species [6,7], and can directly or indirectly regulate adipogenesis [8]. They play an important regulatory function in various biological processes, including adipocyte differentiation and lipid metabolism [9,10,11]. With breakthroughs and innovations in high-throughput sequencing technologies, more lncRNAs have been shown to regulate fat metabolism at the epigenetic, transcriptional, and post-transcriptional levels [12,13]. Transcriptome sequencing (RNA-seq) is a useful tool for transcriptomic analysis that can be used to study molecular mechanisms from the perspective of multi-gene network regulation, leading to the identification of structural genomic changes, gene fusion events, and novel genes and transcripts [14]. RNA-seq has high sensitivity when it comes to identifying differentially expressed genes and quantitatively analyzing transcriptomes [15] and has been widely used in the identification and functional analysis of lncRNAs and mRNAs in adipose tissue of pigs [16,17], chickens [18], sheep [5,19], and cattle [20].
There has been a recent increase in the use of RNA-seq analysis to identify key lncRNAs that regulate animal adipose tissue. However, multiple lncRNAs associated with fat metabolism in ducks have not yet been identified, and the relationship between some lncRNAs and their potential target genes is not clear. Here, the F2 generation of Cherry Valley Duck × Runzhou Crested White Duck cross was studied. RNA-seq data was used to analyze the abdominal fat tissue of four ducks with high abdominal fat rate (HF) and four ducks with low abdominal fat rate (LF) to identify important genes and lncRNAs that regulate abdominal fat deposition in ducks. This study provides a basis for the identification of the molecular mechanism underlying the regulation of duck abdominal fat deposition and provides an experimental basis for the protection, rearing, and utilization of ducks.

2. Materials and Methods

2.1. Animals and Study Samples

In this study, 304 F2 generation of Cherry Valley Duck × Runzhou Crested White Duck, composed of 162 male ducks and 142 female ducks, were purchased from Shuyang Zhongke Seed Poultry Co., Ltd. (Suqian, China). The ducks were reared in the same batch and under the same conditions for 42 days before being slaughtered according to NY/T823-2020 “Poultry Production Performance Terminology and Measurement Statistical Methods”. The body weight, whole evisceration weight, and abdominal fat weight were measured, and the abdominal fat rate calculated.

2.2. Total RNA Extraction and Sequencing

Total RNA was extracted from abdominal adipose tissue using the Trizol reagent kit (Invitrogen, Carlsbad, CA, USA) following the manufacturer’s instructions. RNA concentration and quality were measured at OD 260/280 using the Nanodrop ND-2000 ultra-micro spectrophotometer (Thermo Fisher Scientific, Waltham, MA, USA). The OD260/OD280 (Ratio, R) of the RNA was between 1.8 and 2.0 and the concentration was over 500 ng/µL. The integrity of the RNA was measured by analyzing 2 µL of the total RNA on a 1% agarose gel. The PrimeScript RT reagent Kit with gDNA Eraser was used to reverse transcribe the RNA to generate cDNA following the manufacturer’s instructions. A cDNA library was then constructed and sequenced on the Illumina HiSeqTM 4000.

2.3. Data Processing and Analysis

Fastp (0.18.0) [21] was used to control and filter the raw read data. Clean reads were obtained after removing reads containing adapters, reads with an N ratio exceeding 10%, reads with all A bases, and low-quality reads. The reads were filtered further to obtain high-quality clean reads. Bowtie 2 (2.2.8) [22] was used to align the high-quality clean reads against species-specific ribosomal sequences and sequences that aligned to ribosomal RNA were removed. The reads that were filtered out of ribosomal RNA were aligned to the duck reference genome (CAU-Wild 1.0) using the alignment software Tophat2 (2.1.1). Cufflink (2.1.1) software [23] was used to assemble transcripts based on the Tophat2 alignment results. Multiple sequence assemblies were merged using cuffmerge and filtered to generate unique annotation files for transcripts that may have been artificially introduced with assembly errors for subsequent differential analysis. Transcripts were further screened to obtain lncRNA information. Coding Potential Calculator (CPC, v0.9-r2) [24] and Coding-Non-Coding Index (CNCI, v2.0) [25] software were used to predict the coding abilities of new transcripts. The new transcripts were then aligned to the SwissProt protein database (https://ngdc.cncb.ac.cn, accessed on 18 February 2022) and the intersection of the results from the three software was taken as the identified lncRNAs.

2.4. Analysis of Differential Expression

Data-normalized quantification of FPKM (expected number of fragments per kilobase of transcript sequence per millions base pairs sequenced) for each individual duck was performed using StringTie (v1.3.1) software [26]. Differential expression analysis was performed using DESeq2 software [27], with fold change (FC, fold of difference) and p values being used to measure statistical significance. Among the high and low abdominal fat rate groups, mRNAs whose expression levels were associated with FC ≥ 2 and p ≤ 0.01 were considered differentially expressed mRNAs, while lncRNAs whose expression levels were associated with FC ≥ 2 and p ≤ 0.05 were considered differentially expressed.

2.5. Analysis of Gene Ontology and KEGG Pathway Enrichment

Gene Ontology (GO) is widely used in bioinformatics to analyze gene function from three aspects: Cellular Component (CC), Molecular Function (MF), and Biological Process (BP). Kyoto Encyclopedia of Genes and Genomes (KEGG) is a database for analyzing gene function and genomic information, allowing the study of genes and gene expression information as a whole network. In this study, GO annotation and KEGG functional enrichment analysis of differentially expressed mRNAs and lncRNAs were performed.

2.6. Combined mRNA and lncRNA Analysis

LncRNAs are involved in the regulation of many post-transcriptional processes, regulating target genes through antisense, cis, and trans effects. Similar to small RNAs such as miRNA and snoRNA, this regulation is often associated with complementary base pairing. Target genes were predicted using correlation or co-expression analysis of lncRNA and protein-coding genes. To show the interaction between lncRNA and mRNA, correlation of differentially expressed mRNAs and lncRNAs was performed to predict antisense, cis, and trans target genes.

2.7. Validation of DEGs Using Quantitative Real Time PCR (qRT-PCR)

qRT-PCR was used to verify the levels of expressed genes. Eight differentially expressed genes (four mRNAs and four lncRNAs) were randomly selected for validation (Table 1), with glyceraldehyde-3-phosphate dehydrogenase (GAPDH) as the internal reference gene. PowerUpTM SYBRTM Green Master Mix (A25742, Thermo Fisher, Beijing, China) and the LightCycler 96 Real-Time PCR Detection System (Roche, Basel, Switzerland) were used for qRT-PCR. A 20 µL reaction volume consisting of 10 µL PowerUp™ SYBR™ Green Master Mix (2X), 0.8 µL Forward Primer, 0.8 µL Reverse Primer, 2 µL cNDA template, and 6.4 µL ddH2O was used. The following qRT-PCR conditions were used: denaturation at 95 °C for 10 min, followed by 40 cycles of denaturation at 95 °C for 3 s, annealing at 50–60 °C for 30 s, and elongation at 72 °C for 20 s. Each sample was analyzed in triplicate.

2.8. Statistical Analysis

Excel 2019 software was used for data analysis. Results are expressed as mean ± standard deviation (Mean ± SD). Gene expression was calculated using the relative quantification (2−ΔΔCT) method. The t-test was used for pairwise analysis in SPSS 22.0 (SPSS, Inc., Chicago, IL, USA). p < 0.05 was used to represent statistically significant differences. GraphPad Prism 9.0 and Lianchuan biological cloud platform were used for generating maps.

3. Results

3.1. Selection of Individual Ducks

Analysis of 304 F2 generation of Cherry Valley × Runzhou Crested White duck crosses showed that the distribution of abdominal fat was associated with gender, and there were differences between ducks with high and low abdominal fat rates. About two-thirds of the ducks had abdominal fat rates of 0.75–1.5%. The 42 d F2 generation ducks with 0–0.75% and 1.5–2.25% abdominal fat rates were classified as having low and high abdominal fat rates, respectively. Differences between these two groups were statistically significant (p < 0.05). Four F2 generation male ducks in the high abdominal fat rate range and four in the low abdominal fat rate ranges were randomly selected for slaughter and extraction of abdominal fat tissue (Table 2).

3.2. Sequence Data Quality Statistics

The quality control of the sequence data from each sample is shown in Table 3. More than 80 M clean reads were obtained, with the proportion of high-quality clean reads for each sample being greater than 99.2%. A total of 734 M clean reads were obtained from eight samples. The read length was 150 + 150. The proportion of reads with Q20 was greater than 98%, while the proportion of reads with Q30 was greater than 94%. The reads aligned to the duck reference genome are shown in Table 4. The alignment rate of each sample was more than 80%. The sequence data met the requirements for bioinformatics analysis.

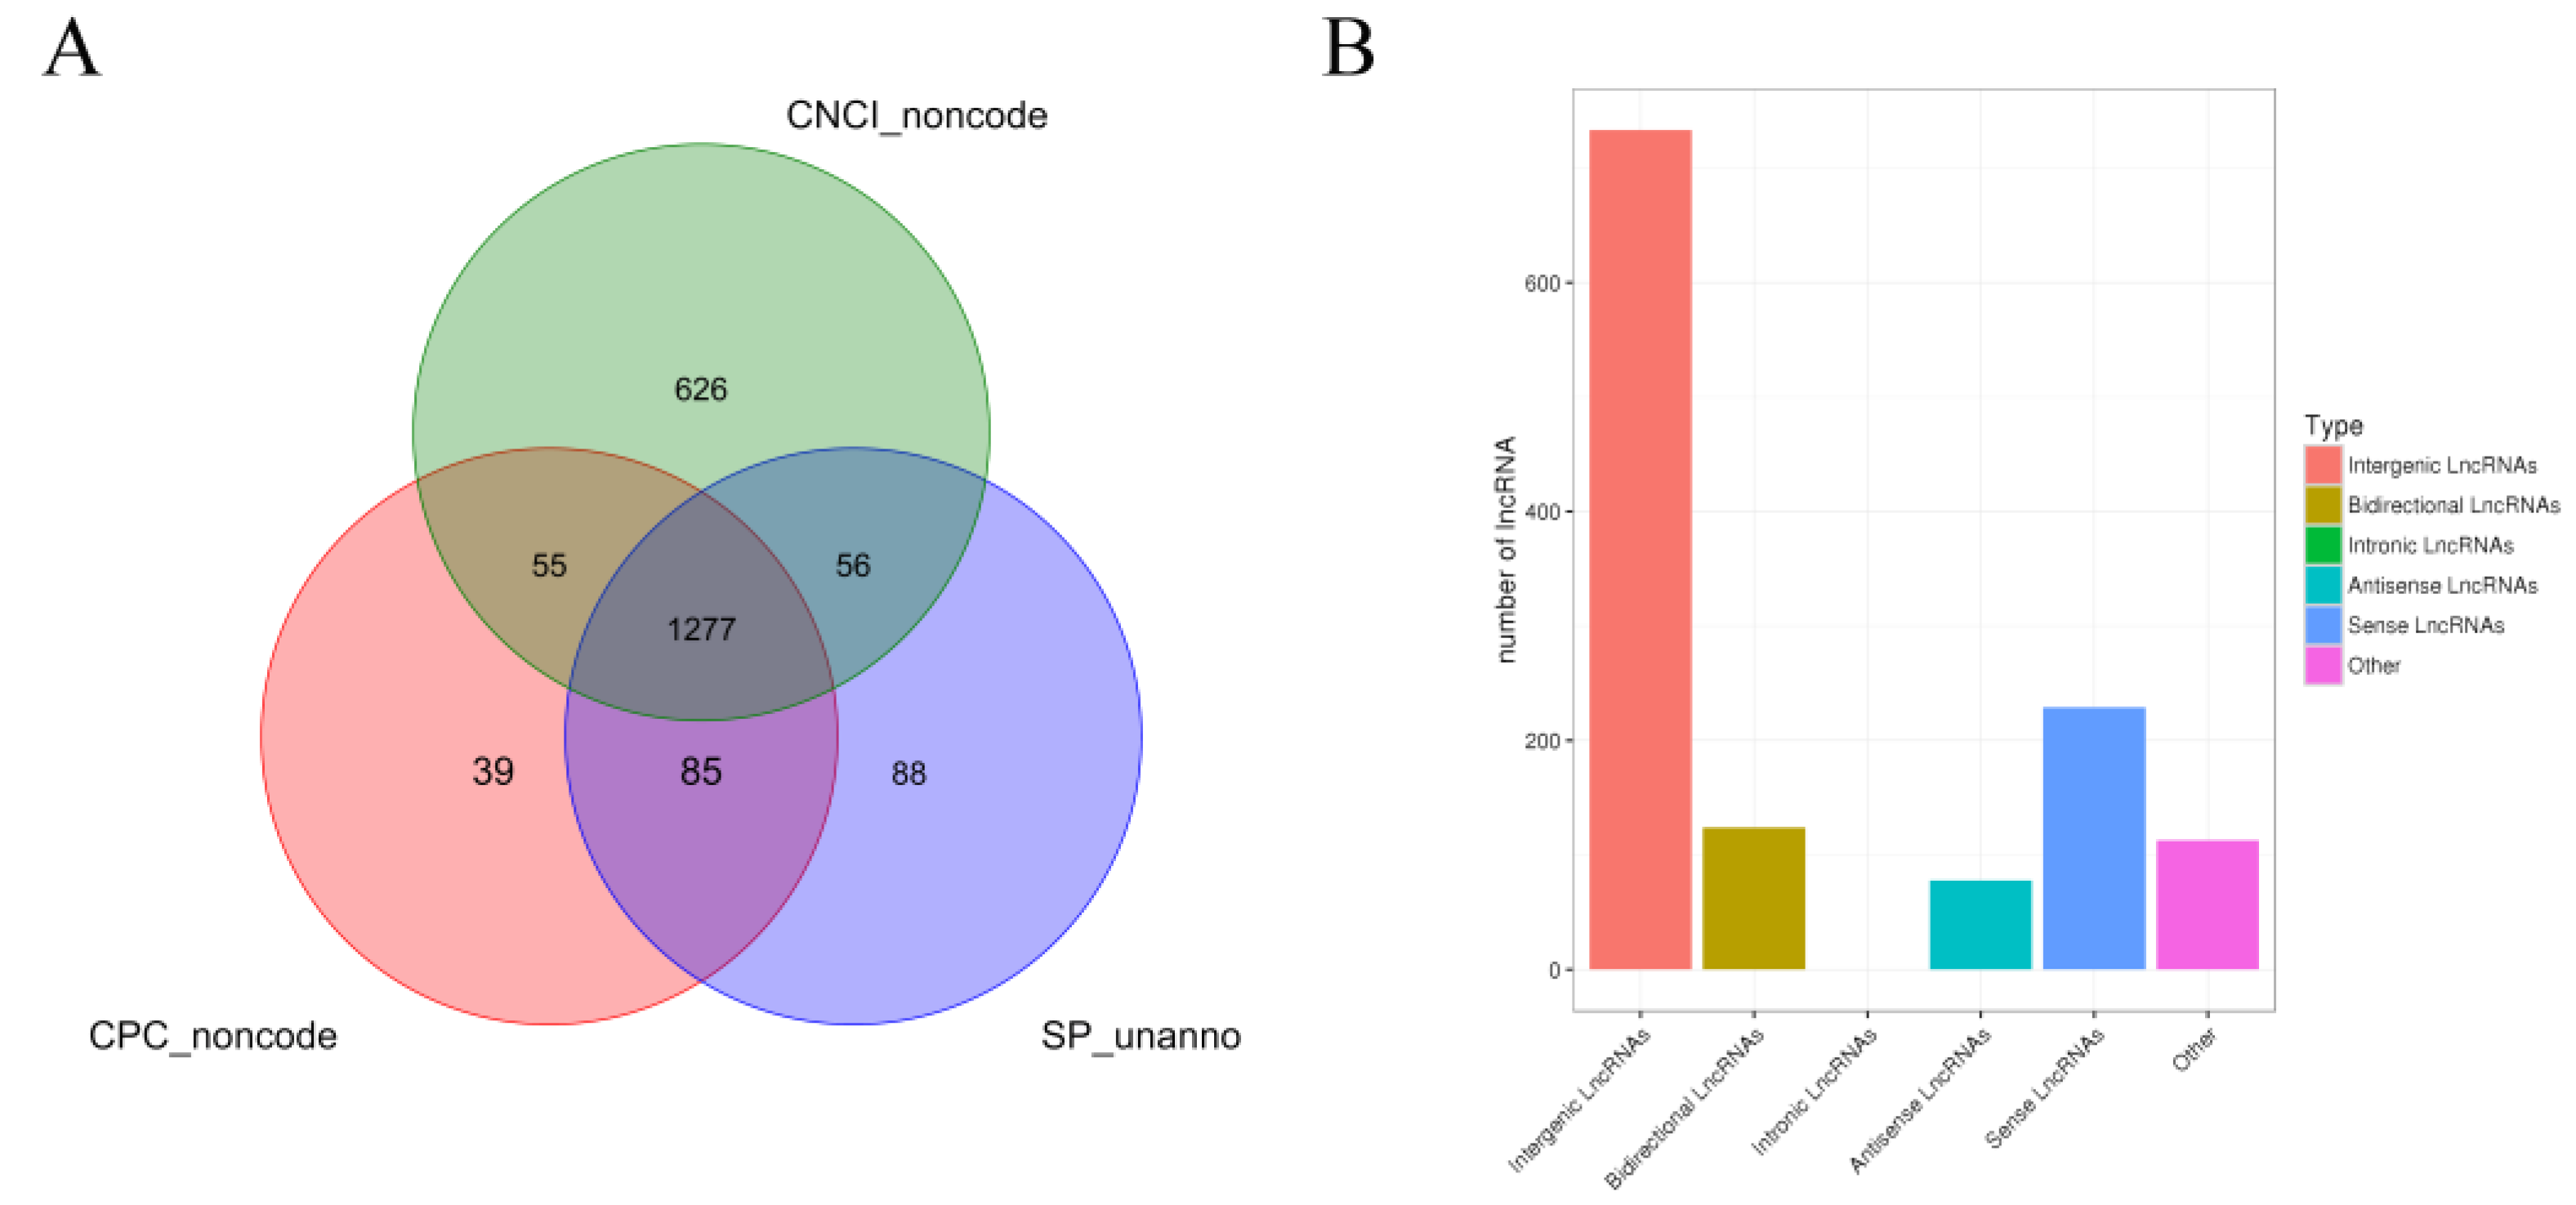
3.3. Screening and Identification of lncRNAs

A statistical summary of known and new mRNAs and lncRNAs in each sample is shown in Table 5. A total of 11,943 new transcripts were obtained by comparing the results and the length and position of the transcripts. CPC, CNCI, and SwissProt software were used to predict new lncRNAs of these new transcripts, and 1277 new lncRNAs were identified (Figure 1A). Based on the position of the new lncRNAs on the genome relative to the protein-coding genes, the identified lncRNAs were classified into five categories: 733 (57.4%) intergenic lncRNAs, 124 (9.7%) bidirectional lncRNA, 78 (6.1%) antisense lncRNA, 229 (17.9%) sense overlapping lncRNAs, and 113 (8.8%) other types of lncRNAs (Figure 1B).

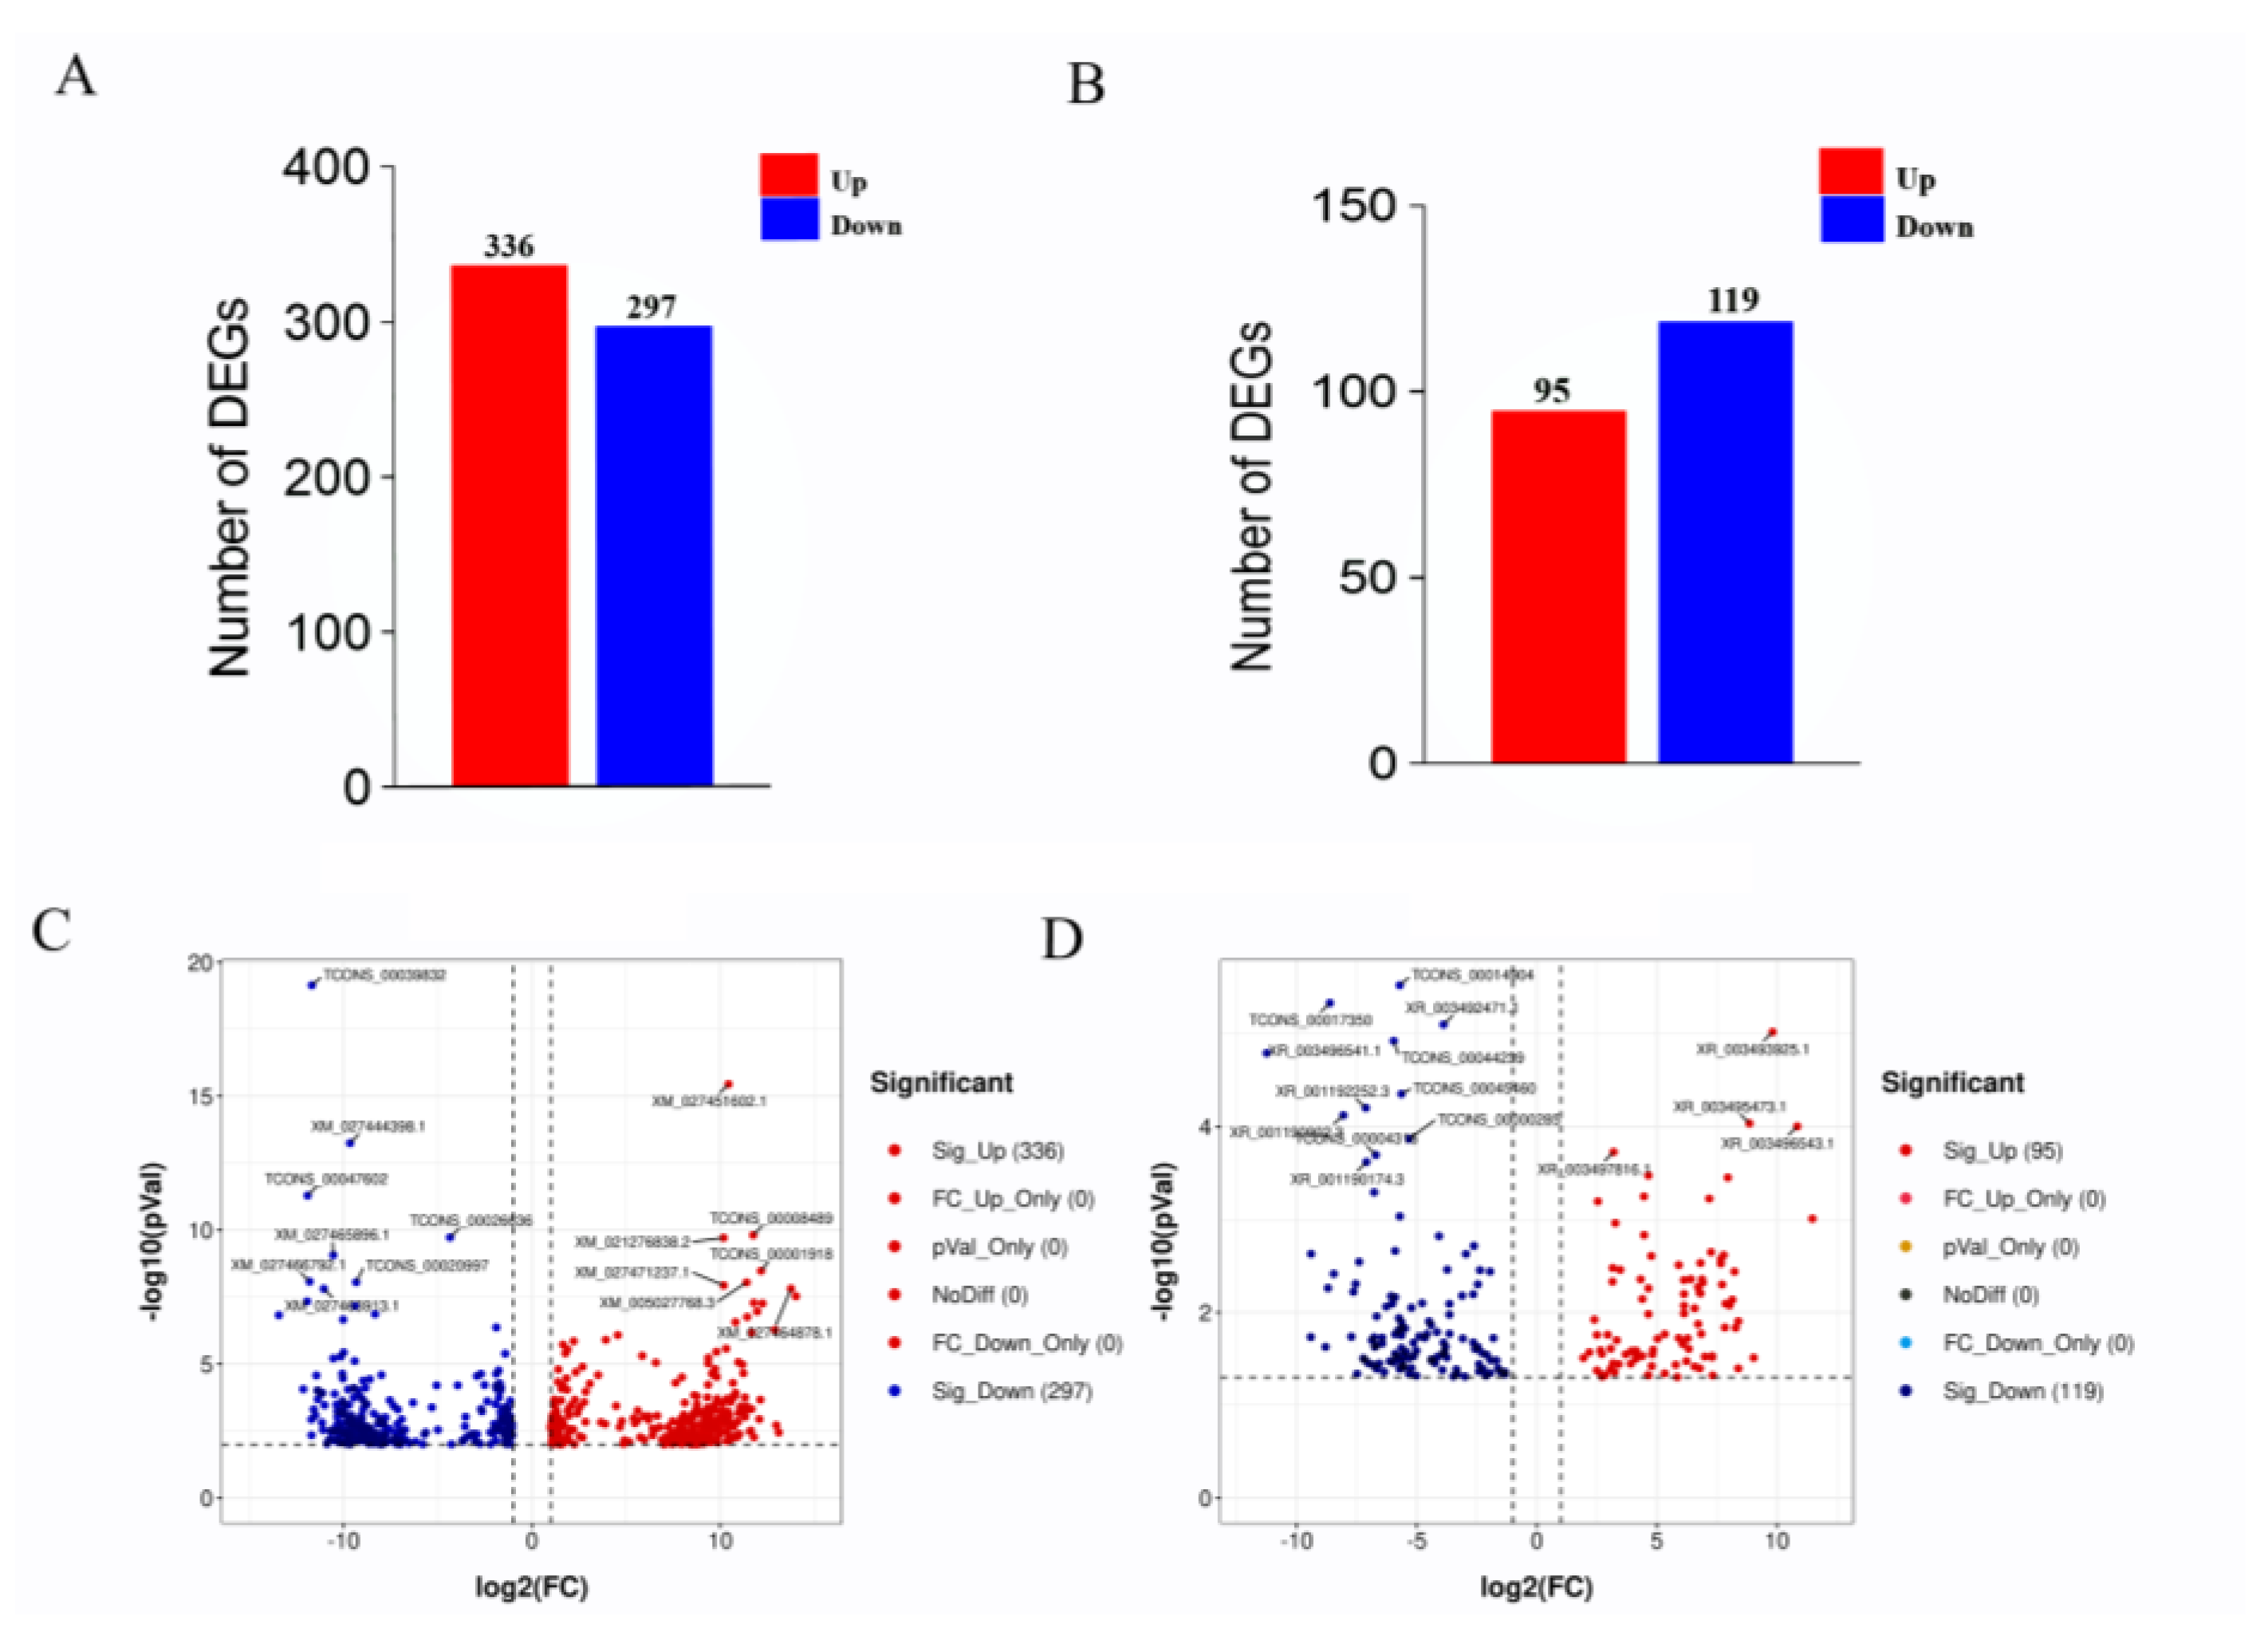
3.4. Analysis of Differentially Expressed Genes

High-throughput sequencing and related bioinformatic analysis were used to identify 39,904 mRNA transcripts, including 29,134 known and 8688 new transcripts. LncRNA and mRNA transcript expression profiles were analyzed for differential expression using Deseq2 (v1.6.3). mRNAs that were differentially expressed between the HF and LF groups were identified based on p ≤ 0.01 and |log2FC| ≥ 1 and lncRNAs that were differentially expressed between the HF and LF groups were identified based on p ≤ 0.05 and |log2FC| ≥ 1. A total of 633 differentially expressed mRNAs were identified, of which 336 were significantly upregulated and 297 genes were significantly downregulated (Figure 2A,C). We also identified 214 differentially expressed lncRNAs, of which 95 were significantly upregulated and 119 were significantly downregulated (Figure 2B,D).

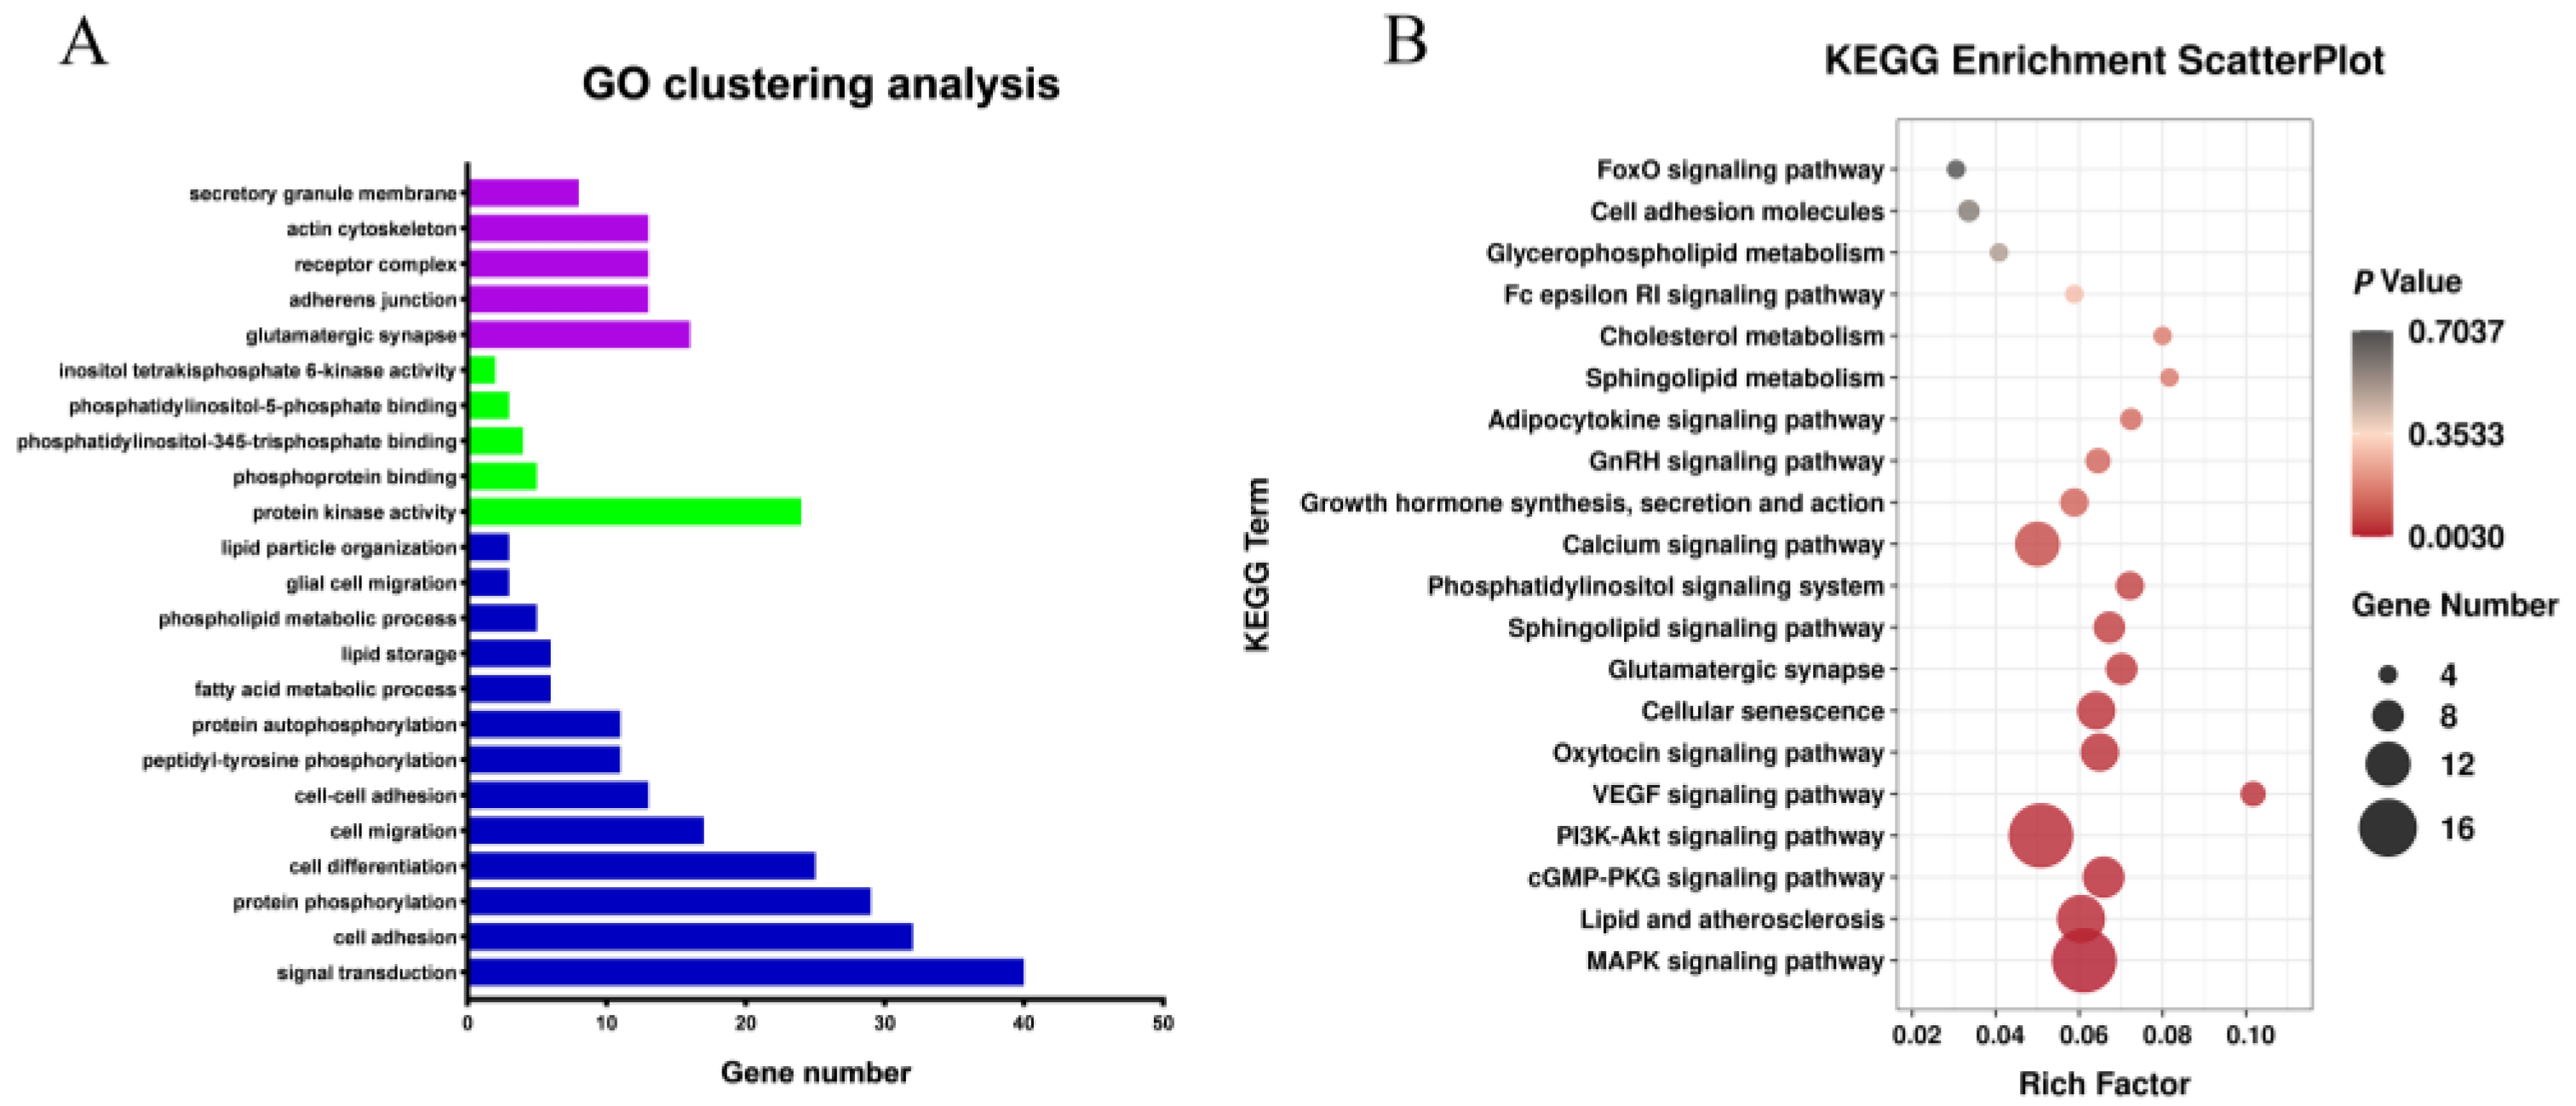
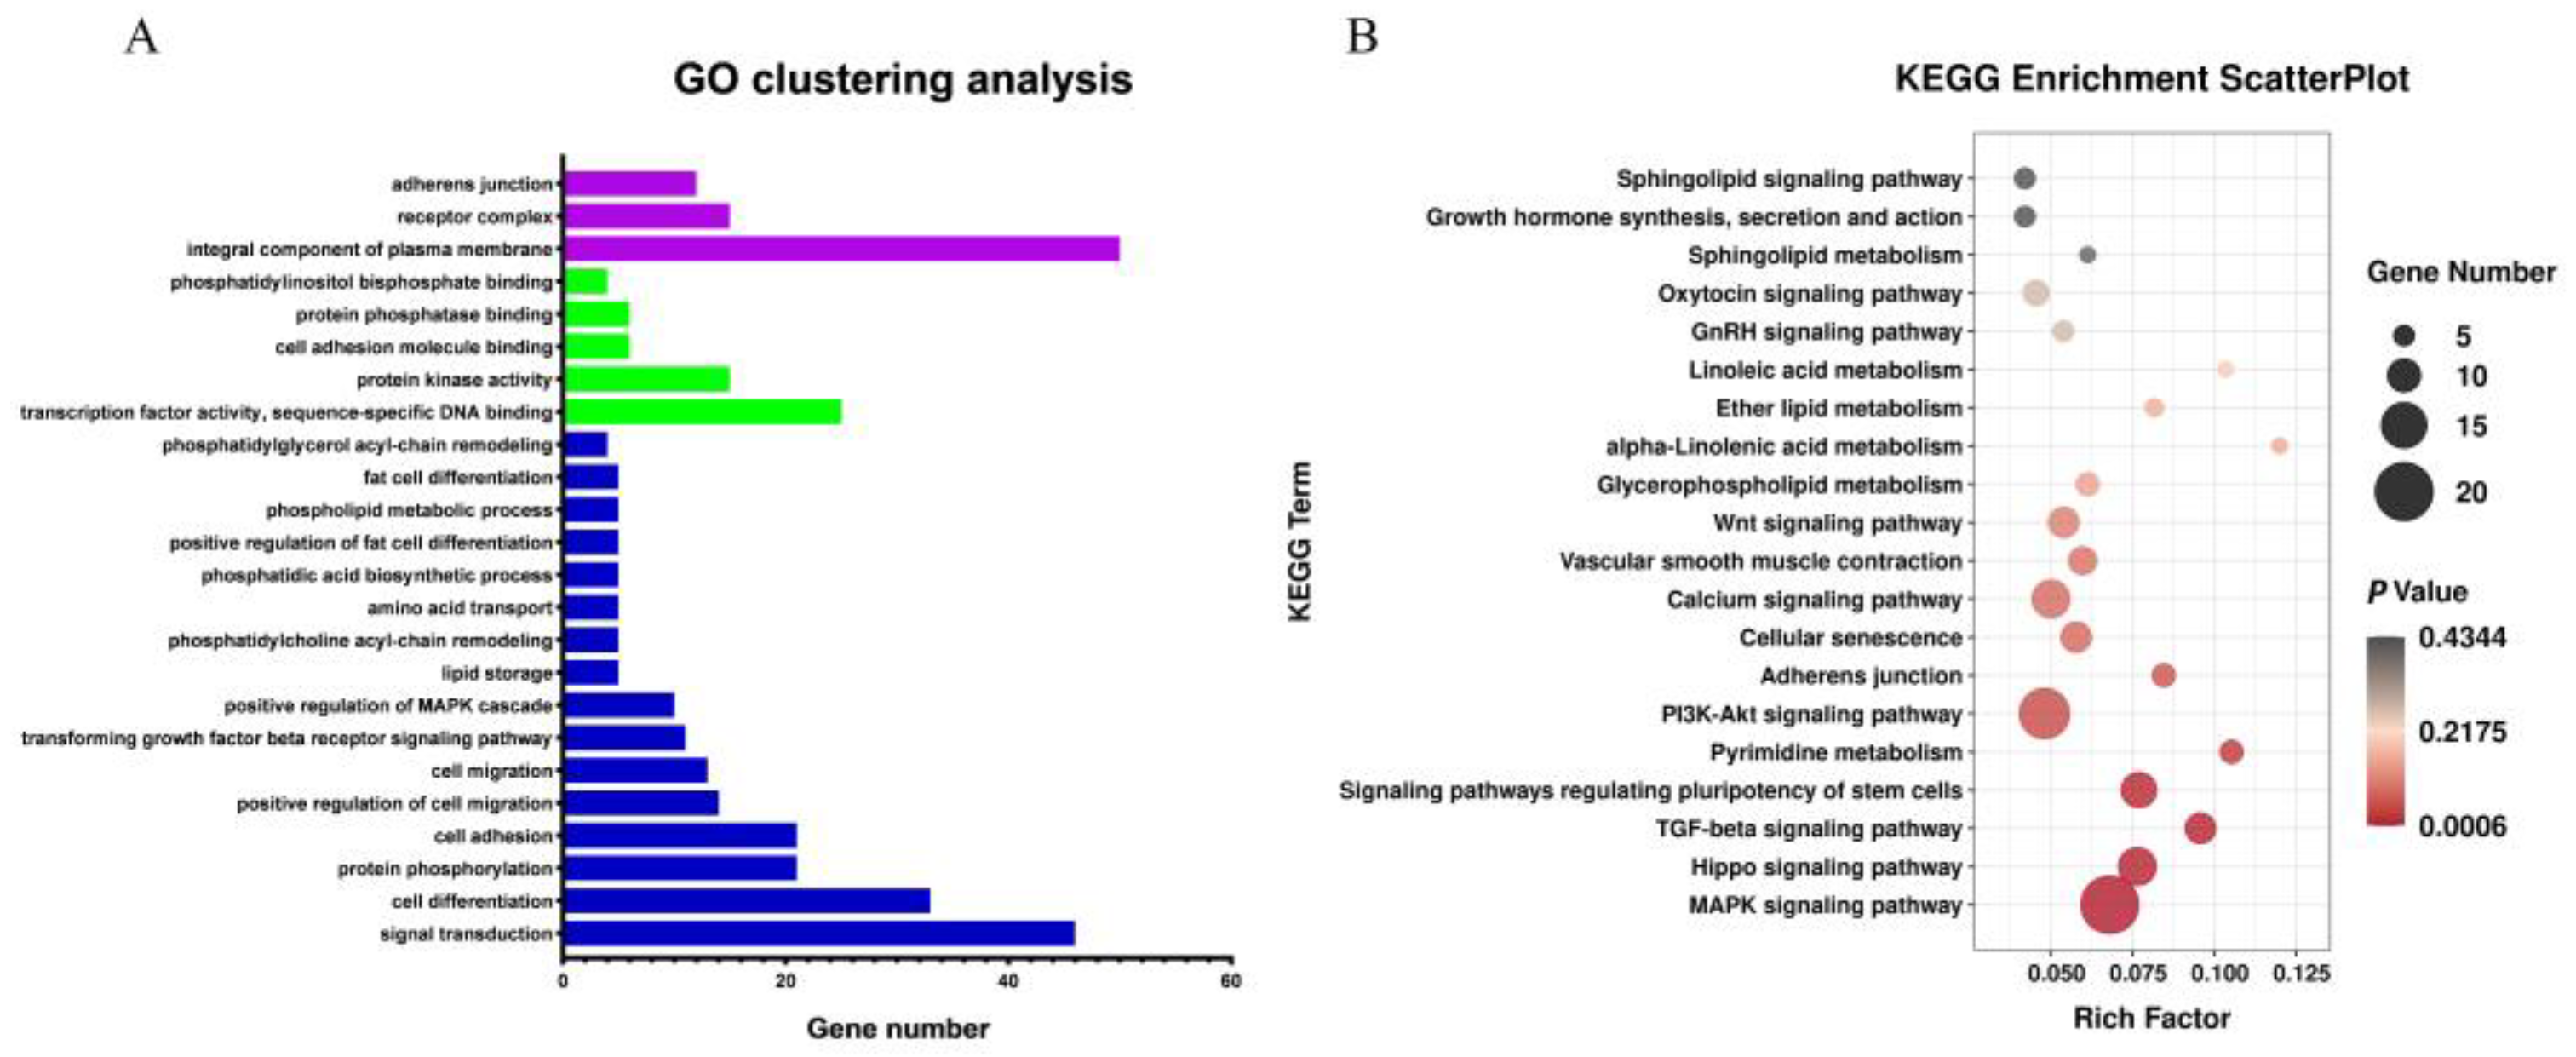
3.5. Functional Annotation of Differentially Expressed Genes (DEGs)

Functional annotation was conducted to obtain a deeper understanding of the DEGs (Figure 3A,B). GO analysis showed that most of the differentially expressed genes were enriched in lipid particle organization, cellular fat metabolism, fatty acid metabolic process, lipid storage, and other GO terms associated with fat metabolism. The genes enriched in these GO terms included AASDH, FASN, EHHADH, NAAA, PPARA, ACSBG2, DGAT2, ACVR1C, CIDEA, PLIN3, APOA1, PNPLA2, and so on. KEGG pathway enrichment analysis showed that most of the differentially expressed genes were enriched in Lipid and atherosclerosis, Cell adhesion molecules, Sphingolipid metabolism and other fat metabolism-related pathways, as well as MAPK, Calcium, GnRH, and other growth-related pathways, indicating that the process of fat metabolism is accompanied by growth and other life activity. Genes involved in the KEGG signaling pathways include LYN, APAF1, SRC, APOA1, NFATC1, VLDLR, PTK2, NFKB1, ERN1, and so on. NCBI gene function annotation was also used to screen out FASN, FGF2, HIPK3, LIFR, JCD, GYGR, FKBP5, TSPAN15, etc., candidate genes associated with abdominal fat deposition.

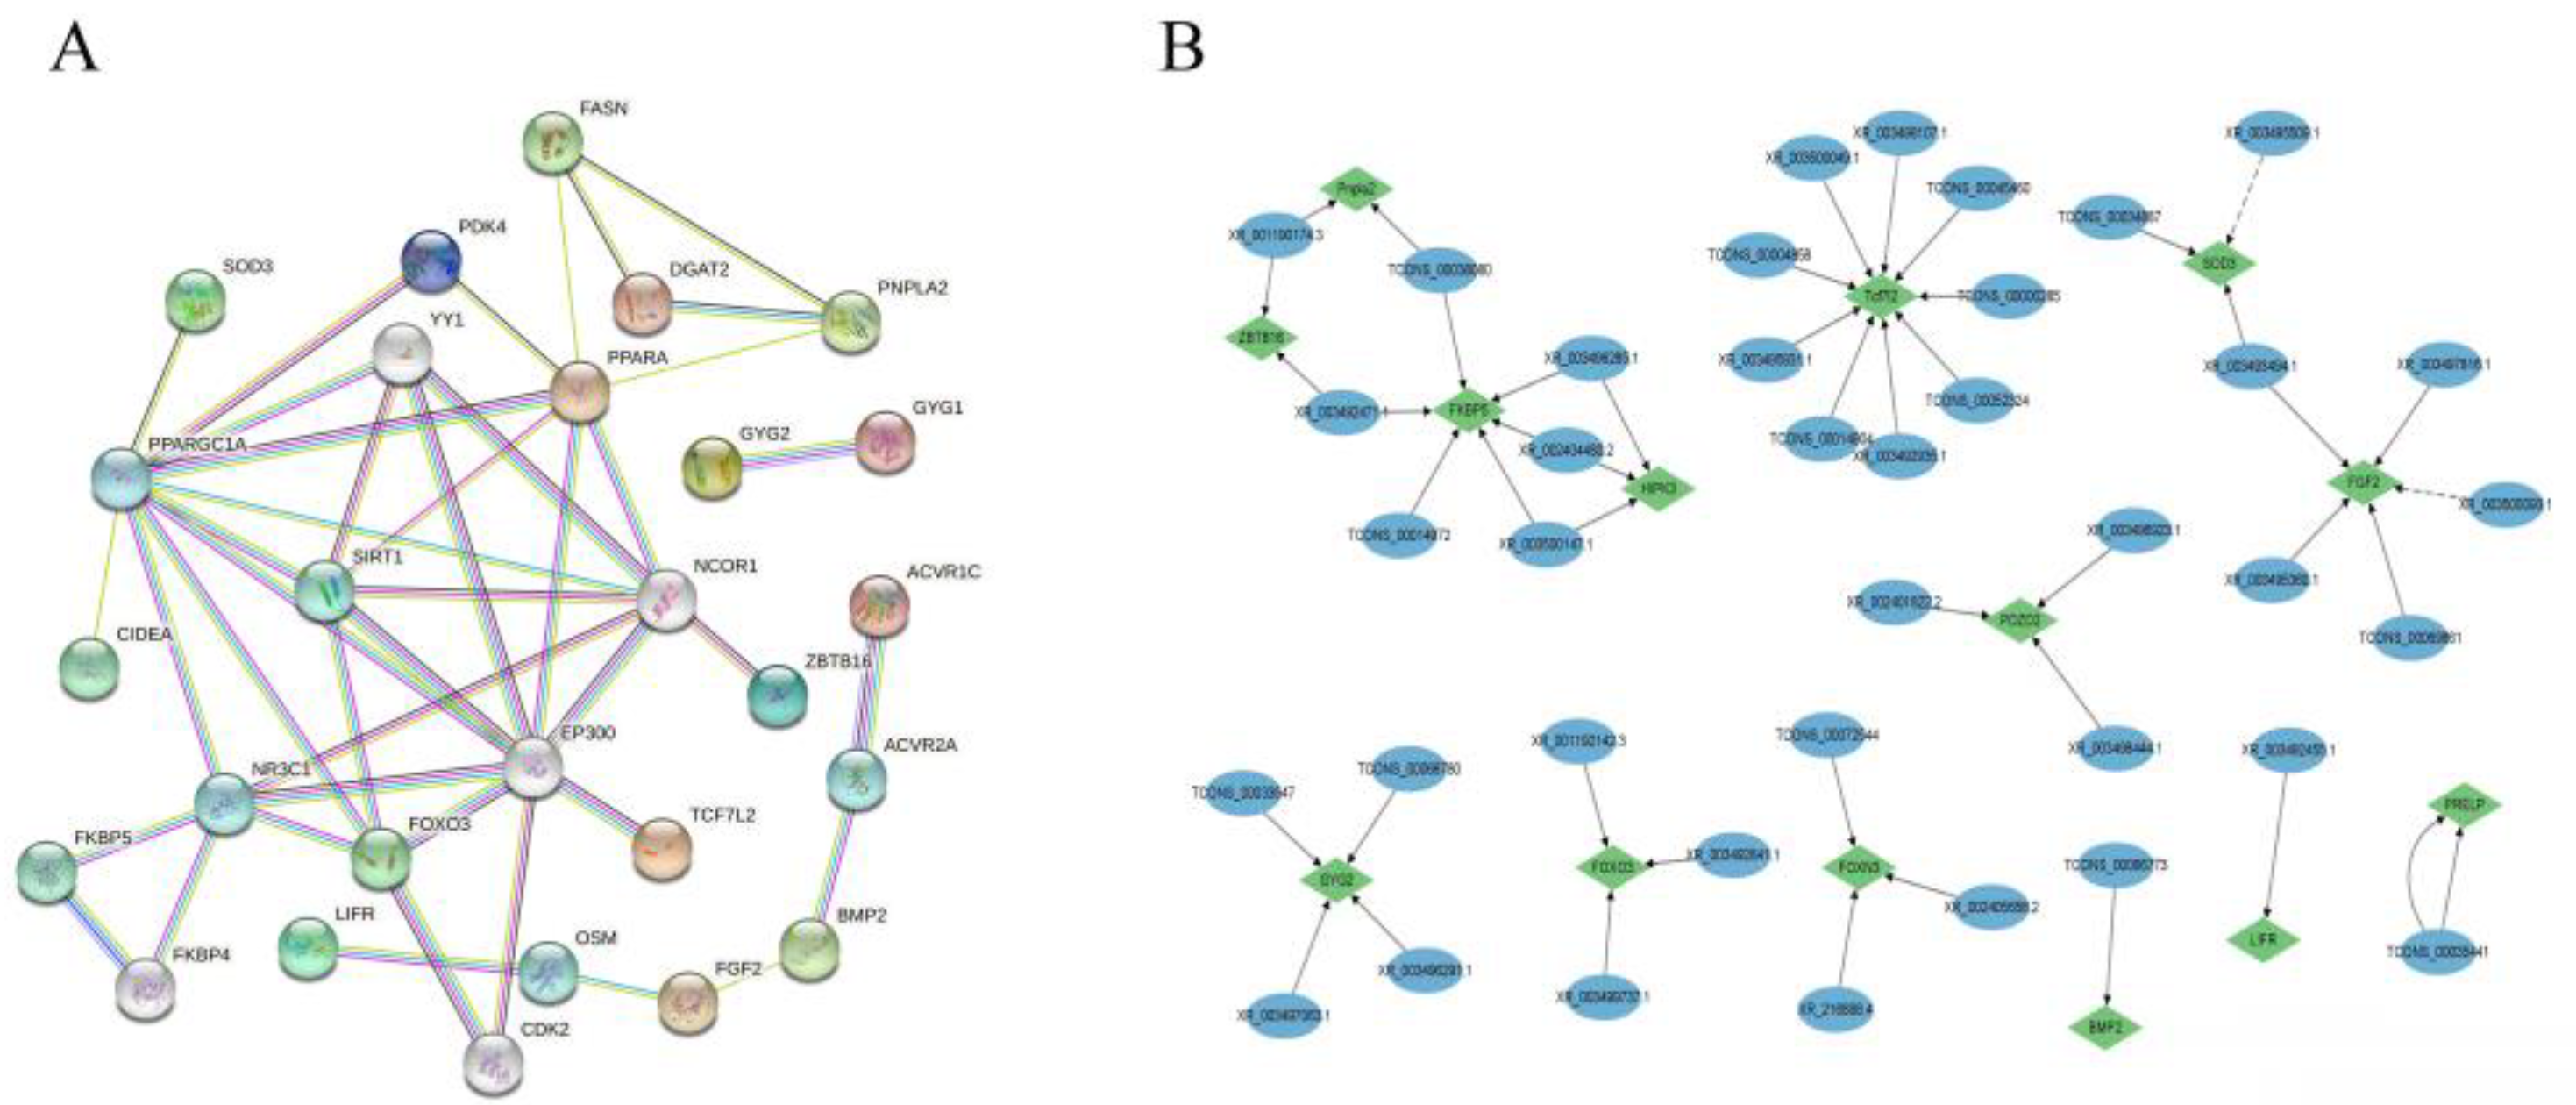
3.6. Analysis of Association and Prediction of Target Gene Function

Target genes of differentially expressed lncRNAs were predicted through antisense, cis, and trans effects to obtain lncRNA–mRNA target gene pairs. Further correlation analysis showed that 218 differentially expressed lncRNAs were associated with 602 target genes, of which one differentially expressed lncRNA and one differentially expressed target gene had co-expression regulation (antisense). Furthermore, 9 differentially expressed lncRNAs and 7 differentially expressed target genes were cis-regulated; 208 differentially expressed lncRNAs and 594 differentially expressed target genes were trans-regulated. These results show that most of the differentially expressed lncRNAs regulate target genes via trans-regulation.
GO and KEGG pathway analyses were conducted on differentially expressed target genes and their corresponding differentially expressed lncRNAs (Figure 4A,B). GO analysis results showed that most of the differentially expressed target genes were associated with several GO terms, including fat cell differentiation, protein kinase activity, lipid storage, and phosphatidylglycerol acyl-chain remodeling. The target genes enriched on these GO terms included TCF7L2, NR4A3, WNT5B, FAM120B, ADGRF5, and so on. KEGG pathway enrichment analysis showed that most of the differentially expressed target genes were enriched in Glycerophospholipid metabolism, Linoleic acid metabolism, ether lipid metabolism, GnRH signaling pathway, MAPK signaling pathway, Calcium signaling pathway, Wnt signaling pathway and other fat metabolism-related pathways. The target genes enriched in the KEGG pathways included TLE3, TCF7L2, PLCB4, SFRP2, PPP3CC, WNT5B, MYC, DVL3, NFATC1, and so on. Additional NCBI gene function annotation screening identified BMP2, GYG, TCF7L2, PDZD2, SOD3, FOXO3, TSPAN4, LIFR, and so on.

3.7. Protein–Protein Interactions of Target Genes

Protein–protein interactions of candidate genes and target genes involved in abdominal fat deposition were performed using the String online software (https://cn.string-db.org, accessed on 18 February 2022). PPAPA, FOXO3, GYG2, FASN, PNPLA2, FKBP5, TCF7L2, BMP2, FGF2, LIFR, ZBTB16, SIRT, NCOR1, and NR3C1 were highly correlated with other genes (Figure 5A), indicating that these genes interact with each other to regulate abdominal fat deposition, with PNPLA2, TCF7L2, FGF2, LIFR, BMP2, FKBP5, GYG2, and ZBTB16 being regulated by lncRNAs TCONS_00038080, TCONS_0033547, TCONS_00066773, XR_001190174.3, XR_003492471.1, XR_003493494.1, XR_001192142.3, XR_002405656.2, XR_002401822.2, and XR_003497063.1 (Figure 5B).

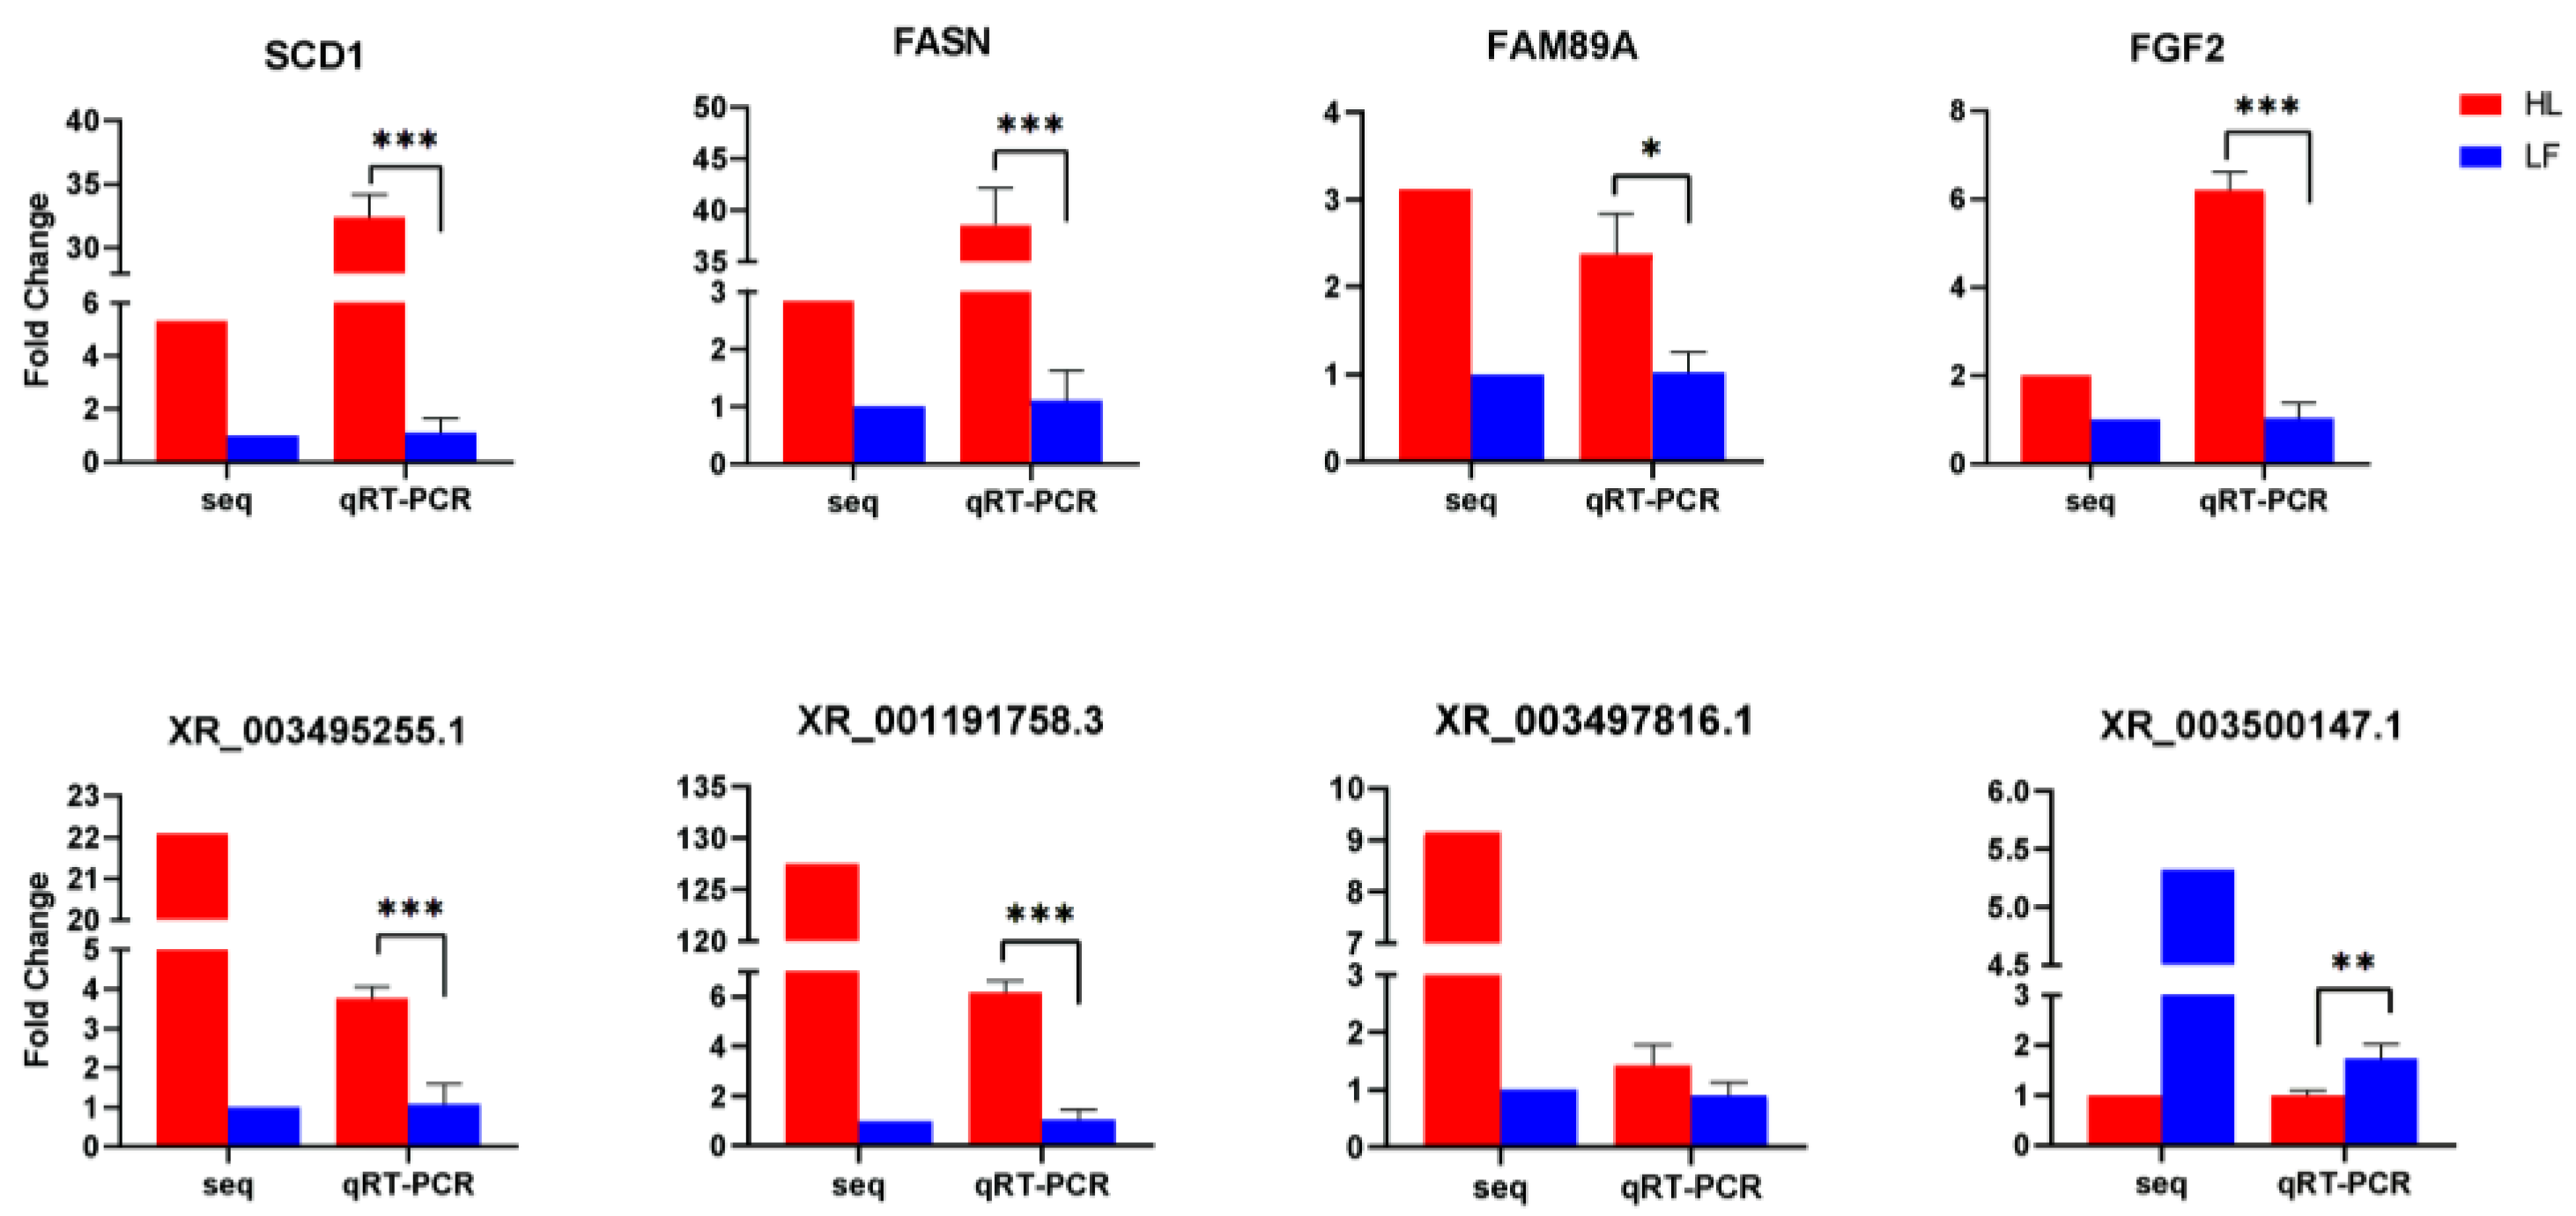
3.8. Validation of DEGs

Eight randomly selected differentially expressed genes and lncRNAs were subjected to qRT-PCR to verify the RNA sequencing results from the high and low abdominal fat rate groups. When we performed ANOVA analysis on the qRT-PCR results, we undertook the homogeneity of variance test. The qRT-PCR results of all genes and lncRNAs were in line with the homogeneity of variance. The F and p values of each gene and lncRNA are listed in the Supplementary Table S8. The trends of the expression of the four differentially expressed genes and the four differentially expressed lncRNAs in the high and low abdominal fat rate groups were consistent with the RNA sequencing results (Figure 6), indicating that the DEGs identified using the RNA-seq approach were reliable.

4. Discussion

Abdominal fat deposition is an important economic trait in meat-producing ducks, and it is therefore important to explore the genes and lncRNAs that regulate abdominal fat deposition in ducks. We used RNA sequencing to generate gene expression profiles of abdominal adipose tissue. GO and KEGG enrichment analysis showed that differentially expressed genes were mainly involved in GnRH, PPAR, and VEGF signaling pathways as well as in biological processes such as fatty acid metabolism and adipocyte differentiation. PPAPA, FOXO3, FASN, PNPLA2, FKBP5, TCF7L2, BMP2, FGF2, LIFR, ZBTB16, SIRT, GYG2, NCOR1, and NR3C1 were involved in the regulation of abdominal fat deposition. PNPLA2, TCF7L2, FGF2, LIFR, BMP2, FKBP5, GYG2, and ZBTB16 were regulated by differentially expressed lncRNAs.
PPARA is a member of the PPAR family. In the field of molecular biology [28], PPARA is a nuclear receptor protein, mainly involved in the regulation of transcription factor expression, and plays an important role in cell differentiation, development, and metabolism. PPARα regulates lipid transport and metabolism through the peroxisomal fatty acid β-oxidation pathway [29]. A critical role for PPARA in fat accumulation and binding was identified in a mouse study by Mohamed et al. [30]. We therefore hypothesized that PPAPA is involved in regulating abdominal fat deposition.
FOXO1 and FOXO3 belong to the FOXO gene family. FOXO1 can inhibit adipogenesis by reducing the transcriptional activity of PPARγ [31,32]. It can also affect adipogenesis by regulating the expression of MAF1 and SREBPs that are involved in adipogenesis and lipophagy [33]. FOXO1 protein is an inhibitor of uncoupling protein 1 (UCP1) gene transcription [34]. Decreased FOXO1 protein expression in adipose tissue leads to thermogenesis of adipose tissue, one of the causes of increased energy expenditure and weight loss [35]. These studies showed that FOXO1 is associated with fat metabolism [36,37]. Although FOXO1 did not affect abdominal fat deposition in ducks in this study, FOXO3 was differentially expressed in the HF group. Therefore, the role of FOXO3 in fat metabolism needs to be explored further.
FASN, a multi-enzyme complex comprising seven enzymes with different functions and an acyl carrier protein (ACP), is critical in fatty acid synthesis [38,39,40] and fatty acid biosynthesis [41,42]. In this study, we found that FASN expression is associated with abdominal fat deposition. Berndt et al. found that FASN expression significantly correlated with obesity and hinted that specific inhibition of FASN could represent a new way to prevent and treat obesity and its complications [43].
PNPLA2, a lipase encoding fatty triglycerides responsible for catalyzing the breakdown of triglycerides (TAGs) [44], was first identified as the major TAG lipase in adipose and cardiac tissues in 2004 [45]. In the liver, genetic ablation of PNPLA2 promotes steatosis [46,47,48]. Turpin et al. found that PNPLA2 overexpression in the liver attenuated steatosis [49].
FKBP5 was highly expressed in human skeletal muscle and adipose tissue [50]. Sidibeh et al. showed that FKBP5 gene expression is inversely correlated with the expression of lipogenesis and lipolysis and related lipogenic genes [51]. Therefore, the role of FKBP5 in abdominal fat deposition needs to be explored further.
Previous studies have shown that TCF7L2 is involved in regulating adipocyte differentiation, triglyceride hydrolysis, and lipogenesis. Dominant inactivation of TCF7L2 promotes adipogenesis [52]. Kaminska et al. have shown that short TCF7L2 mRNA variants are associated with body weight and hyperglycemia and insulin in subcutaneous adipose tissue [53]. TCF7L2 actively represses Wnt-responsive genes during adipocyte differentiation through direct interaction with TLE3 [54]. Chen et al. showed that TCF7L2 knockout impairs adipocyte differentiation [55], affecting fat metabolism. Geoghegan et al. showed that TCF7L2 is highly expressed in white fat and directly regulates cellular metabolism-related genes and demonstrated that adipocyte-specific conditional deletion of TCF7L2 results in adipocyte hypertrophy [56].
Bone morphogenetic protein 2 (BMP2) is a classic morphogen, a molecule that acts at a distance to promote adipogenic and osteogenic differentiation [57] and is involved in the regulation of fat [58]. Lu et al. found that BMP2 overexpression in sheep preadipocytes can promote adipogenic differentiation [59]. BMP2 can also promote the formation of adipocytes in the white pre-adipose cell lines 3T3-L1 [60], A33 [58], and 3T3-F442A [61], but when combined with retinoic acid, BMP2 inhibited the formation of adipocytes in 3T3-F442A cells [62]. In this study, BMP2 was differentially expressed in F2 generation ducks with high and low abdominal fat rates, and we hypothesized that it was involved in the regulation of abdominal fat deposition.
Fibroblast growth factor 2 (FGF2) is one of the first recognized members of the FGF family [63]. We found that FGF2 is associated with abdominal fat deposition, although other studies have shown that FGF2 is involved in the regulation of white adipogenic differentiation [64,65,66,67]. Kawaguchi et al. demonstrated the induction of de novo lipogenesis in recombinant basement membrane supplemented with FGF2 [64]. FGF2 significantly enhanced adipogenic differentiation and PPARγ expression of human adipose stem cells (hASC) [65] while Xiao et al. found that mice lacking FGF2 enhanced the adipogenesis ability of bone marrow stem cells [67]. Additionally, disrupting FGF2 increased the thermogenic capacity of brown and beige fat and FGF2 loss protected mice from high-fat-induced obesity and hepatic steatosis [68].
In addition to the above genes, which have been confirmed to be involved in the synthesis and metabolism of abdominal fat, this study also showed that LIFR, GYG2, ZBTB16, SIRT, NCOR1, and NR3C1 may be involved in the regulation of abdominal fat deposition in ducks. PNPLA2, TCF7L2, FGF2, LIFR, BMP2, FKBP5, GYG2, and ZBTB16 were regulated by the differentially expressed lncRNAs TCONS_00038080, TCONS_0033547, TCONS_00066773, XR_001190174.3, XR_003492471.1, XR_003493494.1, XR_001192142.3, XR_002405656.2, XR_002401822.2, XR_003497063.1, and so on. We hypothesized that these lncRNAs regulate the production of abdominal fat by regulating the specified genes.

5. Conclusions

RNA-seq was used to study the abdominal fat tissue of four ducks in high and low abdominal fat rate groups. Eleven key candidate genes PPAPA, FOXO3, FASN, PNPLA2, FKBP5, TCF7L2, BMP2, FGF2, LIFR, ZBTB16, SIRT, GYG2, NCOR1 and NR3C1, and key lncRNAs TCONS_00038080, TCONS_0033547, TCONS_00066773, XR_001190174.3, XR_003492471.1, XR_003493494.1, XR_001192142.3, XR_002405656.2, XR_002401822.2, XR_003497063.1, etc., were identified using differential expression and bioinformatic analyses. The results of this study lay a foundation for exploring the molecular mechanisms underlying the regulation of abdominal fat deposition in ducks and provide a theoretical basis for breeding meat-producing ducks and high-quality livestock and poultry products with greater economic benefits.

Supplementary Materials

The following are available online at https://www.mdpi.com/article/10.3390/ani12101256/s1, Supplementary Figure S1: lncRNA transcript coverage statistics, Figure S2: mRNA transcript coverage statistics, Table S3: Differential mRNA statistics, Table S2: Differential lncRNA statistics, Table S3: Differential lncRNA target gene statistics, Table S4: Differential mRNA GO analysis, Table S5: KEGG analysis of differential mRNA GO analysis, Table S6: GO analysis of target genes, Table S7: KEGG analysis of target genes, Table S8: Analysis results of qRT-PCR.

Author Contributions

Conceptualization, Z.W., G.C. (Guobin Chang) and G.C. (Guohong Chen); methodology, Z.W.; software, C.Y., B.D.; validation, C.Y., Z.W., B.D. and Q.S.; formal analysis, C.Y.; investigation, Y.B., H.B. and Y.J.; resources, Y.B., H.B., Q.S. and Y.J.; data curation, C.Y., Z.W. and B.D.; writing—original draft preparation, C.Y.; writing—review and editing, Z.W., G.C. (Guobin Chang) and G.C. (Guohong Chen); visualization, Y.B. and H.B.; supervision, Y.J.; project administration, G.C. (Guobin Chang); funding acquisition, G.C. (Guohong Chen). All authors have read and agreed to the published version of the manuscript.

Funding

This work was funded by the National Natural Science Foundation (32002159), and the Foundation of China Postdoctoral Science (2020M671631).

Institutional Review Board Statement

The animal study protocol was approved by the Animal Care and Use Committee of Yangzhou University (approval number 72-2015).

Informed Consent Statement

Informed consent was obtained from all subjects involved in the study.

Data Availability Statement

The data presented in this study are available on request from the corresponding author.

Conflicts of Interest

The authors declare that they have no known competing financial interests or personal relationships that could have appeared to influence the work reported in this paper.

References

  1. Ismail, I.; Joo, S.T. Poultry Meat Quality in Relation to Muscle Growth and Muscle Fiber Characteristics. Korean J. Food Sci. Anim. Resour. 2017, 37, 873–883. [Google Scholar] [PubMed]
  2. Wang, J.; Hua, L.; Chen, J.; Zhang, J.; Bai, X.; Gao, B.; Li, C.; Shi, Z.; Sheng, W.; Gao, Y.; et al. Identification and characterization of long non-coding RNAs in subcutaneous adipose tissue from castrated and intact full-sib pair Huainan male pigs. BMC Genom. 2017, 18, 542. [Google Scholar] [CrossRef] [PubMed] [Green Version]
  3. Zou, C.; Li, L.; Cheng, X.; Li, C.; Fu, Y.; Fang, C.; Li, C. Identification and functional analysis of long intergenic non-coding RNAs underlying intramuscular fat content in pigs. Front. Genet. 2018, 9, 102. [Google Scholar] [CrossRef] [PubMed] [Green Version]
  4. Cabili, M.N.; Trapnell, C.; Goff, L.; Koziol, M.; Tazon-Vega, B.; Regev, A.; Rinn, J.L. Integrative annotation of human large intergenic noncoding RNAs reveals global properties and specific subclasses. Genes Dev. 2011, 25, 1915–1927. [Google Scholar] [CrossRef] [PubMed] [Green Version]
  5. Han, F.; Li, J.; Zhao, R.; Liu, L.; Li, L.; Li, Q.; He, J.; Liu, N. Identification and co-expression analysis of long noncoding RNAs and mRNAs involved in the deposition of intramuscular fat in Aohan fine-wool sheep. BMC Genom. 2021, 22, 98. [Google Scholar] [CrossRef]
  6. Koufariotis, L.T.; Chen, Y.P.; Chamberlain, A.; Vander Jagt, C.; Hayes, B.J. A catalogue of novel bovine long noncoding RNA across 18 tissues. PLoS ONE 2015, 10, e0141225. [Google Scholar] [CrossRef]
  7. Weikard, R.; Hadlich, F.; Kuehn, C. Identification of novel transcripts and noncoding RNAs in bovine skin by deep next generation sequencing. BMC Genom. 2013, 14, 789. [Google Scholar] [CrossRef] [Green Version]
  8. Wei, S.; Li, A.; Zhang, L.; Du, M. Growth and development symposium: Stem and progenitor cells in animal growth: Long noncoding RNAs in adipogenesis and adipose development of meat animals12. J. Anim. Sci. 2019, 97, 2644–2657. [Google Scholar] [CrossRef]
  9. Squillaro, T.; Peluso, G.; Galderisi, U.; Di Bernardo, G. Long non-coding RNAs in regulation of adipogenesis and adipose tissue function. Elife 2020, 9, e59053. [Google Scholar] [CrossRef]
  10. Ding, C.; Lim, Y.C.; Chia, S.Y.; Walet, A.; Xu, S.; Lo, K.A.; Zhao, Y.; Zhu, D.; Shan, Z.; Chen, Q.; et al. De novo reconstruction of human adipose transcriptome reveals conserved lncRNAs as regulators of brown adipogenesis. Nat. Commun. 2018, 9, 1329. [Google Scholar] [CrossRef] [Green Version]
  11. Shu, L.; Hou, G.; Zhao, H.; Huang, W.; Song, G.; Ma, H. Resveratrol improves high-fat diet-induced insulin resistance in mice by downregulating the lncRNA NONMMUT008655.2. Am. J. Transl. Res. 2020, 12, 1–18. [Google Scholar] [PubMed]
  12. Li, M.; Xu, M.; Wen, S.; Bai, B.; Chen, R.; Liu, L. One novel long noncoding RNA lnc10 in Drosophila. J. Genet. Genom. 2014, 41, 79–82. [Google Scholar] [CrossRef] [PubMed]
  13. Zhang, C.; Peng, G. Non-coding RNAs: An emerging player in DNA damage response. Mutat. Res. Rev. Mutat. Res. 2015, 763, 202–211. [Google Scholar] [CrossRef] [PubMed]
  14. Wang, X.; Clark, A.G. Using next-generation RNA sequencing to identify imprinted genes. Heredity 2014, 113, 156–166. [Google Scholar] [CrossRef] [Green Version]
  15. Miao, X.; Qin, Q.L. Genome-wide transcriptome analysis of mRNAs and microRNAs in Dorset and Small Tail Han sheep to explore the regulation of fecundity. Mol. Cell Endocrinol. 2015, 402, 32–42. [Google Scholar] [CrossRef]
  16. Wu, W.; Ji, M.; Xu, K.; Zhang, D.; Yin, Y.; Huang, X.; Peng, Y.; Zhang, J. Knockdown of CTRP6 reduces the deposition of intramuscular and subcutaneous fat in pigs via different signaling pathways. Biochim. Biophys. Acta Mol. Cell Biol. Lipids 2020, 1865, 158729. [Google Scholar] [CrossRef]
  17. Zhang, D.; Wu, W.; Huang, X.; Xu, K.; Zheng, C.; Zhang, J. Comparative analysis of gene expression profiles in differentiated subcutaneous adipocytes between Jiaxing Black and Large White pigs. BMC Genom. 2021, 22, 61. [Google Scholar] [CrossRef]
  18. Zhang, T.; Zhang, X.; Han, K.; Zhang, G.; Wang, J.; Xie, K.; Xue, Q. Genome-Wide Analysis of lncRNA and mRNA Expression during differentiation of abdominal preadipocytes in the chicken. G3 Genes Genom. Genet. 2017, 7, 953–966. [Google Scholar] [CrossRef] [Green Version]
  19. Miao, X.; Luo, Q.; Qin, X.; Guo, Y.; Zhao, H. Genome-wide mRNA-seq profiling reveals predominant down-regulation of lipid metabolic processes in adipose tissues of Small Tail Han than Dorset sheep. Biochem. Biophys. Res. Commun. 2015, 467, 413–420. [Google Scholar] [CrossRef]
  20. Huang, W.; Guo, Y.; Du, W.; Zhang, X.; Li, A.; Miao, X. Global transcriptome analysis identifies differentially expressed genes related to lipid metabolism in Wagyu and Holstein cattle. Sci. Rep. 2017, 7, 5278. [Google Scholar] [CrossRef] [Green Version]
  21. Chen, S.; Zhou, Y.; Chen, Y.; Gu, J. fastp: An ultra-fast all-in-one FASTQ preprocessor. Bioinformatics 2018, 34, i884–i890. [Google Scholar] [CrossRef] [PubMed]
  22. Langmead, B.; Salzberg, S.L. Fast gapped-read alignment with Bowtie 2. Nat. Methods 2012, 9, 357–359. [Google Scholar] [CrossRef] [PubMed] [Green Version]
  23. Trapnell, C.; Roberts, A.; Goff, L.; Pertea, G.; Kim, D.; Kelley, D.R.; Pimentel, H.; Salzberg, S.L.; Rinn, J.L.; Pachter, L. Differential gene and transcript expression analysis of RNA-seq experiments with TopHat and Cufflinks. Nat. Protoc. 2012, 7, 562–578. [Google Scholar] [CrossRef] [PubMed] [Green Version]
  24. Kong, L.; Zhang, Y.; Ye, Z.Q.; Liu, X.Q.; Zhao, S.Q.; Wei, L.; Gao, G. CPC: Assess the protein-coding potential of transcripts using sequence features and support vector machine. Nucleic Acids Res. 2007, 35, W345–W349. [Google Scholar] [CrossRef]
  25. Sun, L.; Luo, H.; Bu, D.; Zhao, G.; Yu, K.; Zhang, C.; Liu, Y.; Chen, R.; Zhao, Y. Utilizing sequence intrinsic composition to classify protein-coding and long non-coding transcripts. Nucleic Acids Res. 2013, 41, e166. [Google Scholar] [CrossRef] [PubMed]
  26. Pertea, M.; Kim, D.; Pertea, G.M.; Leek, J.T.; Salzberg, S.L. Transcript-level expression analysis of RNA-seq experiments with HISAT, StringTie and Ballgown. Nat. Protoc. 2016, 11, 1650–1667. [Google Scholar] [CrossRef]
  27. Liu, X.; Gong, J.; Wang, L.; Hou, X.; Gao, H.; Yan, H.; Zhao, F.; Zhang, L.; Wang, L. Genome-wide profiling of the microrna transcriptome regulatory network to identify putative candidate genes associated with backfat deposition in pigs. Animals 2019, 9, 313. [Google Scholar] [CrossRef] [Green Version]
  28. Gonzalez, F.J.; Shah, Y.M. PPARalpha: Mechanism of species differences and hepatocarcinogenesis of peroxisome proliferators. Toxicology 2008, 246, 2–8. [Google Scholar] [CrossRef]
  29. Aoyama, T.; Peters, J.M.; Iritani, N.; Nakajima, T.; Furihata, K.; Hashimoto, T.; Gonzalez, F.J. Altered constitutive expression of fatty acid-metabolizing enzymes in mice lacking the peroxisome proliferator-activated receptor alpha (PPARalpha). J. Biol. Chem. 1998, 273, 5678–5684. [Google Scholar] [CrossRef] [Green Version]
  30. Abdelmegeed, M.A.; Yoo, S.H.; Henderson, L.E.; Gonzalez, F.J.; Woodcroft, K.J.; Song, B.J. PPARalpha expression protects male mice from high fat-induced nonalcoholic fatty liver. J. Nutr. 2011, 141, 603–610. [Google Scholar] [CrossRef]
  31. Cristancho, A.G.; Lazar, M.A. Forming functional fat: A growing understanding of adipocyte differentiation. Nat. Rev. Mol. Cell Biol. 2011, 12, 722–734. [Google Scholar] [CrossRef] [PubMed]
  32. Ioannilli, L.; Ciccarone, F.; Ciriolo, M.R. Adipose Tissue and FoxO1: Bridging Physiology and Mechanisms. Cells 2020, 9, 849. [Google Scholar] [CrossRef] [PubMed] [Green Version]
  33. Johnson, D.L.; Stiles, B.L. Maf1, A New PTEN Target Linking RNA and Lipid Metabolism. Trends Endocrinol. Metab. 2016, 27, 742–750. [Google Scholar] [CrossRef] [PubMed] [Green Version]
  34. Liu, L.; Tao, Z.; Zheng, L.D.; Brooke, J.P.; Smith, C.M.; Liu, D.; Long, Y.C.; Cheng, Z. FoxO1 interacts with transcription factor EB and differentially regulates mitochondrial uncoupling proteins via autophagy in adipocytes. Cell Death Discov. 2016, 2, 16066. [Google Scholar] [CrossRef] [PubMed] [Green Version]
  35. Peng, S.; Xiao, W.; Ju, D.; Sun, B.; Hou, N.; Liu, Q.; Wang, Y.; Zhao, H.; Gao, C.; Zhang, S.; et al. Identification of entacapone as a chemical inhibitor of FTO mediating metabolic regulation through FOXO1. Sci. Transl. Med. 2019, 11, eaau7116. [Google Scholar] [CrossRef]
  36. Milkiewicz, M.; Roudier, E.; Doyle, J.L.; Trifonova, A.; Birot, O.; Haas, T.L.I.; Trifonova, A.; Birot, O.; Haas, T.L. Identification of a mechanism underlying regulation of the anti-angiogenic forkhead transcription factor FoxO1 in cultured endothelial cells and ischemic muscle. Am. J. Pathol. 2011, 178, 935–944. [Google Scholar] [CrossRef]
  37. Nakae, J.; Kitamura, T.; Kitamura, Y.; Biggs, W.H., 3rd; Arden, K.C.; Accili, D. The forkhead transcription factor Foxo1 regulates adipocyte differentiation. Dev. Cell 2003, 4, 119–129. [Google Scholar] [CrossRef] [Green Version]
  38. Zhang, N.; Zhao, H.; Zhang, L. Fatty acid synthase promotes the palmitoylation of chikungunya virus nsP1. J. Virol. 2019, 93, e01747-18. [Google Scholar] [CrossRef] [Green Version]
  39. Kulkarni, M.M.; Ratcliff, A.N.; Bhat, M.; Alwarawrah, Y.; Hughes, P.; Arcos, J.; Loiselle, D.; Torrelles, J.B.; Funderburg, N.T.; Haystead, T.A.; et al. Cellular fatty acid synthase is required for late stages of HIV-1 replication. Retrovirology 2017, 14, 45. [Google Scholar] [CrossRef] [Green Version]
  40. Ligorio, F.; Pellegrini, I.; Castagnoli, L.; Vingiani, A.; Lobefaro, R.; Zattarin, E.; Santamaria, M.; Pupa, S.M.; Pruneri, G.; de Braud, F.; et al. Targeting lipid metabolism is an emerging strategy to enhance the efficacy of anti-HER2 therapies in HER2-positive breast cancer. Cancer Lett. 2021, 511, 77–87. [Google Scholar] [CrossRef]
  41. Liu, Y.Y.; Liang, X.D.; Liu, C.C.; Cheng, Y.; Chen, H.; Baloch, A.S.; Zhang, J.; Go, Y.Y.; Zhou, B. Fatty Acid Synthase Is Involved in Classical Swine Fever Virus Replication by Interaction with NS4B. J. Virol. 2021, 95, e0078121. [Google Scholar] [CrossRef] [PubMed]
  42. Bakhache, W.; Neyret, A.; McKellar, J.; Clop, C.; Bernard, E.; Weger-Lucarelli, J.; Briant, L. Fatty acid synthase and stearoyl-CoA desaturase-1 are conserved druggable cofactors of Old World Alphavirus genome replication. Antiviral. Res. 2019, 172, 104642. [Google Scholar] [CrossRef] [PubMed]
  43. Berndt, J.; Kovacs, P.; Ruschke, K.; Klöting, N.; Fasshauer, M.; Schön, M.R.; Körner, A.; Stumvoll, M.; Blüher, M. Fatty acid synthase gene expression in human adipose tissue: Association with obesity and type 2 diabetes. Diabetologia 2007, 50, 1472–1480. [Google Scholar] [CrossRef] [PubMed] [Green Version]
  44. Missaglia, S.; Coleman, R.A.; Mordente, A.; Tavian, D. Neutral lipid storage diseases as cellular model to study lipid droplet function. Cells 2019, 8, 187. [Google Scholar] [CrossRef] [PubMed] [Green Version]
  45. Zimmermann, R.; Strauss, J.G.; Haemmerle, G.; Schoiswohl, G.; Birner-Gruenberger, R.; Riederer, M.; Lass, A.; Neuberger, G.; Eisenhaber, F.; Hermetter, A.; et al. Fat mobilization in adipose tissue is promoted by adipose triglyceride lipase. Science 2004, 306, 1383–1386. [Google Scholar] [CrossRef] [PubMed] [Green Version]
  46. Yen, C.E.; Nelson, D.W.; Yen, M.I. Intestinal triacylglycerol synthesis in fat absorption and systemic energy metabolism. J. Lipid Res. 2015, 56, 489–501. [Google Scholar] [CrossRef] [Green Version]
  47. Tuohetahuntila, M.; Molenaar, M.R.; Spee, B.; Brouwers, J.F.; Houweling, M.; Vaandrager, A.B.; Helms, J.B. ATGL and DGAT1 are involved in the turnover of newly synthesized triacylglycerols in hepatic stellate cells. J. Lipid Res. 2016, 57, 1162–1174. [Google Scholar] [CrossRef] [Green Version]
  48. Meex, R.C.; Hoy, A.J.; Mason, R.M.; Martin, S.D.; McGee, S.L.; Bruce, C.R.; Watt, M.J. ATGL-mediated triglyceride turnover and the regulation of mitochondrial capacity in skeletal muscle. Am. J. Physiol. Endocrinol. Metab. 2015, 308, E960–E970. [Google Scholar] [CrossRef] [Green Version]
  49. Turpin, S.M.; Hoy, A.J.; Brown, R.D.; Rudaz, C.G.; Honeyman, J.; Matzaris, M.; Watt, M.J. Adipose triacylglycerol lipase is a major regulator of hepatic lipid metabolism but not insulin sensitivity in mice. Diabetologia 2011, 54, 146–156. [Google Scholar] [CrossRef] [Green Version]
  50. Su, A.I.; Wiltshire, T.; Batalov, S.; Lapp, H.; Ching, K.A.; Block, D.; Zhang, J.; Soden, R.; Hayakawa, M.; Kreiman, G.; et al. A gene atlas of the mouse and human protein-encoding transcriptomes. Proc. Natl. Acad. Sci. USA 2004, 101, 6062–6067. [Google Scholar] [CrossRef] [Green Version]
  51. Sidibeh, C.O.; Pereira, M.J.; Abalo, X.M.; Boersma, G.J.; Skrtic, S.; Lundkvist, P.; Katsogiannos, P.; Hausch, F.; Castillejo-López, C.; Eriksson, J.W. FKBP5 expression in human adipose tissue: Potential role in glucose and lipid metabolism, adipogenesis and type 2 diabetes. Endocrine 2018, 62, 116–128. [Google Scholar] [CrossRef] [PubMed] [Green Version]
  52. Shu, L.; Matveyenko, A.V.; Kerr-Conte, J.; Cho, J.H.; McIntosh, C.H.; Maedler, K. Decreased TCF7L2 protein levels in type 2 diabetes mellitus correlate with downregulation of GIP- and GLP-1 receptors and impaired beta-cell function. Hum. Mol. Genet. 2015, 24, 3004. [Google Scholar] [CrossRef] [PubMed] [Green Version]
  53. Kaminska, D.; Kuulasmaa, T.; Venesmaa, S.; Käkelä, P.; Vaittinen, M.; Pulkkinen, L.; Pääkkönen, M.; Gylling, H.; Laakso, M.; Pihlajamäki, J. Adipose tissue TCF7L2 splicing is regulated by weight loss and associates with glucose and fatty acid metabolism. Diabetes 2012, 61, 2807–2813. [Google Scholar] [CrossRef] [PubMed] [Green Version]
  54. Villanueva, C.J.; Waki, H.; Godio, C.; Nielsen, R.; Chou, W.L.; Vargas, L.; Wroblewski, K.; Schmedt, C.; Chao, L.C.; Boyadjian, R.; et al. TLE3 is a dual-function transcriptional coregulator of adipogenesis. Cell Metab. 2011, 13, 413–427. [Google Scholar] [CrossRef] [PubMed] [Green Version]
  55. Chen, X.; Ayala, I.; Shannon, C.; Fourcaudot, M.; Acharya, N.K.; Jenkinson, C.P.; Heikkinen, S.; Norton, L. The Diabetes Gene and Wnt Pathway Effector TCF7L2 Regulates Adipocyte Development and Function. Diabetes 2018, 67, 554–568. [Google Scholar] [CrossRef] [Green Version]
  56. Geoghegan, G.; Simcox, J.; Seldin, M.M.; Parnell, T.J.; Stubben, C.; Just, S.; Begaye, L.; Lusis, A.J.; Villanueva, C.J. Targeted deletion of Tcf7l2 in adipocytes promotes adipocyte hypertrophy and impaired glucose metabolism. Mol. Metab. 2019, 24, 44–63. [Google Scholar] [CrossRef]
  57. Guiu-Jurado, E.; Unthan, M.; Böhler, N.; Kern, M.; Landgraf, K.; Dietrich, A.; Schleinitz, D.; Ruschke, K.; Klöting, N.; Faßhauer, M.; et al. Bone morphogenetic protein 2 (BMP2) may contribute to partition of energy storage into visceral and subcutaneous fat depots. Obesity 2016, 24, 2092–2100. [Google Scholar] [CrossRef] [Green Version]
  58. Bowers, R.R.; Lane, M.D. A role for bone morphogenetic protein-4 in adipocyte development. Cell Cycle 2007, 6, 385–389. [Google Scholar] [CrossRef] [Green Version]
  59. Lu, Z.; Liu, J.; Han, J.; Yang, B. Association Between BMP2 Functional Polymorphisms and Sheep Tail Type. Animals 2020, 10, 739. [Google Scholar] [CrossRef]
  60. Rebbapragada, A.; Benchabane, H.; Wrana, J.L.; Celeste, A.J.; Attisano, L. Myostatin signals through a transforming growth factor beta-like signaling pathway to block adipogenesis. Mol. Cell Biol. 2003, 23, 7230–7242. [Google Scholar] [CrossRef] [Green Version]
  61. Ji, X.; Chen, D.; Xu, C.; Harris, S.E.; Mundy, G.R.; Yoneda, T. Patterns of gene expression associated with BMP-2-induced osteoblast and adipocyte differentiation of mesenchymal progenitor cell 3T3-F442A. J. Bone Miner. Metab. 2000, 18, 132–139. [Google Scholar] [CrossRef] [PubMed]
  62. Sottile, V.; Seuwen, K. Bone morphogenetic protein-2 stimulates adipogenic differentiation of mesenchymal precursor cells in synergy with BRL 49653 (rosiglitazone). FEBS Lett. 2000, 475, 201–204. [Google Scholar] [CrossRef] [Green Version]
  63. Powers, C.J.; McLeskey, S.W.; Wellstein, A. Fibroblast growth factors, their receptors and signaling. Endocr. Relat. Cancer 2000, 7, 165–197. [Google Scholar] [CrossRef] [PubMed] [Green Version]
  64. Kawaguchi, N.; Toriyama, K.; Nicodemou-Lena, E.; Inou, K.; Torii, S.; Kitagawa, Y. De novo adipogenesis in mice at the site of injection of basement membrane and basic fibroblast growth factor. Proc. Natl. Acad. Sci. USA 1998, 95, 1062–1066. [Google Scholar] [CrossRef] [PubMed] [Green Version]
  65. Kakudo, N.; Shimotsuma, A.; Kusumoto, K. Fibroblast growth factor-2 stimulates adipogenic differentiation of human adipose-derived stem cells. Biochem. Biophys. Res. Commun. 2007, 359, 239–244. [Google Scholar] [CrossRef] [PubMed]
  66. Xiao, L.; Sobue, T.; Esliger, A.; Kronenberg, M.S.; Coffin, J.D.; Doetschman, T.; Hurley, M.M. Disruption of the Fgf2 gene activates the adipogenic and suppresses the osteogenic program in mesenchymal marrow stromal stem cells. Bone 2010, 47, 360–370. [Google Scholar] [CrossRef] [PubMed] [Green Version]
  67. Suchacki, K.J.; Stimson, R.H. Nutritional Regulation of Human Brown Adipose Tissue. Nutrients 2021, 13, 1748. [Google Scholar] [CrossRef]
  68. Li, H.; Zhang, X.; Huang, C.; Liu, H.; Zhang, Q.; Sun, Q.; Jia, Y.; Liu, S.; Dong, M.; Hou, M.; et al. FGF2 disruption enhances thermogenesis in brown and beige fat to protect against adiposity and hepatic steatosis. Mol. Metab. 2021, 54, 101358. [Google Scholar] [CrossRef]
Figure 1. Identification and analysis of lncRNA. Note: (A) Venn diagram of annotation results of CPC, CNCI, and Swissprot. (B) Statistical chart of new lncRNA transcript types.
Animals 12 01256 g001
Figure 2. The expression of differential mRNA (DEGs) and differential lncRNA (DELs) in the high and low abdominal fat rate groups. Note: (A) Statistics on the number of DEGs in the high and low abdominal fat rate groups; (B) statistics on the number of DELs in the high and low abdominal fat rate groups; (C) volcano map of DEGs, the y axis is the value of −log10 (p Value), the x axis is the value of log2 (FC), and the two threshold lines respectively represent p = 0.01 and FC = 2; (D) volcano map of DELs, the y axis is the value of −log10 (p Value), and the x axis is the value of log2 (FC). The two threshold lines respectively represent FDR = 0.05 and FC = 2.
Animals 12 01256 g002
Figure 3. Analysis of Gene Ontology and KEGG Pathway Enrichment of differential mRNAs. Note: (A) Gene Ontology of differential mRNAs. Blue column represents BP, red column represents CC and green column represents MF; (B) KEGG Pathway Enrichment of differential mRNAs.
Animals 12 01256 g003
Figure 4. Analysis of Gene Ontology and KEGG Pathway Enrichment of target genes of differential lncRNAs. Note: (A) Gene Ontology of target genes of differential lncRNAs. Blue column represents BP, red column represents CC, and green column represents MF; (B) KEGG Pathway Enrichment of target genes of differential lncRNAs.
Animals 12 01256 g004
Figure 5. The interaction between DE lncRNA and its target genes as well as DEGs. Note: (A) Protein–protein interactions of genes and target genes of differential lncRNAs. Note: (B) Interactions between lncRNAs and target genes.
Animals 12 01256 g005
Figure 6. qRT-PCR verification of differentially expressed genes/lncRNA results. Red represents HL and blue represents LF (0.01 < * p < 0.05, ** p < 0.01, *** p < 0.001).
Animals 12 01256 g006
Table 1. Primer information.
Genes/lncRNAPrimer Sequences (5′ → 3′)Product Length/bpAnnealing Temperature/°C
SCD1F:TATTGCAAACTCCGTGGCCT
R:AGGGCTTGTAGTATTTCCGCT
24559
FASNF:CCAGCAAATCAGCTCATGCC
R:TCACGTCTCGGACACCAATG
16760
FAM89AF:TCCGCAAGGAGATGGTTGG
R:TACGTGCAGTCTGCGTTAGA
12759
FGF2F:CTGTACTGCAAGAACGGCGG
R:TCTTCTGTTGCGCATTTCAGT
20660
XR_003497816.1F:TTCCGAAAACTGAGCCCGAA
R:TTCCGAAAACTGAGCCCGAA
17259
XR_001191758.3F:GCCCAGAACTGAAACCAAGC
R:TGGCCTGTTTCACGACAGAT
14759
XR_003500147.1F:TTCCTCTTTTCACTGGCGCT
R:GTGACCATCCATCAGGTGGG
21460
XR_003495255.1F:TGAGCTGGCCTTTCCAGATG
R:AACCTTGCCACGTAAACCCA
23960
GAPDHF:GGTTGTCTCCTGCGACTTCA
R:TCCTTGGATGCCATGTGGAC
11660
Table 2. Distribution of abdominal fat percentage in F2 generation ducks.
Abdominal Fat Rate (%)QuantityNumber of DrakesNumber of Female DucksMale/Female Duck
Abdominal fat rate ≥ 1.75192170.1176
1.50 ≤ Abdominal fat rate < 1.754917320.5313
0.75 ≤ Abdominal fat rate < 1.5221124971.4639
Abdominal fat rate < 0.753421131.6154
Total3041621421.1409
Table 3. Filtered information statistics table of reads.
SampleClean Reads NumHQ Clean Reads Num (%)Read LengthQ20 (%)Q30 (%)
HF-187,815,84099.23%150 + 15098.43%94.77%
HF-267,642,08299.1%150 + 15098.53%95.07%
HF-380,074,66299.24%150 + 15098.34%94.49%
HF-487,797,78499.3%150 + 15098.54%95.08%
LF-164,877,04299.68%150 + 15098.20%94.20%
LF-298,580,67499.16%150 + 15098.13%93.97%
LF-385,446,60099.3%150 + 15098.57%95.15%
LF-490,275,54099.27%150 + 15098.40%94.65%
Table 4. Comparison of gene statistics.
SampleTotal ReadsUnmapped ReadsUnique Mapped ReadsMultiple Mapped ReadsMapping Ratio
HF-178,360,25013,256,69264,460,250643,30883.08%
HF-250,275,2209,793,21040,152,834329,17680.52%
HF-367,770,88411,466,90455,696,058607,92283.08%
HF-466,524,01811,225,43754,740,395558,18683.13%
LF-145,459,6769,181,06035,978,304300,31279.80%
LF-294,305,13215,695,62877,878,940730,56483.36%
LF-372,114,62811,324,25460,240,554549,82084.30%
LF-482,004,74212,254,34669,035,082715,31485.06%
Table 5. Summary of transcript statistics.
Sample NameKnown mRNA NumNew mRNA NumAll mRNA NumKnown lncRNA NumNew lncRNA NumAll lncRNA Num
HF-121,297628127,57824977943291
HF-220,102603226,13423707363106
HF-321,156627927,43523187483066
HF-420,999622127,22023217643085
LF-119,880592325,80322057182923
LF-221,535643527,97025778023379
LF-321,278628427,56225048113315
LF-421,069631727,38624917743265
Publisher’s Note: MDPI stays neutral with regard to jurisdictional claims in published maps and institutional affiliations.

