
Milk Fatty Acids Composition Changes According to β-Hydroxybutyrate Concentrations in Ewes during Early Lactation

 , , ,
, , ,  and
and
Abstract
:Simple Summary
Abstract
1. Introduction
2. Materials and Methods
2.1. Animals
2.2. Experimental Design
2.3. Blood Analysis
2.4. Milk Analysis
2.5. Statistical Analysis
3. Results
4. Discussion
5. Conclusions
Author Contributions
Funding
Institutional Review Board Statement
Data Availability Statement
Conflicts of Interest
References
- Marutsova, V.; Marutsov, P. Subclinical and Clinical Ketosis in Sheep-Relationships Between Body Condition Scores and Blood Β-Hydroxybutyrate and Non-Esterified Fatty Acids Concentrations. Tradit. Mod. Vet. Med. 2018, 3, 30–36. [Google Scholar]
- Panousis, N.; Valergakis, G.E.; Kalaitzakis, E.; Siachos, N.; Kiosis, E.; Arsenos, G. Evaluation of a portable ketometer for on-site monitoring of blood β-hydroxybutyrate concentrations in dairy sheep and goats. Rev. Med. Vet. (Toulouse) 2018, 169, 197–202. [Google Scholar]
- Rook, J.S. Pregnancy toxemia of ewes, does, and beef cows. Veter. Clin. N. Am. Food Anim. Pract. 2000, 16, 293–317. [Google Scholar] [CrossRef]
- Vasava, P.R.; Jani, R.G.; Goswami, H.V.; Rathwa, S.D.; Tandel, F.B. Studies on clinical signs and biochemical alteration in pregnancy toxemic goats. Vet. World 2016, 9, 869–874. [Google Scholar] [CrossRef] [Green Version]
- Harmeyer, J.; Schlumbohm, C. Pregnancy impairs ketone body disposal in late gestating ewes: Implications for onset of pregnancy toxaemia. Res. Vet. Sci. 2006, 81, 254–264. [Google Scholar] [CrossRef]
- Ospina, P.; Nydam, D.; Stokol, T.; Overton, T. Evaluation of nonesterified fatty acids and β-hydroxybutyrate in transition dairy cattle in the northeastern United States: Critical thresholds for prediction of clinical diseases. J. Dairy Sci. 2010, 93, 546–554. [Google Scholar] [CrossRef] [PubMed]
- McArt, J.A.; Nydam, D.V.; Oetzel, G.R.; Overton, T.R.; Ospina, P.A. Elevated non-esterified fatty acids and β-hydroxybutyrate and their association with transition dairy cow performance. Vet. J. 2013, 198, 560–570. [Google Scholar] [CrossRef] [PubMed]
- Fiore, E.; Tessari, R.; Morgante, M.; Gianesella, M.; Badon, T.; Bedin, S.; Mazzotta, E.; Berlanda, M. Identification of Plasma Fatty Acids in Four Lipid Classes to Understand Energy Metabolism at Different Levels of Ketonemia in Dairy Cows Using Thin Layer Chromatography and Gas Chromatographic Techniques (TLC-GC). Animals 2020, 10, 571. [Google Scholar] [CrossRef] [PubMed] [Green Version]
- Luis, C.P.; Jorge, C.D.; Benech, A.; Da Silva, S.; Martín, A.; González-Montaía, J.R. Toxemia de la gestación en ovejas. Revisión Ewe pregnancy toxemia. Rev. Rev. Mex. Cienc. Pecu. 2012, 3, 247–264. [Google Scholar]
- Fiore, E.; Giambelluca, S.; Morgante, M.; Contiero, B.; Mazzotta, E.; Vecchio, D.; Vazzana, I.; Rossi, P.; Arfuso, F.; Piccione, G.; et al. Changes in some blood parameters, milk composition and yield of buffaloes (Bubalus bubalis) during the transition period. Anim. Sci. J. 2017, 88, 2025–2032. [Google Scholar] [CrossRef] [PubMed]
- Balikci, E.; Yildiz, A.; Gurdogan, F. Investigation on some biochemical and clinical parameters for pregnancy toxemia in Akkaraman ewes. J. Anim. Vet. Adv. 2009, 8, 1268–1273. [Google Scholar]
- Sun, X.; Wang, Y.; Loor, J.J.; Bucktrout, R.; Shu, X.; Jia, H.; Dong, J.; Zuo, R.; Liu, G.; Li, X.; et al. High expression of cell death-inducing DFFA-like effector a (CIDEA) promotes milk fat content in dairy cows with clinical ketosis. J. Dairy Sci. 2019, 102, 1682–1692. [Google Scholar] [CrossRef] [PubMed] [Green Version]
- Gross, J.J.; Bruckmaier, R.M. Review: Metabolic challenges in lactating dairy cows and their assessment via established and novel indicators in milk. Animals 2019, 13, s75–s81. [Google Scholar] [CrossRef] [PubMed] [Green Version]
- Loften, J.; Linn, J.; Drackley, J.; Jenkins, T.; Soderholm, C.; Kertz, A. Invited review: Palmitic and stearic acid metabolism in lactating dairy cows. J. Dairy Sci. 2014, 97, 4661–4674. [Google Scholar] [CrossRef] [PubMed]
- Pesántez-Pacheco, J.L.; Heras-Molina, A.; Torres-Rovira, L.; Sanz-Fernández, M.V.; García-Contreras, C.; Vázquez-Gómez, M.; Feyjoo, P.; Cáceres, E.; Frías-Mateo, M.; Hernández, F.; et al. Influence of Maternal Factors (Weight, Body Condition, Parity, and Pregnancy Rank) on Plasma Metabolites of Dairy Ewes and Their Lambs. Animals 2019, 9, 122. [Google Scholar] [CrossRef] [Green Version]
- Schlumbohm, C.; Harmeyer, J. Twin-pregnancy increases susceptibility of ewes to hypoglycaemic stress and pregnancy toxaemia. Res. Vet. Sci. 2008, 84, 286–299. [Google Scholar] [CrossRef]
- Marutsova, V. Changes in blood enzyme activities in ewes with ketosis. Int. J. Adv. Res. 2015, 3, 462–473. [Google Scholar]
- Russel, A. Body condition scoring of sheep. Practice 1984, 6, 91–93. [Google Scholar] [CrossRef]
- Bergonier, D.; Berthelot, X. New advances in epizootiology and control of ewe mastitis. Livest. Prod. Sci. 2003, 79, 1–16. [Google Scholar] [CrossRef]
- Moghaddam, G.; Hassanpour, A. Comparison of blood serum glucose, beta hydroxybutyric acid, blood urea nitrogen and calcium concentrations in pregnant and lambed ewes. J. Anim. Vet. Adv. 2008, 7, 308–311. [Google Scholar]
- Tessari, R.; Berlanda, M.; Morgante, M.; Badon, T.; Gianesella, M.; Mazzotta, E.; Contiero, B.; Fiore, E. Changes of Plasma Fatty Acids in Four Lipid Classes to Understand Energy Metabolism at Different Levels of Non-Esterified Fatty Acid (NEFA) in Dairy Cows. Animals 2020, 10, 1410. [Google Scholar] [CrossRef] [PubMed]
- Zhang, H.; Wu, L.; Xu, C.; Xia, C.; Sun, L.; Shu, S. Plasma metabolomic profiling of dairy cows affected with ketosis using gas chromatography/mass spectrometry. BMC Vet. Res. 2013, 9, 186. [Google Scholar] [CrossRef] [PubMed] [Green Version]
- Lu, J.; Fernandes, E.A.; Cano, A.E.P.; Vinitwatanakhun, J.; Boeren, S.; Van Hooijdonk, T.; Van Knegsel, A.; Vervoort, J.; Hettinga, K.A. Changes in Milk Proteome and Metabolome Associated with Dry Period Length, Energy Balance, and Lactation Stage in Postparturient Dairy Cows. J. Proteome Res. 2013, 12, 3288–3296. [Google Scholar] [CrossRef]
- Liu, L.; Shen, T.; Yang, W.; Yu, H.; Gao, S.; Huang, B.; Xu, C. Ketotic cows display a different serum nonesterified fatty acid composition. J. Dairy Res. 2020, 87, 52–55. [Google Scholar] [CrossRef]
- Contreras, G.A.; Sordillo, L.M. Lipid mobilization and inflammatory responses during the transition period of dairy cows. Comp. Immunol. Microbiol. Infect. Dis. 2011, 34, 281–289. [Google Scholar] [CrossRef] [PubMed]
- Bernal-Santos, G.; O’Donnell, A.; Vicini, J.; Hartnell, G.; Bauman, D. Hot topic: Enhancing omega-3 fatty acids in milk fat of dairy cows by using stearidonic acid-enriched soybean oil from genetically modified soybeans. J. Dairy Sci. 2010, 93, 32–37. [Google Scholar] [CrossRef] [PubMed]
- Moallem, U.; Lehrer, H.; Livshits, L.; Zachut, M. The effects of omega-3 α-linolenic acid from flaxseed oil supplemented to high-yielding dairy cows on production, health, and fertility. Livest. Sci. 2020, 242, 104302. [Google Scholar] [CrossRef]
- Grossi, P.; Bertoni, G.; Cappelli, F.P.; Trevisi, E. Effects of the precalving administration of omega-3 fatty acids alone or in combination with acetylsalicylic acid in periparturient dairy cows1. J. Anim. Sci. 2013, 91, 2657–2666. [Google Scholar] [CrossRef] [PubMed] [Green Version]
- Raphael, W.; Sordillo, L.M. Dietary Polyunsaturated Fatty Acids and Inflammation: The Role of Phospholipid Biosynthesis. Int. J. Mol. Sci. 2013, 14, 21167–21188. [Google Scholar] [CrossRef] [PubMed] [Green Version]
- Ingvartsen, K.L.; Moyes, K. Nutrition, immune function and health of dairy cattle. Animal 2013, 7, 112–122. [Google Scholar] [CrossRef] [PubMed] [Green Version]
- Zhu, C.; Li, C.; Wang, Y.; Laghi, L. Characterization of Yak Common Biofluids Metabolome by Means of Proton Nuclear Magnetic Resonance Spectroscopy. Metabolites 2019, 9, 41. [Google Scholar] [CrossRef] [PubMed] [Green Version]
- Okuno, T.; Gijon, M.A.; Zarini, S.; Martin, S.A.; Barkley, R.M.; Johnson, C.A.; Ohba, M.; Yokomizo, T.; Murphy, R.C. Altered eicosanoid production and phospholipid remodeling during cell culture. J. Lipid Res. 2018, 59, 542–549. [Google Scholar] [CrossRef] [PubMed] [Green Version]
- A Jakschik, B.; Morrison, A.R.; Sprecher, H. Products derived from 5,8,11-eicosatrienoic acid by the 5-lipoxygenase-leukotriene pathway. J. Biol. Chem. 1983, 258, 12797–12800. [Google Scholar] [CrossRef]
- Nguyen, T.T.; Ziboh, V.A.; Uematsu, S.; McCullough, J.L.; Weinstein, G. New Model of a Scaling Dermatosis: Induction of Hyperproliferation in Hairless Mice with Eicosa-5,8,11-trienoic acid. J. Investig. Dermatol. 1981, 76, 384–387. [Google Scholar] [CrossRef] [PubMed] [Green Version]
- Rao, B.S.; Lakshmi, V.; Kaushik, V. An In Silico Comparative Study of Anti-inflammatory Role of Biochanin A and Genistein with 9 Omega-3-fatty Acids Using Complex Docking Analysis with PPARγ and GPR120. Int. J. Pept. Res. Ther. 2020, 26, 2587–2602. [Google Scholar] [CrossRef]
- Sherratt, S.C.; Juliano, R.A.; Mason, R.P. Eicosapentaenoic acid (EPA) has optimal chain length and degree of unsaturation to inhibit oxidation of small dense LDL and membrane cholesterol domains as compared to related fatty acids in vitro. Biochim. Et Biophys. Acta (BBA) Biomembr. 2020, 1862, 183254. [Google Scholar] [CrossRef] [PubMed]
- Fortin, É.; Blouin, R.; Lapointe, J.; Petit, H.V.; Palin, M.-F. Linoleic acid, α-linolenic acid and enterolactone affect lipid oxidation and expression of lipid metabolism and antioxidant-related genes in hepatic tissue of dairy cows. Br. J. Nutr. 2017, 117, 1199–1211. [Google Scholar] [CrossRef] [Green Version]
- Fiore, E.; Blasi, F.; Morgante, M.; Cossignani, L.; Badon, T.; Gianesella, M.; Contiero, B.; Berlanda, M. Changes of milk fatty acid composition in four lipid classes as biomarkers for the diagnosis of bovine ketosis using bioanalytical Thin Layer Chromatography and Gas Chromatographic techniques (TLC-GC). J. Pharm. Biomed. Anal. 2020, 188, 113372. [Google Scholar] [CrossRef] [PubMed]
- Li, Q.; Chen, J.; Yu, X.; Gao, J.-M. A mini review of nervonic acid: Source, production, and biological functions. Food Chem. 2019, 301, 125286. [Google Scholar] [CrossRef]


| Parameters | BHB 0 (n = 28) | SEM | BHB 1 (n = 18) | SEM | p-Value |
|---|---|---|---|---|---|
| BHB (mmol/L) 1 | 0.63 | 0.12 | 1.35 | 0.35 | <0.001 |
| NEFA (mmol/L) 2 | 0.17 | 0.04 | 0.27 | 0.05 | NS 3 |
| Glucose (mmol/L) | 4.07 | 0.14 | 3.43 | 0.19 | 0.009 |
| Urea (mmol/L) | 6.08 | 0.33 | 7.66 | 0.45 | 0.007 |
| DIM 4 | 4.88 | 0.66 | 4.08 | 1.22 | NS 3 |
| BCS 5 | 3.13 | 0.69 | 2.61 | 1.13 | NS 3 |
| Parity | 3.19 | 1.47 | 2.33 | 1.50 | NS 3 |
| Daily milk yield (kg/day) | 1.25 | 0.06 | 1.22 | 0.04 | NS 3 |
| Fatty Acids | Name | BHB 0 (n = 28) | SEM | BHB 1 (n = 18) | SEM | p-Value |
|---|---|---|---|---|---|---|
| C6 | Caproic acid | 154.91 | 55.28 | 285.32 | 75.69 | NS 1 |
| C8 | Caprylic acid | 150.01 | 15.10 | 141.04 | 20.68 | NS 1 |
| C10 | Capric acid | 390.30 | 37.51 | 404.01 | 51.37 | NS 1 |
| C14 | Myristic acid | 418.09 | 22.52 | 383.35 | 30.84 | NS 1 |
| C14:1 ω 5 | Myristelaidic acid | 10.58 | 1.51 | 14.28 | 2.07 | NS 1 |
| C16 | Palmitic acid | 1163.05 | 62.34 | 1137.56 | 85.36 | NS 1 |
| C16:1 ω 7 | Palmitoleic acid | 42.95 | 5.50 | 51.07 | 7.53 | NS 1 |
| C18 | Stearic acid | 396.36 | 25.45 | 570.88 | 34.85 | 0.0002 |
| C18:1 ω 9 | Oleic acid | 1008.32 | 115.75 | 1418.64 | 158.50 | 0.042 |
| C18:1 ω 7 | Cis-Vaccenic acid | 77.45 | 12.68 | 98.40 | 17.36 | NS 1 |
| C18:2 ω 6 | Linoleic acid | 175.99 | 7.90 | 189.38 | 10.82 | NS 1 |
| C18:3 ω 6 | γ -linolenic acid | 6.52 | 0.26 | 8.03 | 0.35 | 0.001 |
| C18:3 ω 3 | α-linolenic acid | 22.87 | 1.34 | 27.73 | 1.83 | 0.038 |
| C18:4 ω 3 | Stearidonic acid | 3.87 | 0.48 | 5.80 | 0.66 | 0.023 |
| C20 | Arachidic acid | 9.19 | 0.64 | 12.71 | 0.87 | 0.002 |
| C20:1 ω 9 | Gondoic acid | 9.96 | 1.32 | 14.41 | 1.81 | 0.053 |
| C20:1 ω 7 | Paullinic acid | 5.79 | 0.54 | 7.53 | 0.75 | NS 1 |
| C20:2 ω 6 | Eicosadienoic acid | 2.14 | 0.16 | 2.14 | 0.22 | NS 1 |
| C20:3 ω 9 | Mead acid | 1.92 | 0.09 | 2.33 | 0.13 | 0.013 |
| C20:3 ω 6 | Dihomo- γ -linolenic acid | 1.76 | 0.10 | 1.77 | 0.14 | NS 1 |
| C20:4 ω 6 | Arachidonic acid | 18.49 | 0.94 | 18.32 | 1.29 | NS 1 |
| C20:3 ω 3 | Eicosatrienoic acid (ETE) | 0.43 | 0.03 | 0.55 | 0.05 | 0.049 |
| C20:4 ω 3 | Eicosatetraenoic acid (ETA) | 0.18 | 0.02 | 0.22 | 0.03 | NS 1 |
| C20:5 ω 3 | Eicosapentaenoic acid (EPA) | 18.22 | 1.31 | 23.87 | 1.79 | 0.015 |
| C22 | Behenic acid | 0.37 | 0.12 | 0.62 | 0.16 | NS 1 |
| C22:1 ω 9 | Erucic acid | 0.48 | 0.10 | 0.61 | 0.14 | NS 1 |
| C22:2 ω 6 | Docosadienoic acid | 0.19 | 0.01 | 0.18 | 0.02 | NS 1 |
| C22:4 ω 6 | Adrenic acid | 3.30 | 0.18 | 3.30 | 0.24 | NS 1 |
| C22:5 ω 6 | Docopentaenoic acid | 0.02 | 0.01 | 0.01 | 0.01 | NS 1 |
| C22:5 ω 3 | Decosapentaenoic acid (DPA) | 7.54 | 0.58 | 8.42 | 0.80 | NS 1 |
| C22:6 ω 3 | Docosahexaenoic acid (DHA) | 3.28 | 0.37 | 4.21 | 0.51 | NS 1 |
| C24 | Lignoceric acid | 2.15 | 0.15 | 2.68 | 0.21 | 0.047 |
| C24:1 ω 9 | Nervonic acid | 1.20 | 0.07 | 1.43 | 0.09 | 0.050 |
| C16 DMA | Dimethyl-acetal-palmitic acid | 14.45 | 4.46 | 27.30 | 6.11 | NS 1 |
| Mg FA/dl | 4536.63 | 245.66 | 5276.94 | 336.38 | NS 1 |
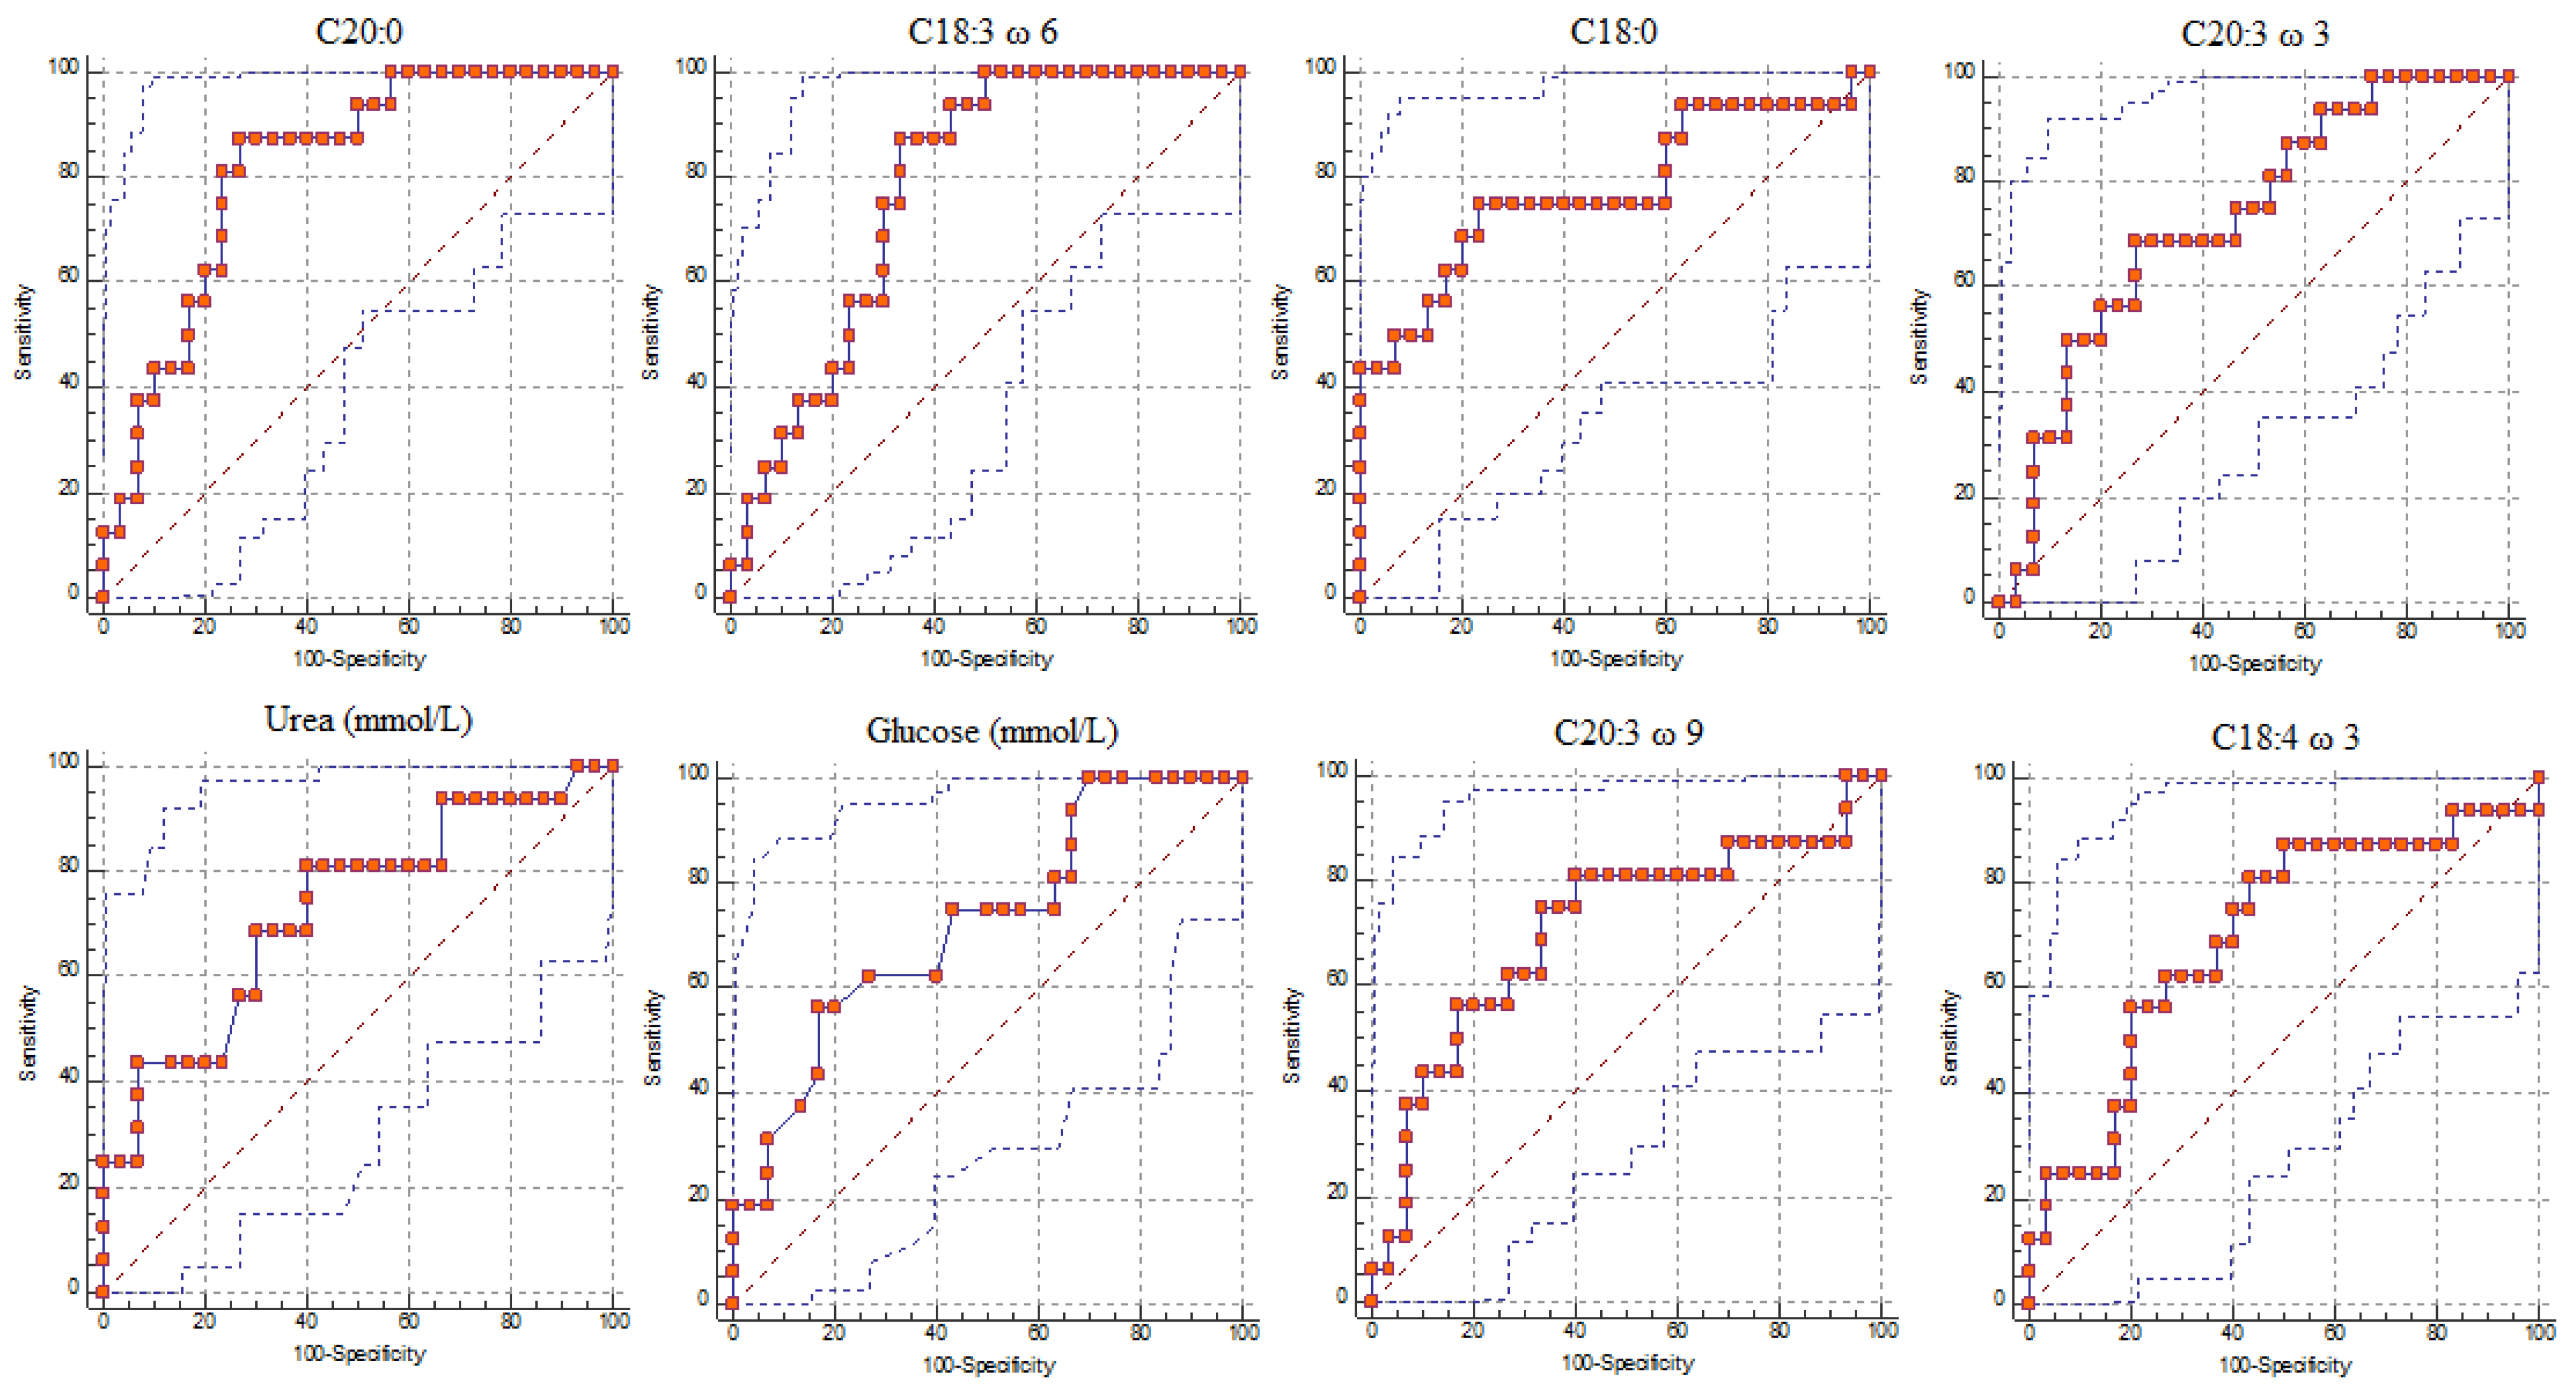
| Parameters | Cut-off (mg/dl) | AUC 1 | Se 2 | 95% CI for Se | Sp 3 | 95% CI for Sp | +LR | p-Value |
|---|---|---|---|---|---|---|---|---|
| C20 | >9.65 | 0.82 | 87.5 | 61.7–98.4 | 73.33 | 54.1–87.7 | 3.28 | <0.001 |
| C18: 3 ω 6 | >7.07 | 0.78 | 87.5 | 61.7–98.4 | 66.67 | 47.2–82.7 | 2.62 | <0.001 |
| C18 | >465.31 | 0.77 | 75 | 47.6–92.7 | 76.67 | 57.7–90.1 | 3.21 | <0.001 |
| C20: 3 ω 3 | >0.45 | 0.73 | 68.75 | 41.3–89.0 | 73.33 | 54.1–87.7 | 2.58 | <0.001 |
| C20: 3 ω 9 | >2.07 | 0.71 | 75 | 47.6–92.7 | 66.67 | 47.2–82.7 | 2.25 | <0.001 |
| C18: 4 ω 3 | >3.37 | 0.70 | 81.25 | 54.4–96.0 | 56.67 | 37.4–74.5 | 1.87 | <0.001 |
| C18: 1 ω 9 | >1277.52 | 0.67 | 56.25 | 29.9–80.2 | 83.33 | 65.3–94.4 | 3.38 | <0.001 |
| C20: 5 ω 3 | >22.33 | 0.68 | 56.25 | 29.9–80.2 | 80 | 61.4–92.3 | 2.81 | <0.001 |
| C24 | >2.03 | 0.68 | 81.25 | 54.4–96.0 | 53.33 | 34.3–71.7 | 1.74 | <0.001 |
| C18: 3 ω 3 | >21.62 | 0.65 | 87.5 | 61.7–98.4 | 43.33 | 25.5–62.6 | 1.54 | <0.001 |
| C24:1 ω 9 | >0.96 | 0.64 | 93.75 | 69.8–99.8 | 33.33 | 17.3–52.8 | 1.41 | <0.001 |
Publisher’s Note: MDPI stays neutral with regard to jurisdictional claims in published maps and institutional affiliations. |
© 2021 by the authors. Licensee MDPI, Basel, Switzerland. This article is an open access article distributed under the terms and conditions of the Creative Commons Attribution (CC BY) license (https://creativecommons.org/licenses/by/4.0/).
Share and Cite
Fiore, E.; Lisuzzo, A.; Tessari, R.; Spissu, N.; Moscati, L.; Morgante, M.; Gianesella, M.; Badon, T.; Mazzotta, E.; Berlanda, M.; et al. Milk Fatty Acids Composition Changes According to β-Hydroxybutyrate Concentrations in Ewes during Early Lactation. Animals 2021, 11, 1371. https://doi.org/10.3390/ani11051371
Fiore E, Lisuzzo A, Tessari R, Spissu N, Moscati L, Morgante M, Gianesella M, Badon T, Mazzotta E, Berlanda M, et al. Milk Fatty Acids Composition Changes According to β-Hydroxybutyrate Concentrations in Ewes during Early Lactation. Animals. 2021; 11(5):1371. https://doi.org/10.3390/ani11051371
Chicago/Turabian StyleFiore, Enrico, Anastasia Lisuzzo, Rossella Tessari, Nicoletta Spissu, Livia Moscati, Massimo Morgante, Matteo Gianesella, Tamara Badon, Elisa Mazzotta, Michele Berlanda, and et al. 2021. "Milk Fatty Acids Composition Changes According to β-Hydroxybutyrate Concentrations in Ewes during Early Lactation" Animals 11, no. 5: 1371. https://doi.org/10.3390/ani11051371