1. Introduction
Wind power is increasing in importance as future energy systems and the construction of a large number of new wind farms are being planned [
1]. This expansion will cause an increased impact on wildlife and efficient mitigation methods are therefore urgently needed [
2]. Bats are among the organisms heavily affected, not only due to high mortality caused by collisions [
3], but also because of barrier effects and habitat loss [
4,
5,
6]. A number of hypotheses explaining the behaviour of bats and associated fatalities at wind parks have been suggested in the literature. These include passive factors such as the wind farm creating physical barriers to migrating bats, and active factors such as attraction to the wind turbines for foraging, roosting, or mating [
3,
7,
8,
9]. There is some support for several of the hypotheses and most probably, the explanation is a combination of several factors [
9]. In this study, we focus on the feeding-attraction hypothesis, which states that the occurrence of bats at the turbine nacelle is due to their attraction to relatively high insect abundances for foraging [
7]. There might be several reasons for insects to concentrate around the nacelle, such as light and colour [
10], but also the physical structure may attract insects. For example, flies (order Diptera) have a swarming behaviour in which individuals of both sexes concentrate in groups close to marked objects in the landscape [
11]. The swarm may become large, and under good conditions, contain thousands of individuals. During typical mosquito swarming behaviour, the individuals in the swarm turn towards the wind causing it to remain stable above, or in the shelter behind, a marked upright object [
11]. This behaviour can lead to accumulations of insects above or behind the nacelle. Another reason for high insect abundance at nacelle-height is that during migration, insects use high-altitude movements [
12,
13] aided by wind streams to colonize new sites. Insects actively move vertically to find heights with appropriate wind directions [
14].
Rydell et al. [
15] discussed the feeding-attraction hypothesis and found it most likely that bat occurrence at nacelle height was linked to nocturnal insect migration. Several studies have also confirmed that bats are actively foraging at wind turbines [
9,
16,
17,
18]. The feeding-attraction hypothesis was tested in the field by Foo et al. [
18], who measured insect and bat presence at wind turbines in North Texas, United States. They compared the stomach contents of bats with the contents of bat faeces and demonstrated that bats were foraging and resting at the nacelle. On the other hand, Reimer et al. [
19] found no support for active foraging when studying two migrating bat species. In their study, they compared feeding activities at different heights, and between wind turbines and meteorological towers, but found no differences in feeding activity. However, Rydell et al. [
20] showed that bats sometimes fed on diurnal flies resting on wind turbines and wind towers and argued that the absence of feeding buzz does not exclude the possibility that the bats are feeding.
Measuring bat activity at nacelle height is difficult for several reasons. Visiting the tower requires special education, and during the work, the turbines must be stopped. However, several studies of bats at nacelle height have been made in connection to environmental impact assessment [
21,
22,
23]. Unfortunately, there are just a few such studies published in scientific papers. In Canada, Baerwald and Barclay [
24] and Reimer et al. [
19] studied the activity pattern at 67 m height. In the former study, the mean activity of five migratory bat species was described. In France, Roemer et al. [
25] investigated bat activity at 50–100 m above ground and suggested that their results may serve as a reference for the flight behaviour and time spent at different heights. However, both species composition and bat abundance differ considerably between Scandinavia and other parts of Europe and North America, and these results may not be applicable elsewhere [
22].
In order to mitigate bat fatalities at wind farms, it is important to understand the mechanisms behind the bat occurrence at nacelle height. Several mitigation methods have been proposed to avoid bat collisions, such as operational adjustments [
26,
27,
28,
29,
30]. In Sweden, the recommendation is to turn the wind turbines off in late summer and autumn at temperatures above 14 °C and wind speeds below 6 m/s [
22]. This recommendation is based on a literature review (based on the activity of bats at six wind turbines), which showed that most collisions occur during August through September, at relatively high temperatures and at low wind speeds. The proposal makes sense, if the explanation for the bats’ presence at the wind turbines is the weather. Thus, it is important to have good knowledge of the factors affecting insects, bat abundance, and the variation of both within and between years.
The objectives of this study were to: (a) test the feeding attraction hypothesis by measuring bat activity and insect abundance at nacelle height, and compare the effect of the insect abundance and weather conditions on bat activity (b) study the variation of species composition and bat activity in time (between nights and between years) and space (ground level and nacelle-height, and between sites), (c) compare two technical systems for bat recordings at nacelle-height, (d) based on the result, discuss stop-regulation as a potential mitigation method.
We present data on bat activity at three wind turbines between June and October 2017 and 2018 at nacelle height and at the ground. Data on insect abundance were collected at nacelle-height for one year at one wind turbine, with a new type of suction trap, which made it possible to measure insect abundance at the same time as bats were active. Meteorological data were collected at nacelle-height at the three wind turbines.
2. Materials and Methods
The data were collected June–October 2017 and 2018 at three wind turbines (Stena Renewable AB, Göteborg, Sweden and Erikhester vindpark AB, Vetlanda, Sweden), located at two different sites in the province of Småland in southern Sweden (south of the city Vetlanda, 57°25′38″, 15°05′07″). The three wind turbines were part of bigger wind farms (with 6 and 32 turbines) and were selected based on practical reasons in cooperation with the company. The surrounding landscape was dominated by managed coniferous forests with no large water bodies such as lakes or coastline nearby. At the southern site, bat activity was measured in 2017 and 2018 at one wind turbine (hereafter called southern wind turbine, SWT), both at the base of the wind turbine (about 5 m above the ground), and at nacelle height (about 130 m above the ground). At the northern site, the bat activity was only measured at one wind turbine in 2017 and at two wind turbines in 2018 (hereafter called the northern wind turbines, NWT1 and NWT2) at nacelle height (about 150 m above the ground). The distance between SWT and NWT1 was 13 km, and the distance between NWT1 and NWT2 was 1.6 km.
At all sites, wind speed (m/s) and temperature (°C) were measured at the nacelle height every 10 min (data from the wind-power companies). Average wind speed and average temperature were calculated per night and per wind turbine between sunset and sunrise times. Precipitation (mm) was measured at Målilla weather station every hour (weather station of the Swedish meteorological and hydrological institute), which is within 50 km of each wind farm. Total precipitation was calculated per night between sunset and sunrise.
Bat activity was measured by using ultrasound detector Avisoft 116 hnbm attached to the microphone EP3 (Bioacoustic technology Gmbh, Winkelhaid, Germany). The recordings took place every night during the study period from June until October. At the SWT location, we deployed both Avisoft 116 hnbm and Pettersson D500X detectors (Pettersson Elektronik AB, Uppsala, Sweden) with microphones placed next to each other, to estimate the impact of different systems on the results. The settings of both ultrasound detectors are presented in
Appendix A. The Pettersson system is commonly used in Sweden [
22], while Avisoft is more commonly used throughout parts of Europe [
31]. Unfortunately, the Avisoft recorder at the nacelle height at the SWT did not work for a period in 2018. Thus, we did not include data collected from the Avisoft recorder at nacelle height, at the SWT in the analysis.
Sorting and preliminary sound analysis was conducted using the software program Omnibat, which provided an automatic identification (Developed by Johan Karlsson & Alexander Eriksson at Ecocom AB, Kalmar, Sweden, but not available on the market). All files containing bat calls were then investigated manually with Omnibat and Batsound 4.03 (Pettersson Elektronik) to identify the species. Species within the genus
Myotis are difficult to separate and were combined into
Myotis spp. The most difficult pulses were assigned to microchiroptera group. Each recording containing a bat call was counted as one bat pass. If there were several sounds of the same species in one recording, it was counted as one bat pass. However, several species in one recording were counted as separate bat passes. Bat activity (total bat activity and bat activity per species) was calculated for each device (D500X or Avisoft), each height (base or nacelle height) and each night (
Table 1).
At SWT, insect abundance was measured at the nacelle height during 2017, between the 28th of June and the 31st of October. However, during a 21-day period, the trap was active all day and all night instead of all night only. This was an intentional change to verify the functionality of the trap. The data from this 21-day period were excluded from the analyses. Insects were trapped by using a suction trap placed close to the nacelle at SWT. Suction traps [
32] are often used for the estimation of food availability for bats [
33,
34,
35]. It works as a vacuum cleaner in which the insects are separated from the airflow by a net and then collected in a bottle with glycol. To enable collection of separate samples for each night, the trap contained a revolver magazine of 21 bottles. The trap was programmed to change bottles every day. The fan was synchronised to start at sunset and stop at sunrise. A camera was placed within the trap, sending pictures every day to make it possible to verify the functionality of the device. Every third week the bottles were replaced. The fan had a diameter of 50 cm, creating an airflow of 6000 m
3/hour through the trap. Insects were identified to order, and when possible, to sub-order and counted, thereby providing an abundance measurement for each night.
Statistical analyses were performed with SAS proc GENMOD, version 9.4 (SAS, Cary, NC), and R, version 4.0.4 (R foundation for statistical computing, 2021).
The difference in wind speed and temperature between 2017 and 2018 were controlled with the Student’s t-test. Pearson rank correlation was used to calculate the correlation between the wind and the temperature. Only the weather conditions from SWT and NWT1 were used for those statistics.
A multiple Poisson-regression model was used to explain the relationship between the insect abundance and the three weather variables (as insect abundance, the response variable, was not normally distributed, [
36]). The three weather variables (temperature, wind, precipitation) were used as explanatory variables.
The relationship between bat activity, insect abundance, and weather (wind, temperature and precipitation) from SWT were also analysed using multiple Poisson regressions, because data on bat activity were not normally distributed [
36]. Insect abundance and the three weather variables were used as explanatory variables to analyse the number of bat-passes per night for the total bat activity or the activity of each of the five most common taxa. There was no risk of multicollinearity [
36], because the correlations between the explanatory variables varied between −0.32 and + 0.08. All models containing all possible combinations of the four explanatory variables were analysed (in our case 14 models). Interactions were not included. Among these 14 models, the one with the lowest AIC (Akaike information criterion), in combination with
p < 0.2 for all included variables, was chosen. Dscale in proc GENMOD was used to compensate for the overdispersion of the data when needed [
37]. However, the overdispersion of the data with the activity of
E. nilssonii as the response variable could not be compensated. Therefore, the models with
E. nilssonii activity were done without the outlier (where the overdispersion was compensated). In addition, the model with total bat activity was tested without the same outlier.
The relations between bat activity and weather conditions were also examined at NWT. A generalized linear mixed model was used, with the total bat activity as the response variable, and the three meteorological variables as explanatory variables. The date was used as a random effect. The correlation between the wind speed and the temperature was low (−0.29), so these two variables could be used in the same model [
36].
In order to know if bat activity differed between 2017 and 2018, Wilcoxon tests were used to compare bat activity at nacelle height at NWT1 and to compare bat activity at SWT at ground height (data from the Avisoft equipment). The comparisons were made for the total bat activity and for each of the five most common species.
In the same way, bat activity between two wind turbines was compared with the Wilcoxon test. In 2017, bat activity was compared between SWT and NWT1 and in 2018 between NWT1 and NWT2 (data from the Avisoft equipment).
We compared a number of recordings and the correlation between two technical systems (D500X and Avisoft) at the ground level at SWT in 2018 by using the Wilcox test for paired data and Spearman rank correlation.
3. Results
In total, recordings were collected at nacelle height 243 and 403 nights in 2017 and 2018 respectively, and at ground level 91 and 233 nights in 2017 and 2018 respectively (
Table 1). Nine taxa were identified, and more than 7 000 bat passes were recorded (
Table 1). The most common species were
Pipistrellus pygmaeus (32% of the total number of bat passes),
Eptesicus nilssonii (29%),
Myotis spp. (20%),
Nyctalus noctula (10%). There were also a few records of
Vespertilio murinus (4%) and
Eptesicus serotinus,
Barbastella barbastellus,
Pipistrellus nathusii and
Plecotus auritus (<0.01% each). All species except
P. nathusii were present at the nacelle height, and all species except
B. barbastellus were present at the ground level.
E. nilssonii,
P. pygmaeus and
Myotis spp. represent the three most common taxa at nacelle height and at ground level.
Weather conditions during the survey period are shown in
Table 2. There was no significant difference in wind speed between 2017 and 2018 (t = −0.32,
p-value = 0.74, n = 306 nights). However, the mean temperature was significantly lower in 2017 compared to 2018 (t = −6.38,
p-value < 0.01, n = 306 nights). Temperature decreased with an increasing wind-speed (data from 2017 and 2018, Pearson rank correlation r
s = –0.30,
p < 0.01, n = 306 nights). In 2017, there were 34 nights of rain and 11 in 2018. Precipitation varied between 0.1 mm and 20.0 mm of rain in 2017 and between 0.1 mm and 21.4 mm in 2018 during rainy days.
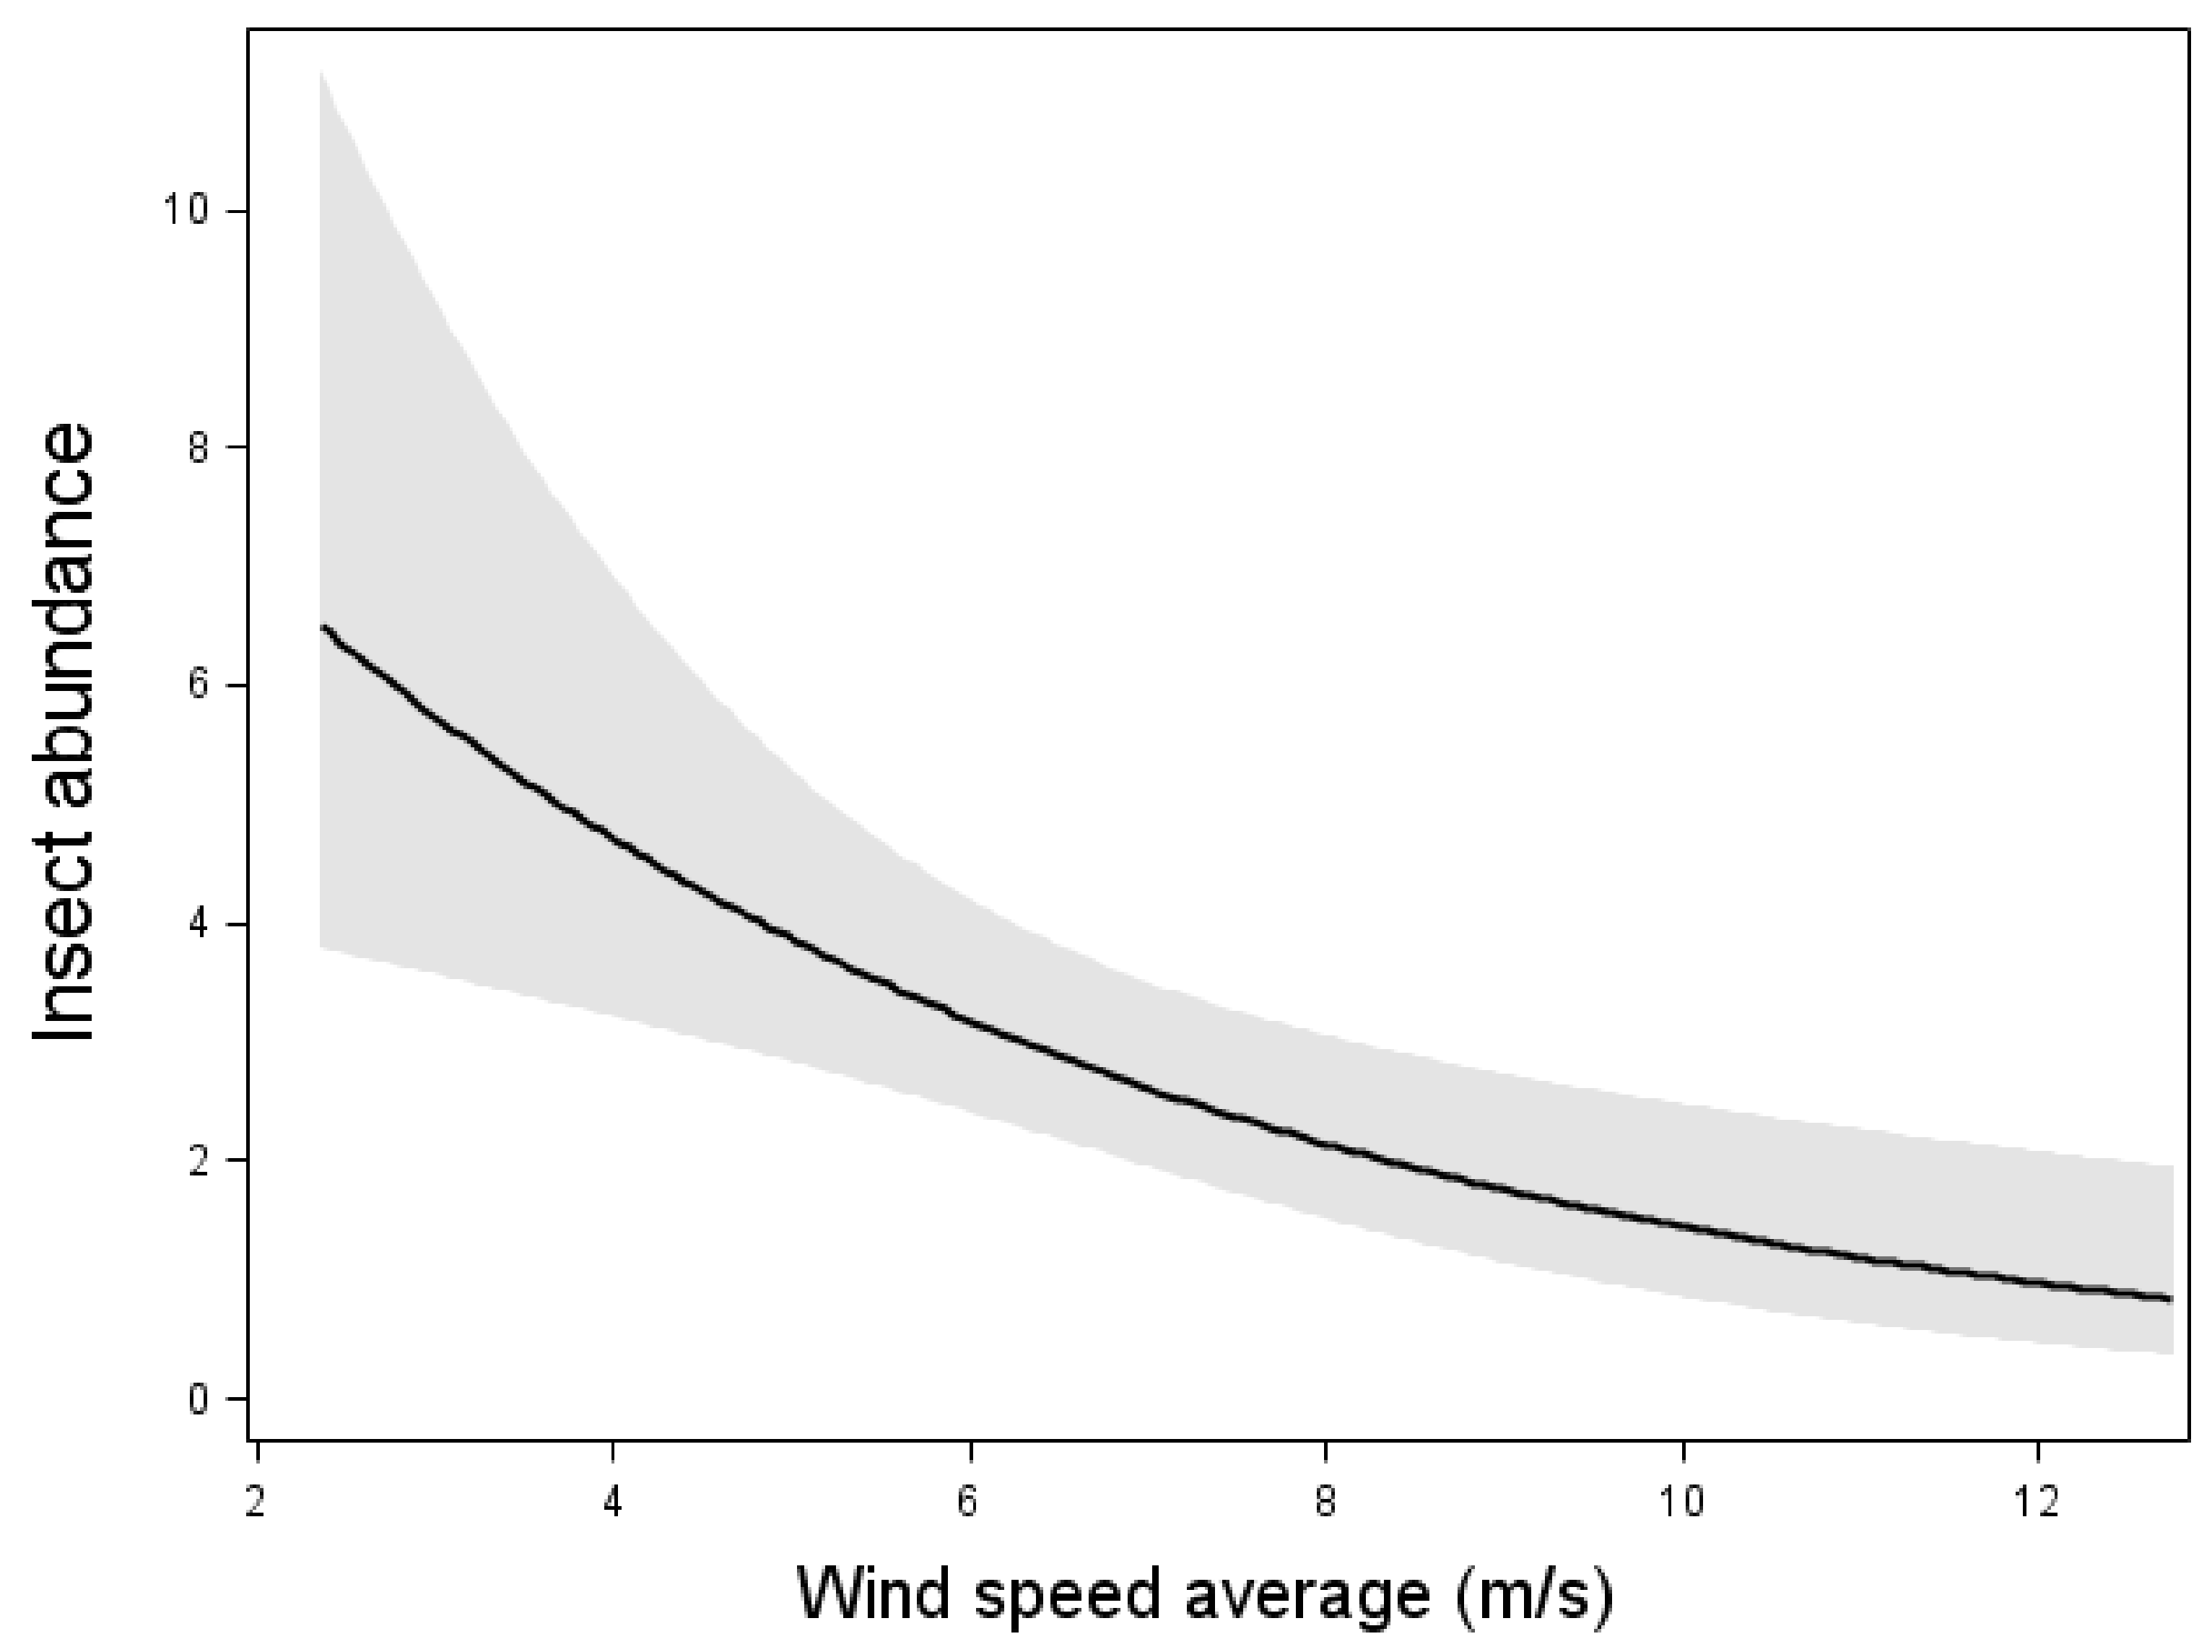
The model including insect abundance as the response variable and weather conditions as explanatory variable showed that there was a negative relation between wind speed and insect abundance (Wald χ
2 = 10.18,
p < 0.01, n = 105 nights,
Figure 1). However, the temperature did not affect insect abundance at the nacelle level.
Bat activity, insect abundance and weather conditions were measured simultaneously during 87 nights in 2017 at SWT at nacelle height.
Table 3 summarizes the results for all selected models, including bat activity, insect abundance, and weather conditions at SWT.
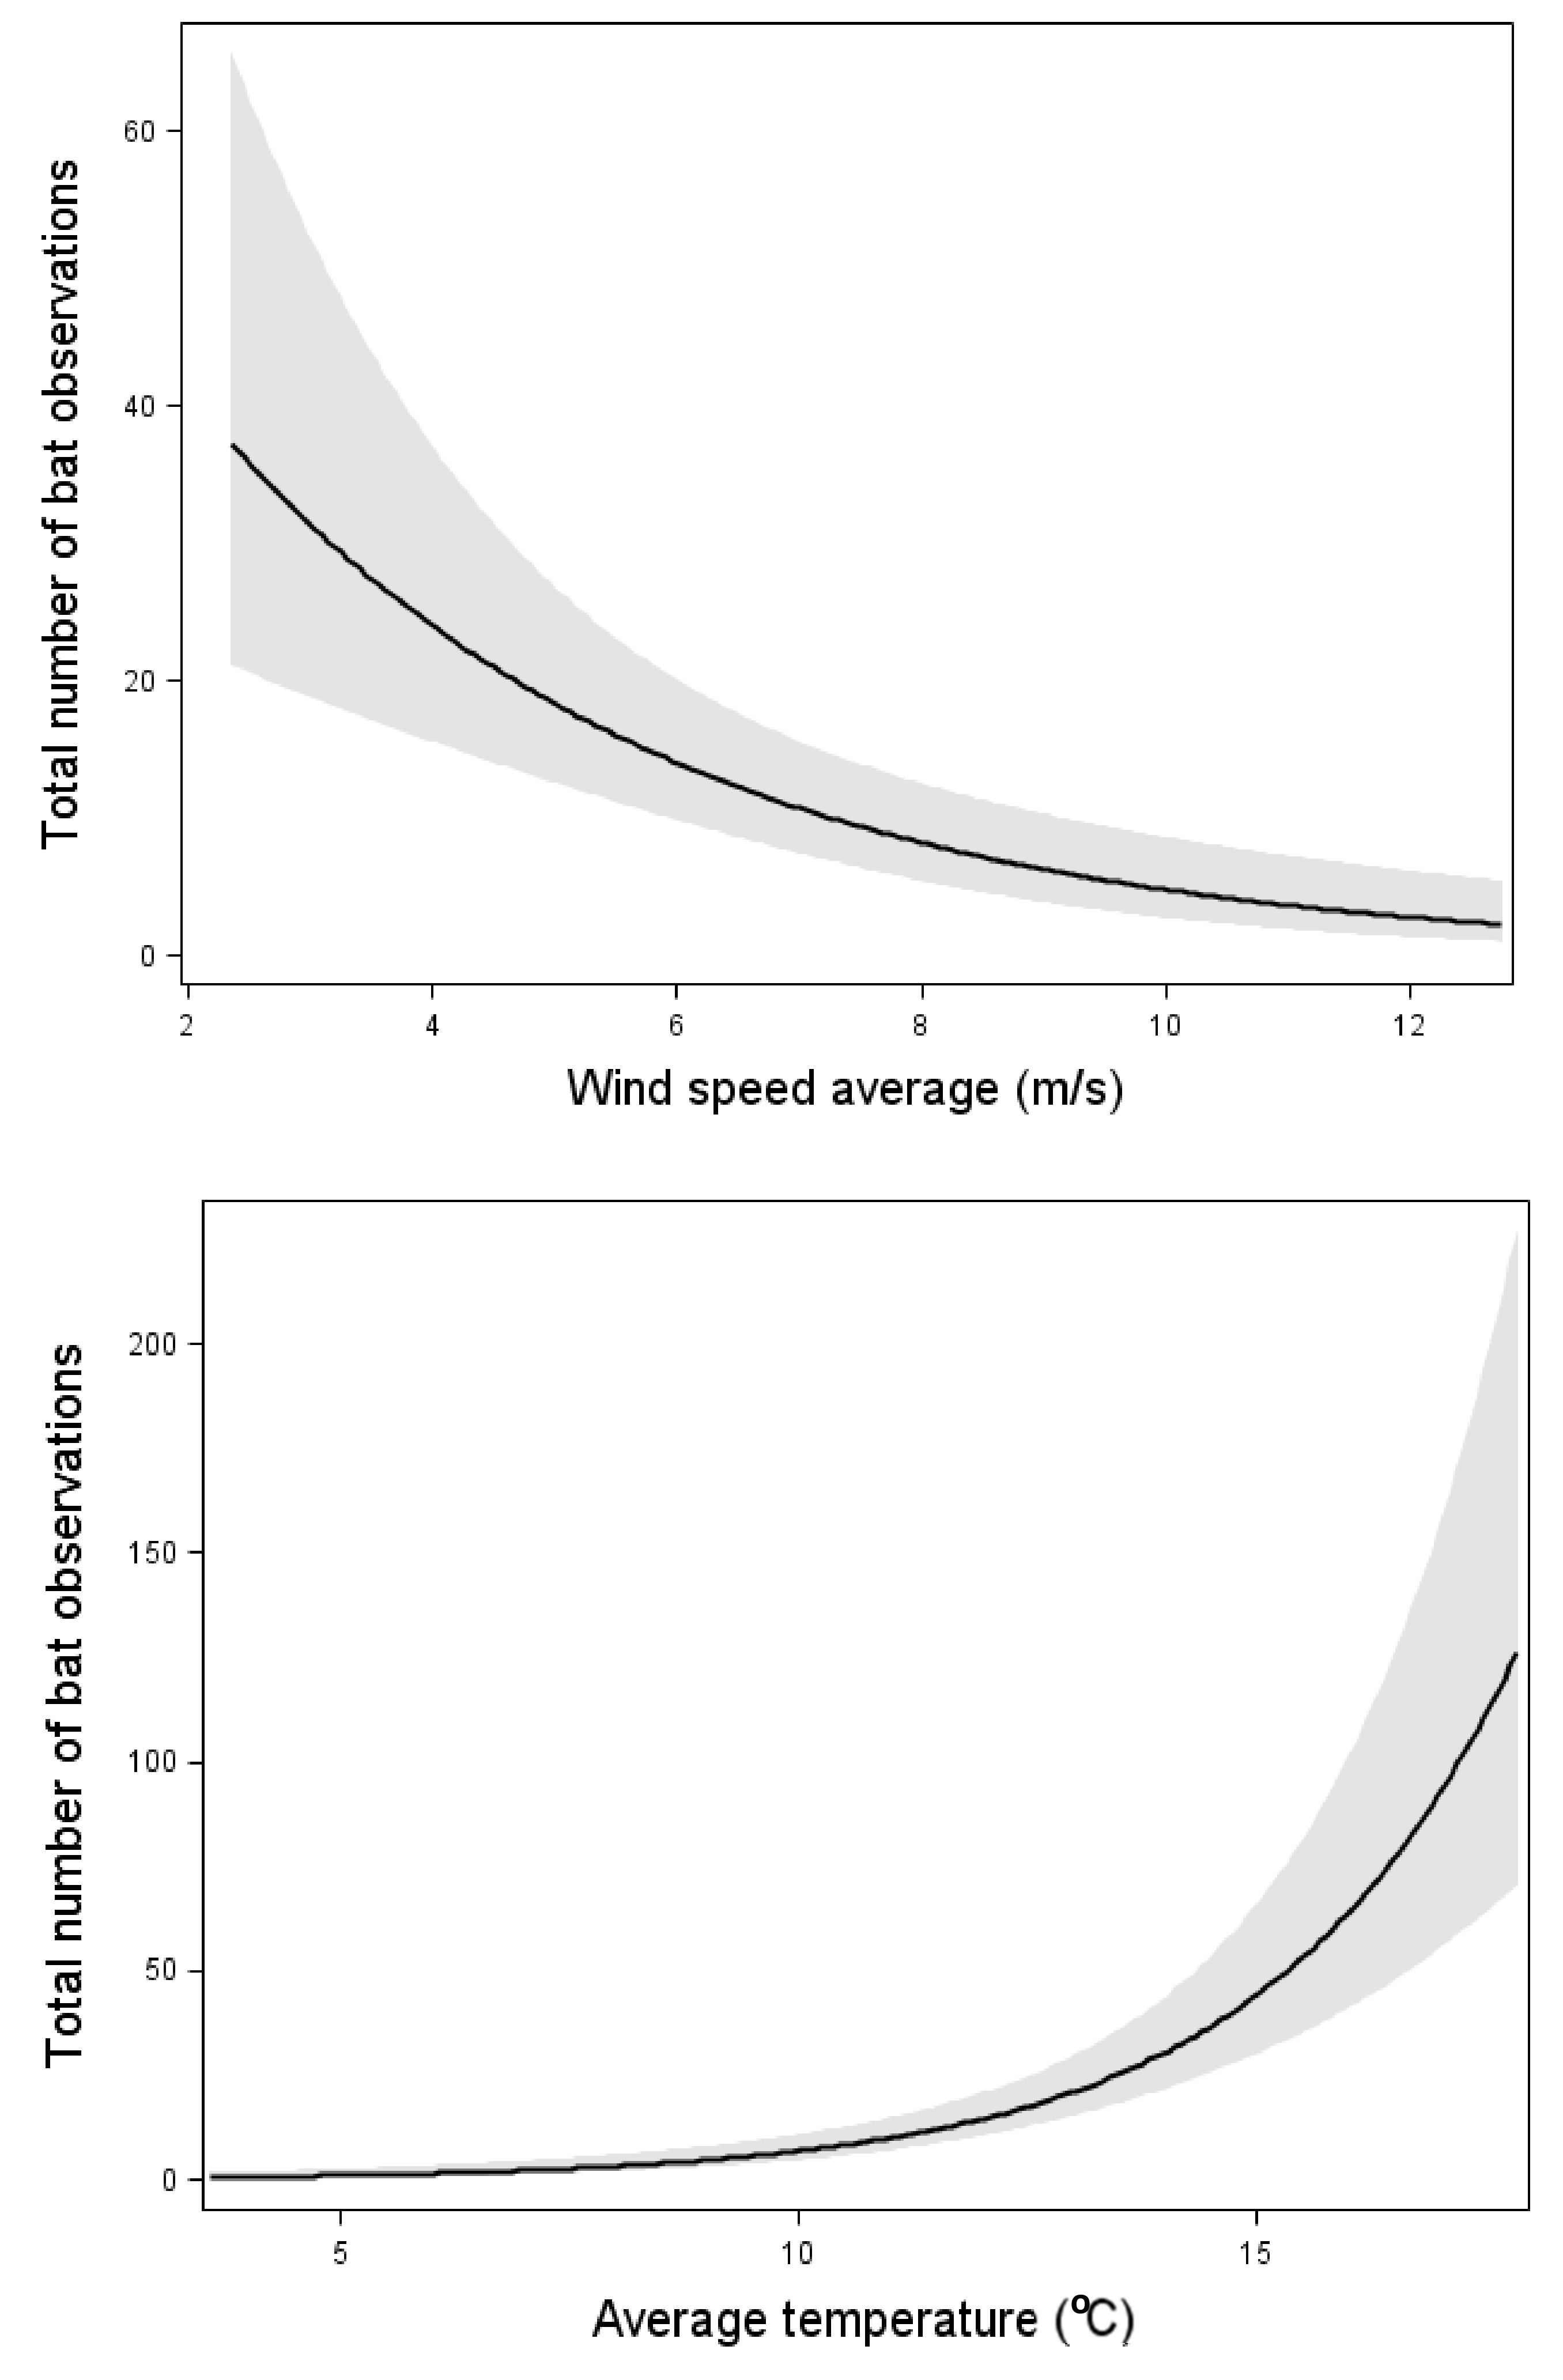
The total bat activity increased with an increasing insect abundance (
Figure 2). However, the relation was weaker than the effect of wind speed and temperature (
Figure 2,
Table 3). When one outlier with the highest bat activity was removed, the significant correlation between insect abundance and total bat activity disappeared. However, the effects of wind speed and temperature remained.
N. noctula,
E. nilssonii, and
V. murinus all increased their activity with increasing insect abundance (
Table 3). Each of these three species were also affected by one of the weather factors:
E. nilssonii and
V. murinus increased their activity with increasing temperature, whereas
N. noctula activity decreased with increasing wind speed (
Table 3). The other two taxa,
P. pygmaeus and
Myotis spp., that was tested were unaffected by insect abundance but were affected by weather factors. Both
P. pygmaeus and
Myotis spp. activity decreased with increasing wind speed and
P. pygmaeus was also affected by temperature and increased its activity with increasing temperature (
Table 3).
With both models with and without data from 11 August, the total bat activity increased with increasing temperature and decreased with increasing wind-speed (
Figure 2,
Table 3). However, the variation between nights was large and no obvious threshold of bat activity was apparent. Bats were observed up to a wind speed of about 12 m/s, but in the three occasions with higher wind speeds, no observations were made. The same relations between total bat activity and weather conditions were found from the data from NWT: bat activity significantly decreased with an increasing wind speed (estimate: −0.86,
p-value < 0.01) and significantly increased with an increasing temperature (estimate: 0.28123,
p-value < 0.01, n = 421 nights). The precipitation had no significant effect on bat activity.
Total bat activity at NWT1 at nacelle height did not significantly differ between 2017 and 2018 (0.43 ± 0.14 bat passes per night in 2017 versus 2.64 ± 1.23 bat passes per night in 2018, Wilcox test = 8997,
p-value = 0.28, n = 137 nights). The activity of the four main species at NWT1 (
E. nilssonii,
P. pygmaeus,
V. murinus and
N. noctula) did not differ between 2017 and 2018 at nacelle height (
Table 4). Total bat activity at SWT at ground height significantly differed between 2017 and 2018 (2.88 ± 0.80 bat passes per night in 2017 versus 16.93 ± 3.25 bat passes per night in 2018, Wilcox test = 2015.5,
p-value < 0.01, n = 91 nights). The activity of
E. nilssonii,
P. pygmaeus,
Myotis ssp and
N. noctula did also significantly differ between 2017 and 2018 at the ground height at SWT. However, there was no significant difference in
V. murinus activity between 2017 and 2018 at the ground level at SWT (
Table 4).
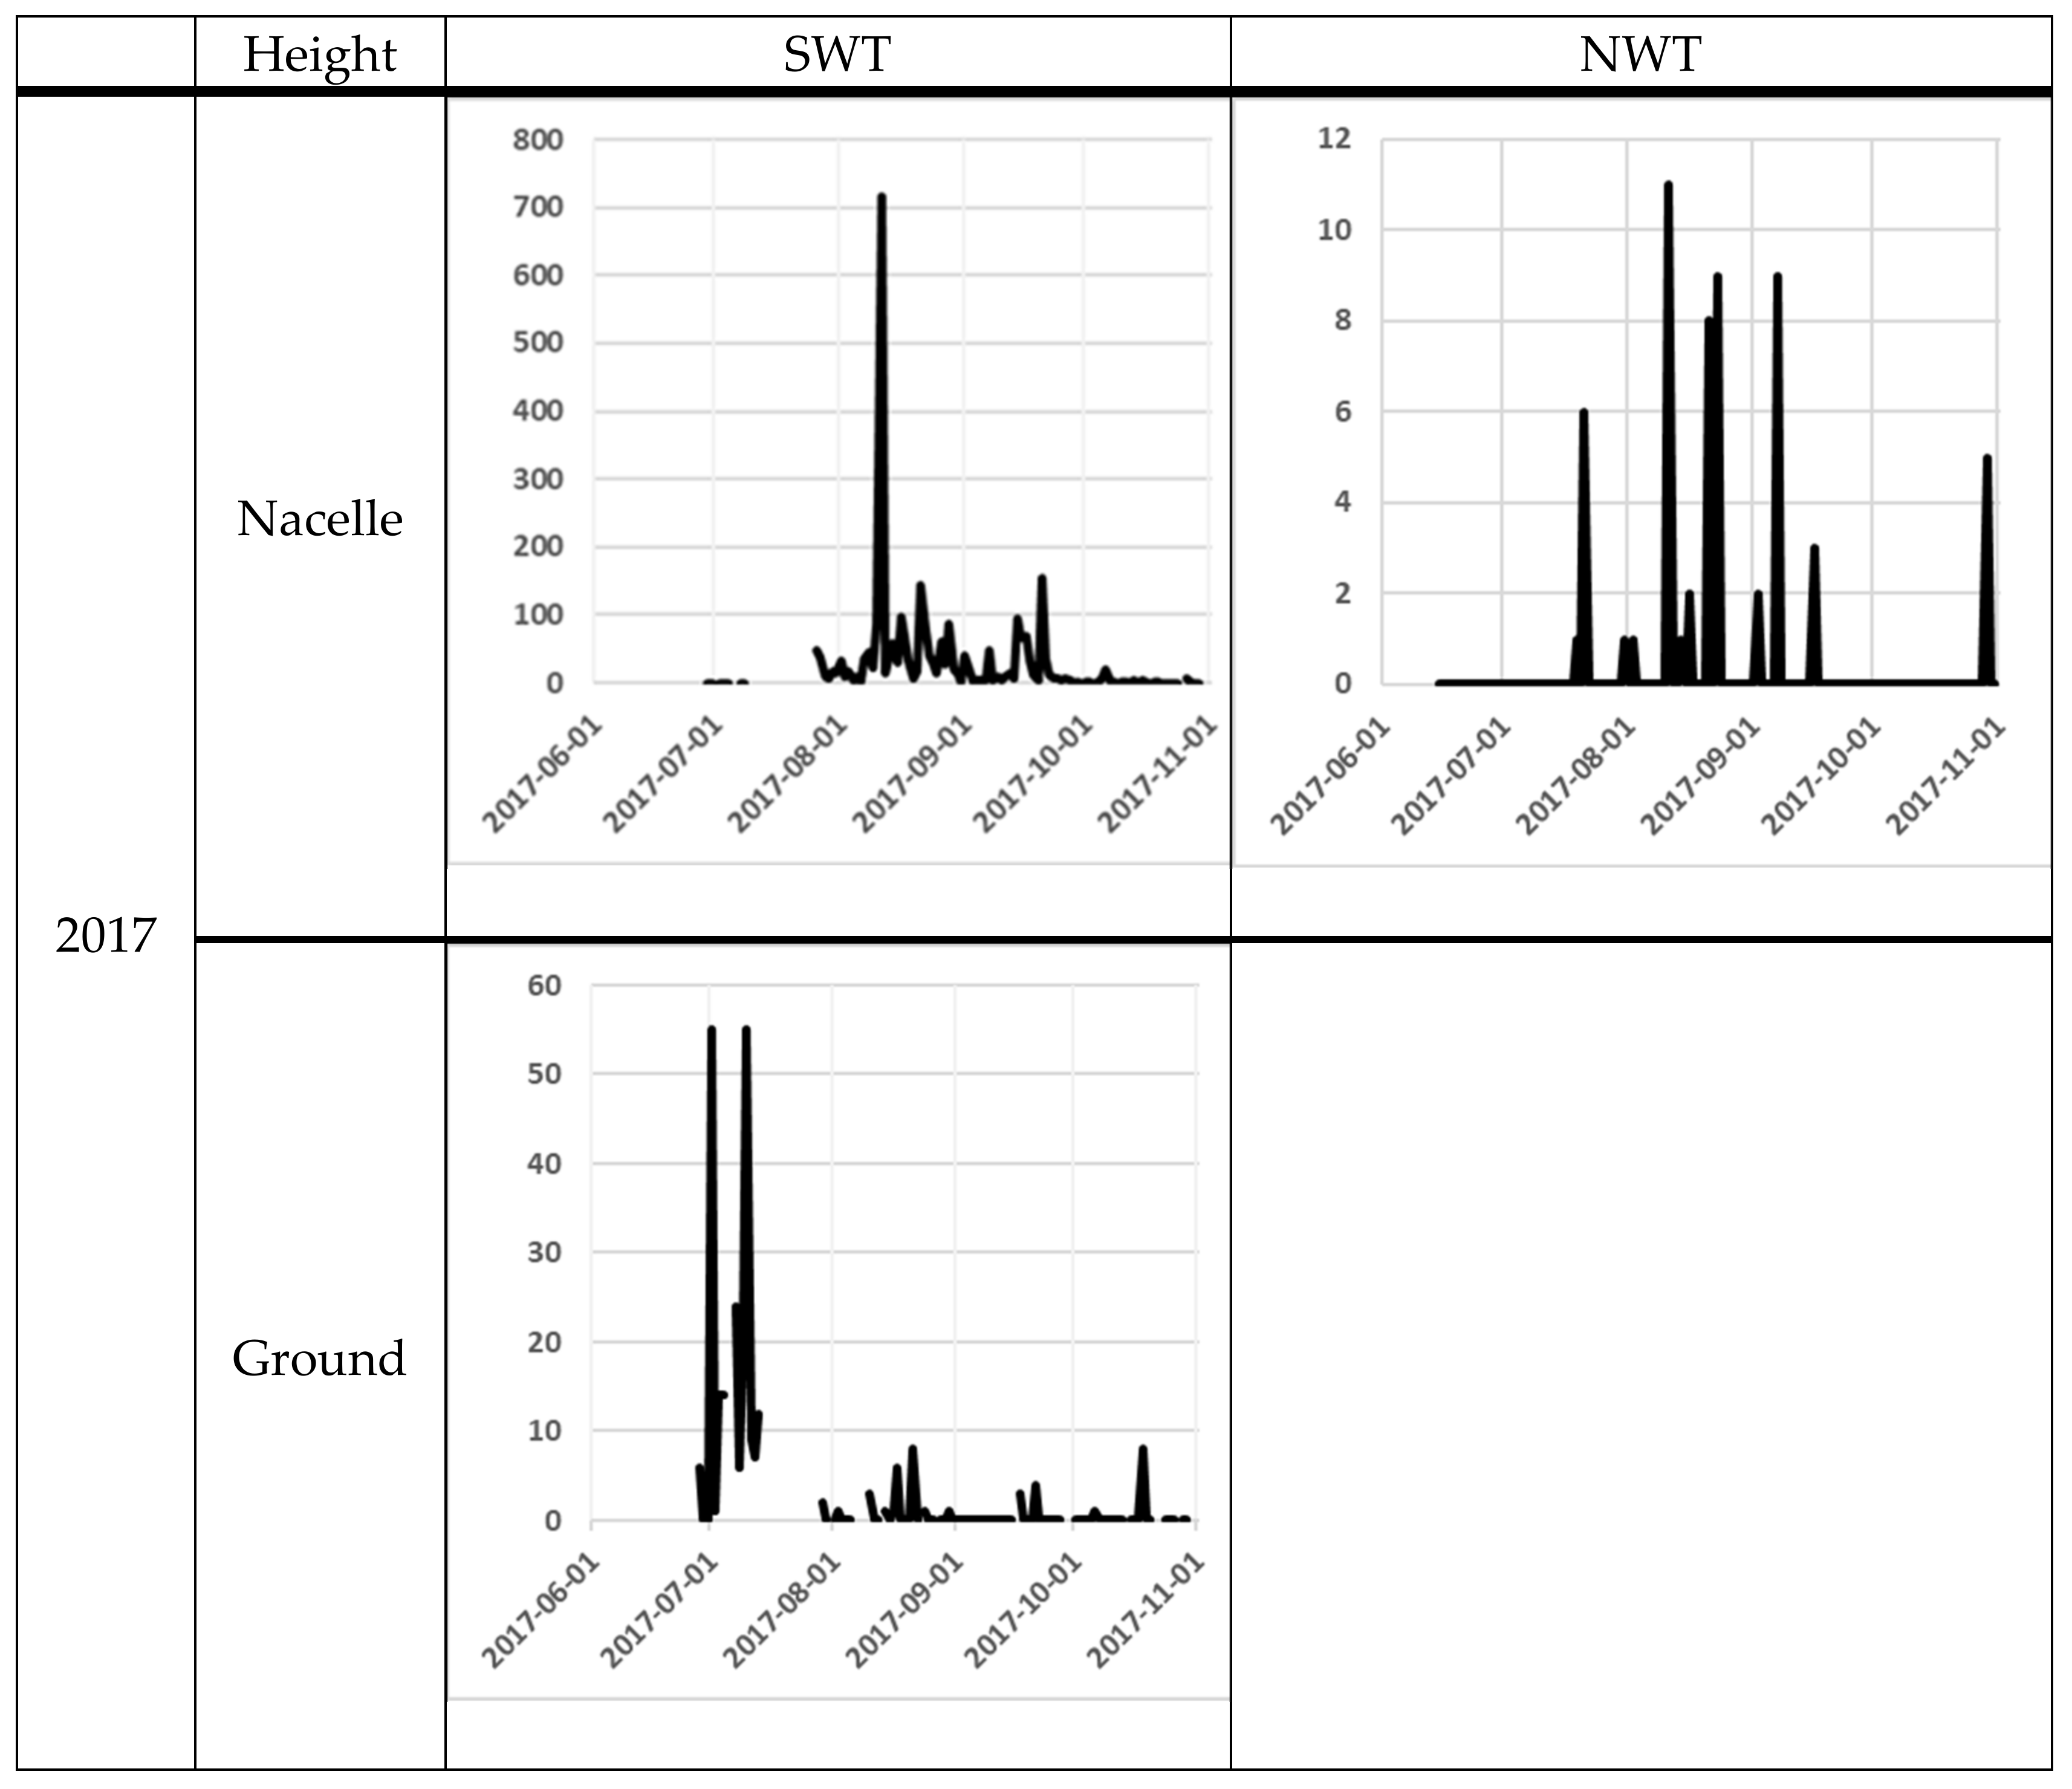
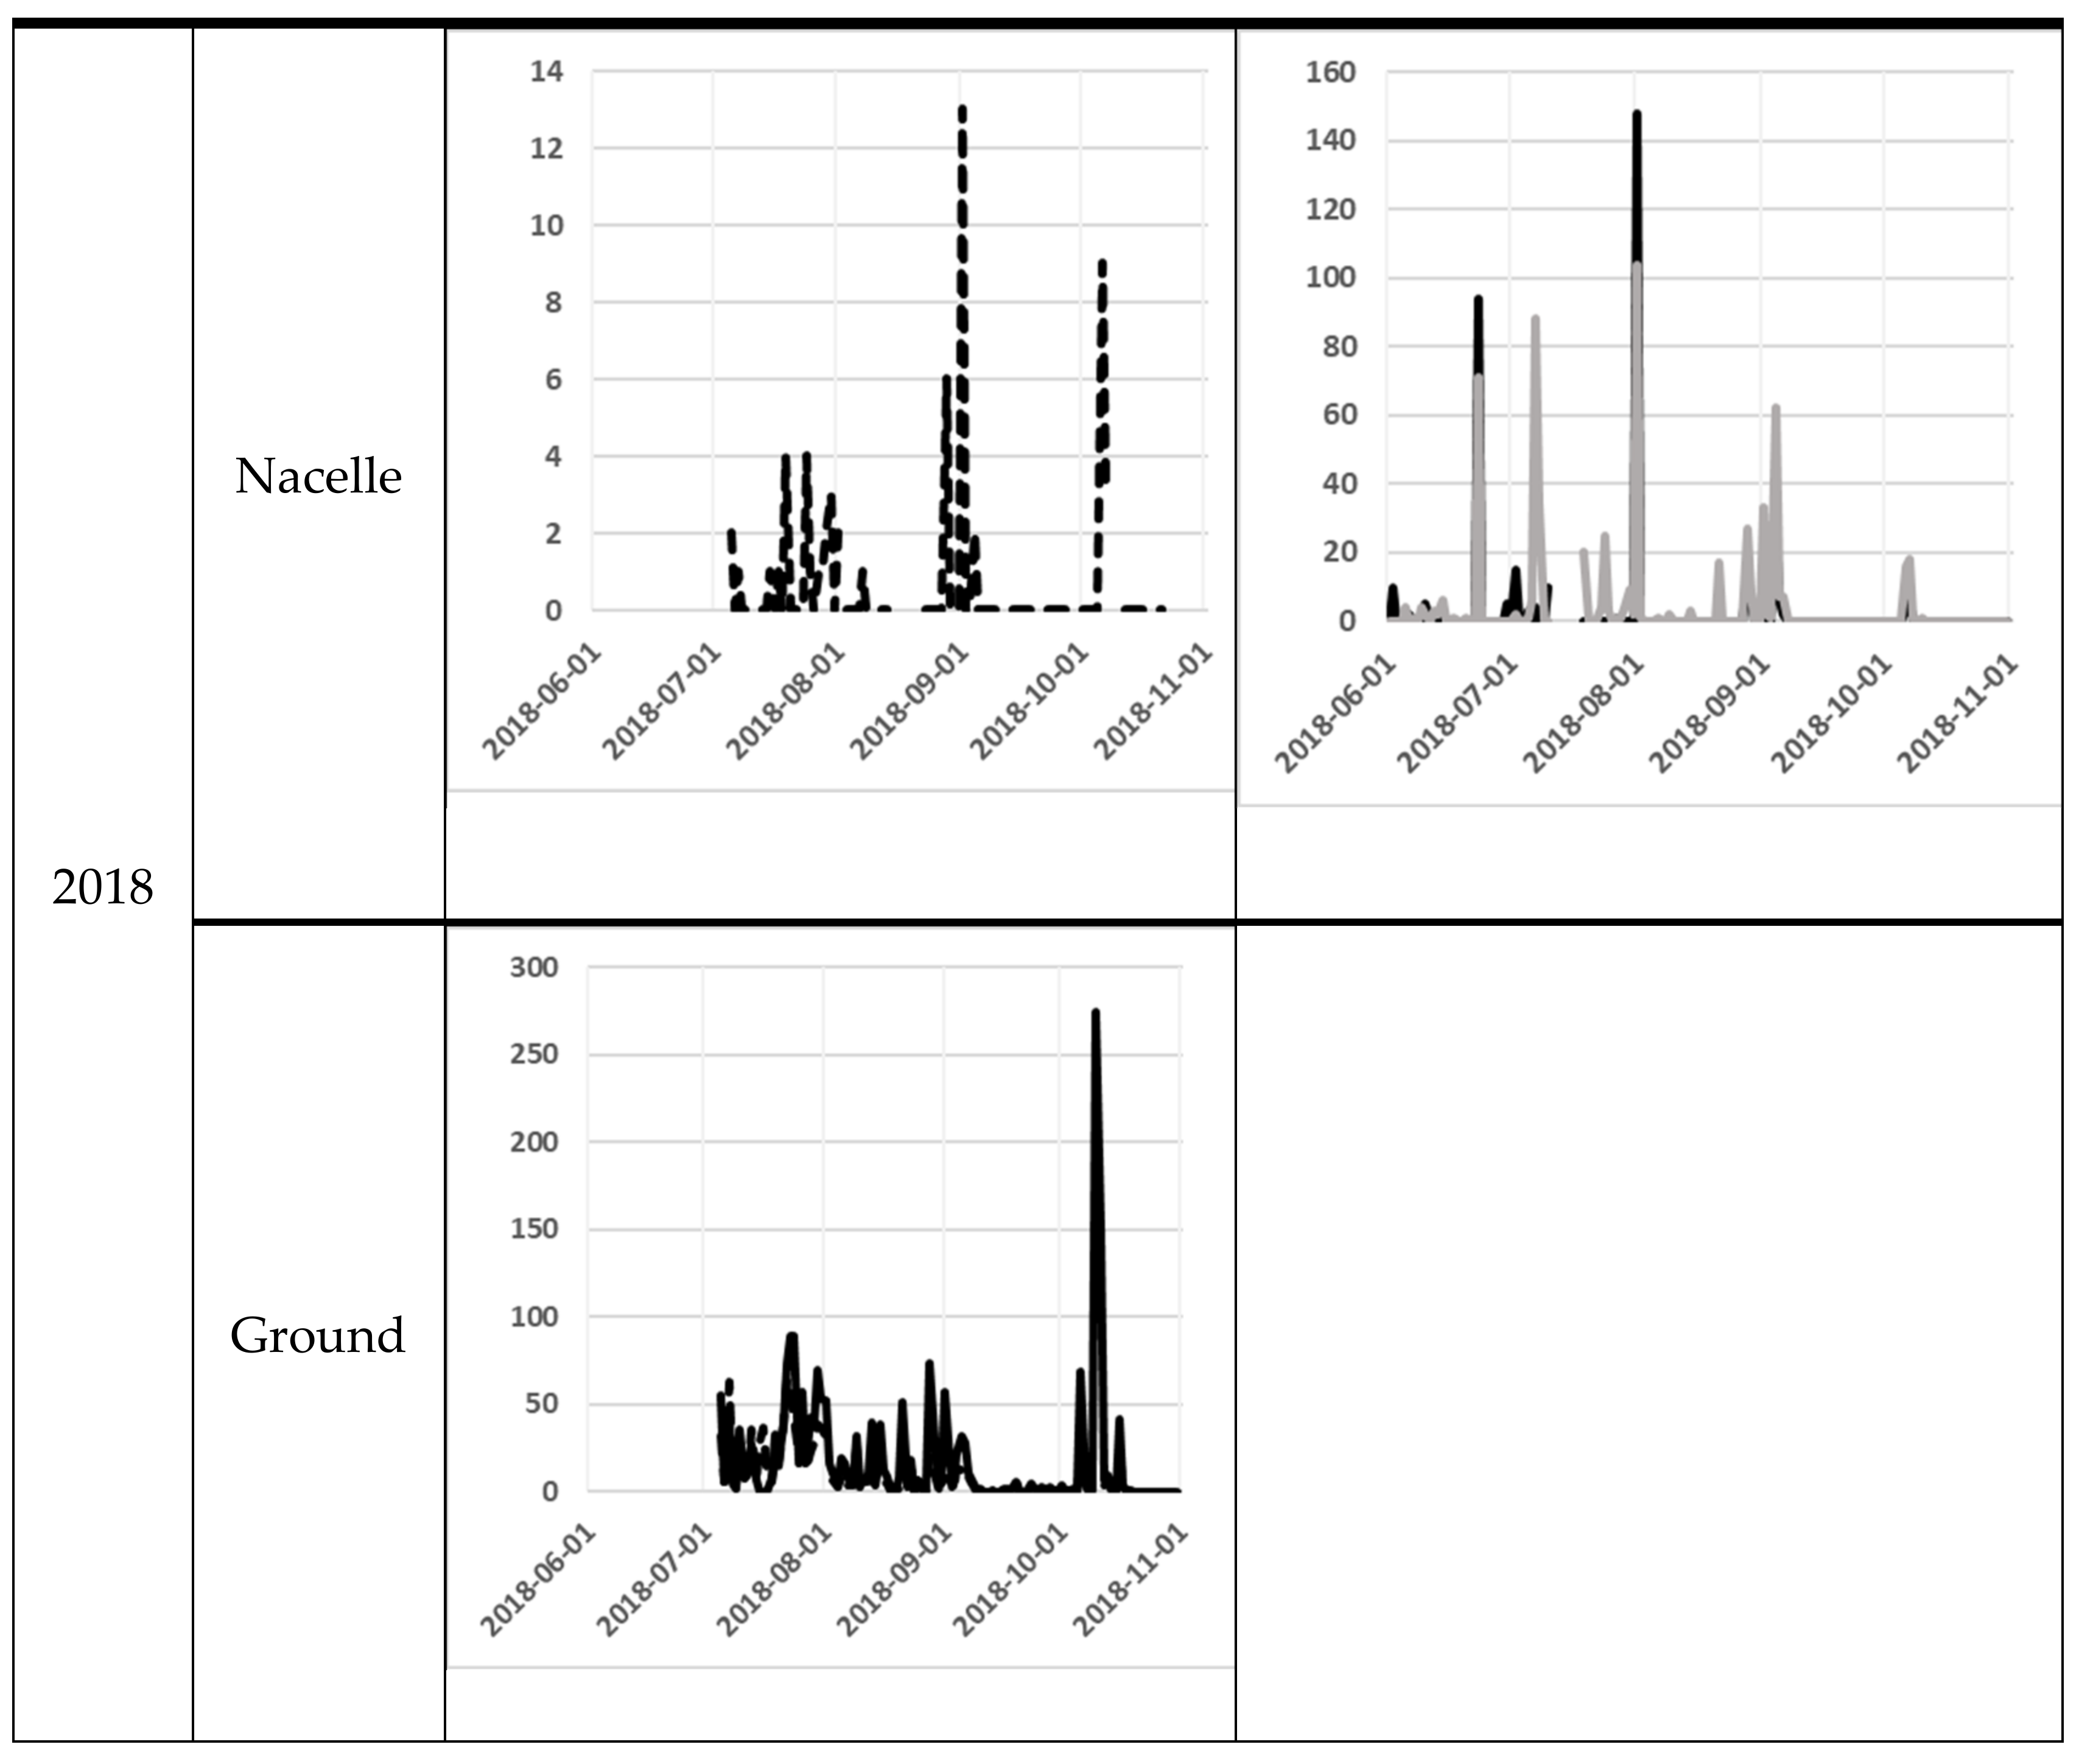
The number of bat passes at nacelle level varied significantly from day to day. One of the most obvious differences was between the 11th and the 12th of August at SWT in 2017, when the number of bat passes varied from 717 to 13 the next night. At ground level, the variation was lower, but from the 9th to the 10th October in 2018, bat activity varied between 1 and 275 bat passes (
Figure 3).
At the nacelle level, high bat activity (more than 50 bat passes per night) occurred on several occasions (
Figure 3). The earliest peak of activity at the nacelle level was observed at the end of June 2018 at the NWT1 and NWT2 and the latest at the end of September 2017 at SWT (
Figure 3). At ground level, the earliest peak of activity was observed at the beginning of July in both 2017 and 2018 at SWT site (note that the recording did not start a long time before the peak of activity). The latest peak of activity at ground level was recorded in mid-October 2018 at the SWT site (
Figure 1).
At SWT site, bat activity was registered at the same time at ground level and nacelle level during 85 nights with Avisoft recorder in 2017 and during 95 nights with D500X in 2018. The number of bat-passes at ground level was not correlated to the number of bat-passes at the nacelle from the dataset from Avisoft from 2017 (Spearman’s rank correlation rs = –0.008, p = 0.94, n = 85 nights). However, when using the dataset from D500X from 2018, there was a significant correlation between bat activity at ground level and nacelle level (Spearman´s rank correlation rs = –0.44, p < 0.01, n = 95 nights).
Bat activity differed significantly at the nacelle height in 2017 between SWT and NWT1 (with 26.1 ± 7.3 bat passes per night at SWT and 0.5 ± 0.2 bat passes at NWT1, Wilcox test = 9279.5,
p-value < 0.01, n = 104 nights). When analysed species by species, the activity of the five main species was also significantly different between SWT and NWT1 at the nacelle height in 2017 (
Table 5). Bat activity at NWT site also differed significantly between NWT1 and NWT2 at nacelle height in 2018 (2.6 ± 1.3 bat passes per night at NWT1 and 4.4 ± 1.3 bat passes per night at NWT2, Wilcox test = 10764,
p-value < 0.01, n = 137 nights). The activity of
E. nilssonii,
V. murinus and
N. noctula also significantly differed between NWT1 and NWT2 at nacelle height in 2018 (
Table 5). However, the activity of
P. pygmaeus did not differ significantly between NWT1 and NWT2 at nacelle height in 2018 (
Table 5).
We compared acoustic data recorded using the D500X and Avisoft units at the SWT site in 2018 (total number of nights when both systems worked = 114). The Pettersson unit recorded a higher number of total acoustic files (including noise files). However, the Avisoft unit recorded a higher total number of files with bats (
Table 1) and recorded a significantly higher mean nightly bat activity (14.8 ± 2.0 bats per night) than the D500X (and 9.6 ± 1.3 bats per night) (Wilcox test for paired data: V = 3201,
p-value <0.01, n = 114 nights). The overall pattern of bat activity per night was similar across detectors and the number of bat passes recorded per night were strongly correlated between detectors (
Figure 3, Spearman rank correlation r
s =−0.83,
p < 0.01, n = 114 nights).
4. Discussion
The importance of wind power as a renewable energy source is increasing, and the impact on bat populations is an urgent problem. Most probably, it will cause population decline for several species, and we need to improve our mitigation efforts considerably [
38]. However, this also requires a better understanding of bat biology.
This study shows there was a correlation between insect abundance and bat activity at the nacelle height of a wind turbine. To our knowledge, this is one of the first studies that simultaneously measured insect abundance and bat activity at the nacelle height during the whole period (July until October) when bats aggregate at the nacelle. In addition, it is the first study using a suction trap at the nacelle. Other recent studies also worked on the interaction between bats and insects at wind turbines [
9,
18,
20,
39,
40]. However, Foo et al. [
18] and Ahlén et al. [
39,
40] did not trap insects at the nacelle height, and Rydell et al. [
20] did not measure bat activity at the nacelle level simultaneously with insect collection. In addition, insects were trapped day and night with glue traps instead of just when bats were active. In the study by Jansson et al. [
9], insect abundance was measured using a laser beam at nacelle height, at the same time as bat activity was measured with an ultrasound detector from the ground. This was done during only a few nights, but still, the result is interesting since they demonstrated how swarms of insects occurred in the evening, and on some occasions, remained after sunset.
In our study, insect abundance at nacelle height was low (compared to the ground, own observations), which is similar to the result of Rydell et al. [
20]. The effect of insect abundance on bat activity was lower than the effects of temperature and wind speed. One possible explanation is that the different taxa were affected differently by insect abundance—
N. noctula,
E. nilssonii, and
V. murinus all increased their activity with increasing insect abundance, whereas
P. pygmaeus and
Myotis spp. were unaffected. Consequently, when we combine the bat observations for all species, the effect of insect abundance is driven primarily by the most common taxa, i.e.,
E. nilssonii,
P. pygmaeus and
Myotis spp. and for two of those taxa, there was no effect of insect abundance. An alternative explanation for bat occurrence at the nacelle level is that low wind speed and high-temperature trigger bat movements, and during these periods, bats may be more likely to explore near the nacelle area [
24]. This means that favourable weather conditions are a stronger predictor of the presence of bats close to the nacelle of wind turbines than is the presence of insects. If this is the case, measures to decrease insect abundance at the wind turbines, e.g., insect aversive colours, will not have any impact on bat activity [
10].
Measuring insect abundance and bat occurrence at nacelle height is associated with several methodological problems [
41]. The insect trap measures insects at only one location on top of the nacelle and it is difficult to determine the optimal place to monitor insect abundance. The ultrasound detectors only measures bat passes, without providing information on the number of individuals. Further, neither the position of the flying bat, nor the display of risky behaviour can be deduced from the recordings. Bats may fly close to the nacelle or far away.
N. noctula and
E. nilssonii may be recorded when flying more than 100 m away (own observations) [
42]. There are also technical limitations. On the one hand, the Avisoft system was much more efficient (given the settings we used) than the D500X. On the other hand, it did not work for some periods and required some support, which might be difficult at a wind farm.
We found a surprisingly high number of species at nacelle-height including
B. barbastellus,
P. auritus and
Myotis spp. Most often, only open-air foragers are considered as having a high risk for collision [
43]. This is mainly based on carcass surveys [
44]. It is possible that low-risk species very seldom visit the nacelle area, or are using a different foraging strategy, which makes them less vulnerable [
42]. The fact that bat abundance at ground level and bat abundance at nacelle height do not always correlate makes it difficult to estimate the risks for bat fatalities at wind turbines. Obviously, this correlation is also lacking at pre-construction sites [
43]. Another important observation is that sometimes, the variation in bat activity between nights, between years, and between different wind turbines might be high. There are suggestions on risky areas for bat collisions, e.g., along coastlines, and more safe areas, e.g., in open areas or some types of forests [
31,
45]. However, this study shows that there might be a large number of bats at nacelle-height also in ”safe areas”.
In total, our observations indicate that predictions on bat activity at wind-power farms are very difficult to make. It highlights the need for long-term (several months) surveys at nacelle level. Though bat behaviour might change when the wind turbines are erected [
46,
47,
48,
49], surveys at nacelle height are probably more correct than those made only at ground level.
Obviously, both the technical systems and the settings are important to be able to achieve recordings with both high sensitivity and low noise. In our case, D500X was more reliable (in terms of the number of nights when it worked), but it was possible to use higher sensitivity on Avisoft due to an efficient noise-reducing filter system, thereby enabling the detection of more bats. We conclude that there is a risk of misjudgements in environmental impact assessments depending on technical systems, and different systems might need different interpretations.
Our results are important in relation to mitigation measurements, and especially stop-regulation based on weather conditions. Rydell et al. [
22] reviewed studies of bat occurrence at nacelle height compared to weather conditions in Sweden and found that 90% of all bat observations were registered when the temperature was >14 °C, and the wind speed <5.8 m/s. In the present study, within these limits, only 53% of the bats would be captured. According to our results, 90% of bat passes were was registered when the temperature was 9 °C, and the wind speed was <8.2 m/s. Our study is only based on measurements at three wind turbines for two years, and therefore not enough to draw general conclusions for stop-regulation. However, this study highlights some of the problems with setting the limits for stop-regulation. The variation in bat activity was high between different nights and wind turbines, and the bat activity was sometimes high, even in windy conditions. An alternative to stop-regulation only based on weather conditions would be to use stop-regulation based on both real-time bat activity and weather conditions [
29].


