Article

Endocrine Fertility Parameters—Genomic Background and Their Genetic Relationship to Boar Taint in German Landrace and Large White

by
Ines Brinke
1,
Christine Große-Brinkhaus
1,*,
Katharina Roth
1,
Maren Julia Pröll-Cornelissen
1,2,
Sebastian Klein
2,
Karl Schellander
1 and
Ernst Tholen
1
1
Institute of Animal Science, University of Bonn, 53115 Bonn, Germany
2
Association for Bioeconomy Research (FBF e.V.), Adenauerallee 174, 53113 Bonn, Germany
*
Author to whom correspondence should be addressed.
Animals 2021, 11(1), 231; https://doi.org/10.3390/ani11010231
Submission received: 17 November 2020 / Revised: 6 January 2021 / Accepted: 13 January 2021 / Published: 18 January 2021

Abstract

:

Simple Summary

Breeding against boar taint compounds androstenone and skatole can be an efficient alternative for surgical castration of young piglets during their first week of life to avoid boar taint. Physiological links of androstenone to steroid hormones in the synthesis pathway are documented and they have to be analyzed for their genetic effects on reproduction and fertility. While using boar taint and hormone data from Landrace and Large White pigs (commercial nucleus populations and herd book populations), the effects of breeding against androstenone on fertility were evaluated. Moreover, the genetic foundation of the chosen hormones’ testosterone, 17β-estradiol, luteinizing hormone, follicle-stimulating hormone, and progesterone was analyzed and then checked for possible pleiotropic effects with boar taint compounds. The results showed consistent unfavorable side effects of breeding against androstenone on testosterone and 17β-estradiol in both breeds. The other hormones showed contrary results regarding unfavorable relationships between boar taint and endocrine fertility parameters. The genetic foundation showed a high potential of breeding against boar taint but the impact on fertility potential should be supervised.

Abstract

The surgical castration of young male piglets without anesthesia is no longer allowed in Germany from 2021. One alternative is breeding against boar taint, but shared synthesis pathways of androstenone (AND) and several endocrine fertility parameters (EFP) indicate a risk of decreasing fertility. The objective of this study was to investigate the genetic background between AND, skatole (SKA), and six EFP in purebred Landrace (LR) and Large White (LW) populations. The animals were clustered according to their genetic relatedness because of their different origins. Estimated heritabilities (h2) of AND and SKA ranged between 0.52 and 0.34 in LR and LW. For EFP, h2 differed between the breeds except for follicle-stimulating hormone (FSH) (h2: 0.28–0.37). Both of the breeds showed unfavorable relationships between AND and testosterone, 17-β estradiol, and FSH. The genetic relationships (rg) between SKA and EFP differed between the breeds. A genome-wide association analysis revealed 48 significant associations and confirmed a region for SKA on Sus Scrofa chromosome (SSC) 14. For EFP, the results differed between the clusters. In conclusion, rg partly confirmed physiologically expected antagonisms between AND and EFP. Particular attention should be spent on fertility traits that are based on EFP when breeding against boar taint to balance the genetic progress in both of the trait complexes.

1. Introduction

The breeding objectives of most pig breeding organizations try to balance economically important production, reproduction, and fitness traits, including animal welfare and meat quality aspects. In the past (<2010), these breeding goals were dominated by traits, like fat and carcass composition characteristics, as well as litter size [1]. As a consequence of intensive discussion with society and consumers, increased attention has recently been paid to animal welfare aspects. This leads to changes in the breeding objective in favor of traits, like prenatal survival, vitality, uniformity of the litter, and robustness, which are becoming as important as litter size [1].
According to the German animal protection law, the castration of piglets without anesthesia is banned from the year 2021 [2]. Because of this legal regulation, the fattening of entire boars has been an attractive alternative, not only because of animal welfare reasons, but also because of improved sustainability of pig production regarding feed conversion rate, carcass composition [3], and carbon footprint [4]. However, piglets were castrated because of the risk of boar taint, an odorous smell of heated pork meat, due to the onset of puberty. In order to lower the hazard of tainted carcasses, some breeding organizations have extended their performance recording scheme and their breeding goals by boar taint traits. Some of the main causes for the occurrence of boar taint are the sex steroid hormone AND, which is built in the Leydig cells in the testis, and SKA, which is a product of degradation processes of the amino acid tryptophan in the colon [5]. Whereas the production of AND is initiated by puberty [6] and it is mainly affected by genetics, the production of SKA is less determined by genetics but more affected by management and nutrition [5,7,8,9]. Although the origin of these compounds is quite different, there is a moderate positive relationship (genetic correlation (rg) = 0.27−0.57 [10,11,12,13]) between AND and SKA concentration in backfat. Doran et al. [14] explained this by the decreased degradation of SKA in the liver metabolism during the presence of a high AND concentration.
For a sustainable prevention of boar taint, breeding against the boar taint compounds is one suitable alternative. Before implementing AND and SKA in selection strategies, possible interactions with other trait complexes, like fertility, have to be investigated in order to avoid loss of breeding progress. Selection for boar taint might have consequences on paternal as well as on maternal fertility. Along with direct reproduction traits, like number of piglets born alive, hormone profiles of sows are a valuable and precise source of information for maternal fertility. In this regard, estimated rg between hormones of the sow as an indicator of maternal fertility and boar taint are useful for characterizing the consequences of selection against boar taint. Previous studies [15,16,17] showed contrary results regarding the genetic interaction between boar taint and male/female fertility. Until now, an impairment of the previous breeding progress in the reproduction traits could not be excluded, due to the fact that steroid hormones and AND are built in the same synthesis pathway of the steroidogenesis. Nevertheless, some studies are based on routinely collected traits, like litter size from commercial breeding organizations, which might not allow intensive insight into the linked hormonal regulation of boar taint, fertility, and robustness.
In order to uncover this complex regulation, we have recorded the hormone profiles of sows and boars that originate from maternal breeding lines of commercial breeding organizations. We focused on the relationship between boar taint compounds and the synthesis of steroid hormones due to the shared synthesis pathway of AND and steroid hormones linked to reproduction [18,19]. Therefore, AND and SKA, as well as testosterone, estradiol, luteinizing hormone (LH), follicle-stimulating hormone (FSH), progesterone, and cortisol were analyzed, due to their relatedness to boar taint or male/female fertility and robustness. The objective of this study was to investigate the possible unfavorable genetic relationships between boar taint and the six steroid hormones by variance component estimation (VCE). Additionally, the quantitative trait loci (QTL) for these traits should be identified in male and female Landrace (LR) and Large White (LW) populations from commercial breeding and herd book organizations in order to clarify possible pleiotropic genetic backgrounds.

2. Materials and Methods

2.1. Phenotypes

All of the phenotypes that are related to boar taint compounds or hormone profiles were recorded within the LR and LW nucleus populations of a commercial breeding organization (C) and a consortium of four herd book organizations (H), respectively. In the next sections, these data sets were designated as LR_C, LW_C (commercial breeding organization), and LR_H, LW_H (herd book organizations). For all animals, pedigree information was available up to 15 generations.

2.2. Boar Taint

A total of 3775 boars were selected within the LR and LW nucleus population of both breeding organizations (C, H). These boars should cover the genetic variability of the LR and LW populations and they were on-station performance tested. LR_C/LW_C boars (n = 1392/1377) were slaughtered at a constant age (~160 days), LR_H/LW_H boars (n = 744/262) at a constant weight (LR_H: 93.4 kg, LW_H: 92.6 kg) in different commercial, EU-certificated abattoirs that were connected to the participating breeding organizations. Adipose tissue samples from these boars were collected from the neck area of the carcasses 24 h after slaughtering and they were stored at −20 °C until analysis. AND and SKA concentration in adipose tissue was analyzed in all of the samples using a standardized stable isotope dilution analysis-headspace solid-phase microextraction-gas chromatography/mass spectrometry (SIDA-HSPM-GC/MS) [20]. Concentrations were log-transformed for further analyses because of the skewness of AND and SKA.

2.3. Hormone Profiling

The blood collection was performed in accordance with an approval of the German animal protection law and the regulations for the use of animals (reference number: 84-02.04.2016.A541). The samples were taken from a subset of 500 full-sib pairs (male and female) almost equally distributed across C (n = 252) and H (n = 248). Full-sib pairs consisted of one stationary tested boar out of the boar dataset mentioned above and one sister. Blood samples in female pigs were collected at farms at a live weight of 65 to 75 kg (126.37 days on average ± 13.39). This weight range was chosen in order to characterize the hormone status of the sows before puberty. With the same motivation, male pigs were blood sampled at the station one week before slaughter (164.81 days on average ± 10.7).
For blood collection, animals were fixed (<1.5 min) and approximately 10 mL of blood was taken from the jugular vein. After clotting at room temperature, the serum was separated from each blood sample by centrifugation at 1500× g for 10 min. The serum was stored at −80 °C until assay.
Concentrations of luteinizing hormone (LH) and FSH were measured while using competitive ELISA Kits (Pig Follicle Stimulating Hormone (FSH) ELISA Kit; Luteinizing Hormone (LH) ELISA Kit, Abbexa Ltd., Cambridge, UK). The minimum detectable concentrations while using these assays were 0.469 ng/mL for LH and 14.1 ng/mL for FSH. The blood samples from male animals were diluted to 1:5 for measurements of LH, according to the results of preliminary tests. All of the blood samples (from male and female animals) were diluted to 1:10 for measurements of FSH. Cortisol (CORT), progesterone (PROG), 17-β-estradiol (EST), and testosterone (TEST) concentrations were measured while using a Multi-Species Hormone Magnetic Bead Panel (MSHMAG-21K-04 Multi-Species Mag Panel, Merck Chemicals GmbH, Darmstadt, Germany). The minimum detectable concentrations using this assay were 0.17 ng/mL for CORT, 0.14 ng/mL for PROG, 0.01 ng/mL for EST, and 0.08 ng/mL for TEST. All of the values under the sensitivity threshold (censored data) were replaced by half of the minimum detectable value, as described by Hornung and Reed [21]. Measurements of PROG for both sexes were removed for further analyses due to the high number of animals with censored data. All of the analyses were analyzed twice. Samples with an intra-variation coefficient (intra-CV) > 30% were excluded from further analyses due to the quality standards of the corresponding analysis protocols. Details on the number of investigated animals with hormone profiles per breed and sex can be found in the results section. The resulting concentrations were log-transformed due to their skewed distribution. A control sample was run on every plate in order to control the measurement quality. It consists of pooled blood serum samples from seven full-sib boars of one litter. The inter-assay coefficients of variation for the control sample varied between 16 and 20%, depending on the analyzed hormone.

2.4. Statistical Analyses

Variance components were estimated with a multivariate approach while using WOMBAT [22] across and within the breeds LR and LW. The analyzed traits were AND, SKA, CORT, EST, TEST, LH, and FSH. In step 1, the hormone profiles of male and female animals were treated as different traits. This can be justified by the different ages at blood sampling and the resulting different stages of maturation of both sexes. In the case of genetic correlation between corresponding hormones of sows and boars close to one we were motivated to see hormones of both sexes as identical traits (step 2). Step 1 was only possible for animals of the LR population, as the sample size of the LW population was too small to analyze the data by using the means of a sex-specific multi-trait model.
For each hormone in LR, the analysis was performed in a four-trait model, which combined pedigree information with the boar taint compounds AND and SKA and one hormone concentration, measured in males and females, respectively. Variance components for AND and SKA were estimated using the following polygenetic animal model:
y   =   X ( 1 ) β   +   Z α   +   Zu   +   e
where y contains the observed traits. The generalized linear mixed model was fitted to AND and SKA and it comprised the fixed environmental effect organization-year-month of slaughter (82 levels in LR, 59 levels in LW) in vector β and animal and litter as random effects in vector α and u. Weight and age at slaughter were handled as covariates (Model 1). For the hormone profiles the fixed effects of the organization-year season of blood sampling (21 levels in LR, 9 levels in LW) and plate were considered. The animal (α) and litter (u) were implemented as random effects.
The age at blood sampling was used as a covariate. X and Z were handled as the incidence matrices.
Taking the size of the dataset and the high standard errors into account, these correlations are only a first rough indicator that a large proportion of overlapping genes are involved in the expression of corresponding hormones in both sexes. Accepting these limitations, further analyses for both breeds were performed in a full multiple seven-trait trait model, including AND and SKA (following Model 1) as well as all hormone concentrations following Model 2, including sex as a fixed effect.

2.5. Genotype Data

All of the phenotyped sows and boars (LR: 2276 LR, LW: 1694) were genotyped while using the Illumina PorcineSNP60 BeadChip (Illumina, San Diego, CA, USA). These data were used to perform a univariate genome-wide association analysis (GWAS) for analyzed hormones AND, SKA, CORT, EST, TEST, LH, and FSH.
Single nucleotide polymorphism(s) (SNPs) and individuals with a call-rate of less than 95% and SNPs with a minor allele frequency (MAF) of less than 5% were excluded from further analysis. The quality control was conducted within the GenABEL package [23]. The number of genotyped animals varied per trait and sex due to the removal measured hormone phenotypes with a high intra-CV (>30%), as shown in Table 1.
Within the GWAS, log-transformed concentrations of the analyzed hormones, AND, and SKA were regarded as phenotypes. Genetic distances were displayed by creating a genomic relationship matrix within the R-package GenABEL [23]. Based on these visualized genetic distances, GWAS was separately performed within clusters. A small number of animals (n = 20) from the boar taint dataset could not be clearly classified into a cluster and they were excluded from further analyses.
Based on the results of the VCE, male and female hormones were analyzed as identical traits. An association test was performed within the R-package GenABEL [23]. The hormone data were corrected for sex and organization-year-season of blood sampling as fixed effects and age of blood sampling as covariate. The boar taint data were analyzed under consideration of the fixed effects that were described by Model 1.
Population stratification ranged from 1.009 to 1.72, depending on trait and cluster, so that applying genomic control (GC), as described by Devlin and Roeder [24], was sufficient to correct for possible population stratification while using the following formula:
T corrected   =   T 2 λ
whereas T2 is the empirical test statistic for each locus by a fast score test or t-test and λ is the value of population stratification. The resulting p-values were transformed by Bonferroni correction in order to avoid error accumulation by multiple testing. Markers with an adjusted p-value < 0.05 were handled as genome-wide/chromosome-wide significant. Additionally, the variance explained by the single SNP was calculated according to the transformation of the student’s t-distribution into a z-distribution [25] while using the following formula:
Var %   =   χ 1 df 2 N     2   +   χ 1 df 2
whereas χ 1 df 2 is the test statistic of each SNP from GWAS and N the number of animals.
The locations of SNPs for all analyzed traits are in accordance with the recent pig genome sequence SusScrofa 11.1, and the variants are identified according to Ensembl release 95 [26].

3. Results

3.1. Descriptive Summary

The number of animals, overall means, and standard deviations of log-transformed phenotypes are shown in Table 2, for LR and LW, separately.
Raw phenotypes can be found in the additional Table S1. Boars of the datasets LR_C and LW_C were slaughtered at an average age of 163.5 ± 5.0 days in LR (165.2 ± 5.7 days in LW) and an average slaughter weight of 95.1 ± 9.5 kg in LR (89.0 ± 8.8 kg in LW). Boars of the datasets LR_H and LW_H were slaughtered at an age of 175.1 ± 13.3 days in LR (174.1 ± 13.1 days in LW) and weight of 93.4 ± 6.5 kg in LR (92.6 ± 5.8 kg in LW), on average.
The blood samples for hormone profiling from gilts and boars were taken at an average age of 126.37 days (±13.39) from gilts and at an average age of 164.81 days (±10.70) from boars, respectively.
The average CORT concentrations in LW animals were higher than in LR animals and higher in males than in females. The average TEST concentrations of male animals were clearly higher than in female animals. In general, the LR dataset showed higher TEST concentrations than the LW dataset. The concentrations of EST in female animals did not differ between the breeds, which is in contrast to the male animals were LR animals showed higher concentrations than LW animals. The results of LH and FSH did not show any clear difference between the breeds. Whereas, concentrations of LH were up to 2.5 times higher in female animals, FSH concentrations were lower in female animals than in male animals.
Regarding the boar taint compounds boars from the LR population showed higher concentration of AND and SKA, as compared to the boars from the LW population.

3.2. Variance Component Estimation

In general, estimated heritabilities (h2), phenotypic (rp), and genetic (rg) correlations are based on the log-transformed values of all the parameters and they were not transformed in its original scale. An overview of all the results of the VCE can be found in Table 3.
Step 1 of the VCE showed moderate to high rg between male and female hormone concentrations in LR in a range from 0.40 to 0.91 (see Table 4).
Therefore, further analyses for both breeds were performed in a full multiple seven-trait trait model, including AND and SKA, as well as all hormone concentrations following Model 1, including sex as a fixed effect, as described in the material and methods section.
Variance component estimation showed moderate to high h2 of 0.52 for AND in LR (h2 = 0.44 in LW) and 0.40 for SKA in LR (h2 = 0.34 in LW) (Table 3). Correlations between AND and SKA were higher on the genetic scale in LW (rg = 0.57) than in LR (rg = 0.42), whereas, on the phenotypic scale, it was vice versa (rp = 0.34 in LR, rp = 0.27 in LW). The h2 for CORT was 0.11 in LR and 0.35 in LW. The genetic correlation between CORT and other sex steroid hormones was mostly different within the LR and LW breed. For example, the rg between CORT and TEST was −0.35 in LR, but only −0.03 in LW. Genetic correlations between CORT and EST and CORT and FSH in LR were close to zero, whereas, in LW, these relations were moderate to high negative between −0.26 and −0.57. Consequentially, a lower concentration of CORT would possibly lead to a higher EST and a higher FSH concentration in LW but not in LR.
Regarding the rg between CORT and LH similar estimates were found in both breeds (rg = −0.27 in LR, rg = −0.42 in LW). The negative sign indicates that breeding against CORT concentrations would lead to increasing LH concentrations in both of the breeds.
Heritability estimates for steroid hormones were found in a range of 0.03 and 0.42 and they were mostly different within the breeds LR and LW. Among the LR and LW breed, the estimated h2 for TEST, EST, and LH were clearly distinguishable. In LR, h2 for TEST and EST was small (h2 = 0.03 and h2 = 0.09), but, in LW, these estimates were moderate to high (h2 = 0.23 and h2 = 0.42). A converse breed difference was found for LH, where the h2 in LR (h2 = 0.28) was seven times higher than in LW (h2 = 0.04). For FSH, h2 was on a moderate level in both of the breeds (LR: h2 = 0.28, LW: h2 = 0.37).
Genetic correlations between the steroid hormones were consistent between the breeds and they confirmed the physiological expectation of their common regulation (Table 3).
Regarding the objective of our study, rg between boar taint compounds and CORT, as well as steroid hormones, are of major interest.
rg between AND and CORT was low to moderate negative in LR (rg = −0.18) and low in LW (rg = 0.08), as shown in Table 3. Consequently, breeding against AND would result in a small increase in CORT concentration in LR, whereas the effect in LW would be zero. A more distinct breed difference was observed for the rg between SKA and CORT, which was negative (rg = −0.21) in LR, but moderate positive in LW (rg = 0.38).
The AND and TEST as well as SKA and TEST were highly positive correlated to each other in both breeds. The rg between AND and TEST was 0.62 in LR and 0.83 in LW. A similar high positive rg (=0.93) was estimated between SKA and TEST in LR, whereas this relationship was on a comparably lower level in the LW breed (rg = 0.27). Hence, a decrease in AND and/or SKA concentration would result in a lower concentration of TEST in both breeds.
The estimated rg between AND and EST slightly differed between both of the breeds (rg = 0.49 in LR, rg = 0.46 in LW). The rg between SKA and EST was very high in LR (rg = 0.95), but, in contrast to that, the estimate of this relationship in LW did only differ slightly from zero (rg = 0.03).
Regarding the rg between AND and LH, similar trends were observed for LR and LW with low to moderate positive relations (rg = 0.11 in LR, rg = 0.32 in LW). The genetic relationships between SKA and LH are different for both breeds. In LR, a rg of −0.16 was estimated; in LW, it was the opposite, with an estimated rg of 0.45.
For AND and FSH, a moderate rg of 0.30 was estimated for both of the breeds. In contrast to that, rg between SKA and FSH were on a low level, ranging between 0.01 (LW) and −0.14 (LR).

3.3. GWAS

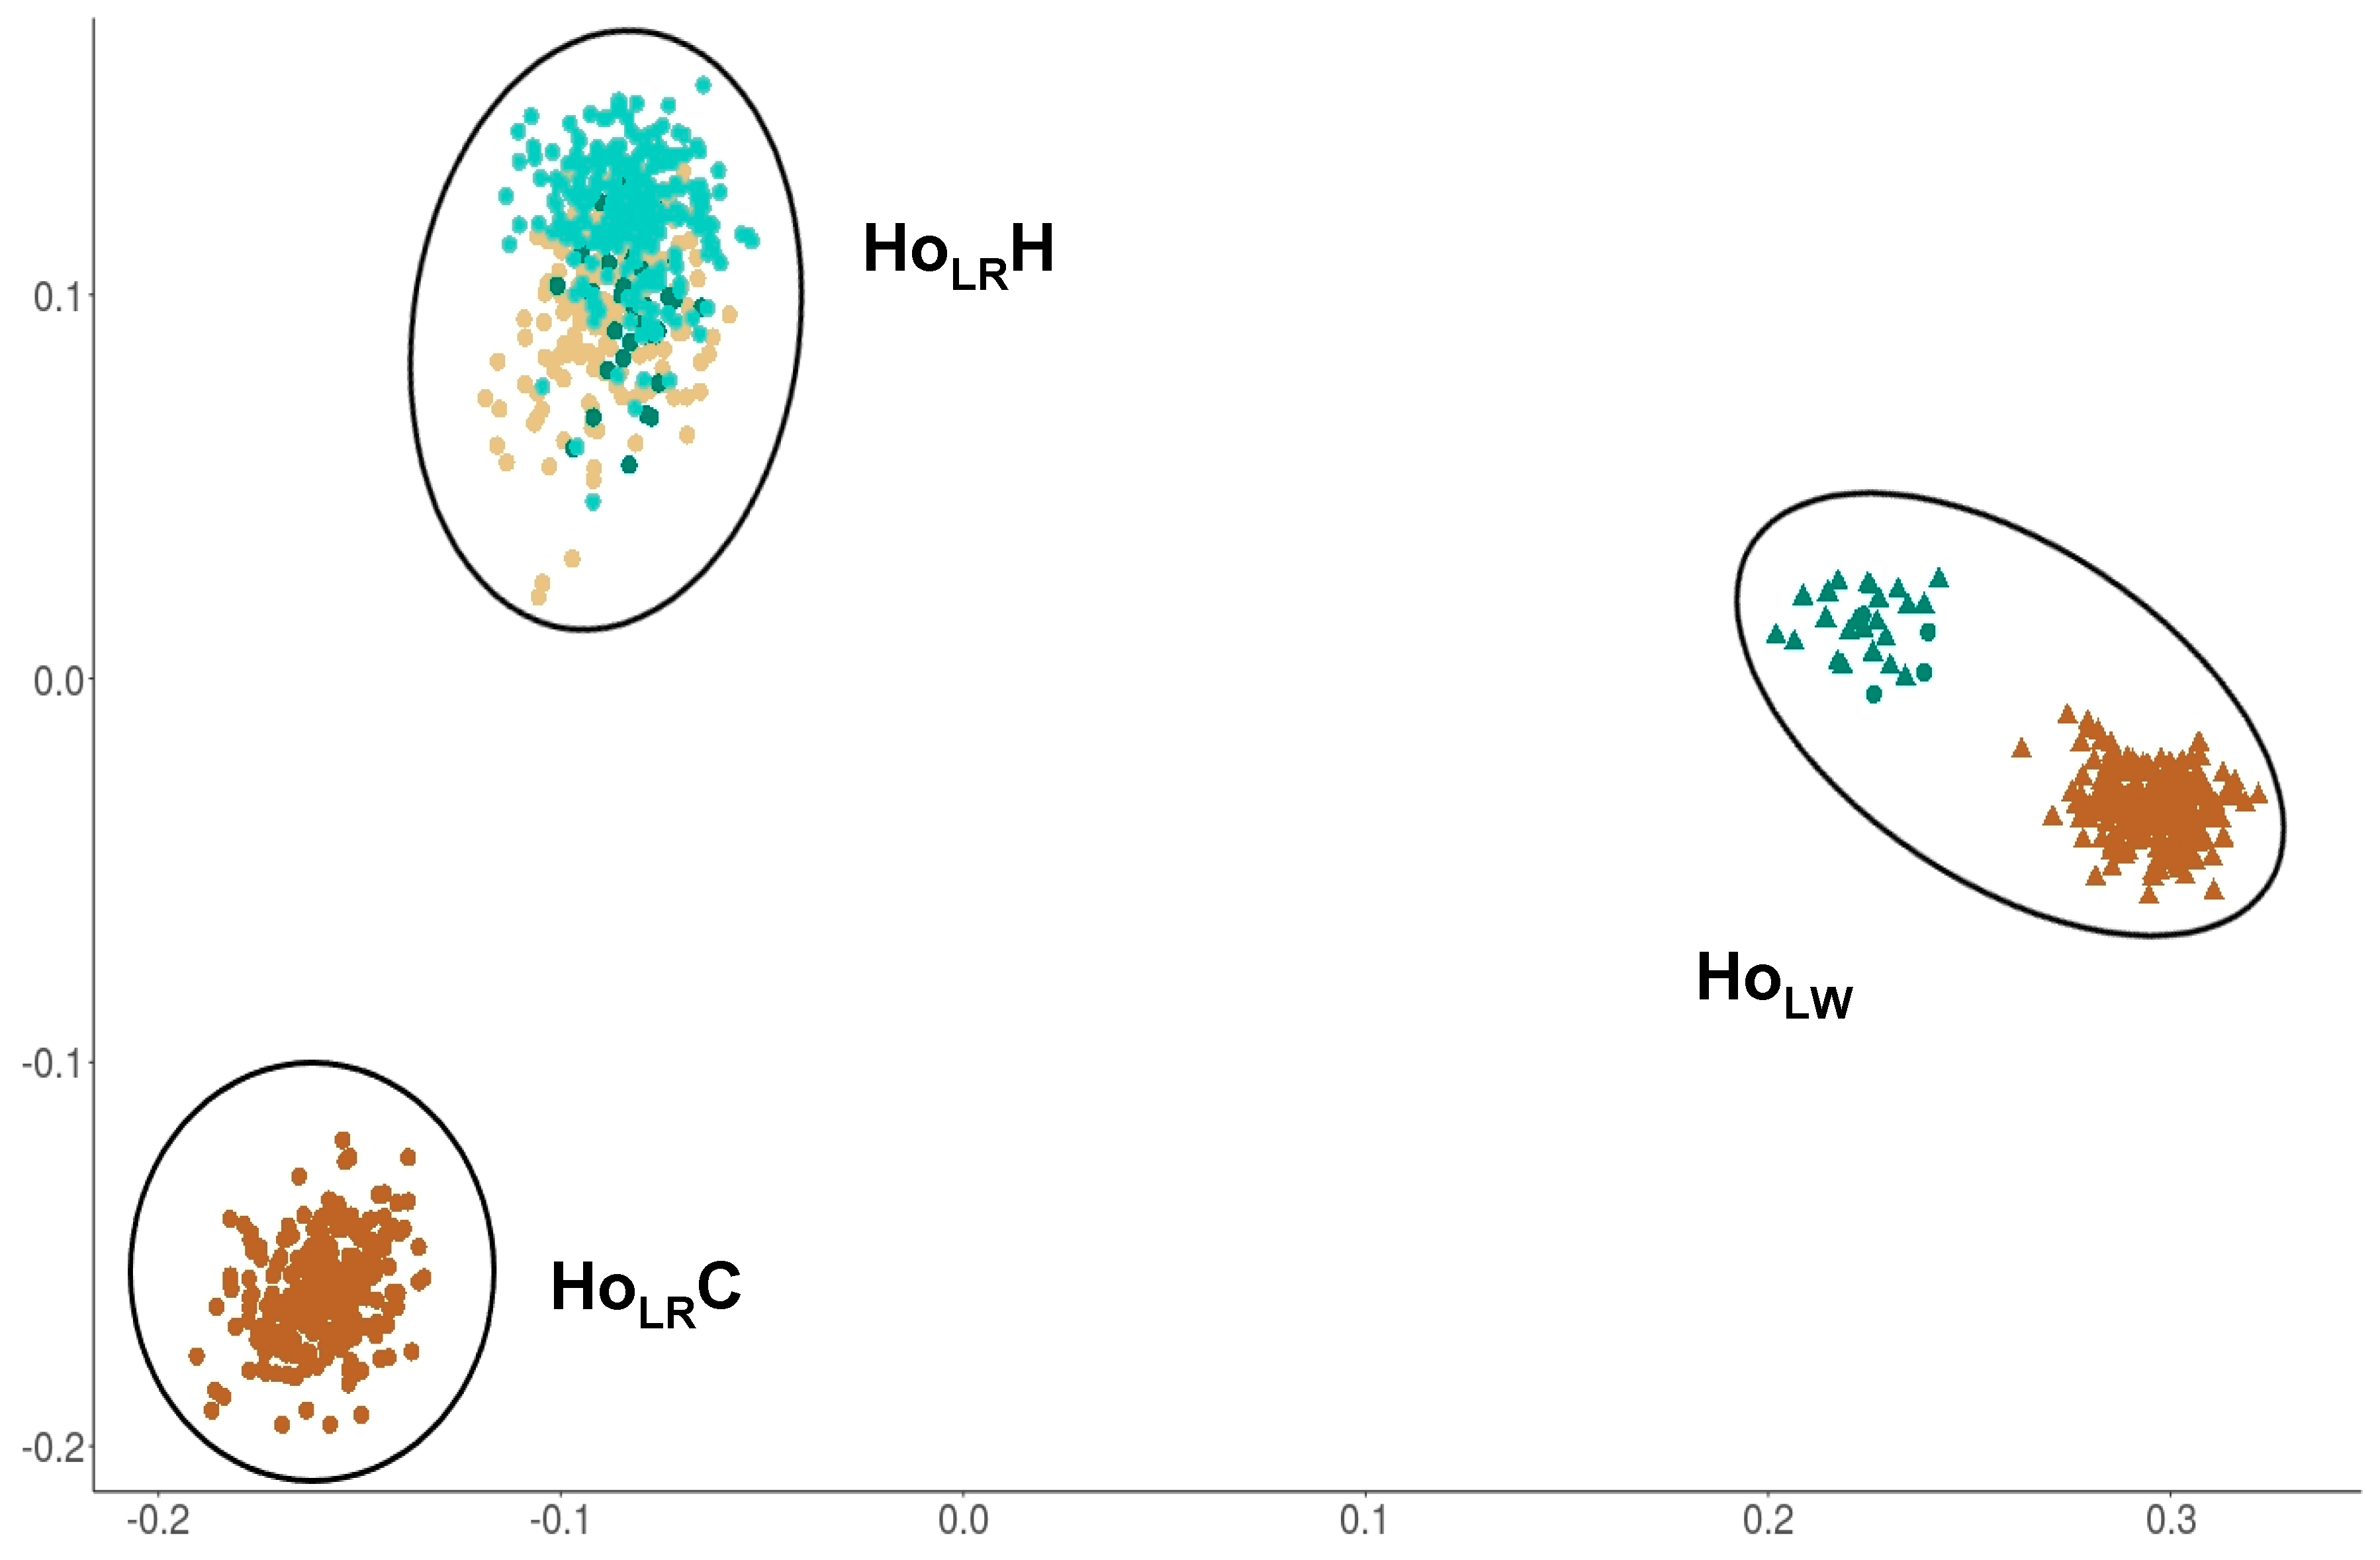
3.3.1. Genetic Structure

The visualization of the genetic relationships of all animals showed three different clusters for the hormone dataset (Figure 1). The clusters contain LR animals from the commercial breeding organization (HoLRC), LR animals from the herd book organizations (HoLRH), and LW animals from all organizations (HoLW), whereas the latter one also contains misclassified animals. The number of animals per cluster were 254 animals in HoLRC, 447 animals in HoLRH and 272 animals in HoLW.
For the boar taint dataset, the visualization of the genetic relationships of all animals showed four different clusters (Figure 2). Twenty animals were removed from further analyses, as they cannot be clearly classified into a cluster. Clusters contain LR animals from the commercial breeding organization (BTLRC), LW animals from the commercial breeding organization (BTLWC), LR animals from the herd book organizations (BTLRH), and LW animals from the herd book organizations (BTLWH). The number of animals per cluster were 1293 animals in BTLRC, 1317 animals in BTLWC, 256 in BTLWH, and 735 in BTLRH.
Cluster BTLRC and BTLWC are representing LR and LW populations of a commercial breeding organization. GWAS of AND and SKA for these two clusters have already been performed in a previous study [13]. A short summary of the results is presented below. The sample size of cluster BTLWH was not sufficient enough for a GWAS (n = 256). Therefore, this study contains an association study of AND and SKA for cluster BTLRH, which represents a LR population containing 735 boars of three herd book organizations.

3.3.2. GWAS for Hormone Profiles

Table 5 presents a summary of the genome-wide and chromosome-wide significant associated markers per trait along with their positions for all of the analyzed traits in this study. The full table can be found in the appendix (additional Table S2). A table with adjacent regions and possible interesting genes in a window of ±1 Mb can be found in the additional Table S3. In total, 48 markers were found to be significantly associated with SKA, CORT, TEST, EST, LH, and FSH in the different clusters, whereas no QTL was found for AND. Moreover, there were no overlapping QTL regions across traits or clusters regarding an interval of 2,321,253 basepairs.
CORT was found to be significantly associated with two markers in Cluster HoLRC, nine markers in cluster HoLW and one marker in cluster HoLRH. In Cluster HoLRC, both of the markers are intron variants and located on SSC 2 at 144.8 Mb. In cluster HoLW, all of the markers were located on SSC 7 in a region from 115.2 to 115.6 Mb, and four of them were also genome-wide significant. Five variants in this region are from a customized chip; therefore, the kind of variant is unknown. The remaining four variants are intron variants. The significantly associated variant in cluster HoLRH is located at 36.1 Mb on SSC 18, but it has not been mapped until now.
For FSH, one intergenic variant at 58.1 Mb on SSC 10 was found to be chromosome-wide significant associated in cluster HoLRC. Additionally, on SSC 7 one intron variant was significantly associated with at 117.9 Mb in cluster HoLW.
For EST and LH, significant markers were only found in cluster HoLRH. Whereas GWAS for LH showed an intron variant as a chromosome-wide significant marker on SSC 7 at 9.5 Mb, GWAS for EST revealed one intron variant on SSC 6 at 69.5 Mb and one non-coding transcript exon variant at 19.6 Mb on SSC 17.

3.3.3. GWAS for AND and SKA

For clusters BTLRC and BTLWC, which were analyzed in a previous study [13], 25 markers in LR and 18 markers in LW were found to be significantly associated with both of the boar taint compounds. The most important region for AND in LR ranged from 20.9 Mb to 22.9 Mb on SSC 5 and contained 12 significant SNPs. In LW, one marker was found to be chromosome-wide significantly associated with AND at 48.1 Mb on SSC 17. Associations with SKA were found in a shared region for LR and LW on SSC 14 in a region from 140.5 Mb to 141.6 Mb. Additionally, nine markers were found to be chromosome-wide significantly associated with SKA in LR on SSC 6. More details regarding the described regions above can be found in the preceding study by Brinke et al. [13].
For Cluster BTLRH, as analyzed in this study, no significant markers were found to be associated with AND. For SKA, 12 markers were found to be chromosome-wide significantly associated on SSC 14 in a region from 140.5 to 141.3 Mb (Figure 3). It contains four introns, three upstream gene variants, two downstream gene variants, two 3’ prime untranslated region variants, and one intergenic variant. Ten of these markers were also found to be significantly associated with SKA in Cluster BTLWC in the previous study [13]. The phenotypic variance that was explained by a significant SNP in this region varied between 3.3% and 3.5%. Additionally, one significant marker was located at 152.9 Mb, which has not been mapped until now.

4. Discussion

Breeding against boar taint is a long-term, sustainable, and animal welfare-friendly alternative to surgical castration of young male piglets during their first week of life. Because unfavorable relationships to the fertility complex can be expected, due to a shared synthesis pathway [18,19], it is important to clarify these relationships as well as to reveal possible common genetic backgrounds in order to avoid the loss of breeding progress in fertility traits, which was accomplished during the past decades. Therefore, this study aims to reveal antagonistic relationships as well as to identify genes or QTL with possible pleiotropic effects on boar taint and the analyzed endocrine parameters.

4.1. Descriptive Summary for Boar Taint and Endocrine Parameters

The descriptive data showed that the concentrations of AND and SKA in fat were, on average, greater in LR (1653.92 ng/g for AND, 219.48 ng/g for SKA) than in LW (1223.45 ng/g for AND and 93.26 ng/g for SKA). A reason for that could be the leaner carcass composition of LW pigs in comparison to LR pigs [27]. By application of the strictest thresholds of 150 ng/g for SKA and 1500 ng/g for AND, 23.1% of all LR and 4.7% of all LW boars would be classified as conspicuous.
For the hormone concentrations, the number of analyzed LW animals was lower (n = 286) than LR animals (n = 710) (Table 2), which resulted from the limited availability of purebred LW animals. Consequently, the results, especially for LW animals, estimated parameters have to be interpreted with caution, as can also be seen from the high standard errors of the estimators.
The mean CORT concentrations in this study are in a range between 28.31 ng/mL and 38.47 ng/mL. Comparing CORT concentrations to references is not recommendable as CORT is a hormone where the presence is highly influenced by many factors, e.g., the individual animal, breed, or the circadian rhythm, which cannot be expressed by a single measurement [28]
The mean TEST concentration was 11.82 ± 9.53 ng/mL for LR boars and 8.17 ± 7.53 ng/mL for LW boars. This is higher than the reported values of Colenbrander et al. [29], who measured approximately 4 ng/mL for a Dutch LR × Yorkshire cross at a similar age. Nevertheless, the increasing TEST concentration after this age has been described by Colenbrander et al. [29] as a consequence of increasing activity in the testis. Newer studies have shown TEST concentrations in a range of of 0.73 to 3.06 ng/mL in Duroc boars depending on the season [30] or concentrations of 6.6 ng/mL in a Pietrain × LR cross [31]. The average TEST concentration of females was 0.49 ± 1.66 in LR and 0.15 ± 0.12 in LW. The high number of females with a TEST concentration under the sensitivity threshold of 0.08 ng/mL underlines the hypothesis that the female animals in this study were not in estrus yet.
The average EST concentrations of 1.58 ± 1.50 ng/mL in LR and 0.97 ± 1.15 in LW were greater in the male animals than in the female animals (0.26 ± 0.26 ng/mL in LR, 0.21 ± 0.15 ng/mL in LW). The high concentration in male animals can be explained due to the fact, that boars produce high amounts of estrogens in the testis compared to other animals [32]. Additionally, the blood samples of females were collected in a prepubertal age. Under consideration of their PROG profile, it can be assumed that these gilts were not yet in estrus. Therefore, female animals have lower EST concentrations than the boars (Table 2).
The mean LH concentrations in this study were higher in females (7.03 ng/mL ± 4.27 in LR, 7.20 ng/mL ± 2.44 ng/mL in LW) than in males (2.81 ng/mL ± 1.54 in LR, 2.59 ng/mL ±1.03 in LW). For FSH, the concentrations of male and female animals did only slightly differ. Whereas female animals showed an average FSH concentration of 1335.54 ng/mL in LR and 1355.22 ng/mL in LW, male animals showed FSH concentrations of 1402.29 ng/mL in LR and 1440.00 ng/mL in LW.
PROG was excluded from further analysis, as there were too many values in the assay under the sensitivity threshold of 0.14 ng/mL. An explanation for the high number of animals under this threshold could be their age. Because PROG was earlier described as an endocrine indicator for the number of ovulations in prepubertal gilts [33], animals in our study may not have reached this hormonal status of puberty, as they were too young, with an average age of 126 days for females and 164 days for males. Additionally, studies dealing with the physiological background of PROG are often performed as a challenge study, during the estrous cycle or in pregnant or sows or gilts [34,35,36]. These studies cannot be used as references, as PROG during pregnancy plays another role than in prepubertal pigs.

4.2. Variance Component Estimation

The results for the h2 for boar taint compounds AND (h2 = 0.52 in LR, h2 = 0.44 in LW) and SKA (h2 = 0.40 in LR, h2 = 0.34 in LW) are in accordance with previous reported ranges of 0.25 to 0.88 for AND and 0.19 to 0.54 for SKA [10,37,38,39]. The genetic correlation between AND and SKA was rg = 0.42 in LR and rg = 0.57 in LW. In LR, this result is close to the previously reported rg of 0.35 and 0.36 [10,11] and it is comparable to the results from our previous study, which represents a subset of this dataset (rg = 0.29 in LR, rg = 0.41 in LW) [13]. The physiological point of view for this relationship is described by Doran et al. [14] who described that SKA metabolism is inhibited by high AND concentrations in hepatocytes. Therefore, an increasing AND concentration leads to an increasing SKA concentration, which is reflected by the genetic correlations that are estimated in this study.
A few studies have already been conducted on the genetic relationship between boar taint and TEST and/or EST, as the common synthesis pathway for boar taint compounds and sex steroid hormones has been well known for a long time [15,40,41]. However, as endocrine parameters are underlying a regulatory network, it is important to not only focus on TEST or EST, but also reveal the relationships of boar taint to regulatory hormones like LH, or FSH.
Regarding the results presented in Table 3, it should be taken into account, that individual variation of these hormone concentrations is very high and the standard error of both h2 and rg limits the significance of our study.
Moderate h2 of 0.35 for CORT in LW is in accordance with what has been reported in the literature of Larzul et al. [42], who have reported a h2 of 0.36 for a baseline of CORT in purebred LW. A study on Swiss LR showed h2 between 0.40 and 0.70, depending on the used model [43], which is higher than the h2 of 0.11 that was estimated for LR animals in this study. The genetic relationship between boar taint compounds and CORT was moderately negative in LR with a rg = −0.18 for AND and SKA and −0.21 for SKA and CORT. Therefore, breeding against AND or SKA could result in a higher CORT concentration in LR animals.
The h2 for TEST differed between the breeds. The moderate h2 of 0.23 in LW is more comparable to the reported values for purebred Duroc (DU) (h2 = 0.19) and a DU x LW cross (h2 = 0.29) [44]. This study has also reported a high rg between AND and TEST of 0.75 in the purebred boars [44], which we can generally confirm in LR (rg = 0.62), whereas the rg in LW was higher in this study (rg = 0.93). These findings are in accordance with our expectations, because the synthesis pathway of AND is along with the sex steroid synthesis, where testosterone shows up as a precursor of AND [9,18]. Similar values were expected for rg between SKA and TEST due to the moderate to high rg between AND and SKA. In LR, rg between AND and SKA was very high (rg = 0.83) and comparable with the results of the study conducted by Parois et al. [44] (rg = 0.71), whereas the rg in LW was lower (rg = 0.27). Because TEST has been reported to be essential for spermatogenesis and male fertility in general [45,46], breeding against AND and/or SKA would have clear unfavorable consequences on the concentration of TEST in purebred LR and LW animals.
EST is not only one of the most important estrogens for female fertility, as reflected by Grindflek et al. [41]; it is also very important for sexual behavior in boars. Genetic correlations between AND and EST have been reported in several studies in a range between 0.42 to 0.93, as summarized by Moe et al. [15], where rg in this study was 0.49 for LR and 0.46 for LW. In contrast to that, rg between SKA and EST in LR was very high in this study (rg = 0.95) and low in LW (rg = 0.03) when compared to the literature references of 0.29 to 0.53, as reviewed by Moe et al. [15]. Nevertheless, it should be noted that the sample size for LW animals in this study was comparably low to the LR sample size, which has an impact on the estimates and the standard errors.
The genetic correlation between FSH and AND was 0.30 in LR and LW, respectively, which indicates that breeding against AND would result in lower FSH concentrations. This could have relevant undesirable consequences, as has been shown by Wise et al. [47] in Meishan pigs that were used to improve the fertility of European pig populations. Within this breed, the authors have shown that there is a negative relationship between FSH concentration in boars and increased litter size in sows. Regarding the genetic relationship between FSH and SKA, the risk of reduced fertility by breeding against SKA is small, because the rg is close to zero in LW (rg = 0.01) and even favorably expressed in LR (rg = −0.14).

4.3. GWAS

In this study, univariate GWAS for the analyzed hormones TEST, CORT, EST, LH, and FSH was performed for three different clusters: HoLRC (commercial LR population), HoLW (LW population from herd book and commercial breeding organization), and HoLRH (herd book LR population). This association analysis revealed nine markers in cluster HoLRC, 19 (4) markers in cluster HoLW and four markers in cluster HoLRH, which were found to be chromosome-wide (genome-wide) significantly associated with one of the analyzed hormones.

4.3.1. GWAS Hormones

For CORT in HoLRC, two intron variants were identified around 144.8 Mb on SSC 2 belonging to the gene Nuclear Receptor Subfamily 3 Group C Member 1 (NR3C1). This gene is known as a candidate gene for affecting the regulation of the hypothalamic-pituitary-adrenal axis (HPA axis) in pigs [48,49]. Additionally, a polymorphism of this gene was later identified with variations in plasma cortisol levels in purebred LR and LW populations as well as in a Pietrain × (LW × LR) crossbred [49].
For HoLW, a region around 115.6 Mb on SSC 7 contained significantly associated variants with CORT. One of them is an intron variant of the gene DEAD-Box Helicase 24 (DDX24). Although this gene is not further investigated in pig, the members of this gene family are potentially involved in, e.g., spermatogenesis in humans [50]. Based on this information, DDX24 can be regarded as a possible candidate gene for TEST concentration in pigs. The previously reported associations with CORT and variations in CORT concentrations in a LW × Meishan cross by Désautés et al. [51] are located on SSC 7 at 149 Mb and 156 Mb. Additionally, Ponsuksili et al. [52] identified two regions on SSC 7 at 123.2 Mb and 85.9 Mb to be significantly associated with plasma CORT concentration in a Pietrain × (LW × LR) crossbred. A marker on SSC 18 at 33.3 Mb was identified in this study for HoLRH, but the position is not in accordance with results that were described by Désautés et al. [51].
Within HoLRC and HoLW, GWAS for TEST revealed six and eight chromosome-wide associations, respectively. For HoLRC, two regions were identified on SSC 1 around 15 Mb and 150.6 Mb. The first region contains two intergenic variants and two intron variants of the gene A-Kinase Anchoring Protein 12 (AKAP12). Until now, no specific function of this gene is known in the porcine organism. Two additional markers were identified on SSC 7 at 106.5 Mb and 113.1 Mb in HoLRC affecting TEST. Because the first marker is an intergenic variant and the second one is an unknown variant, no statement can be made due to their relevance for TEST. The region on SSC 7 at 71 Mb described by Ren et al. [53] in a F2 LW × Erhualian intercross was not confirmed. For the HoLW cluster, a region between 33.9 Mb to 37.0 Mb on SSC 16 was identified to be significantly associated with TEST. This region contains an upstream gene variant of Granzyme K (GZMK). Additionally, this region comprises four introns, two intergenic variants, and one unknown variant. None of these variants are in genes that seem to play a role in TEST synthesis or regulation. Nevertheless, one intron variant is located in the interleukin−6 receptor subunit beta (IL6ST). Variations in this gene or members of his family could be possibly involved in alterations in the expression of these receptors in porcine follicular fluid during atresia [54]. Grindflek et al. [55] identified QTL for TEST in Norwegian LR and Duroc on the same chromosome, at 21 to 24 Mb. Previously identified regions on SSC 3 [55], SSC 7, or SSC 13 [53] for TEST could not be confirmed in this study.
GWAS for EST only showed chromosome-wide significant associations with two markers in cluster HoLRH. One marker was located on SSC 6 at 69.5 Mb and it was identified as an intron variant of the Solute Carrier Family 2 Member 5 (SLC2A5). This gene is involved in transporting fructose during pregnancy from uterus to conceptus [56]. Additionally, it has been hypothesized by Steinhauser et al. [56] that an increasing concentration of PROG results in a higher expression of SLC2A5. In conclusion, it cannot be hypothesized that SLC2A5 is a specific candidate gene for EST, but for fertility in general. Associations for EST on SSC 1, 13, or 15, as reported by Grindflek et al. [55], could not be confirmed in our study.
For LH, one marker was found to be chromosome-wide significantly associated in HoLRH. This marker an intron variant of Phosphatase And Actin Regulator 1 (PHACTR1) was located on SSC 7 at 9.5 Mb. The specific function of this gene in pigs is still unknown. In humans, a homologue of this gene is associated with the risk for coronary artery diseases [57]. In a broad sense, this gene function can be linked to robustness, but not to maternal or paternal fertility characteristics.
FSH was associated with at least one marker when analyzing the clusters HoLRC and HoLW, respectively. For HoLRC, the marker was an intergenic variant on SSC 10. For HoLW, an intron variant on SSC 7 at 117.9 Mb was identified, lying in the gene VRK Serine/Threonine Kinase 1 (VRK1). This gene is involved in the phosphate metabolism at least in Berkshire and Korean native breeds [58], but, until now, it is not possible to relate this gene function to any kind of fertility influencing metabolism.
In general, GWAS of hormone data showed significant regions that differed per trait and cluster. No overlapping regions were found in the analysis of endocrine parameters, although a region on SSC 7 contained significant associations for CORT in HoLW, TEST in HoLRC, and FSH in HoLW in adjacent regions between 113.1 Mb to 117.9 Mb.

4.3.2. GWAS Boar Taint Cluster BTLRH

A previous study already performed association studies for a LR and LW population from a commercial breeding organization [13]. This study showed genome-wide associations with AND in LR on SSC 5 and in LW on SSC 17. For SKA, GWAS showed significant associations in both breeds for the region around 141 Mb on SSC 14. Furthermore, a region on SSC 6 at 0.3 Mb to 0.4 Mb was significantly associated with SKA in LR [13].
The results of this analysis could be partially confirmed by the GWAS in this study, which was performed in the LR herd book dataset BTLRH. GWAS was not performed within the LW herd book dataset (BTLWH) because of the small sample size.
GWAS for cluster BTLRH revealed 13 markers, which were found to be chromosome-wide significantly associated with SKA. For AND, no significant associated markers were found. For SKA, 12 of the 13 identified markers are located in a region on SSC 14, which ranged from 140.5 Mb to 141.3 Mb. Although none of these markers are located in genes, which are further investigated in pigs, the identified region was identified as the promotor region of the Cytochrome P450 Family 2 Subfamily E Member 1 (CYP2E1) gene, which is well known to be involved in SKA metabolism from several previous studies [15,59,60,61,62]. Nine of these 12 markers were also found to be significantly associated with SKA in the BTLWC cluster in the previous study [13], which enhances the importance of this region for a genetic background for SKA.
Knowledge about overlapping gene regions is of particular interest regarding the key question of whether selection against boar taint has negative consequences on sexual hormones. However, none of the identified regions for endocrine parameters in this study are located in regions that were identified for AND or SKA or reproduction traits in our previous study [13]. Consequently, clear genomic indicators that provide evidence of an antagonistic relationship between boar taint and fertility were not found in this study.

5. Conclusions

In conclusion, the results showed contrary directions regarding the possible unfavorable relationships between boar taint compounds and reproduction hormones in both of the breeds. However, in the hormones EST and TEST, which are well-known for their importance for female and male fertility, rg are showing consistent unfavorable relationships among both breeds regarding breeding against AND. These results confirm the physiologically expected relationship also on the genetic level.
GWAS could not identify regions with pleiotropic effects on boar taint and EFP, but it enhances the importance of the identified region on SSC 14 for SKA. The performed GWAS for endocrine parameters revealed possible candidate genes for fertility. A region on SSC 7 between 113.1 Mb to 117.9 Mb showed pleiotropic potential for CORT, TEST, and FSH, which should be further analyzed while using multivariate approaches. Although a high h2 of AND and SKA seems to be promising regarding breeding against boar taint, selection should generally be handled with care, as a deterioration of breeding progress in reproduction traits should be avoided.

Supplementary Materials

The following tables are available online at https://www.mdpi.com/2076-2615/11/1/231/s1, Table S1: Descriptive statistics of the analyzed traits (raw values). Table S2: Chromosome wide significant marker in clusters after Bonferroni correction (p < 0.05). Table S3: Adjacent regions and possible interesting genes in a window of +/−1 Mb.

Author Contributions

Conceptualization and methodology, E.T. and C.G.-B.; data collection, I.B., M.J.P.-C., K.R. and C.G.-B.; software, E.T., C.G.-B. and I.B.; formal analysis, I.B.; animal resources, S.K.; writing—original draft preparation, I.B.; writing—review and editing, E.T., C.G.-B. and M.J.P.-C.; visualization, I.B.; supervision, E.T., C.G.-B. and K.S.; project administration, E.T. and C.G.-B.; funding acquisition, E.T. and C.G.-B. All authors have read and agreed to the published version of the manuscript.

Funding

The project is supported by funds of the Federal Ministry of Food and Agriculture (BMEL) based on a decision of the Parliament of the Federal Republic of Germany via the Federal Office for Agriculture and Food (BLE) under the innovation support programme (FKZ: 2817904115).

Institutional Review Board Statement

The study was conducted according to the guidelines of the German animal protection law and approved by the ethics committee of the State Agency for Nature, Environment and Consumer Protection (LANUV) of North Rhine Westphalia (reference number: 84-02.04.2016.A541, approved at 06. June 2017).

Data Availability Statement

Restrictions apply to the availability of these data. Data was obtained from members of the Association for Bioeconomy Research (FBF e.V.) and are available from Sebastian Klein or Ernst Tholen with the permission of the particular member.

Acknowledgments

The authors want to thank all participating organizations for providing data sets and their everlasting support. We also wish to thank the staff at the farms belonging to the organizations for providing care for animals, collecting on-farm data and blood samples as well as samples from slaughterhouse. Moreover, we want to thank the staff at the institute (especially Birgit Koch-Fabritius) for their everlasting commitment to the hormone profile analyses.

Conflicts of Interest

The authors declare no conflict of interest. The funders had no role in the design of the study; in the collection, analyses, or interpretation of data; in the writing of the manuscript, or in the decision to publish the results.

Abbreviations

3’PUTR3’prime untranslated region
AKAP12A-Kinase Anchoring Protein12
ANDAndrostenone
BTLRCBoar taint cluster Landrace, commercial breeding organization
BTLRHBoar taint cluster Landrace, herd book organizations
BTLWCBoar taint cluster Large White, commercialbreeding organization
BTLWHBoar taint cluster Large White, herd book organizations
CCommercial breeding organization
CORTCortisol
CYP2E1Cytochrome P450 Family 2 Subfamily E Member 1
DDX24DEAD-Box Helicase 24
DGVDownstream gene variant
EFPEndocrine fertility parameters
EST17-β estradiol
FSHFollicle-stimulating hormone
GCGenomic Control
GWASGenome-wide association analysis
GZMKGranzyme K
HHerd book organizations
h2Heritability
HoLRCHormone cluster Landrace, commercial breeding organization
HoLRHHormone cluster Landrace, herd book organizations
HoLWHormone cluster Large White from all organizations
HPA axisHypothalamic-pituitary-adrenal axis
IL6STinterleukin-6 receptor subunit beta
intra-CVIntra-variation coefficient
kgKilogram
LHLuteinizing hormone
LRLandrace
LWLarge White
MAFMinor allele frequency
mlMilliliter
n.m.Not mapped
NCTEVnon coding transcript exon variant
ngNanogram
NR3C1Nuclear Receptor Subfamily 3 Group C Member 1
PHACTR1Phosphatase And Actin Regulator 1
PROGProgesterone
QTLQuantitative trait locus/loci
rgGenetic correlation
rpPhenotypic correlation
SIDA-HSPM-GC/MSStable isotope dilution analysis-headspacesolid-phase microextraction-gas chromatography/mass spectrometry
SKASkatole
SLC2A5Solute Carrier Family 2 Member 5
SNPsSingle nucleotide polymorphism(s)
SSCSusscrofachromosome
TESTTestosterone
UGVUpstream gene variant
VCEVariance component estimation
VRK1VRK Serine/Threonine Kinase 1

References

  1. Merks, J.W.M.; Mathur, P.K.; Knol, E.F. New phenotypes for new breeding goals in pigs. Animal 2012, 6, 535–543. [Google Scholar] [CrossRef] [Green Version]
  2. Drittes Gesetz zur Änderung des Tierschutzgesetzes. Gesetz über Die Zusammenarbeit von Bundesregierung und Deutschem Bundestag in Angelegenheiten der Europäischen Union (EUZBBG); Bundesanzeiger Verlag: Köln, Germany, 2013; pp. 2182–2196. [Google Scholar]
  3. Lundström, K.; Matthews, K.R.; Haugen, J.-E. Pig meat quality from entire males. Animal 2009, 3, 1497–1507. [Google Scholar] [CrossRef] [Green Version]
  4. Stefanski, V.; Labussière, E.; Millet, S.; Weiler, U. Pork production with immunocastration: Welfare and environment. In Proceedings of the EAAP 69th Annual Meeting of the European Federation of Animal Science, Dubrovnik, Croatia, 27–31 August 2018; Wageningen Academic Publishers: Wageningen, The Netherlands, 2018; p. 229. [Google Scholar]
  5. Zamaratskaia, G.; Squires, E.J. Biochemical, nutritional and genetic effects on boar taint in entire male pigs. Animal 2009, 3, 1508–1521. [Google Scholar] [CrossRef] [PubMed] [Green Version]
  6. Anderson, L.L. Reproductive Biology of Pigs. Anim. Ind. Rep. 2009. [Google Scholar] [CrossRef]
  7. Weiler, U.; Wesoly, R. Physiologische Aspekte der Androstenon- und Skatolbildung beim Eber. Züchtungskunde 2012, 84, 365–393. [Google Scholar]
  8. Squires, E.J. Possibilites for selection against boar taint. Acta Vet. Scand. 2006, 48, S8. [Google Scholar] [CrossRef]
  9. Bonneau, M. Compounds responsible for boar taint, with special emphasis on androstenone: A review. Livest. Prod. Sci. 1982, 9, 687–705. [Google Scholar] [CrossRef]
  10. Strathe, A.B.; Velander, I.H.; Mark, T.; Kadarmideen, H.N. Genetic parameters for androstenone and skatole as indicators of boar taint and their relationship to production and litter size traits in Danish Landrace. J. Anim. Sci. 2013, 91, 2587–2595. [Google Scholar] [CrossRef] [Green Version]
  11. Tajet, H.; Andresen, Ø.; Meuwissen, T.H. Estimation of genetic parameters of boar taint; skatole and androstenone and their correlations with sexual maturation. Acta Vet. Scand. 2006, 48, S9. [Google Scholar] [CrossRef]
  12. Windig, J.J.; Mulder, H.A.; Napel, J.T.; Knol, E.F.; Mathur, P.K.; Crump, R.E. Genetic parameters for androstenone, skatole, indole, and human nose scores as measures of boar taint and their relationship with finishing traits. J. Anim. Sci. 2012, 90, 2120–2129. [Google Scholar] [CrossRef]
  13. Brinke, I.; Große-Brinkhaus, C.; Roth, K.; Pröll-Cornelissen, M.J.; Henne, H.; Schellander, K.; Tholen, E. Genomic background and genetic relationships between boar taint and fertility traits in German Landrace and Large White. BMC Genet. 2020, 21, 1–13. [Google Scholar] [CrossRef] [PubMed]
  14. Doran, E.; Whittington, F.W.; Wood, J.D.; McGivan, J.D. Cytochrome P450IIE1 (CYP2E1) is induced by skatole and this induction is blocked by androstenone in isolated pig hepatocytes. Chem. Biol. Interact. 2002, 140, 81–92. [Google Scholar] [CrossRef]
  15. Moe, M.; Lien, S.; Aasmundstad, T.; Meuwissen, T.H.E.; Hansen, M.H.S.; Bendixen, C.; Grindflek, E. Association between SNPs within candidate genes and compounds related to boar taint and reproduction. BMC Genet. 2009, 10, 32. [Google Scholar] [CrossRef] [PubMed] [Green Version]
  16. Mathur, P.K.; Napel, J.T.; Crump, R.E.; Mulder, H.A.; Knol, E.F. Genetic relationship between boar taint compounds, human nose scores, and reproduction traits in pigs. J. Anim. Sci. 2013, 91, 4080–4089. [Google Scholar] [CrossRef] [PubMed]
  17. Hidalgo, A.M.; Bastiaansen, J.W.M.; Harlizius, B.; Megens, H.-J.; Madsen, O.; Crooijmans, R.P.M.A.; Groenen, M.A.M. On the relationship between an Asian haplotype on chromosome 6 that reduces androstenone levels in boars and the differential expression of SULT2A1 in the testis. BMC Genet. 2014, 15, 4. [Google Scholar] [CrossRef] [Green Version]
  18. Gower, D.B. 16-Unsaturated C19 Steroids a Review of Their Chemistry, Biochemistry and Possible Physiological Role. J. Steroid Biochem. 1972, 3, 45–103. [Google Scholar] [CrossRef]
  19. Brooks, R.I.; Pearson, A.M. Steroid hormone pathways in the pig, with special emphasis on boar odor: A review. J. Anim. Sci. 1986, 62, 632–645. [Google Scholar] [CrossRef]
  20. Fischer, J.; Elsinghorst, P.W.; Bücking, M.; Tholen, E.; Petersen, B.; Wüst, M. Development of a candidate reference method for the simultaneous quantitation of the boar taint compounds androstenone, 3α-androstenol, 3β-androstenol, skatole, and indole in pig fat by means of stable isotope dilution analysis-headspace solid-phase microextraction-gas chromatography/mass spectrometry. Anal. Chem. 2011, 83, 6785–6791. [Google Scholar] [CrossRef]
  21. Hornung, R.W.; Reed, L.D. Estimation of Average Concentration in the Presence of Nondetectable Values. Appl. Occup. Environ. Hyg. 1990, 5, 46–51. [Google Scholar] [CrossRef]
  22. Meyer, K. WOMBAT: A tool for mixed model analyses in quantitative genetics by restricted maximum likelihood (REML). J. Zhejiang Univ. Sci. B 2007, 8, 815–821. [Google Scholar] [CrossRef] [Green Version]
  23. Aulchenko, Y.S.; Ripke, S.; Isaacs, A.; van Duijn, C.M. GenABEL: An R library for genome-wide association analysis. Bioinformatics 2007, 23, 1294–1296. [Google Scholar] [CrossRef] [PubMed] [Green Version]
  24. Devlin, B.; Roeder, K. Genomic Control for Association Studies. Biometrics 1999, 55, 997–1004. [Google Scholar] [CrossRef] [PubMed]
  25. Kendall, M.G.; Stuart, A.; Ord, J.K. The Advanced Theory of Statistics, 4th ed.; Distribution Theory; Griffin: London, UK, 1977; Volume 1, ISBN 0852642423. [Google Scholar]
  26. Zerbino, D.R.; Achuthan, P.; Akanni, W.; Amode, M.R.; Barrell, D.; Bhai, J.; Billis, K.; Cummins, C.; Gall, A.; Girón, C.G.; et al. Ensembl 2018. Nucleic Acids Res. 2018, 46, D754–D761. [Google Scholar] [CrossRef] [PubMed]
  27. Bunter, K.L.; Bennett, C.; Luxford, B.G.; Graser, H.-U. Sire breed comparisons for meat and eating quality traits in Australian pig populations. Animal 2008, 2, 1168–1177. [Google Scholar] [CrossRef] [PubMed] [Green Version]
  28. Kress, K.; Weiler, U.; Schmucker, S.; Čandek-Potokar, M.; Vrecl, M.; Fazarinc, G.; Škrlep, M.; Batorek-Lukač, N.; Stefanski, V. Influence of Housing Conditions on Reliability of Immunocastration and Consequences for Growth Performance of Male Pigs. Animals 2019, 10, 27. [Google Scholar] [CrossRef] [Green Version]
  29. Colenbrander, B.; de Jong, F.H.; Wensing, C.J. Changes in serum testosterone concentrations in the male pig during development. J. Reprod. Fertil. 1978, 53, 377–380. [Google Scholar] [CrossRef]
  30. Cheon, Y.M.; Kim, H.K.; Yang, C.B.; Yi, Y.J.; Park, C.S. Effect of Season Influencing Semen Characteristics, Frozen-Thawed Sperm Viability and Testosterone Concentration in Duroc Boars. Asian-Aust. J. Anim. Sci. 2002, 15, 500–503. [Google Scholar] [CrossRef]
  31. Zoels, S.; Reiter, S.; Ritzmann, M.; Weiß, C.; Numberger, J.; Schütz, A.; Lindner, P.; Stefanski, V.; Weiler, U. Influences of Immunocastration on Endocrine Parameters, Growth Performance and Carcass Quality, as Well as on Boar Taint and Penile Injuries. Animals 2020, 10, 346. [Google Scholar] [CrossRef] [Green Version]
  32. Booth, W.D. A study of some major testicular steroids in the pig in relation to their effect on the development of male characteristics in the prepubertally castrated boar. J. Reprod. Fertil. 1980, 59, 155–162. [Google Scholar] [CrossRef] [Green Version]
  33. Wettemann, R.P.; Johnson, R.K.; Omtvedt, I.T. The relationships between plasma progesterone and lh and the numbers of corpora lutea and embryos in purebred and crossbred gilts. J. Anim. Sci. 1980, 51, 1352–1357. [Google Scholar] [CrossRef] [Green Version]
  34. Henricks, D.M.; Guthrie, H.D.; Handlin, D.L. Plasma estrogen, progesterone and luteinizing hormone levels during the estrous cycle in pigs. Biol. Reprod. 1972, 6, 210–218. [Google Scholar] [CrossRef] [PubMed] [Green Version]
  35. Hoving, L.L.; Haen, S.M.; Laurenssen, B.F.A.; Peltoniemi, O.A.T.; Kemp, B.; Soede, N.M. Caudal vena cava progesterone and LH release patterns on Day 14 of gestation in primiparous sows. Reprod. Fertil. Dev. 2017, 29, 476–481. [Google Scholar] [CrossRef] [PubMed]
  36. van Wettere, W.H.E.J.; Toplis, P.; Miller, H.M. Effect of oral progesterone and caffeine at the end of gestation on farrowing duration and piglet growth and survival. Animal 2018, 12, 1638–1641. [Google Scholar] [CrossRef] [PubMed]
  37. Robic, A.; Larzul, C.; Bonneau, M. Genetic and metabolic aspects of androstenone and skatole deposition in pig adipose tissue: A review. Genet. Sel. Evol. 2008, 40, 129–143. [Google Scholar] [CrossRef] [PubMed] [Green Version]
  38. Sellier, P.; Le Roy, P.; Fouilloux, M.N.; Gruand, J.; Bonneau, M. Responses to restricted index selection and genetic parameters for fat androstenone level and sexual maturity status of young boars. Livest. Prod. Sci. 2000, 63, 265–274. [Google Scholar] [CrossRef]
  39. Engelsma, K.A.; Bergsma, R.; Harlizius, B.; Ducro-Steverink, D.W.B.; Knol, E.F. Genetic parameters for components of boar taint and their relation with carcass quality and female fertility. In Proceedings of the EAAP 58th Annual Meeting, Session 10, Poster 27, Dublin, Ireland, 26–29 August 2007. [Google Scholar]
  40. Zamaratskaia, G.; Babol, J.; Madej, A.; Squires, E.J.; Lundstrom, K. Age-related Variation of Plasma Concentrations of Skatole, Androstenone, Testosterone, Oestradiol-17beta, Oestrone Sulphate, Dehydroepiandrosterone Sulphate, Triiodothyronine and IGF-1 in Six Entire Male Pigs. Reprod. Domest. Anim. 2004, 39, 168–172. [Google Scholar] [CrossRef] [PubMed]
  41. Grindflek, E.; Meuwissen, T.H.E.; Aasmundstad, T.; Hamland, H.; Hansen, M.H.S.; Nome, T.; Kent, M.; Torjesen, P.; Lien, S. Revealing genetic relationships between compounds affecting boar taint and reproduction in pigs. J. Anim. Sci. 2011, 89, 680–692. [Google Scholar] [CrossRef] [Green Version]
  42. Larzul, C.; Terenina, E.; Foury, A.; Billon, Y.; Louveau, I.; Merlot, E.; Mormede, P. The cortisol response to ACTH in pigs, heritability and influence of corticosteroid-binding globulin. Animal 2015, 9, 1929–1934. [Google Scholar] [CrossRef] [Green Version]
  43. Kadarmideen, H.N.; Janss, L.L.G. Population and systems genetics analyses of cortisol in pigs divergently selected for stress. Physiol. Genom. 2007, 29, 57–65. [Google Scholar] [CrossRef]
  44. Parois, S.P.; Prunier, A.; Mercat, M.J.; Merlot, E.; Larzul, C. Genetic relationships between measures of sexual development, boar taint, health, and aggressiveness in pigs. J. Anim. Sci. 2015, 93, 3749–3758. [Google Scholar] [CrossRef]
  45. Walker, S.; Robison, O.W.; Whisnant, C.S.; Cassady, J.P. Effect of divergent selection for testosterone production on testicular morphology and daily sperm production in boars. J. Anim. Sci. 2004, 82, 2259–2263. [Google Scholar] [CrossRef] [PubMed] [Green Version]
  46. Walker, W.H. Non-classical actions of testosterone and spermatogenesis. Philos. Trans. R. Soc. Lond. B Biol. Sci. 2010, 365, 1557–1569. [Google Scholar] [CrossRef] [PubMed] [Green Version]
  47. Wise, T.; Lunstra, D.D.; Ford, J.J. Differential Pituitary and Gonadal Function of Chinese Meishan and European White Composite Boars: Effects of Gonadotropin-Releasing Hormone Stimulation, Castration, and Steroidal Feedback. Biol. Reprod. 1996, 54, 146–153. [Google Scholar] [CrossRef] [PubMed] [Green Version]
  48. Muráni, E.; Ponsuksili, S.; D’Eath, R.B.; Turner, S.P.; Kurt, E.; Evans, G.; Thölking, L.; Klont, R.; Foury, A.; Mormède, P.; et al. Association of HPA axis-related genetic variation with stress reactivity and aggressive behaviour in pigs. BMC Genet. 2010, 11, 74. [Google Scholar] [CrossRef] [Green Version]
  49. Muráni, E.; Reyer, H.; Ponsuksili, S.; Fritschka, S.; Wimmers, K. A substitution in the ligand binding domain of the porcine glucocorticoid receptor affects activity of the adrenal gland. PLoS ONE 2012, 7, e45518. [Google Scholar] [CrossRef] [Green Version]
  50. Gashaw, I.; Grümmer, R.; Klein-Hitpass, L.; Dushaj, O.; Bergmann, M.; Brehm, R.; Grobholz, R.; Kliesch, S.; Neuvians, T.P.; Schmid, K.W.; et al. Gene signatures of testicular seminoma with emphasis on expression of ets variant gene 4. Cell. Mol. Life Sci. 2005, 62, 2359–2368. [Google Scholar] [CrossRef]
  51. Désautés, C.; Bidanel, J.P.; Milant, D.; Iannuccelli, N.; Amigues, Y.; Bourgeois, F.; Caritez, J.C.; Renard, C.; Chevalet, C.; Mormède, P. Genetic linkage mapping of quantitative trait loci for behavioral and neuroendocrine stress response traits in pigs. J. Anim. Sci. 2002, 80, 2276–2285. [Google Scholar] [CrossRef]
  52. Ponsuksili, S.; Du, Y.; Murani, E.; Schwerin, M.; Wimmers, K. Elucidating molecular networks that either affect or respond to plasma cortisol concentration in target tissues of liver and muscle. Genetics 2012, 192, 1109–1122. [Google Scholar] [CrossRef] [Green Version]
  53. Ren, D.R.; Ren, J.; Xing, Y.Y.; Guo, Y.M.; Wu, Y.B.; Yang, G.C.; Mao, H.R.; Huang, L.-S. A genome scan for quantitative trait loci affecting male reproductive traits in a White Duroc x Chinese Erhualian resource population. J. Anim. Sci. 2009, 87, 17–23. [Google Scholar] [CrossRef] [Green Version]
  54. Maeda, A.; Goto, Y.; Matsuda-Minehata, F.; Cheng, Y.; Inoue, N.; Manabe, N. Changes in Expression of Interleukin-6 Receptors in Granulosa Cells During Follicular Atresia in Pig Ovaries. J. Reprod. Dev. 2007, 53, 727–736. [Google Scholar] [CrossRef] [Green Version]
  55. Grindflek, E.; Lien, S.; Hamland, H.; Hansen, M.H.S.; Kent, M.; van Son, M.; Meuwissen, T.H.E. Large scale genome-wide association and LDLA mapping study identifies QTLs for boar taint and related sex steroids. BMC Genom. 2011, 12, 362. [Google Scholar] [CrossRef] [PubMed] [Green Version]
  56. Steinhauser, C.B.; Landers, M.; Myatt, L.; Burghardt, R.C.; Vallet, J.L.; Bazer, F.W.; Johnson, G.A. Fructose Synthesis and Transport at the Uterine-Placental Interface of Pigs: Cell-Specific Localization of SLC2A5, SLC2A8, and Components of the Polyol Pathway. Biol. Reprod. 2016, 95, 108. [Google Scholar] [CrossRef] [PubMed]
  57. Chen, L.; Qian, H.; Luo, Z.; Li, D.; Xu, H.; Chen, J.; He, P.; Zhou, X.; Zhang, T.; Chen, J.; et al. PHACTR1 gene polymorphism with the risk of coronary artery disease in Chinese Han population. Postgrad. Med. J. 2019, 95, 67–71. [Google Scholar] [CrossRef] [PubMed]
  58. Edea, Z.; Kim, K.-S. A whole genomic scan to detect selection signatures between Berkshire and Korean native pig breeds. J. Anim. Sci. Technol. 2014, 56, 1–7. [Google Scholar] [CrossRef] [Green Version]
  59. Mörlein, D.; Lungershausen, M.; Steinke, K.; Sharifi, A.R.; Knorr, C. A single nucleotide polymorphism in the CYP2E1 gene promoter affects skatole content in backfat of boars of two commercial Duroc-sired crossbred populations. Meat Sci. 2012, 92, 739–744. [Google Scholar] [CrossRef]
  60. Skinner, T.M.; Doran, E.; McGivan, J.D.; Haley, C.S.; Archibald, A.L. Cloning and mapping of the porcine cytochrome-p450 2E1 gene and its association with skatole levels in the domestic pig. Anim. Genet. 2005, 36, 417–422. [Google Scholar] [CrossRef]
  61. Squires, E.J.; Lundström, K. Relationship Between Cytochrome P450IIE1 in Liver and Levels of Skatole and Its Metabolites in Intact Male Pigs. J. Anim. Sci. 1997, 75, 2506–2511. [Google Scholar] [CrossRef]
  62. Wiercinska, P.; Lou, Y.; Squires, E.J. The roles of different porcine cytochrome P450 enzymes and cytochrome b5A in skatole metabolism. Animal 2012, 6, 834–845. [Google Scholar] [CrossRef] [Green Version]
Figure 1. Distribution of animals from hormone dataset in clusters based on genetic relationship matrix, HoLRC n = 254, HoLW n = 272, HoLRH n = 447. Colors are representing the different organizations. Filled-in circles are representing Landrace animals; filled-in triangles are representing Large White animals.
Animals 11 00231 g001
Figure 2. Distribution of animals in clusters based on genetic relationship matrix, BTLRC n = 1293, BTLWC n = 1317, BTLWH n = 256, BTLRH n = 735. Colors are representing the different organizations. Filled-in circles are representing Landrace animals, filled-in triangles are representing Large White animals.
Animals 11 00231 g002
Figure 3. Distribution of SNPs for log-transformed skatole in BTLRH. The black line corresponds to the threshold of chromosome-wide significance.
Animals 11 00231 g003
Table 1. Number of animals and markers per trait and cluster.
TraitClusterNumber of AnimalsNumber of Markers
ANDBTLRC *129338,411
BTLWC *131739,302
BTLRH73543,644
SKABTLRC *129338,411
BTLWC *131739,302
BTLRH73543,644
CORTHoLRC25440,176
HoLW27140,972
HoLRH43444,095
TESTHoLRC25240,176
HoLW26740,972
HoLRH42344,095
ESTHoLRC25140,176
HoLW26540,972
HoLRH41544,095
LHHoLRC25440,176
HoLW27240,972
HoLRH41744,095
FSHHoLRC25440,176
HoLW27240,972
HoLRH41744,095
* = results are shown in previous study [13], HO_LR_C = hormone cluster Landrace from a commercial breeding organization, HO_LW = hormone cluster Large White from a commercial breeding organization, HO_LR_H = hormone cluster Landrace from a herd book organization, AND = log-transformed androstenone, SKA = log-transformed skatole, CORT = log-transformed cortisol, TEST = log-transformed testosterone, EST = log-transformed estradiol, LH = log-transformed luteinizing hormone, and FSH = log-transformed follicle-stimulating hormone. 2.6. GWAS.
Table 2. Descriptive statistics of the analyzed traits (log-transformed).
TraitSexLandraceLarge White
NMean ± SDNMean ± SD
Agefemale3534.85 ± 3.441384.83 ± 2.05
male3575.11 ± 2.491485.09 ± 1.58
CORTfemale3533.34 ± 2.591373.49 ± 2.71
male3573.53 ± 2.841483.65 ± 3.03
male + female7103.44 ± 2.752853.58 ± 2.91
TESTfemale344−0.71 ± 0.51133−1.90 ± −2.12
male3532.44 ± 2.251482.08 ± 2.02
male + female6971.81 ± 2.172811.46 ± 1.91
ESTfemale340−1.35 ± −1.35132−1.56 ± −1.90
male3460.46 ± 0.41147−0.03 ± 0.14
male + female686−0.07 ± 0.24279−0.50 ± −0.08
LHfemale3431.95 ± 1.451381.97 ± 0.89
male3571.03 ± 0.431480.95 ± 0.03
male + female7001.59 ± 1.342861.58 ± 1.10
FSHfemale3487.20 ± 6.641387.21 ± 6.13
male3577.25 ± 6.921487.27 ± 6.64
male + female7057.22 ± 6.802867.24 ± 6.46
ANDmale21367.41 ± 7.3216397.11 ± 7.01
SKAmale21365.40 ± 5.5316394.54 ± 4.88
Age = age at sampling in days, CORT = log-transformed cortisol, TEST = log-transformed testosterone, EST = log-transformed estradiol, LH = log-transformed luteinizing hormone, FSH = log-transformed follicle-stimulating hormone, AND = log-transformed androstenone, SKA = log-transformed skatole.
Table 3. h2, rg and rp of boar taint compounds and hormone concentrations in Landrace (LR) and Large White (LW).
TraitBreedANDSKACORTTESTESTLHFSH
ANDLR0.52(0.07)0.42(0.11)−0.18(0.28)0.62(0.91)0.49(0.33)0.11(0.20)0.30(0.19)
LW0.44(0.07)0.57(0.12)0.08(0.26)0.83(0.34)0.46(0.27)0.32(n.E.)0.30(0.25)
SKALR0.34 0.40(0.06)−0.21(0.30)0.93(n.E.)0.95(0.40)−0.16(0.21)−0.14(0.20)
LW0.27 0.34(0.07)0.38(0.30)0.27(0.36)0.03(0.30)0.45(n.E.)0.01(0.29)
CORTLR−0.01 −0.01 0.11(0.08)−0.35(n.E.)0.01(0.60)−0.27(0.42)0.03(0.37)
LW0.02 0.02 0.35(0.17)−0.03(0.48)−0.26(0.41)−0.42(n.E.)−0.58(0.38)
TESTLR0.32 0.28 −0.02 0.03(0.08)0.89(n.E.)0.11(0.86)0.11(0.72)
LW0.52 0.29 0.12 0.23(0.18)0.58(0.34)0.01(n.E.)−0.06(0.45)
ESTLR0.36 0.41 0.06 0.65 0.09(0.08)−0.22(0.42)−0.13(0.42)
LW0.47 0.27 0.04 0.76 0.42(0.25)−0.04(n.E.)0.17(0.39)
LHLR0.10 −0.03 0.07 −0.32 −0.16 0.28(0.10)0.91(0.17)
LW0.15 0.12 0.07 0.24 0.15 0.04(0.19)0.66(n.E.)
FSHLR0.14 0.07 −0.08 0.14 0.17 0.42 0.28(0.09)
LW0.20 0.03 −0.04 0.15 0.13 0.52 0.37(0.17)
h2 (± standard error) on the diagonal, rp = phenotypic correlation under the diagonal, rg = genetic correlation above the diagonal, AND = log-transformed androstenone, SKA = log-transformed skatole, CORT = log-transformed cortisol, TEST = log-transformed testosterone, EST = log-transformed estradiol, LH = log-transformed luteinizing hormone, FSH = log-transformed follicle-stimulating hormone.
Table 4. Genetic correlation (±SE) between male and female hormone concentrations.
CORTTESTESTFSHLH
Genetic correlation 0.80 (n.E.)0.91 (n.E.)0.42 (n.E.)0.75 (±0.59)0.88 (±0.43)
CORT = log-transformed cortisol, TEST = log-transformed testosterone, EST = log-transformed estradiol, FSH = log-transformed follicle-stimulating hormone, LH = log-transformed luteinizing hormone.
Table 5. Chromosome wide significant marker in clusters after Bonferroni correction (p < 0.05).
TraitClusterSNP NameSSCPosition (Mb)MAFVariantVariance by SNPSNP Effect (± SE)Effect AlleleGene Symbol
CORTHoLRCALGA01062392144.80.15Intron0.088−0.314 (±0.06)ANR3C1
DRGA00175742144.80.15Intron0.088−0.314 (±0.06)TNR3C1
FBF0920 *7115.20.24-0.0870.274 (±0.05)--
CASI0004483 *7115.30.17Intron0.1150.374 (±0.06)ADDX24
ALGA00450977115.60.51Intron0.0710.202 (±0.04)Aalpha-1-antiproteinase-like
FBF09657115.60.51-0.0690.199 (±0.04)--
HoLWFBF0971 *7115.60.18-0.1230.375 (±0.06)--
H3GA00232837115.60.72Intron0.077−0.233 (±0.05)GSERPINA11
FBF09747115.60.72-0.077−0.233 (±0.05)--
MARC0043760*7115.60.78Intron0.109−0.326 (±0.06)GSERPINA11
FBF09737-0.71-0.076−0.231 (±0.05)--
HoLRHDIAS00036151833.3 0.35n.m.0.038−0.137 (±0.03)G-
TESTHoLRCASGA0001286114.90.57Intron0.0810.183 (±0.04)AAKAP12
DRGA0000172115.00.57Intron0.0810.183 (±0.04)TAKAP12
ALGA0001286115.00.43intergenic0.082−0.184 (±0.04)C-
ASGA00012971150.60.43intergenic0.082−0.184 (±0.04)C-
ALGA00444147106.50.04intergenic0.0840.487 (±0.10)T-
INRA00280357113.10.04n.m.0.0840.487 (±0.10)C-
HoLWASGA00730341633.90.40intergenic0.0740.250 (±0.05)G-
ASGA00730361634.00.40intergenic0.0740.250 (±0.05)A-
MARC00565211634.20.39UGV0.0790.263 (±0.06)GGranzyme K
ALGA01169421634.70.37Intron0.0690.242 (±0.05)CPLPP1
ASGA00730651635.00.37Intron0.0680.241 (±0.05)GIL31RA
ALGA00902911635.10.37Intron0.0680.238 (±0.05)TIL6ST
ASGA00965891635.30.37Intron0.0680.241 (±0.05)CANKRD55
SIRI00008521637.00.41n.m.0.0780.249 (±0.05)A-
ESTHoLRHMARC0051573669.50.39Intron0.044−0.274 (±0.06)TSLC2A5
ASGA00756941719.60.10NCTEV 0.0480.445 (±0.10)TENSSSCG00000048560
LHHoLRHALGA003851079.50.21Intron0.043−0.159 (±0.04)APHACTR1
FSHHoLRCMARC00798711058.10.01intergenic0.0690.628 (±0.14)C-
HoLWDBNP00022087117.90.19Intron0.0650.146 (±0.03)CVRK1
SKABTLRHM1GA002007414140.50.69UGV0.035−0.233 (±0.04)ALRRC27
MARC002875614140.60.69Intron0.035−0.233 (±0.04)ALRRC27
M1GA002008014140.60.27UGV0.0350.244 (±0.05)CLRRC27, PWWP2B
M1GA002012114140.90.273’PUTR0.0350.242 (±0.05)TCFAP46
M1GA002013814141.00.27DGV0.0330.238 (±0.05)GENSSSCG00000047411
ALGA008338914141.10.27DGV0.0340.239 (±0.05)TADGRA1
INRA004862214141.10.27Intron0.0340.239 (±0.05)TKNDC1
ASGA006830214141.20.27UGV0.0340.239 (±0.05)GADAM8, TUBGCP2
H3GA004362014141.20.27intergenic0.0340.239 (±0.05)G-
ASGA006830814141.30.27Intron0.0340.239 (±0.05)GCALY
H3GA004363414141.30.273’PUTR0.0340.239 (±0.05)TECHS1
H3GA004363214141.30.27Intron0.0340.239 (±0.05)AMTG1
INRA004861414152.90.27n.m.0.0340.239 (±0.05)G-
HoLRC = hormone dataset Landrace from a commercial breeding organization, HoLW = hormone dataset Large White from commercial and herd book organizations, HoLRH = hormone dataset Landrace from herd book organizations, BTLRH = boar taint dataset Landrace from herd book organizations, CORT = log-transformed cortisol, TEST = log-transformed testosterone, EST = log-transformed estradiol, LH = log-transformed luteinizing hormone, FSH = log-transformed follicle-stimulating hormone, SKA = log-transformed skatole, SSC = Sus Scrofa Chromosome, MAF = Minor allele frequency, * = also genome-wide significant, n.m. = not mapped, UGV = upstream gene variant, NCTEV = non coding transcript exon variant, 3’PUTR = 3’ prime untranslated region, DGV = downstream gene variant. Genome-wide association analysis (GWAS) for TEST revealed six chromosome-wide significant markers for Cluster HoLRC and eight chromosome-wide significant markers for Cluster HoLW. Two markers for cluster HoLRC are located on SSC 7 at 106.5 Mb and 113.1 Mb and were an intergenic and a not mapped variant. Furthermore, four markers were located around 150 Mb on SSC 1 containing two introns and two intergenic variants. For Cluster HoLW, seven markers were located in a region from 33.9 Mb to 35.3 Mb on SSC 16 and contained four intron variants, two intergenic variants, and one upstream gene variant (UGV). The last variant was located at 37.0 Mb and it was not mapped.
Publisher’s Note: MDPI stays neutral with regard to jurisdictional claims in published maps and institutional affiliations.

