Regulatory Roles of SREBF1 and SREBF2 in Lipid Metabolism and Deposition in Two Chinese Representative Fat-Tailed Sheep Breeds


Abstract
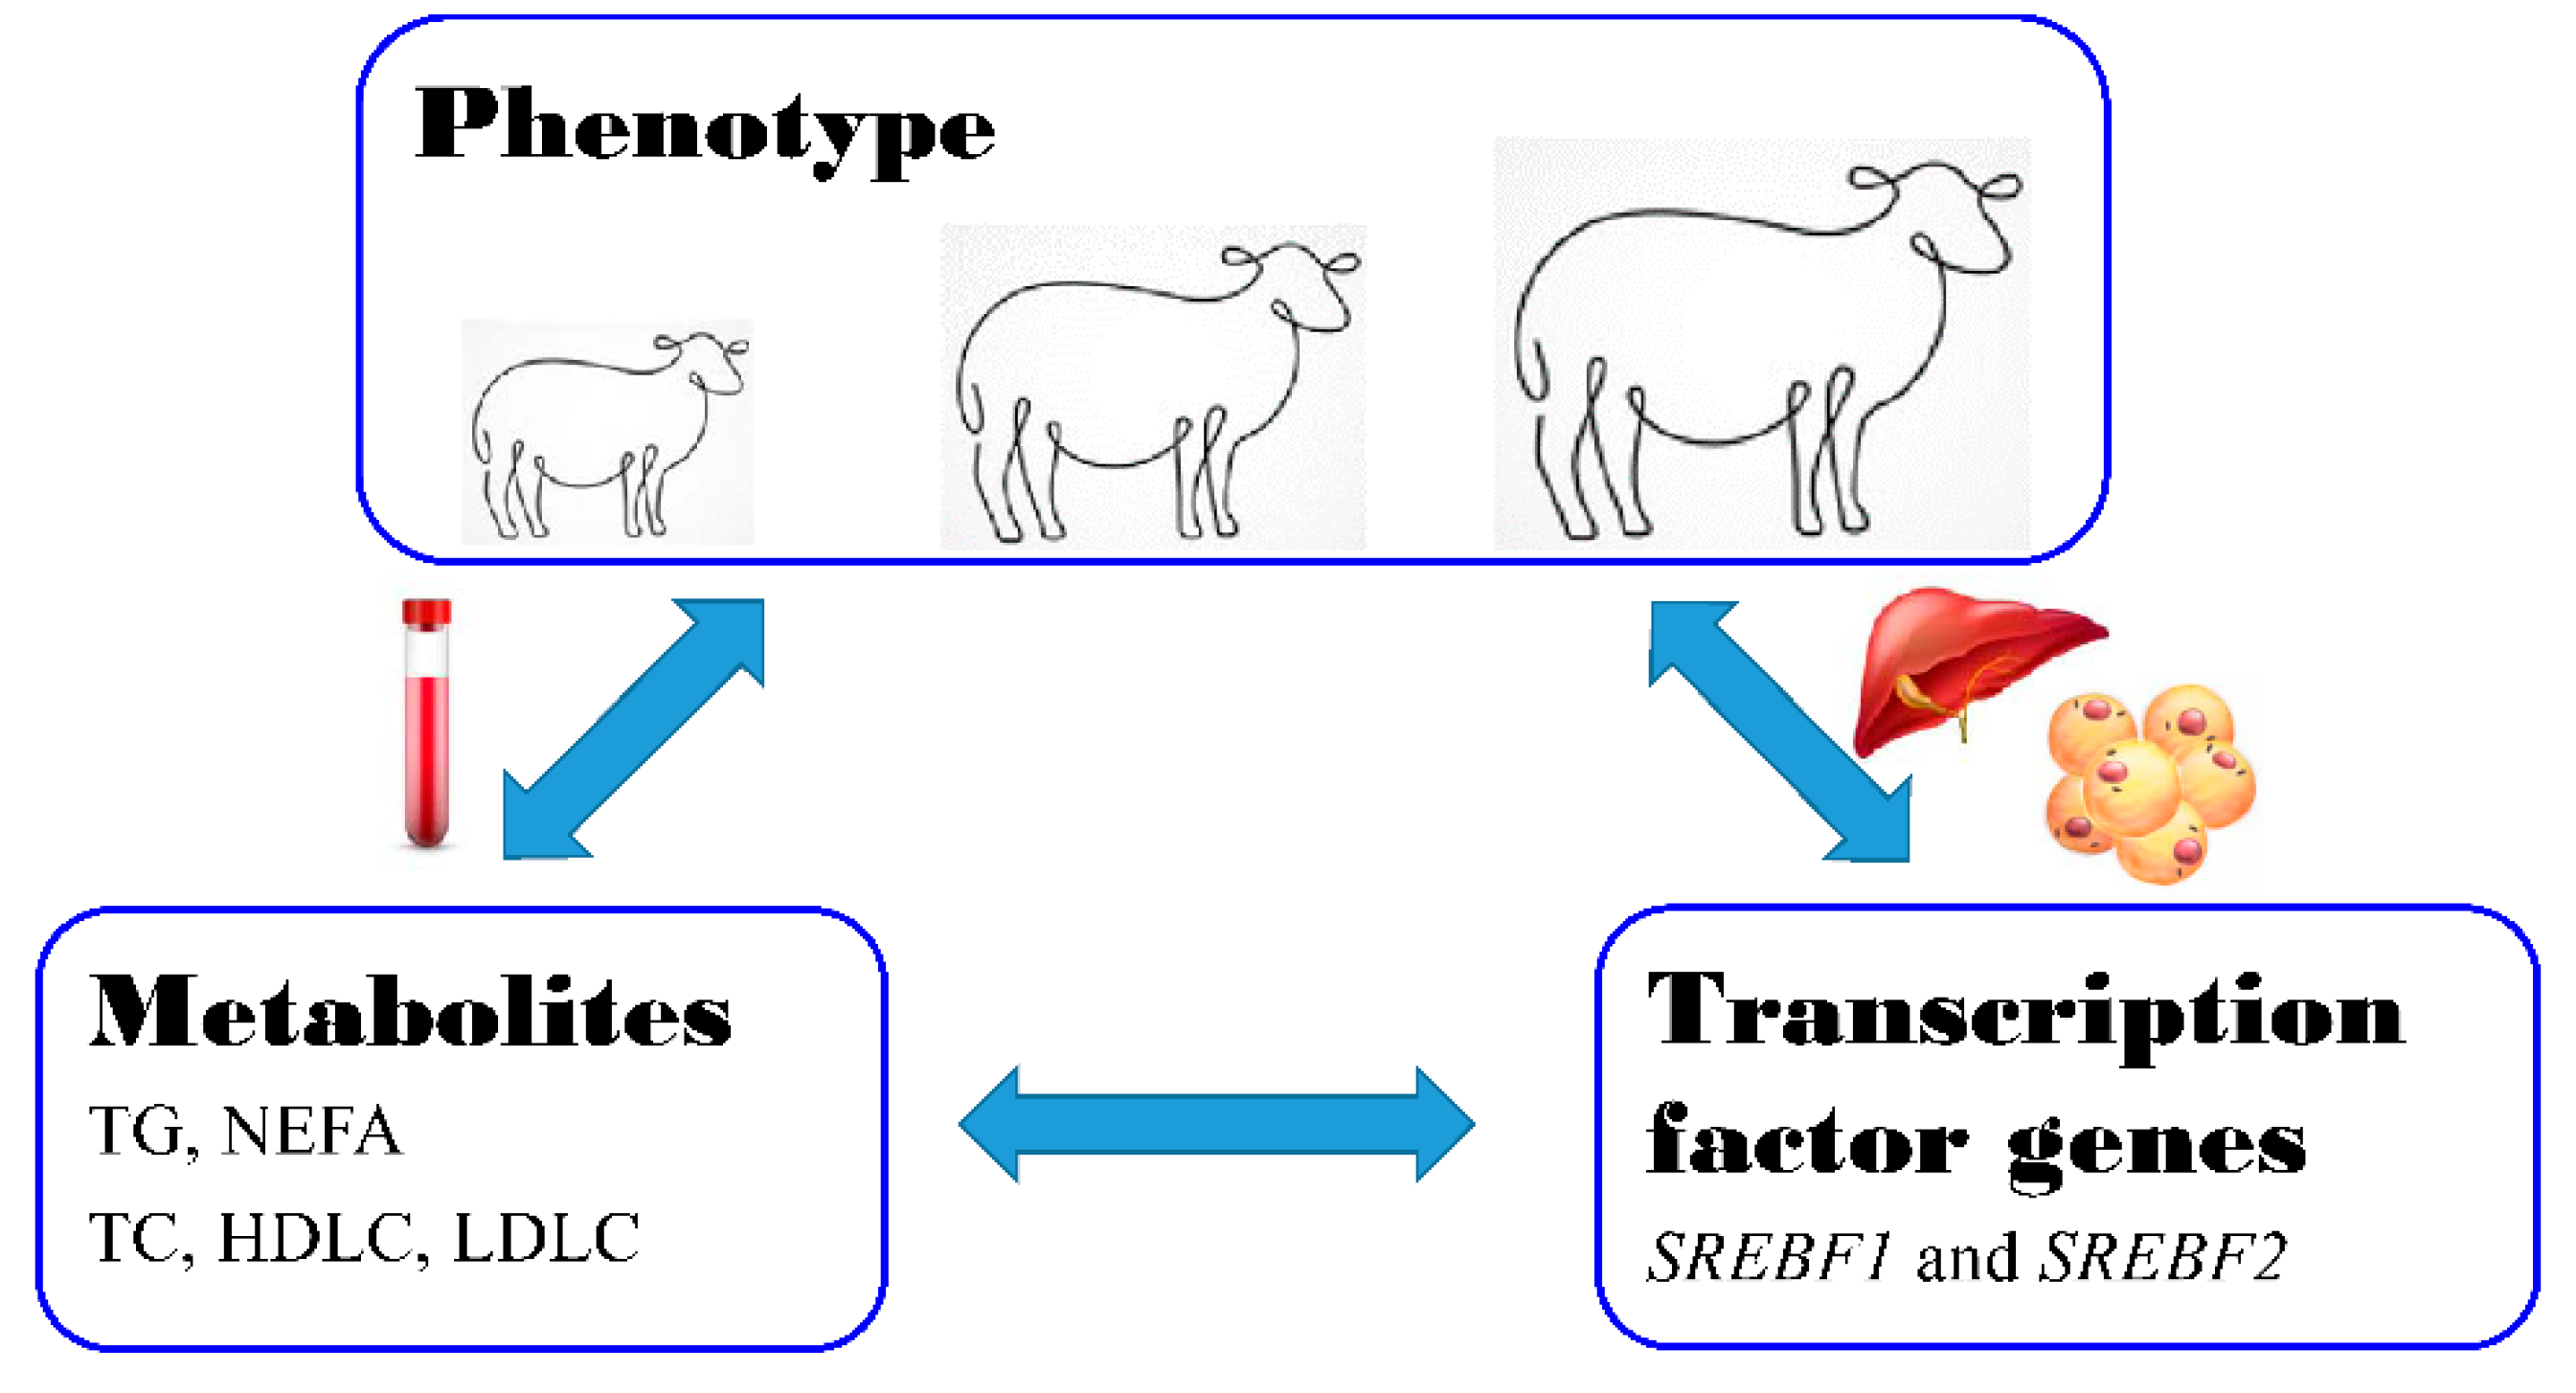
:Simple Summary
Abstract

1. Introduction
2. Materials and Methods
2.1. Animals and Ethical Statement
2.2. Body Measurement
2.3. Serum and Tissues Collection
2.4. Measurement of Serum Biochemical Parameters
2.5. RNA Extraction and Real-Time RT-PCR
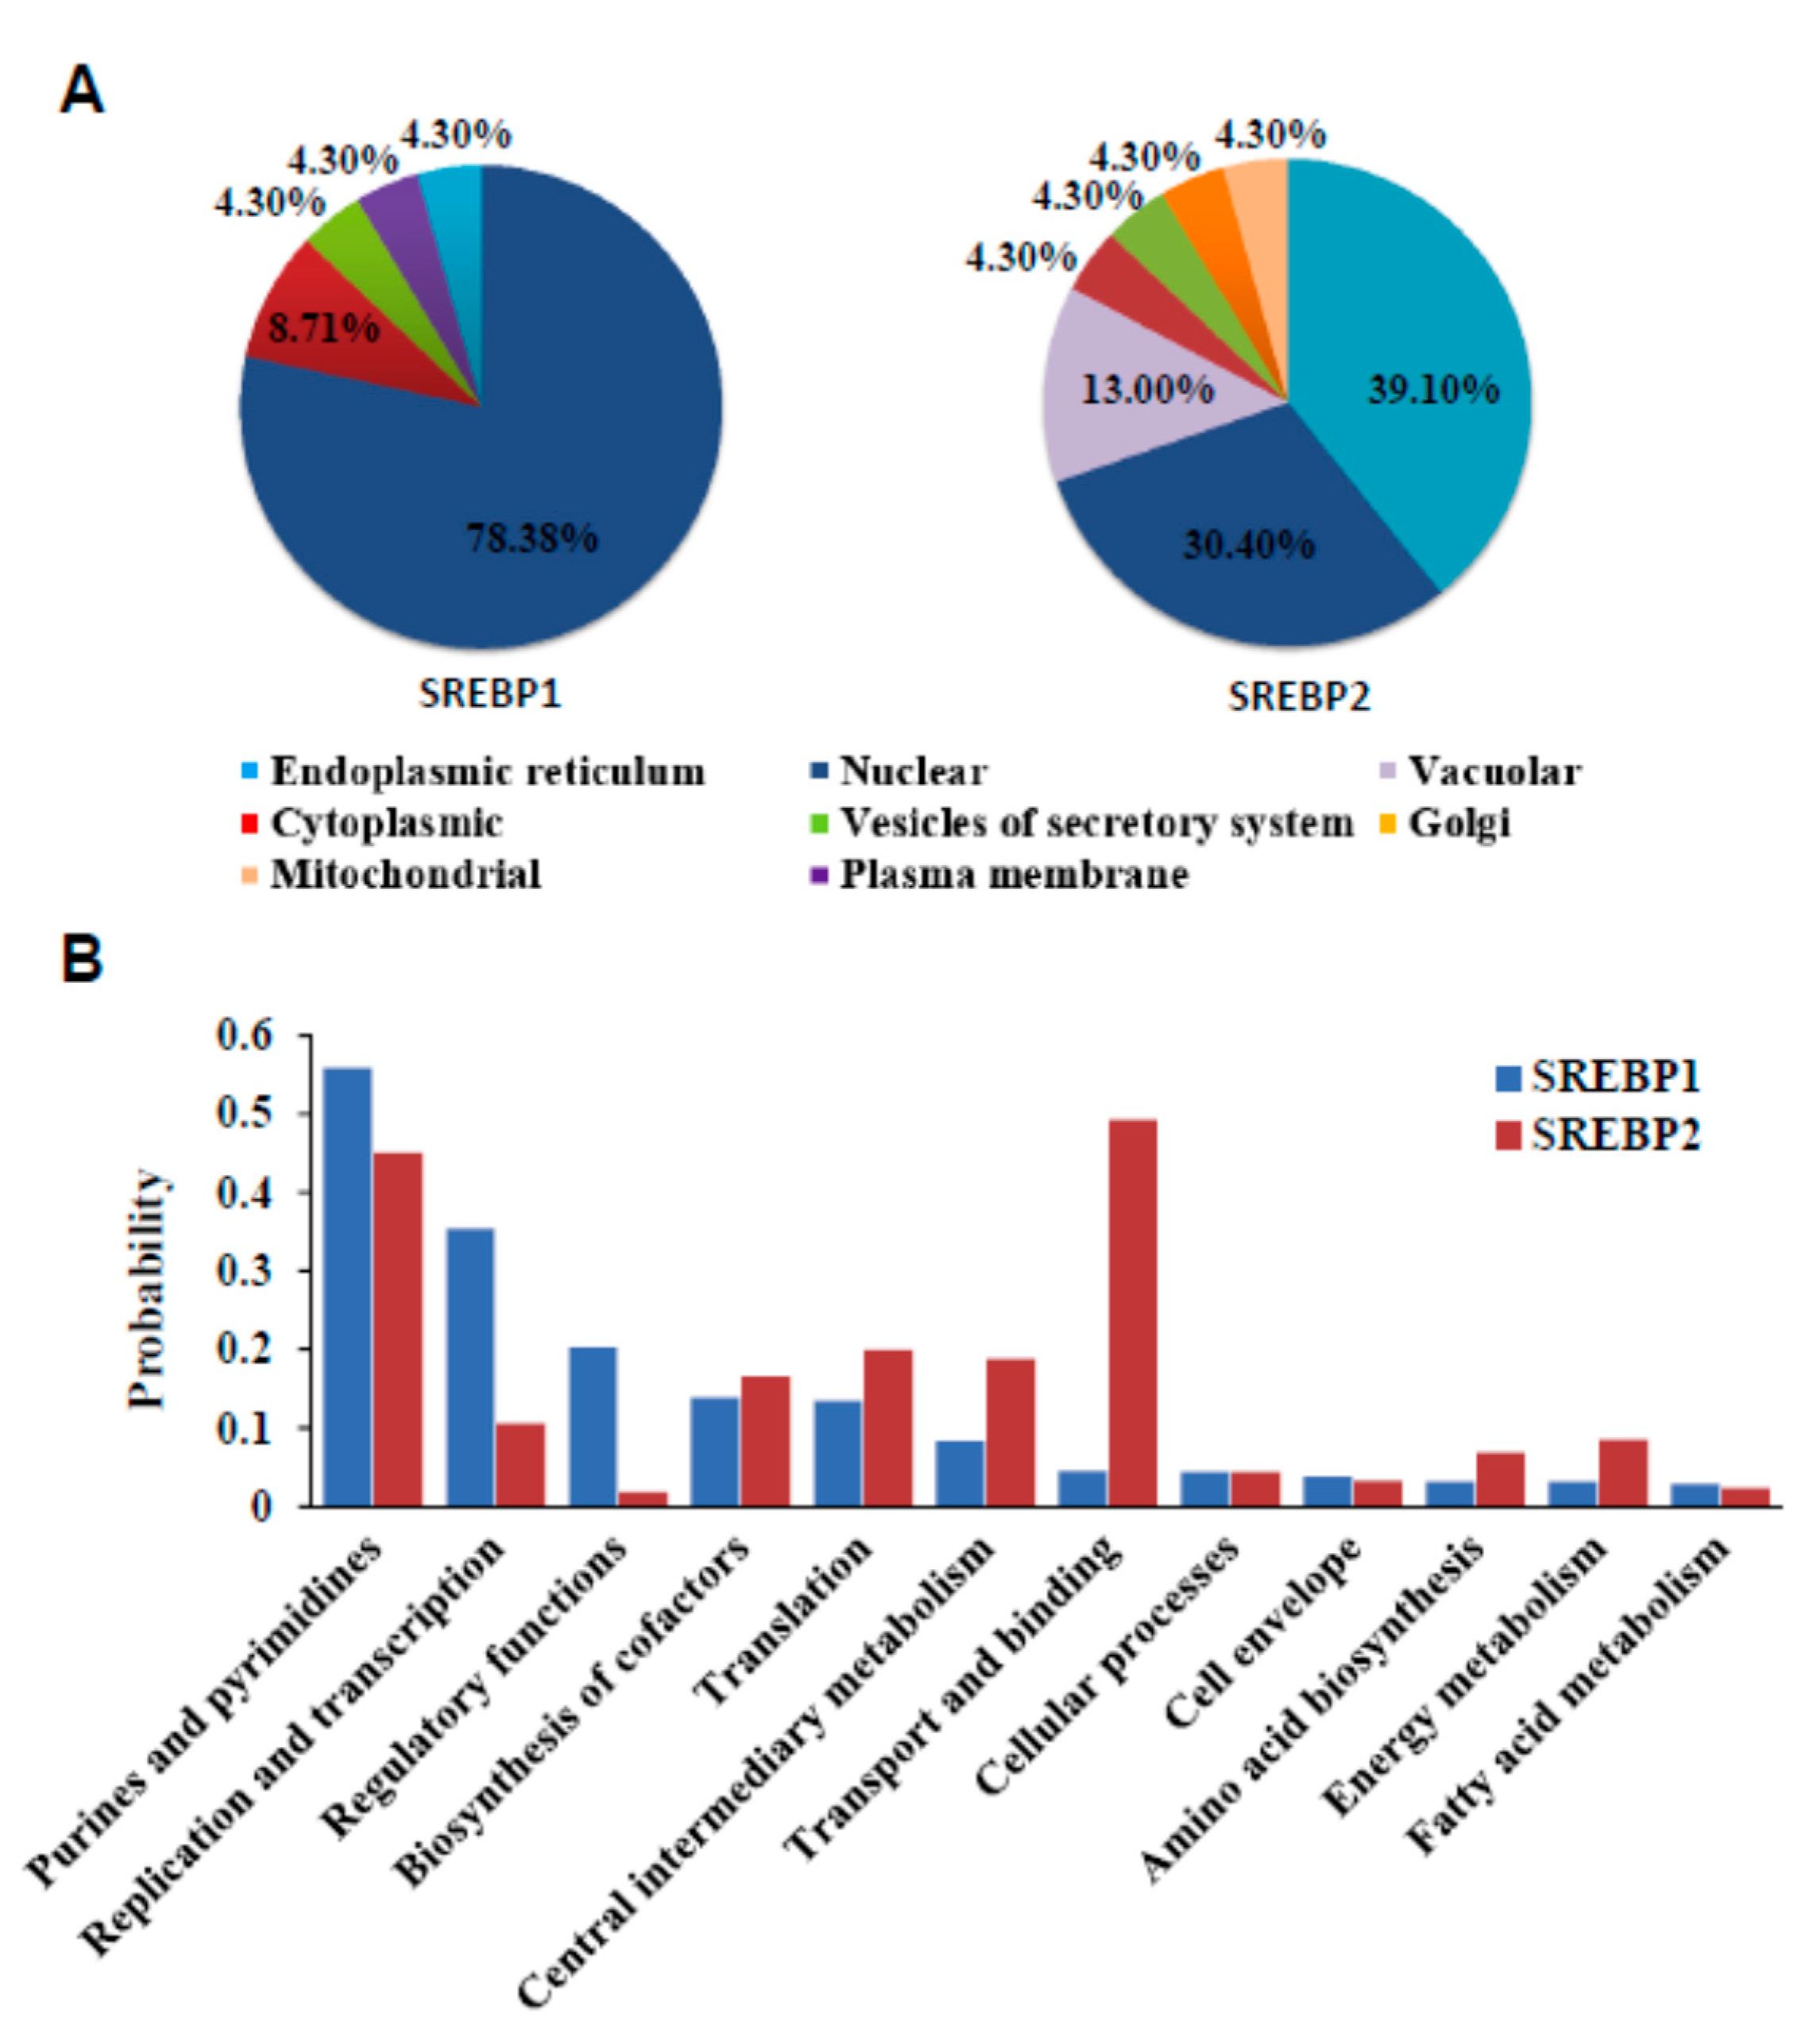
2.6. Prediction of SREBP1/2 Subcellular Localization and Function
2.7. Statistical Analysis
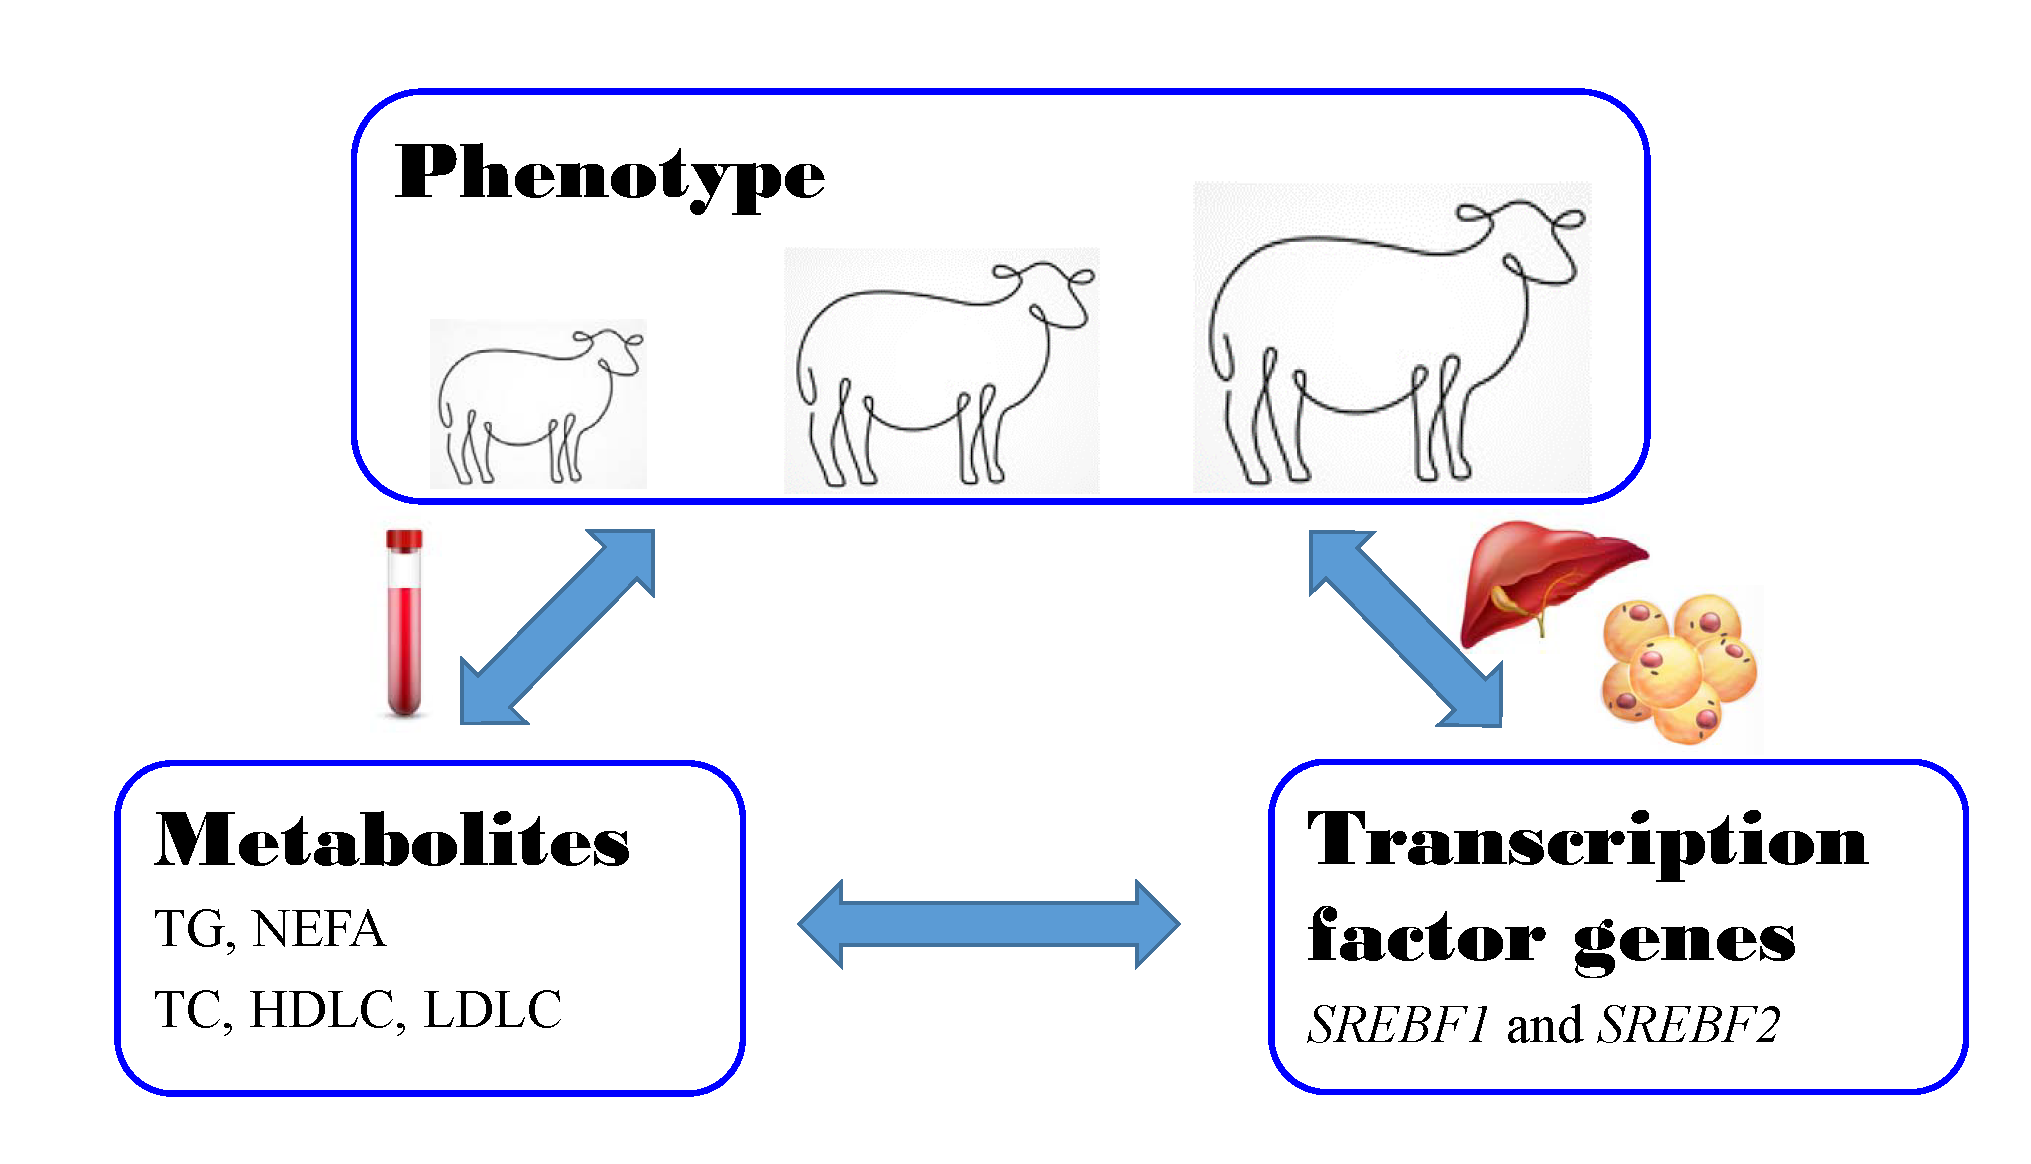
3. Results
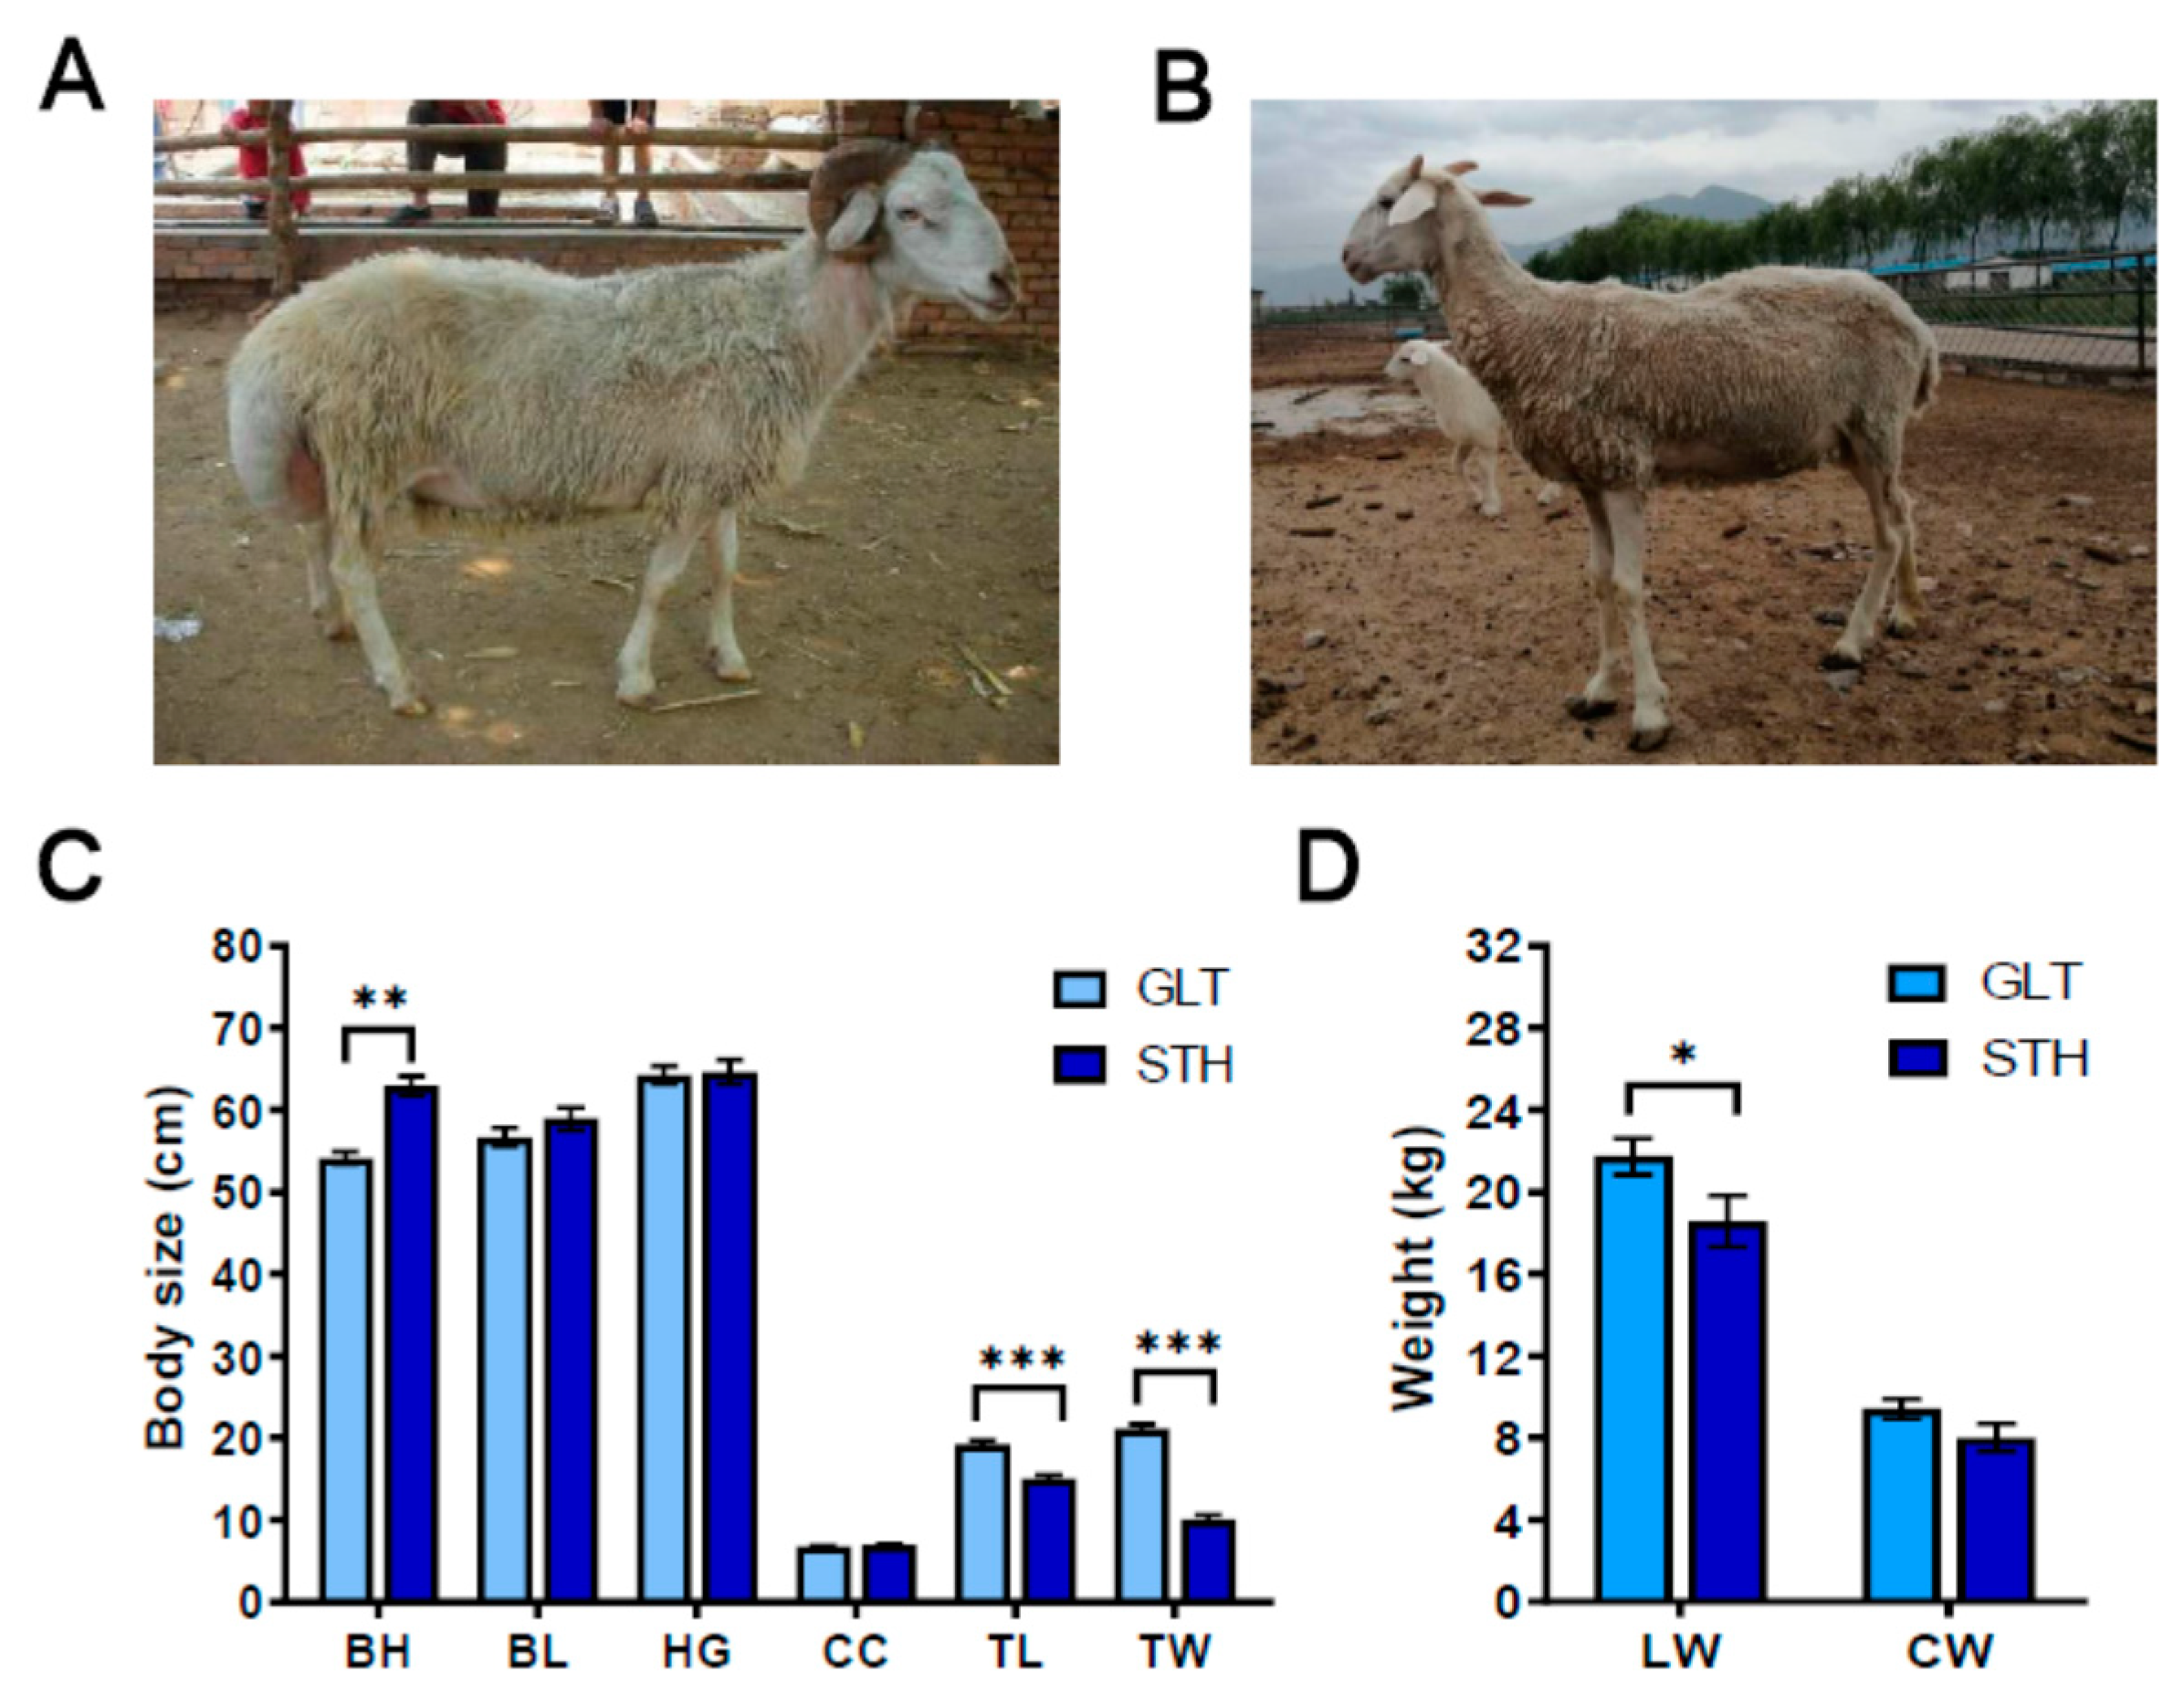
3.1. Body Size and Weight in the Two Fat-Tailed Breeds
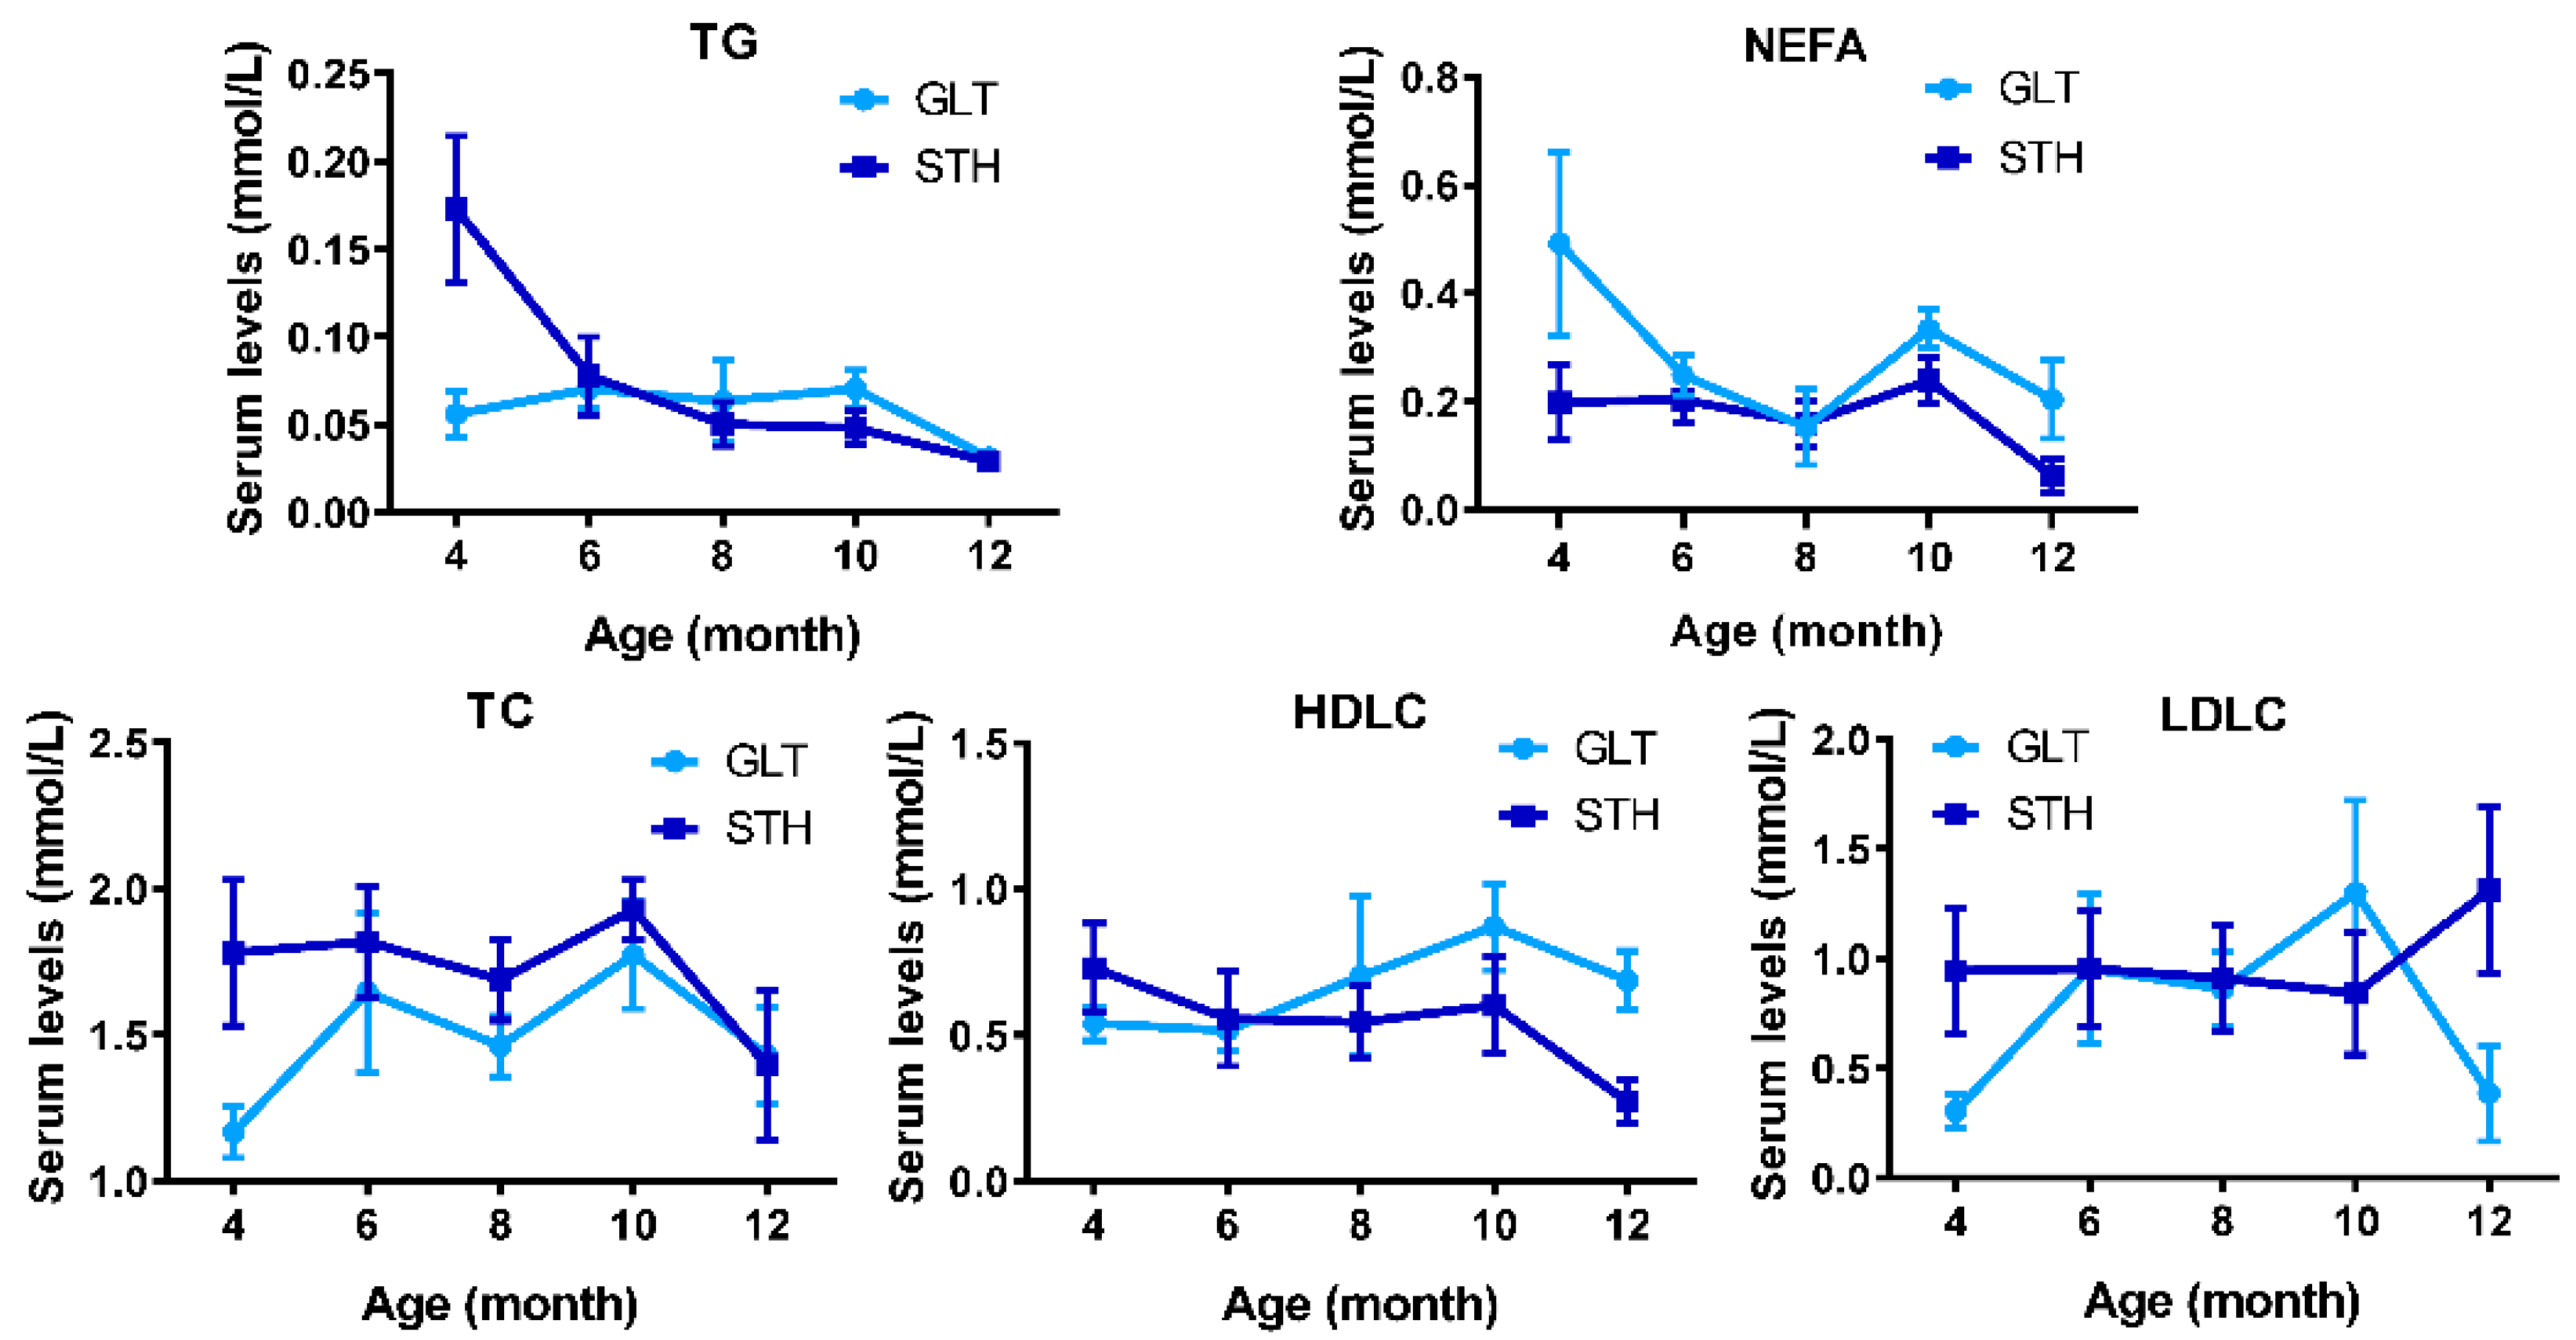
3.2. Dynamical Changes of Serum Lipid Metabolism Indices on Fat-Tailed Sheep
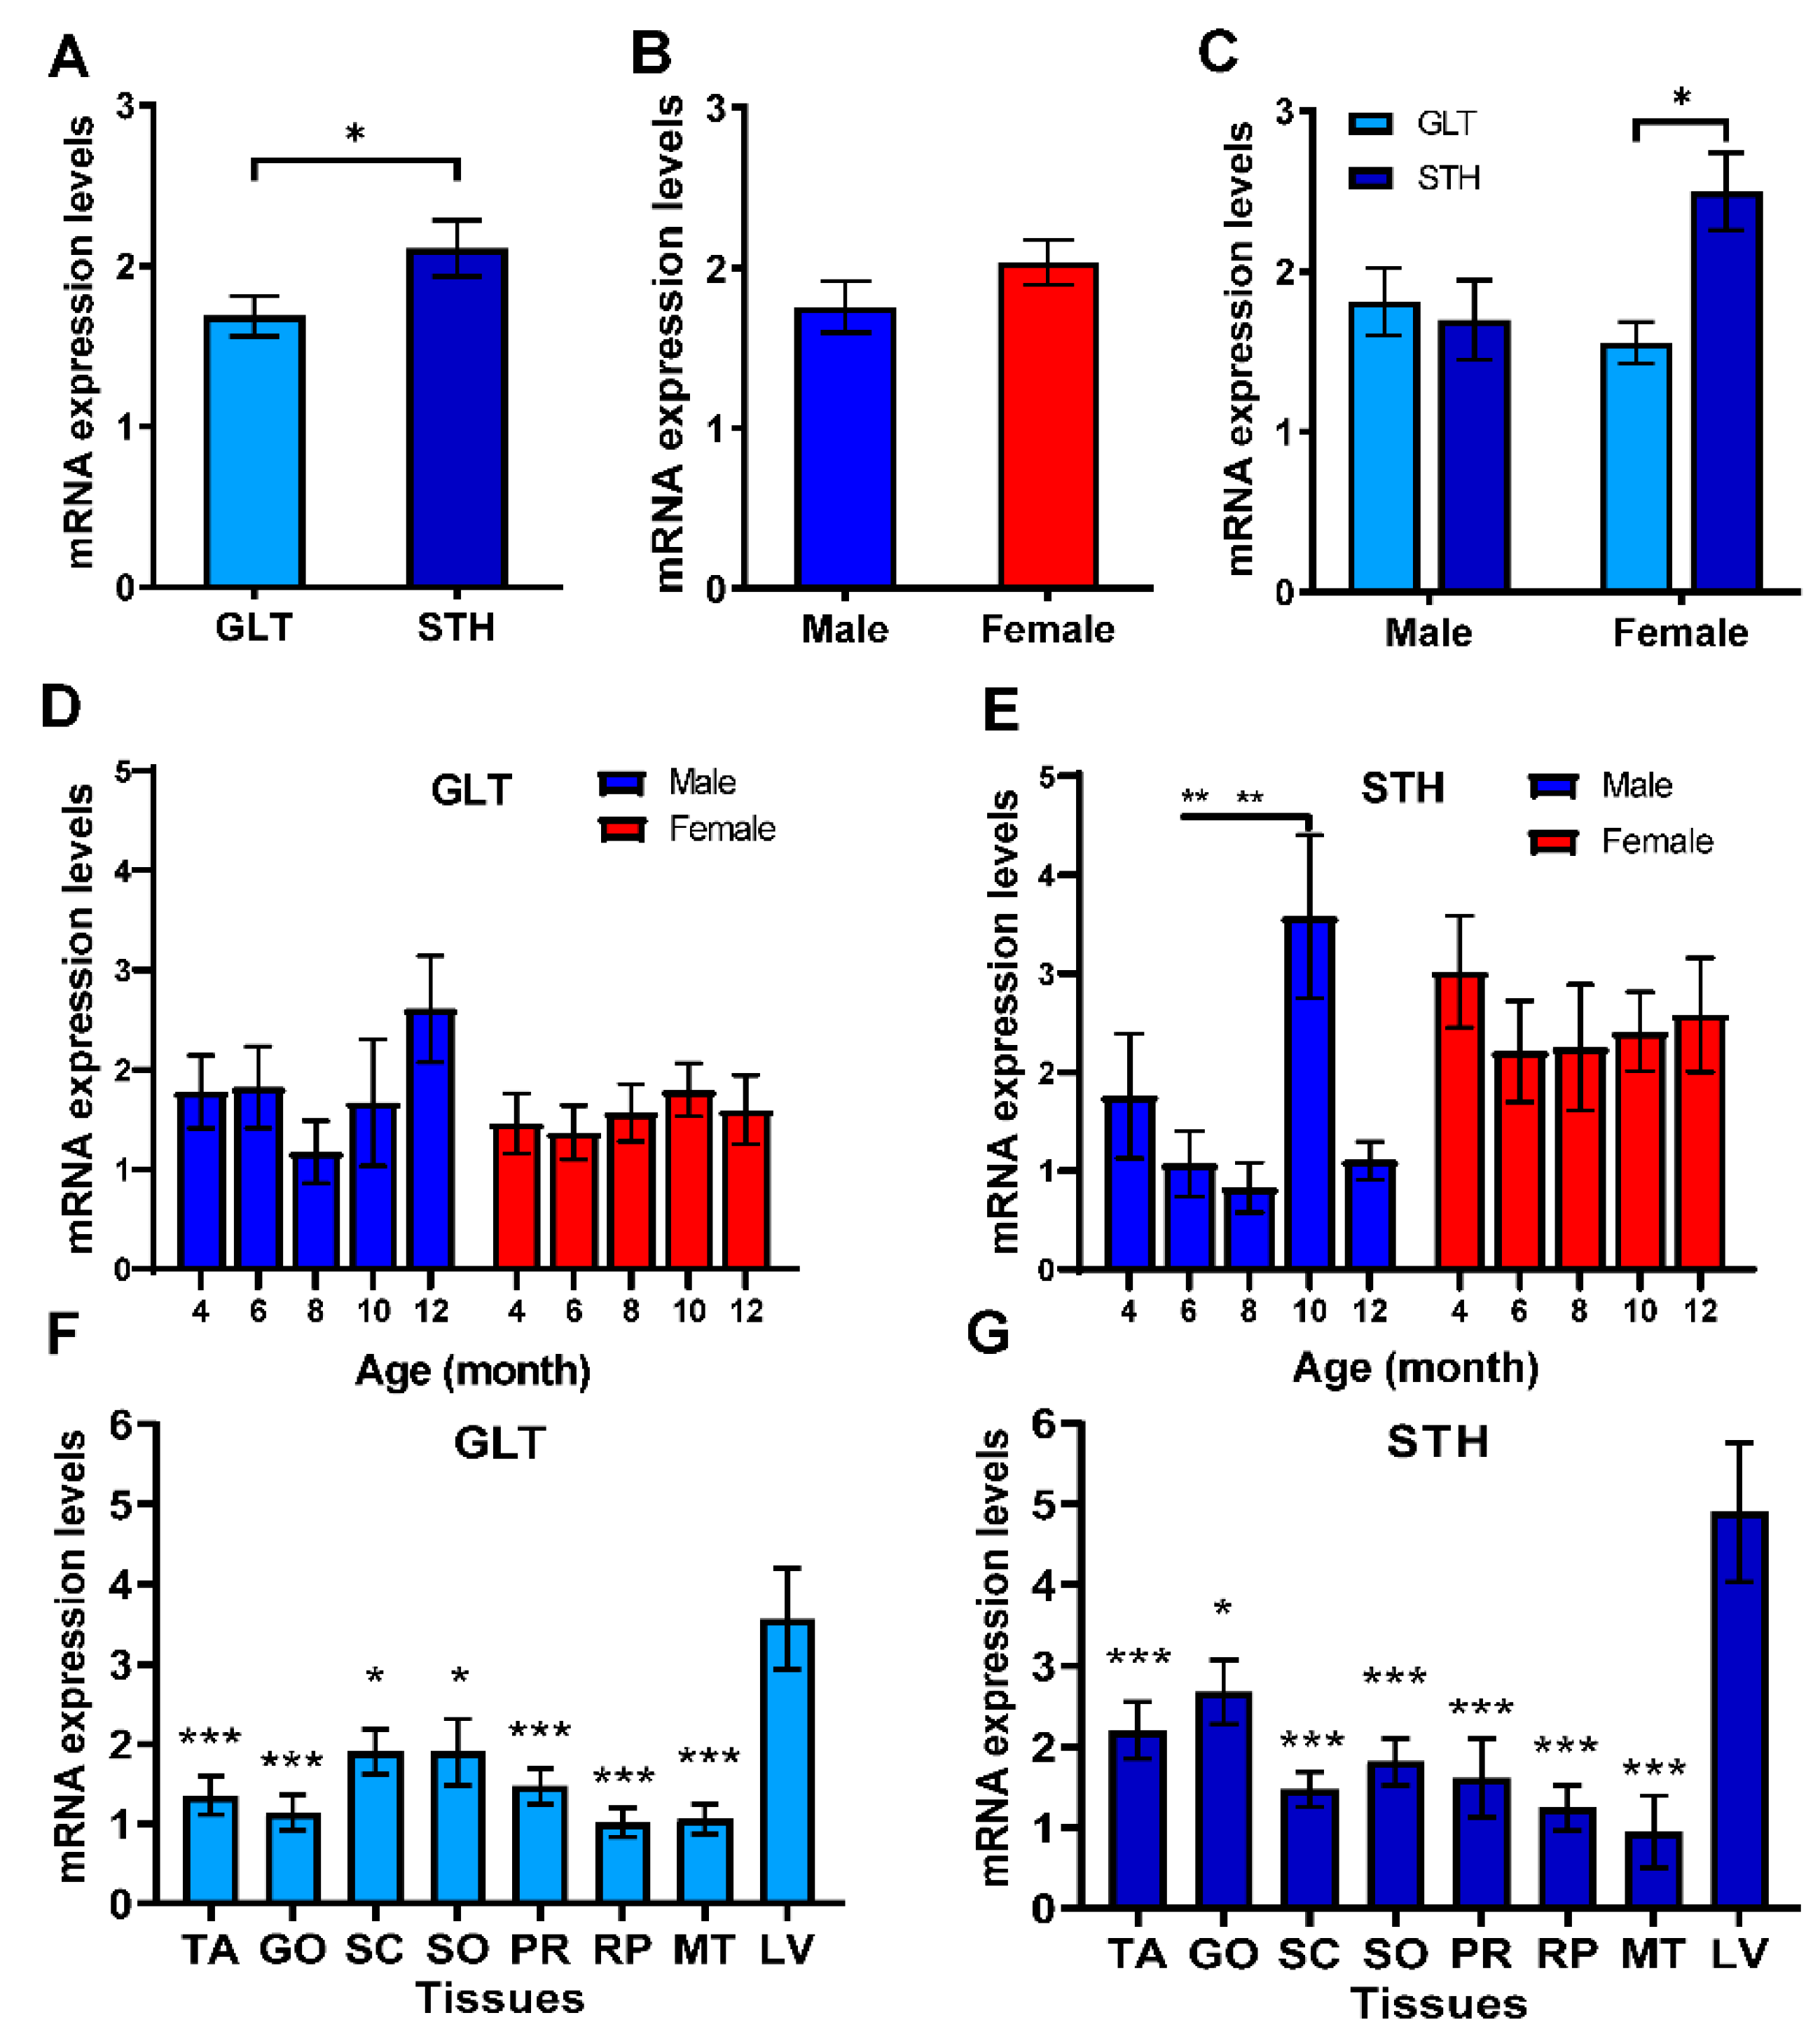
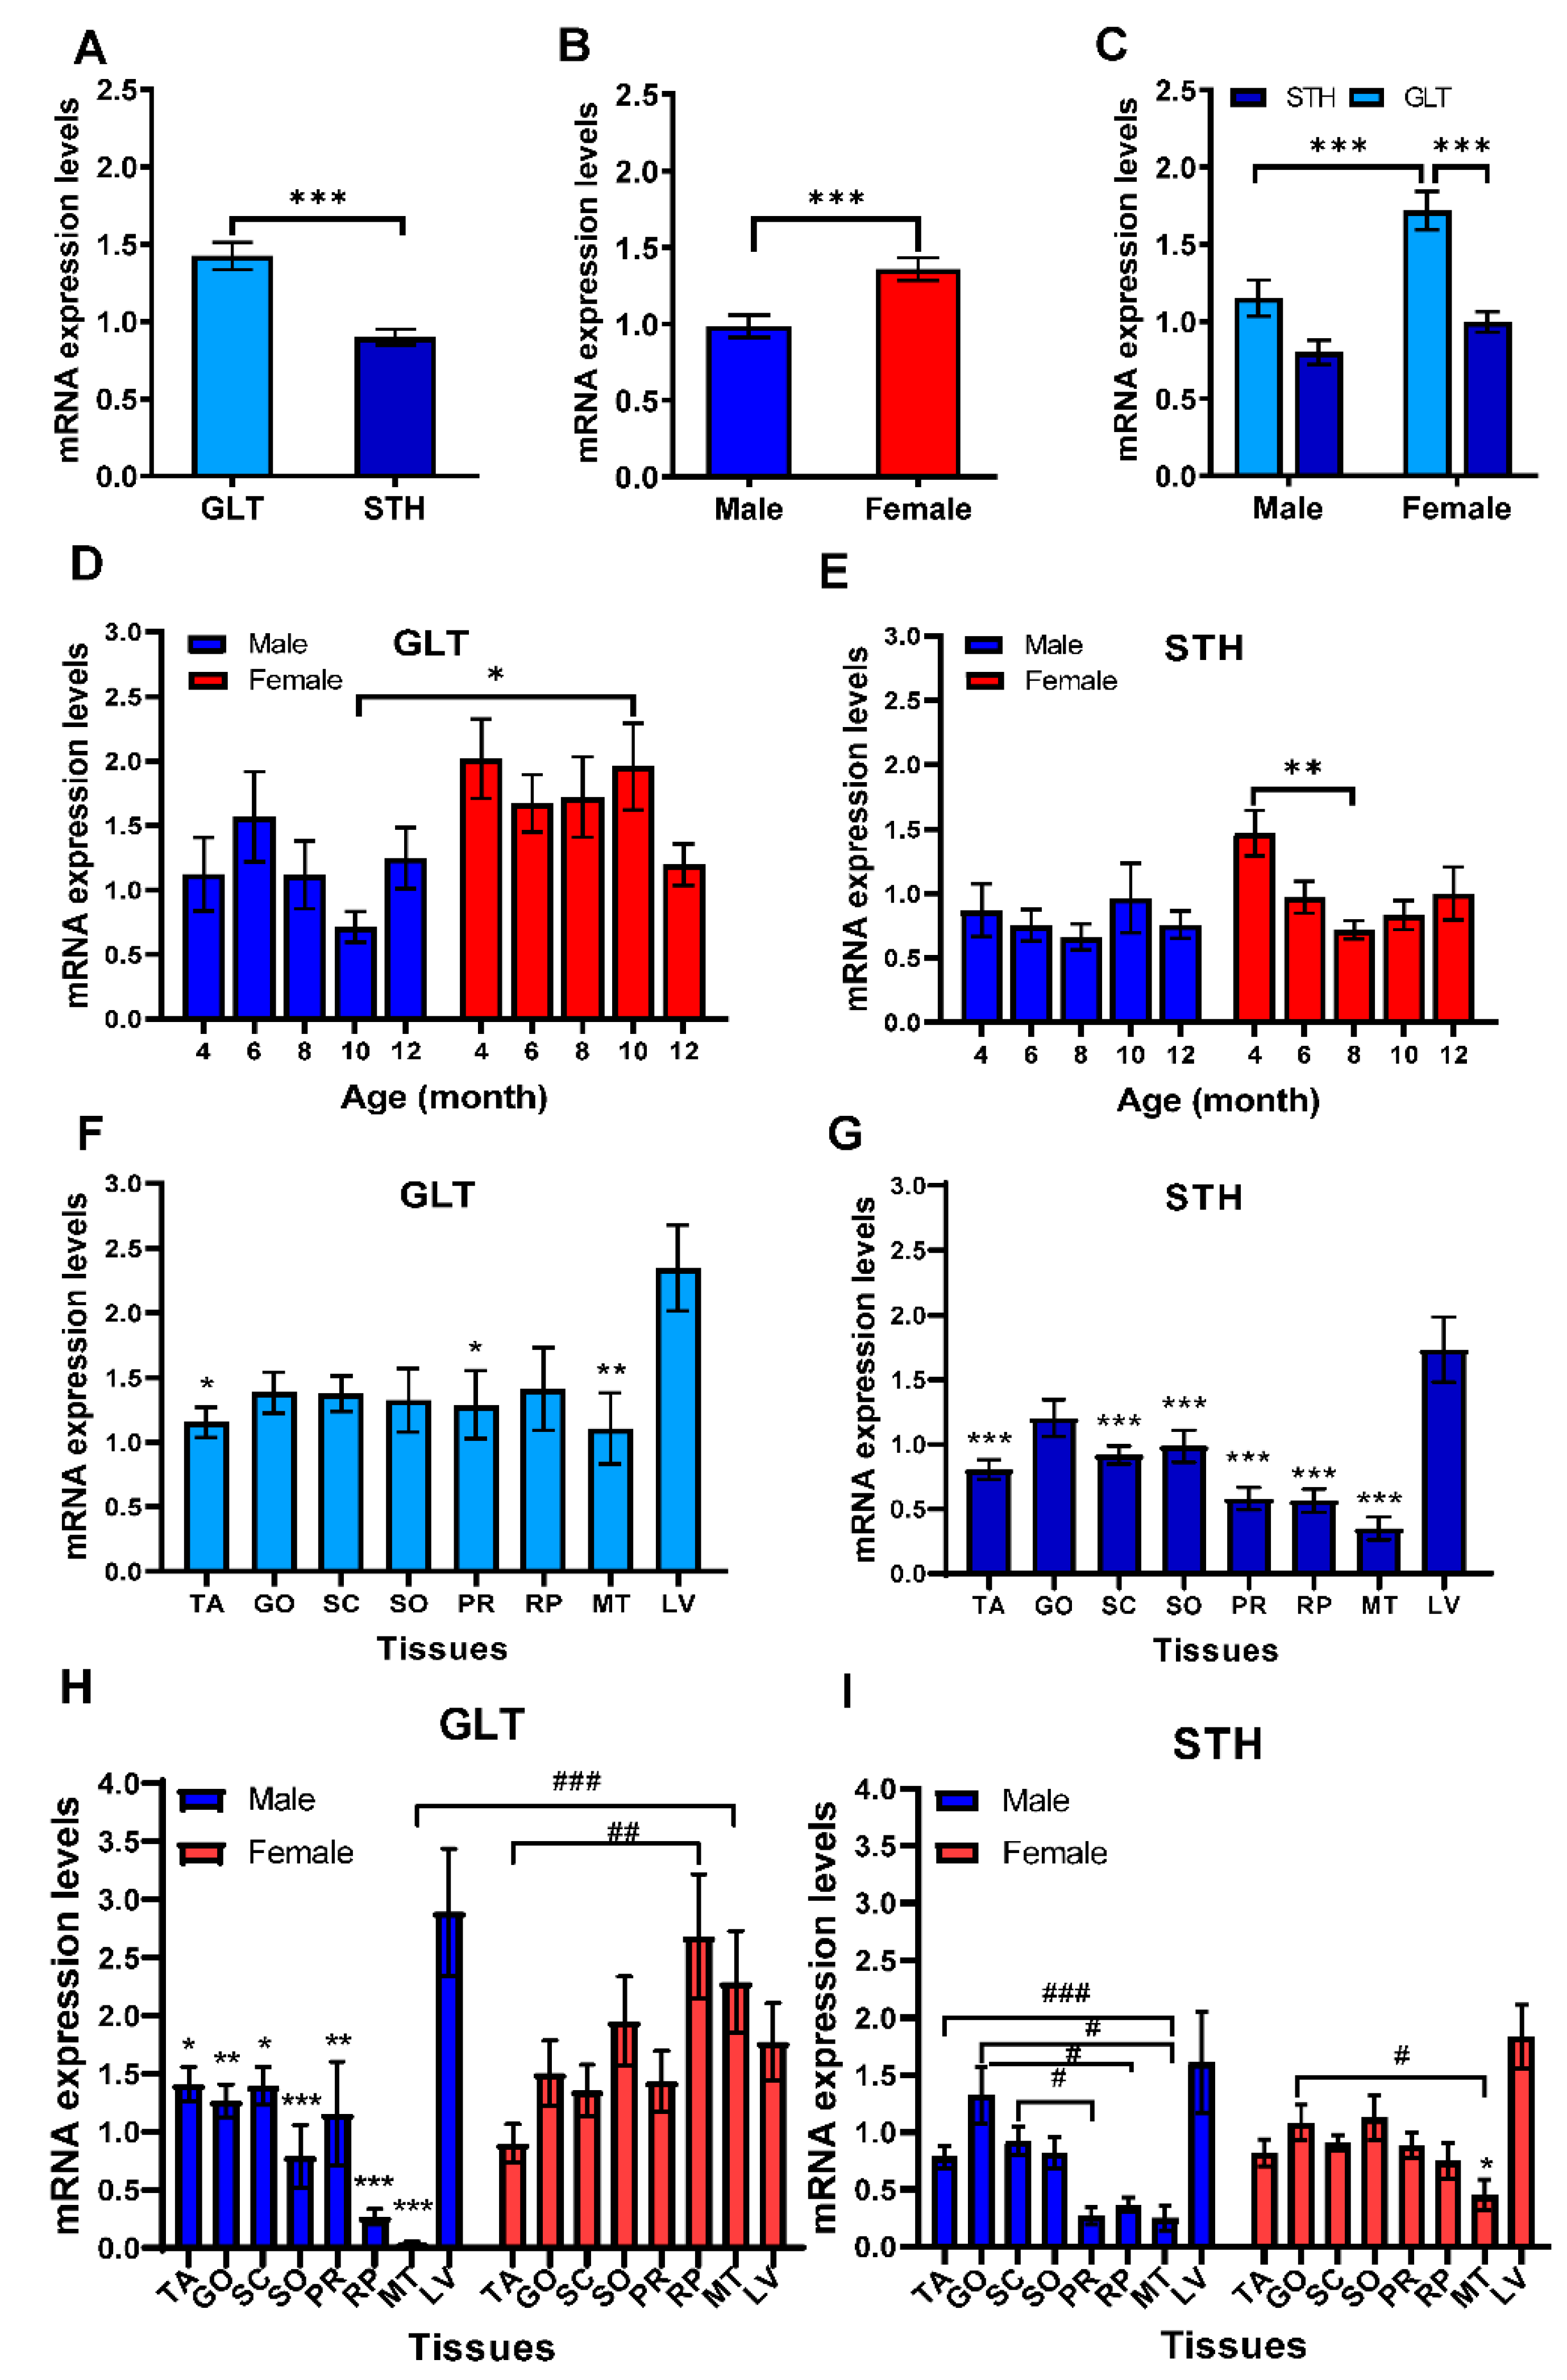
3.3. The mRNA Expression Profile of SREBF1 in Liver and Fat Tissues
3.4. mRNA Expression Levels of SREBF2 in Liver and Adipose Tissues
3.5. Associations between SREBF1/2 Expressions and Slaughter and Tail Traits
3.6. Localization and Functional Prediction of SREBP1/2
4. Discussion
5. Conclusions
Supplementary Materials
Author Contributions
Funding
Acknowledgments
Conflicts of Interest
References
- Rédei, G.P. Sheep, Domesticated (Ovisaries). In Encyclopedia of Genetics, Genomics, Proteomics and Informatics, 3rd ed.; Springer: Dordrecht, The Netherlands, 2008. [Google Scholar]
- Sun, L.; Lu, S.; Bai, M.; Xiang, L.; Li, J.; Jia, C.; Jiang, H. Integrative microRNA-mRNA analysis of muscle tissues in Qianhua Mutton Merino and Small Tail Han sheep reveals key roles for oar-miR-655-3p and oar-miR-381-5p. DNA Cell Biol. 2019, 38, 423–435. [Google Scholar] [CrossRef] [PubMed]
- Li, B.; Qiao, L.; An, L.; Wang, W.; Liu, J.; Ren, Y.; Pan, Y.; Jing, J.; Liu, W. Transcriptome analysis of adipose tissues from two fat-tailed sheep breeds reveals key genes involved in fat deposition. BMC Genom. 2018, 19, 338. [Google Scholar] [CrossRef] [PubMed]
- Stachowiak, M.; Nowacka-Woszuk, J.; Szydlowski, M.; Switonski, M. The ACACA and SREBF1 genes are promising markers for pig carcass and performance traits, but not for fatty acid content in the longissimus dorsi muscle and adipose tissue. Meat Sci. 2013, 95, 64–71. [Google Scholar] [CrossRef]
- Chu, Y.J.; Gómez, R.L.; Huang, P.; Wang, Z.C.; Xu, Y.C.; Yao, X.; Bao, M.H.; Yan, J.; Song, H.Y.; Wang, G. Liver Med23 ablation improves glucose and lipid metabolism through modulating FOXO1 activity. Cell Res. 2014, 24, 1250–1265. [Google Scholar] [CrossRef] [PubMed]
- Bandyopadhyay, G.K.; Lu, M.; Avolio, E.; Siddiqui, J.A.; Gayen, J.R.; Wollam, J.; Vu, C.U.; Chi, N.W.; O’Connor, D.T.; Mahata, S.K. Pancreastatin-dependent inflammatory signaling mediates obesity-induced insulin resistance. Diabetes 2015, 64, 104–116. [Google Scholar] [CrossRef] [PubMed] [Green Version]
- Horton, J.D.; Goldstein, J.L.; Brown, M.S. SREBPs: Activators of the complete program of cholesterol and fatty acid synthesis in the liver. J. Clin. Invest. 2002, 109, 1125–1131. [Google Scholar] [CrossRef]
- Lee, Y.S.; Lee, H.H.; Park, J.; Yoo, E.J.; Glackin, C.A.; Choi, Y.I.; Jeon, S.H.; Seong, R.H.; Park, S.D.; Kim, J.B. Twist2, a novel ADD1/SREBP1c interacting protein, represses the transcriptional activity of ADD1/SREBP1c. Nucleic Acids Res. 2003, 31, 7165–7174. [Google Scholar] [CrossRef] [Green Version]
- Bengoechea-Alonso, M.T.; Ericsson, J. The phosphorylation-dependent regulation of nuclear SREBP1 during mitosis links lipid metabolism and cell growth. Cell Cycle 2016, 15, 2753–2765. [Google Scholar] [CrossRef] [Green Version]
- Tang, J.J.; Li, J.G.; Qi, W.; Qiu, W.W.; Li, P.S.; Li, B.L.; Song, B.L. Inhibition of SREBP by a small molecule, betulin, improves hyperlipidemia and insulin resistance and reduces atherosclerotic plaques. Cell Metab. 2011, 13, 44–56. [Google Scholar] [CrossRef] [Green Version]
- Aslanidis, C.; Buechler, C. Sterol regulatory elementbinding protein 2 (SREBP2) activation after excess triglyceride storage induces chemerin in hypertrophic adipocytes. Endocrinology 2011, 152, 2635. [Google Scholar]
- Yuan, Y.N.; Liu, W.Z.; Liu, J.H.; Qiao, L.Y.; Wu, J.L. Cloning and ontogenetic expression of the uncoupling protein 1 gene UCP1 in sheep. J. Appl. Genet. 2012, 53, 203–212. [Google Scholar] [CrossRef] [PubMed]
- Ramosa, Z.; De-Barbieria, I.; Lierb, E.; Montossia, F. Carcass and meat quality traits of grazing lambs are affected by supplementation during early post-weaning. Lancet Infect. Dis. 2020, 184, 106047. [Google Scholar] [CrossRef]
- Nejati-Javaremi, A.; Izadi, F.; Rahmati, G.H.; Moradi, M. Selection in fat-tailed sheep based on two traits of fat-tail and body weight versus single-trait total body weight. Int. J. Agric. Biol. 2007, 9, 645–648. [Google Scholar]
- Ermias, E.; Yami, A.; Rege, J.E. Fat deposition in tropical sheep as adaptive attribute to periodic feed fluctuation. J. Anim. Breed. Genet. 2002, 119, 235–246. [Google Scholar] [CrossRef]
- Armstrong, E.; Ciappesoni, G.; Iriarte, W.; Da-Silva, C.; Macedo, F.; Navajas, E.A.; Brito, G.; San-Julián, R.; Gimeno, D.; Postiglioni, A. Novel genetic polymorphisms associated with carcass traits in grazing Texel sheep. Meat Sci. 2018, 145, 202–208. [Google Scholar] [CrossRef]
- Wang, Q.; Wang, Y.; Hussain, T.; Dai, C.; Li, J.; Huang, P.; Li, Y.; Ding, X.; Huang, J.; Ji, F.; et al. Effects of dietary energy level on growth performance, blood parameters and meat quality in fattening male Hu lambs. J. Anim. Physiol. Anim. Nutr. 2020, 104, 418–430. [Google Scholar] [CrossRef] [PubMed]
- Zhu, H.; Wang, Z.; Wu, Y.; Jiang, H.; Zhou, F.; Xie, X.; Wang, R.; Hua, C. Untargeted metabolomics reveals intervention effects of chicory polysaccharide in a rat model of non-alcoholic fatty liver disease. Int. J. Biol. Macromol. 2019, 128, 363–375. [Google Scholar] [CrossRef] [PubMed]
- Jensen-Urstad, A.P.; Semenkovich, C.F. Fatty acid synthase and liver triglyceride metabolism: Housekeeper or messenger? Biochim. Biophys. Acta 2012, 1821, 747–753. [Google Scholar] [CrossRef] [PubMed] [Green Version]
- Chakrabarti, P.; Kandror, K.V. Adipose triglyceride lipase: A new target in the regulation of lipolysis by insulin. Curr. Diabetes Rev. 2011, 7, 270–277. [Google Scholar] [CrossRef] [PubMed]
- Langlois, M.R.; Nordestgaard, B.G.; Langsted, A.; Chapman, M.J.; Aakre, K.M.; Baum, H.; Borén, J.; Bruckert, E.; Catapano, A.; Cobbaert, C.; et al. Quantifying atherogenic lipoproteins for lipid-lowering strategies: Consensus-based recommendations from EAS and EFLM. Atherosclerosis 2019, 294, 46–61. [Google Scholar] [CrossRef] [Green Version]
- Stich, V.; Berlan, M. Physiological regulation of NEFA availability: Lipolysis pathway. Proc. Nutr. Soc. 2004, 63, 369–374. [Google Scholar] [CrossRef] [PubMed]
- Gross, J.J.; Schwinn, A.C.; Schmitz-Hsu, F.; Menzi, F.; Drögemüller, C.; Albrecht, C.; Bruckmaier, R.M. Rapid Communication: Cholesterol deficiency-associated APOB mutation impacts lipid metabolism in Holstein calves and breeding bulls. J. Anim. Sci. 2016, 94, 1761. [Google Scholar] [CrossRef] [PubMed]
- Colmenero, J.J.; Broderick, G.A. Effect of Dietary Crude Protein Concentration on Milk Production and Nitrogen Utilization in Lactating Dairy Cows. J. Dairy Sci. 2006, 89, 1704–1712. [Google Scholar] [CrossRef] [Green Version]
- Brown, M.S.; Ye, J.; Rawson, R.B.; Goldstein, J.L. Regulated intramembrane proteolysis: A control mechanism conserved from bacteria to humans. Cell 2000, 100, 391–398. [Google Scholar] [CrossRef] [Green Version]
- Jiao, X.L.; Jing, J.J.; Qiao, L.Y.; Liu, J.H.; Li, L.A.; Zhang, J.; Jia, X.L.; Liu, W.Z. Ontogenetic expression of Lpin2 and Lpin3 genes and their associations with traits in two breeds of Chinese fat-tailed sheep. Asian-australas. J. Anim. Sci. 2016, 29, 333–342. [Google Scholar]
- Zhang, J.; Jing, J.J.; Jia, X.L.; Qiao, L.Y.; Liu, J.H.; Liang, C.; Liu, W.Z. mRNA expression of ovine angiopoietin-like protein 4 gene in adipose tissues. Asian-Australas. J. Anim. Sci. 2016, 29, 615–623. [Google Scholar] [CrossRef] [Green Version]
- Pan, Y.; Jing, J.; Qiao, L.; Liu, J.; Zhao, J.; An, L.; Li, B.; Wan, W.; Liang, C.; Liu, W. miR-124-3p affects the formation of intramuscular fat through alterations in branched chain amino acid consumption in sheep. Biochem. Biophys. Res. Commun. 2018, 495, 1769–1774. [Google Scholar] [CrossRef]
- Moradi, M.H.; Nejati-Javaremi, A.; Moradi-Shahrbabak, M.; Dodds, K.G.; McEwan, J.C. Genomic scan of selective sweeps in thin and fat tail sheep breeds for identifying of candidate regions associated with fat deposition. BMC Genet. 2012, 13, 10–21. [Google Scholar] [CrossRef] [Green Version]
- Dang, R.; Jiang, P.; Cai, H.; Li, H.; Guo, R.; Wu, Y.; Zhang, L.; Zhu, W.; He, X.; Liu, Y.; et al. Vitamin D deficiency exacerbates atypical antipsychotic-induced metabolic side effects in rats: Involvement of the INSIG/SREBP pathway. Eur. Neuropsychopharmacol. 2015, 25, 1239–1247. [Google Scholar] [CrossRef]
- Li, C.; Peng, X.; Lv, J.; Zou, H.; Liu, J.; Zhang, K.; Li, Z. SREBP1 as a potential biomarker predicts levothyroxine efficacy of differentiated thyroid cancer. Biomed. Pharmacother. 2019, 123, 109791. [Google Scholar] [CrossRef]
- Shao, W.; Espenshade, P.J. Expanding roles for SREBP in metabolism. Cell Metab. 2012, 16, 414–419. [Google Scholar] [CrossRef] [PubMed] [Green Version]
- Bridges, J.P.; Schehr, A.; Wang, Y.; Huo, L.; Besnard, V.; Ikegami, M.; Whitsett, J.A.; Xu, Y. Epithelial SCAP/INSIG/SREBP signaling regulates multiple biological processes during perinatal lung maturation. PLoS ONE 2014, 9, 91376. [Google Scholar] [CrossRef] [PubMed] [Green Version]
- Osborne, T.F.; Espenshade, P.J. Evolutionary conservation and adaptation in the mechanism that regulates SREBP action: What a long, strange trip it’s been. Genes. Dev. 2009, 23, 2578–2591. [Google Scholar] [CrossRef] [PubMed] [Green Version]
- Liang, G.; Yang, J.; Horton, J.D.; Hammer, R.E.; Goldstein, J.L.; Brown, M.S. Diminished hepatic response to fasting/refeeding and liver X receptor agonists in mice with selective deficiency of sterol regulatory element-binding protein-1c. J. Biol. Chem. 2002, 277, 9520–9528. [Google Scholar] [CrossRef] [Green Version]


| Breed | Traits | Tissues | |||||||
|---|---|---|---|---|---|---|---|---|---|
| TA | GO | SC | SO | PR | RP | MT | LV | ||
| Guangling Large Tailed sheep (GLT) | TL | −0.03 | 0.67 * | 0.05 | 0.45 | −0.12 | 0.06 | 0.47 | 0.67 * |
| TW | 0.41 | 0.26 | 0.43 | 0.01 | −0.02 | 0.34 | 0.29 | 0.43 | |
| ATW | 0.65 * | 0.21 | 0.55 | 0.24 | 0.29 | 0.31 | 0.27 | 0.43 | |
| RTW | 0.65 * | 0.45 | 0.35 | 0.45 | 0.25 | 0.52 | 0.60 | 0.68 * | |
| BW | 0.10 | −0.30 | 0.28 | −0.08 | 0.11 | −0.09 | −0.16 | −0.12 | |
| CW | 0.26 | −0.22 | 0.43 | −0.16 | 0.11 | −0.19 | −0.27 | −0.10 | |
| DP | 0.39 | −0.02 | 0.51 | −0.19 | 0.14 | −0.28 | −0.43 | −0.01 | |
| Small Tailed Han sheep (STH) | TL | 0.70 | −0.34 | 0.45 | −0.35 | −0.22 | 0.30 | 0.31 | −0.21 |
| TW | 0.38 | 0.10 | 0.23 | 0.02 | 0.21 | 0.03 | −0.20 | 0.23 | |
| BW | 0.05 | 0.42 | 0.04 | 0.12 | 0.71 * | −0.17 | 0.14 | 0.64 | |
| CW | −0.01 | 0.38 | −0.01 | 0.02 | 0.73 * | −0.28 | 0.15 | 0.57 | |
| DP | −0.36 | −0.45 | −0.41 | −0.60 | −0.15 | −0.63 | 0.02 | −0.42 | |
| Breed | Traits | Tissues | |||||||
|---|---|---|---|---|---|---|---|---|---|
| TA | GO | SC | SO | PR | RP | MT | LV | ||
| Guangling Large Tailed sheep (GLT) | TL | −0.10 | 0.03 | −0.52 | −0.01 | −0.45 | −0.36 | −0.29 | −0.69 * |
| TW | −0.16 | −0.50 | −0.61 * | −0.11 | −0.53 | −0.19 | −0.27 | −0.77 * | |
| ATW | −0.34 | −0.61 * | −0.44 | −0.31 | −0.25 | −0.21 | −0.39 | −0.72 * | |
| RTW | −0.49 | −0.36 | −0.17 | −0.24 | −0.07 | −0.02 | −0.21 | −0.55 | |
| BW | 0.08 | −0.46 | −0.56 | −0.31 | −0.25 | −0.22 | −0.33 | −0.30 | |
| CW | 0.07 | −0.59 * | −0.51 | −0.24 | −0.22 | −0.30 | −0.43 | −0.50 | |
| DP | −0.03 | −0.57 | −0.30 | −0.39 | −0.18 | −0.43 | −0.41 | −0.59 | |
| Small Tailed Han sheep (STH) | TL | 0.48 | 0.49 | 0.30 | −0.07 | 0.63 | −0.09 | 0.04 | −0.20 |
| TW | 0.19 | 0.28 | 0.37 | 0.04 | 0.55 | 0.08 | 0.37 | 0.10 | |
| BW | −0.44 | 0.27 | 0.58 | 0.53 | 0.16 | −0.43 | −0.05 | 0.47 | |
| CW | −0.39 | 0.23 | 0.66 * | 0.53 | 0.24 | −0.42 | −0.04 | 0.48 | |
| DP | 0.36 | −0.27 | 0.30 | −0.14 | 0.08 | 0.21 | 0.07 | −0.12 | |
© 2020 by the authors. Licensee MDPI, Basel, Switzerland. This article is an open access article distributed under the terms and conditions of the Creative Commons Attribution (CC BY) license (http://creativecommons.org/licenses/by/4.0/).
Share and Cite
Liang, C.; Qiao, L.; Han, Y.; Liu, J.; Zhang, J.; Liu, W. Regulatory Roles of SREBF1 and SREBF2 in Lipid Metabolism and Deposition in Two Chinese Representative Fat-Tailed Sheep Breeds. Animals 2020, 10, 1317. https://doi.org/10.3390/ani10081317
Liang C, Qiao L, Han Y, Liu J, Zhang J, Liu W. Regulatory Roles of SREBF1 and SREBF2 in Lipid Metabolism and Deposition in Two Chinese Representative Fat-Tailed Sheep Breeds. Animals. 2020; 10(8):1317. https://doi.org/10.3390/ani10081317
Chicago/Turabian StyleLiang, Chen, Liying Qiao, Yongli Han, Jianhua Liu, Jianhai Zhang, and Wenzhong Liu. 2020. "Regulatory Roles of SREBF1 and SREBF2 in Lipid Metabolism and Deposition in Two Chinese Representative Fat-Tailed Sheep Breeds" Animals 10, no. 8: 1317. https://doi.org/10.3390/ani10081317