Associations Between IGF1, IGFBP2 and TGFß3 Genes Polymorphisms and Growth Performance of Broiler Chicken Lines

 , ,
, ,
Abstract
:Simple Summary
Abstract
1. Introduction
2. Materials and Methods
2.1. Experimental Population—Animals
2.2. Phenotypic Data
2.3. SNP Genotyping
2.3.1. DNA Extraction
2.3.2. Optimalization of PCR-RFLP Assay
2.3.3. Electrophoresis
2.4. Statistical Analysis
3. Results
4. Discussion
5. Conclusions
Author Contributions
Funding
Acknowledgments
Conflicts of Interest
Abbreviations
| ADG | average daily gain |
| AFW | abdominal fat weight |
| AKT | serine/threonine kinase |
| AMP | adenosine monophosphate |
| AMPK | AMP-activated protein kinase |
| BACs | bacterial artificial chromosomes |
| BAD | BCL-2 antagonist of cell death |
| BCL-2 | antiapoptotic B-cell lymphoma/leukemia-2 |
| bp | base pairs |
| BW | body weight |
| CI | confidence interval |
| CNVs | copy number variants |
| cM | centimorgan |
| DNA | deoxyribonucleic acid |
| ECM | extracellular matrix |
| EDTA | ethylenediaminetetraacetic acid |
| ERK | extracellular signal-regulated kinase |
| FOXO | Forkhead box, class O; subfamily of Forkhead transcription factors |
| Gb | giga base pairs |
| GGA1, GGA7 | Gallus gallus autosome 1, Gallus gallus autosome 7 |
| GH | growth hormone |
| GSK-3β | glycogen synthase kinase-3β |
| HWE | Hardy-Weinberg equilibrium |
| IGF | insulin-like growth factor |
| IGF-1 | insulin-like growth factor 1 |
| IGF1 | insulin-like growth factor 1 gene |
| IGF-1R | the type 1 insulin-like growth factor receptor |
| IGF-2R | the type 2 insulin-like growth factor receptor |
| IGFBP | insulin-like growth factor binding protein |
| IGFBP-2, IGFBP-3 | insulin-like growth factor binding protein 2, 3 |
| IGFBP2 | insulin-like growth factor binding protein 2 gene |
| InsR | insulin receptor |
| IRS | insulin receptor substrate |
| IU | international units |
| kb | kilobase pairs |
| LDL | low-density lipoprotein |
| MAP | mitogen-activated protein |
| MAPK | mitogen-activated protein kinase |
| Mb | megabase pairs |
| MEK | mitogen-activated protein kinase kinase 7 (MAP2K7) |
| MMAS | molecular marker-assisted selection |
| mRNA | messenger RNA |
| mTOR | mammalian target of rapamycin |
| mTOR-C1, mTOR-C2 | complexes of mTOR |
| p27 | a protein of 27 kDa that regulates the cell cycle |
| PI3K | phosphatidylinositol-3-OH kinase |
| PCR | polymerase chain reaction |
| PDK1 | 3-phosphoinositide-dependent protein kinase-1 |
| QTL | quantitative trait locus |
| RAF | proto-oncogene serine/threonine-protein kinase |
| RAS | a protein playing a key role in signal transduction of cell growth and differentiation |
| RFLP | restriction fragment length polymorphism |
| S6K-1/2 | ribosomal protein S6 kinase 1/2 |
| SD | standard deviation |
| SHC | the SRC homology and collagen protein |
| SMADs | proteins that are the main signal transducers for receptors of TGFß |
| SNP | single nucleotide polymorphism |
| SRC | proto-oncogene tyrosine-protein kinase |
| T3 | triiodothyronine |
| TBE buffer | Tris-borate-EDTA buffer |
| TGFß | transforming growth factor β |
| TGFß3 | transforming growth factor β3 gene |
| TSC-1/2 | tuberous sclerosis protein ½ |
| 4E-BP1 | eukaryotic translation initiation factor 4E (eIF4E)-binding protein 1 |
References
- Godfray, H.C.J.; Aveyard, P.; Garnett, T.; Hall, J.W.; Key, T.J.; Lorimer, J.; Pierrehumbert, R.T.; Scarborough, P.; Springmann, M.; Jebb, S.A. Meat consumption, health, and the environment. Science 2018, 361, eaam5324. [Google Scholar] [CrossRef] [PubMed] [Green Version]
- FAO. FAOSTAT: Food Supply - Livestock and Fish Primary Equivalent. Available online: http://www.fao.org/faostat/en/#data/CL/visualize (accessed on 20 November 2019).
- Kim, H.-E.; Lee, J.-J.; Lee, M.-J.; Kim, B.-S. Analysis of microbiome in raw chicken meat from butcher shops and packaged products in South Korea to detect the potential risk of foodborne illness. Food Res. Int. 2019, 122, 517–527. [Google Scholar] [CrossRef] [PubMed]
- Anh, N.T.L.; Kunhareang, S.; Duangjinda, M. Association of chicken growth hormones and insulin-like growth factor gene polymorphisms with growth performance and carcass traits in Thai broilers. Asian-Australas. J. Anim. Sci. 2015, 28, 1686. [Google Scholar] [CrossRef] [PubMed] [Green Version]
- Zhang, C.; Zhang, W.; Luo, H.; Yue, W.; Gao, M.; Jia, Z. A new single nucleotide polymorphism in the IGF-I gene and its association with growth traits in the Nanjiang Huang goat. Asian-Australas. J. Anim. Sci. 2008, 21, 1073–1079. [Google Scholar] [CrossRef]
- Hillier, L.; Miller, W.; Birney, E.; Warren, W.; Hardison, R.; Ponting, C.; Bork, P.; Burt, D.; Groenen, M.; Delany, M. International Chicken Genome Sequencing Consortium: Sequence and comparative analysis of the chicken genome provide unique perspectives on vertebrate evolution. Nature 2004, 432, 69–716. [Google Scholar]
- Bellott, D.W.; Skaletsky, H.; Pyntikova, T.; Mardis, E.R.; Graves, T.; Kremitzki, C.; Brown, L.G.; Rozen, S.; Warren, W.C.; Wilson, R.K. Convergent evolution of chicken Z and human X chromosomes by expansion and gene acquisition. Nature 2010, 466, 612. [Google Scholar] [CrossRef] [Green Version]
- Rubin, C.-J.; Zody, M.C.; Eriksson, J.; Meadows, J.R.; Sherwood, E.; Webster, M.T.; Jiang, L.; Ingman, M.; Sharpe, T.; Ka, S. Whole-genome resequencing reveals loci under selection during chicken domestication. Nature 2010, 464, 587–591. [Google Scholar] [CrossRef] [Green Version]
- Schmid, M.; Smith, J.; Burt, D.W.; Aken, B.L.; Antin, P.B.; Archibald, A.L.; Ashwell, C.; Blackshear, P.J.; Boschiero, C.; Brown, C.T. Third report on chicken genes and chromosomes 2015. Cytogenet. Genome Res. 2015, 145, 78–179. [Google Scholar] [CrossRef] [Green Version]
- Warren, W.C.; Hillier, L.W.; Tomlinson, C.; Minx, P.; Kremitzki, M.; Graves, T.; Markovic, C.; Bouk, N.; Pruitt, K.D.; Thibaud-Nissen, F. A new chicken genome assembly provides insight into avian genome structure. G3 Bethesda 2017, 7, 109–117. [Google Scholar] [CrossRef] [Green Version]
- Reyer, H.; Hawken, R.; Murani, E.; Ponsuksili, S.; Wimmers, K. The genetics of feed conversion efficiency traits in a commercial broiler line. Sci. Rep. 2015, 5, 16387. [Google Scholar] [CrossRef] [Green Version]
- Dekkers, J.C. Commercial application of marker-and gene-assisted selection in livestock: strategies and lessons. J. Anim. Sci. 2004, 82, E313–E328. [Google Scholar] [PubMed]
- Zhang, X.; Jiang, X.; Liu, Y.; Du, H.; Zhu, Q. Identification of Ava I polymorphisms in the third intron of GH gene and their associations with abdominal fat in chickens. Poult. Sci. 2007, 86, 1079–1083. [Google Scholar] [CrossRef] [PubMed]
- Fontanesi, L.; Scotti, E.; Tazzoli, M.; Beretti, F.; Dall’Olio, S.; Davoli, R.; Russo, V. Investigation of allele frequencies of the growth hormone receptor (GHR) F279Y mutation in dairy and dual purpose cattle breeds. Ital. J. Anim. Sci. 2007, 6, 415–420. [Google Scholar] [CrossRef] [Green Version]
- Jung, H.J.; Suh, Y. Regulation of IGF-1 signaling by microRNAs. Front. Genet. 2015, 5, 472. [Google Scholar] [CrossRef] [Green Version]
- Laron, Z. Insulin-like growth factor 1 (IGF-1): a growth hormone. Mol. Pathol. 2001, 54, 311. [Google Scholar] [CrossRef]
- LeRoith, D. Insulin-like growth factors: molecular and cellular aspects; CRC press: Boca Raton, FL, USA, 1991. [Google Scholar]
- Ohlsson, C.; Sjögren, K.; Jansson, J.-O.; Isaksson, O. The relative importance of endocrine versus autocrine/paracrine insulin-like growth factor-I in the regulation of body growth. Pediatr. Nephrol. 2000, 14, 541–543. [Google Scholar] [CrossRef]
- Wang, Y.; Bikle, D.D.; Chang, W. Autocrine and paracrine actions of IGF-I signaling in skeletal development. Bone Res. 2013, 1, 249–259. [Google Scholar] [CrossRef] [Green Version]
- Chrysis, D.; Calikoglu, A.S.; Ye, P.; D’Ercole, A.J. Insulin-like growth factor-I overexpression attenuates cerebellar apoptosis by altering the expression of Bcl family proteins in a developmentally specific manner. J. Neurosci. 2001, 21, 1481–1489. [Google Scholar] [CrossRef] [Green Version]
- Galvan, V.; Logvinova, A.; Sperandio, S.; Ichijo, H.; Bredesen, D.E. Type 1 insulin-like growth factor receptor (IGF-IR) signaling inhibits apoptosis signal-regulating kinase 1 (ASK1). J. Biol. Chem. 2003, 278, 13325–13332. [Google Scholar] [CrossRef] [Green Version]
- Hoeflich, A.; Wu, M.; Mohan, S.; Föll, J.; Wanke, R.D.; Froehlich, T.; Arnold, G.J.; Lahm, H.; Kolb, H.J.; Wolf, E. Overexpression of insulin-like growth factor-binding protein-2 in transgenic mice reduces postnatal body weight gain. Endocrinology 1999, 140, 5488–5496. [Google Scholar] [CrossRef]
- Rajaram, S.; Baylink, D.J.; Mohan, S. Insulin-like growth factor-binding proteins in serum and other biological fluids: regulation and functions. Endocr. Rev. 1997, 18, 801–831. [Google Scholar] [PubMed] [Green Version]
- NIH. National Institutes of Health. In Genetics Home Reference. Available online: https://ghr.nlm.nih.gov/gene/TGFB3 (accessed on 27 November 2019).
- Rocio, G.; Morales-Garza, L.A.; Martin-Estal, I.; Castilla-Cortazar, I. Insulin-Like Growth Factor-1 Deficiency and Cirrhosis Establishment. J. Clin. Med. Res. 2017, 9, 233. [Google Scholar]
- Denduluri, S.K.; Idowu, O.; Wang, Z.; Liao, Z.; Yan, Z.; Mohammed, M.K.; Ye, J.; Wei, Q.; Wang, J.; Zhao, L. Insulin-like growth factor (IGF) signaling in tumorigenesis and the development of cancer drug resistance. Genes Dis. 2015, 2, 13–25. [Google Scholar] [CrossRef] [PubMed] [Green Version]
- Clemmons, D.R. 40 YEARS OF IGF1: Role of IGF-binding proteins in regulating IGF responses to changes in metabolism. J. Mol. Endocrinol. 2018, 61, T139–T169. [Google Scholar] [CrossRef] [Green Version]
- Aguirre, G.; De Ita, J.R.; De La Garza, R.; Castilla-Cortazar, I. Insulin-like growth factor-1 deficiency and metabolic syndrome. J. Transl. Med. 2016, 14, 3. [Google Scholar] [CrossRef] [PubMed] [Green Version]
- De Ita, J.R.; Castilla-Cortázar, I.; Aguirre, G.; Sanchez-Yago, C.; Santos-Ruiz, M.O.; Guerra-Menendez, L.; Martin-Estal, I.; García-Magariño, M.; Lara-Díaz, V.J.; Puche, J. Altered liver expression of genes involved in lipid and glucose metabolism in mice with partial IGF-1 deficiency: an experimental approach to metabolic syndrome. J. Transl. Med. 2015, 13, 326. [Google Scholar] [CrossRef] [Green Version]
- Desbois-Mouthon, C.; Wendum, D.; Cadoret, A.; Rey, C.; Leneuve, P.; Blaise, A.; Housset, C.; Tronche, F.; Le Bouc, Y.; Holzenberger, M. Hepatocyte proliferation during liver regeneration is impaired in mice with liver-specific IGF-1R knockout. FASEB J. 2006, 20, 773–775. [Google Scholar] [CrossRef] [Green Version]
- García-Fernández, M.; Castilla-Cortázar, I.; Díaz-Sánchez, M.; Díez Caballero, F.; Castilla, A.; Diaz Casares, A.; Varela-Nieto, I.; González-Barón, S. Effect of IGF-I on total serum antioxidant status in cirrhotic rats. J. Physiol. Biochem. 2003, 59, 145–146. [Google Scholar] [CrossRef] [Green Version]
- García-Fernández, M.; Castilla-Cortázar, I.; Díaz-Sanchez, M.; Navarro, I.; Puche, J.E.; Castilla, A.; Casares, A.D.; Clavijo, E.; González-Barón, S. Antioxidant effects of insulin-like growth factor-I (IGF-I) in rats with advanced liver cirrhosis. BMC Gastroenterol. 2005, 5, 7. [Google Scholar] [CrossRef] [Green Version]
- Fernández, A.M.; Kim, J.K.; Yakar, S.; Dupont, J.; Hernandez-Sanchez, C.; Castle, A.L.; Filmore, J.; Shulman, G.I.; Le Roith, D. Functional inactivation of the IGF-I and insulin receptors in skeletal muscle causes type 2 diabetes. Genes Dev. 2001, 15, 1926–1934. [Google Scholar] [CrossRef] [Green Version]
- Héron-Milhavet, L.; Haluzik, M.; Yakar, S.; Gavrilova, O.; Pack, S.; Jou, W.C.; Ibrahimi, A.; Kim, H.; Hunt, D.; Yau, D. Muscle-specific overexpression of CD36 reverses the insulin resistance and diabetes of MKR mice. Endocrinology 2004, 145, 4667–4676. [Google Scholar] [CrossRef] [PubMed] [Green Version]
- Higashi, Y.; Sukhanov, S.; Anwar, A.; Shai, S.-Y.; Delafontaine, P. Aging, atherosclerosis, and IGF-1. J. Gerontol. Ser. A Biomed. Sci. Med. Sci. 2012, 67, 626–639. [Google Scholar] [CrossRef] [PubMed] [Green Version]
- Jacob, R.; Barrett, E.; Plewe, G.; Fagin, K.D.; Sherwin, R.S. Acute effects of insulin-like growth factor I on glucose and amino acid metabolism in the awake fasted rat. Comparison with insulin. J. Clin. Invest. 1989, 83, 1717–1723. [Google Scholar] [CrossRef] [PubMed] [Green Version]
- Jallali, N.; Ridha, H.; Thrasivoulou, C.; Butler, P.; Cowen, T. Modulation of intracellular reactive oxygen species level in chondrocytes by IGF-1, FGF, and TGF-β1. Connect. Tissue Res. 2007, 48, 149–158. [Google Scholar] [CrossRef] [PubMed]
- Kelley, K.W.; Weigent, D.A.; Kooijman, R. Protein hormones and immunity. Brain Behav. Immun. 2007, 21, 384–392. [Google Scholar] [CrossRef] [Green Version]
- Kudo, Y.; Iwashita, M.; Iguchi, T.; Takeda, Y. The regulation of L-proline transport by insulin-like growth factor-I in human osteoblast-like SaOS-2 cells. Pflugers Arch. 1996, 432, 419. [Google Scholar] [CrossRef]
- Laager, R.; Ninnis, R.; Keller, U. Comparison of the effects of recombinant human insulin-like growth factor-I and insulin on glucose and leucine kinetics in humans. J. Clin. Invest. 1993, 92, 1903–1909. [Google Scholar] [CrossRef] [Green Version]
- Locatelli, V.; Bianchi, V.E. Effect of GH/IGF-1 on bone metabolism and osteoporosis. Int. J. Endocrinol. 2014, 2014, 235060. [Google Scholar] [CrossRef] [Green Version]
- Mauras, N.; O’Brien, K.O.; Welch, S.; Rini, A.; Helgeson, K.; Vieira, N.E.; Yergey, A.L. Insulin-like growth factor I and growth hormone (GH) treatment in GH-deficient humans: differential effects on protein, glucose, lipid, and calcium metabolism. J. Clin. Endocrinol. Metab. 2000, 85, 1686–1694. [Google Scholar]
- Moxley 3rd, R.; Arner, P.; Moss, A.; Skottner, A.; Fox, M.; James, D.; Livingston, J.N. Acute effects of insulin-like growth factor I and insulin on glucose metabolism in vivo. Am. J. Physiol.-Endoc. M. 1990, 259, E561–E567. [Google Scholar] [CrossRef]
- Muguerza, B.; Castilla-Cortázar, I.; Garcı́a, M.a.; Quiroga, J.; Santidrián, S.; Prieto, J. Antifibrogenic effect in vivo of low doses of insulin-like growth factor-I in cirrhotic rats. Biochim. Biophys. Acta Mol. Basis Dis. 2001, 1536, 185–195. [Google Scholar] [CrossRef] [Green Version]
- Pennisi, P.A.; Kopchick, J.J.; Thorgeirsson, S.; LeRoith, D.; Yakar, S. Role of growth hormone (GH) in liver regeneration. Endocrinology 2004, 145, 4748–4755. [Google Scholar] [CrossRef] [PubMed]
- Pennisi, P.; Gavrilova, O.; Setser-Portas, J.; Jou, W.; Santopietro, S.; Clemmons, D.; Yakar, S.; LeRoith, D. Recombinant human insulin-like growth factor-I treatment inhibits gluconeogenesis in a transgenic mouse model of type 2 diabetes mellitus. Endocrinology 2006, 147, 2619–2630. [Google Scholar] [CrossRef] [PubMed] [Green Version]
- Powell-Braxton, L.; Hollingshead, P.; Warburton, C.; Dowd, M.; Pitts-Meek, S.; Dalton, D.; Gillett, N.; Stewart, T.A. IGF-I is required for normal embryonic growth in mice. Genes Dev. 1993, 7, 2609–2617. [Google Scholar] [CrossRef] [PubMed]
- Pratipanawatr, T.; Pratipanawatr, W.; Rosen, C.; Berria, R.; Bajaj, M.; Cusi, K.; Mandarino, L.; Kashyap, S.; Belfort, R.; DeFronzo, R.A. Effect of IGF-I on FFA and glucose metabolism in control and type 2 diabetic subjects. Am. J. Physiol. Endoc. M. 2002, 282, E1360–E1368. [Google Scholar] [CrossRef] [PubMed] [Green Version]
- Puche, J.E.; García-Fernández, M.a.; Muntané, J.; Rioja, J.; Gonzalez-Baron, S.; Castilla Cortazar, I. Low doses of insulin-like growth factor-I induce mitochondrial protection in aging rats. Endocrinology 2008, 149, 2620–2627. [Google Scholar] [CrossRef] [Green Version]
- Thorén, M.C.; Wivall-Helleryd, I.-L.; Blum, W.F.; Hall, K.E. Effects of repeated subcutaneous administration of recombinant human insulin-like growth factor I in adults with growth hormone deficiency. Eur. J. Endocrinol. 1994, 131, 33–40. [Google Scholar] [CrossRef]
- Tu, W.; Cheung, P.-T.; Lau, Y.-L. Insulin-like growth factor 1 promotes cord blood T cell maturation and inhibits its spontaneous and phytohemagglutinin-induced apoptosis through different mechanisms. J. Immunol. 2000, 165, 1331–1336. [Google Scholar] [CrossRef]
- Vincent, A.M.; Feldman, E.L. Control of cell survival by IGF signaling pathways. Growth Horm. IGF Res. 2002, 12, 193–197. [Google Scholar] [CrossRef]
- Walsh, P.T.; Smith, L.M.; O’Connor, R. Insulin-like growth factor-1 activates Akt and Jun N-terminal kinases (JNKs) in promoting the survival of T lymphocytes. Immunology 2002, 107, 461–471. [Google Scholar] [CrossRef]
- Zhou, H.; Mitchell, A.; McMurtry, J.; Ashwell, C.; Lamont, S.J. Insulin-like growth factor-I gene polymorphism associations with growth, body composition, skeleton integrity, and metabolic traits in chickens. Poult. Sci. 2005, 84, 212–219. [Google Scholar] [CrossRef] [PubMed]
- Bikle, D.D.; Tahimic, C.; Chang, W.; Wang, Y.; Philippou, A.; Barton, E.R. Role of IGF-I signaling in muscle bone interactions. Bone 2015, 80, 79–88. [Google Scholar] [CrossRef] [PubMed] [Green Version]
- Sewalem, A.; Morrice, D.; Law, A.; Windsor, D.; Haley, C.; Ikeobi, C.; Burt, D.; Hocking, P. Mapping of quantitative trait loci for body weight at three, six, and nine weeks of age in a broiler layer cross. Poult. Sci. 2002, 81, 1775–1781. [Google Scholar] [CrossRef] [PubMed]
- Ikeobi, C.; Woolliams, J.; Morrice, D.; Law, A.; Windsor, D.; Burt, D.; Hocking, P. Quantitative trait loci affecting fatness in the chicken. Anim. Genet. 2002, 33, 428–435. [Google Scholar] [CrossRef] [Green Version]
- Bach, L.A.; Headey, S.J.; Norton, R.S. IGF-binding proteins–the pieces are falling into place. Trends Endocrinol. Metab. 2005, 16, 228–234. [Google Scholar] [CrossRef]
- Clemmons, D.R. Role of IGF binding proteins in regulating metabolism. Trends Endocrinol. Metab. 2016, 27, 375–391. [Google Scholar] [CrossRef]
- Kutsukake, M.; Ishihara, R.; Momose, K.; Isaka, K.; Itokazu, O.; Higuma, C.; Matsutani, T.; Matsuda, A.; Sasajima, K.; Hara, T. Circulating IGF-binding protein 7 (IGFBP7) levels are elevated in patients with endometriosis or undergoing diabetic hemodialysis. Reprod. Biol. Endocrin. 2008, 6, 54. [Google Scholar] [CrossRef] [Green Version]
- Russo, V.; Gluckman, P.; Feldman, E.; Werther, G. The insulin-like growth factor system and its pleiotropic functions in brain. Endocr. Rev. 2005, 26, 916–943. [Google Scholar] [CrossRef] [Green Version]
- Jones, J.I.; Clemmons, D.R. Insulin-like growth factors and their binding proteins: biological actions. Endocr. Rev. 1995, 16, 3–34. [Google Scholar]
- Kita, K.; Nagao, K.; Taneda, N.; Inagaki, Y.; Hirano, K.; Shibata, T.; Yaman, M.A.; Conlon, M.A.; Okumura, J.-i. Insulin-like growth factor binding protein-2 gene expression can be regulated by diet manipulation in several tissues of young chickens. J. Nutr. 2002, 132, 145–151. [Google Scholar] [CrossRef] [Green Version]
- Leng, L.; Wang, S.; Li, Z.; Wang, Q.; Li, H. A polymorphism in the 3′-flanking region of insulin-like growth factor binding protein 2 gene associated with abdominal fat in chickens. Poult. Sci. 2009, 88, 938–942. [Google Scholar] [CrossRef] [PubMed]
- Monzavi, R.; Cohen, P. IGFs and IGFBPs: role in health and disease. Best Pract. Res. Clin. Endocrinol. Metab. 2002, 16, 433–447. [Google Scholar] [CrossRef] [PubMed]
- Zhao, X.; Li, M.; Xu, S.; Liu, G. Single Nucleotide Polymorphisms in IGFBP-2 Gene and Their Associations with Body Weight Traits on Jinghai Yellow Chicken. Rev. Bras. Cienc. Avic. 2015, 17, 497–502. [Google Scholar] [CrossRef] [Green Version]
- Richardson, R.; Hausman, G.; Wright, J. Growth factor regulation of insulin-like growth factor (IGF) binding proteins (IGFBP) and preadipocyte differentiation in porcine stromal-vascular cell cultures. Growth Dev. Aging. 1998, 62, 3–12. [Google Scholar] [PubMed]
- Butterwith, S.; Goddard, C. Regulation of DNA synthesis in chicken adipocyte precursor cells by insulin-like growth factors, platelet-derived growth factor and transforming growth factor-β. J. Endocrinol. 1991, 131, 203–209. [Google Scholar] [CrossRef]
- Li, H.; Deeb, N.; Zhou, H.; Mitchell, A.; Ashwell, C.; Lamont, S.J. Chicken quantitative trait loci for growth and body composition associated with transforming growth factor-beta genes. Poult. Sci. 2003, 82, 347–356. [Google Scholar] [CrossRef]
- Wu, M.Y.; Hill, C.S. TGF-β superfamily signaling in embryonic development and homeostasis. Dev. Cell 2009, 16, 329–343. [Google Scholar] [CrossRef] [Green Version]
- Xu, X.; Zheng, L.; Yuan, Q.; Zhen, G.; Crane, J.L.; Zhou, X.; Cao, X. Transforming growth factor-β in stem cells and tissue homeostasis. Bone Res. 2018, 6, 1–31. [Google Scholar] [CrossRef] [Green Version]
- Moody, D.; Haynie, J.; Schreiweis, M.; Hester, P. Identification of SNP in candidate genes for osteoporosis in chickens. In Proceedings of the Plant and Animal Genome XI, San Diego, CA, USA, 15–17 May 2003; Scherago International: New York, NY, USA. [Google Scholar]
- Li, Z.; Li, H.; Zhang, H.; Wang, S.; Wang, Q.; Wang, Y. Identification of a single nucleotide polymorphism of the insulin-like growth factor binding protein 2 gene and its association with growth and body composition traits in the chicken. J. Anim. Sci. 2006, 84, 2902–2906. [Google Scholar] [CrossRef] [Green Version]
- Scanes, C.G. Perspectives on the endocrinology of poultry growth and metabolism. Gen. Comp. Endocrinol. 2009, 163, 24–32. [Google Scholar] [CrossRef]
- Kajimoto, Y.; Rotwein, P. Structure of the chicken insulin-like growth factor I gene reveals conserved promoter elements. J. Biol. Chem. 1991, 266, 9724–9731. [Google Scholar] [PubMed]
- Duclos, M. Insulin-like growth factor-I (IGF-1) mRNA levels and chicken muscle growth. J. Physiol. Pharmacol. 2005, 56, 25–35. [Google Scholar] [PubMed]
- Li, P.; Sun, X.; Cai, G.; Chen, X. Insulin-like growth factor system and aging. J. Aging. Sci. 2017, 5, 4172. [Google Scholar] [CrossRef]
- Wheatcroft, S.B.; Kearney, M.T.; Shah, A.M.; Ezzat, V.A.; Miell, J.R.; Modo, M.; Williams, S.C.; Cawthorn, W.P.; Medina-Gomez, G.; Vidal-Puig, A. IGF-binding protein-2 protects against the development of obesity and insulin resistance. Diabetes 2007, 56, 285–294. [Google Scholar] [CrossRef] [Green Version]
- Skottner, A. Biosynthesis of growth hormone and insulin-like growth factor-I and the regulation of their secretion. Open Endocrinol. J. 2012, 6, 3–12. [Google Scholar] [CrossRef] [Green Version]
- Barton, E.R. The ABCs of IGF-I isoforms: impact on muscle hypertrophy and implications for repair. Appl. Physiol. Nutr. Me. 2006, 31, 791–797. [Google Scholar] [CrossRef]
- Dupont, J.; Holzenberger, M. Biology of insulin-like growth factors in development. Birth Defects Res. C Embryo Today 2003, 69, 257–271. [Google Scholar] [CrossRef]
- McMurtry, J.; Francis, G.; Upton, Z. Insulin-like growth factors in poultry. Domest. Anim. Endocrinol. 1997, 14, 199–229. [Google Scholar] [CrossRef]
- Tanaka, M.; Hayashida, Y.; Sakaguchi, K.; Ohkubo, T.; Wakita, M.; Hoshino, S.; Nakashima, K. Growth hormone-independent expression of insulin-like growth factor I messenger ribonucleic acid in extrahepatic tissues of the chicken. Endocrinology 1996, 137, 30–34. [Google Scholar] [CrossRef] [Green Version]
- Beccavin, C.; Chevalier, B.; Cogburn, L.; Simon, J.; Duclos, M. Insulin-like growth factors and body growth in chickens divergently selected for high or low growth rate. J. Endocrinol. 2001, 168, 297–306. [Google Scholar] [CrossRef] [Green Version]
- Kita, K.; Nagao, K.; Okumura, J. Nutritional and tissue specificity of IGF-I and IGFBP-2 gene expression in growing chickens-A review. Asian-Australas. J. Anim. Sci. 2005, 18, 747–754. [Google Scholar] [CrossRef]
- Amills, M.; Jimenez, N.; Villalba, D.; Tor, M.; Molina, E.; Cubilo, D.; Marcos, C.; Francesch, A.; Sanchez, A.; Estany, J. Identification of three single nucleotide polymorphisms in the chicken insulin-like growth factor 1 and 2 genes and their associations with growth and feeding traits. Poult. Sci. 2003, 82, 1485–1493. [Google Scholar] [CrossRef] [PubMed]
- Bennett, A.; Hester, P.; Spurlock, D. Polymorphisms in vitamin D receptor, osteopontin, insulin-like growth factor 1 and insulin, and their associations with bone, egg and growth traits in a layer–broiler cross in chickens. Anim. Genet. 2006, 37, 283–286. [Google Scholar] [CrossRef] [PubMed]
- Bhattacharya, T.; Chatterjee, R.; Dushyanth, K.; Paswan, C.; Shukla, R.; Shanmugam, M. Polymorphism and expression of insulin-like growth factor 1 (IGF1) gene and its association with growth traits in chicken. Br. Poult. Sci. 2015, 56, 398–407. [Google Scholar] [CrossRef] [PubMed]
- Bian, L.; Wang, S.; Wang, Q.; Zhang, S.; Wang, Y.; Li, H. Variation at the insulin-like growth factor 1 gene and its association with body weight traits in the chicken. J. Anim. Breed. Genet. 2008, 125, 265–270. [Google Scholar] [CrossRef]
- Moe, H.H.; Shimogiri, T.; Kawabe, K.; Nishibori, M.; Okamoto, S.; Hashiguchi, T.; Maeda, Y. Genotypic frequency in Asian native chicken populations and gene expression using insulin-like growth factor 1 (IGF1) gene promoter polymorphism. J. Poult. Sci. 2009, 46, 1–5. [Google Scholar] [CrossRef]
- Nagaraja, S.; Aggrey, S.; Yao, J.; Zadworny, D.; Fairfull, R.; Kuhnlein, U. Brief communication. Trait association of a genetic marker near the IFG-I gene in egg-laying chickens. J. Hered. 2000, 91, 150–156. [Google Scholar] [CrossRef]
- Promwatee, N.; Laopaiboon, B.; Vongpralub, T.; Phasuk, Y.; Kunhareang, S.; Boonkum, W.; Duangjinda, M. Insulin-like growth factor I gene polymorphism associated with growth and carcass traits in Thai synthetic chickens. Genet. Mol. Res. 2013, 12, 4332–4341. [Google Scholar] [CrossRef]
- Promwatee, N.; Duangjinda, M. Association of Single Nucleotide Polymorphisms in GHSR, IGF-I, cGH and IGFBP2 Gene with Growth Traits in Thai Native Chickens. In Proceedings of the 14th AAAP Animal Science Congress, Pingtung, Taiwan, 23─27 August 2010; pp. 44–47. [Google Scholar]
- Promwatee, N.; Duangjinda, M.; Boonkum, W.; Loapaiboon, B. Association of single nucleotide polymorphisms in GHSR, IGFI, cGH and IGFBP2 genes on growth traits in Thai Native Chickens (Chee and Pradu Hang Dam). Khon Kaen Agr. J. 2011, 39, 261–270. [Google Scholar]
- Yau, S.W.; Russo, V.C.; Clarke, I.J.; Dunshea, F.R.; Werther, G.A.; Sabin, M.A. IGFBP-2 inhibits adipogenesis and lipogenesis in human visceral, but not subcutaneous, adipocytes. Int. J. Obes. 2015, 39, 770–781. [Google Scholar] [CrossRef]
- Li, Z.; Picard, F. Modulation of IGFBP2 mRNA expression in white adipose tissue upon aging and obesity. Horm. Metab. Res. 2010, 42, 787–791. [Google Scholar] [CrossRef] [PubMed]
- Heald, A.; Kaushal, K.; Siddals, K.; Rudenski, A.; Anderson, S.; Gibson, J. Insulin-like growth factor binding protein-2 (IGFBP-2) is a marker for the metabolic syndrome. Exp. Clin. Endocrinol. Diabetes 2006, 114, 371–376. [Google Scholar] [CrossRef] [PubMed]
- Hoeflich, A.; Reisinger, R.; Lahm, H.; Kiess, W.; Blum, W.F.; Kolb, H.J.; Weber, M.M.; Wolf, E. Insulin-like growth factor-binding protein 2 in tumorigenesis: protector or promoter? Cancer Res. 2001, 61, 8601–8610. [Google Scholar]
- Assefa, B.; Mahmoud, A.M.; Pfeiffer, A.F.; Birkenfeld, A.L.; Spranger, J.; Arafat, A.M. Insulin-like growth factor (IGF) binding protein-2, independently of IGF-1, induces GLUT-4 translocation and glucose uptake in 3T3-L1 adipocytes. Oxid. Med. Cell Longev. 2017, 2017, 3035184. [Google Scholar] [CrossRef]
- Claudio, M.; Benjamim, F.; Riccardo, B.; Massimiliano, C.; Francesco, B.; Luciano, C. Adipocytes IGFBP-2 expression in prepubertal obese children. Obesity 2010, 18, 2055–2057. [Google Scholar] [CrossRef]
- Hwa, V.; Oh, Y.; Rosenfeld, R.G. The insulin-like growth factor-binding protein (IGFBP) superfamily. Endocr. Rev. 1999, 20, 761–787. [Google Scholar] [CrossRef] [PubMed]
- Conchillo, M.; Prieto, J.; Quiroga, J. Insulin-like growth factor I (IGF-I) and liver cirrhosis. Rev. Esp. Enferm. Dig. Madrid 2007, 99, 156–164. [Google Scholar]
- Firth, S.M.; Baxter, R.C. Cellular actions of the insulin-like growth factor binding proteins. Endocr. Rev. 2002, 23, 824–854. [Google Scholar] [CrossRef]
- Yin, P.; Xu, Q.; Duan, C. Paradoxical actions of endogenous and exogenous insulin-like growth factor-binding protein-5 revealed by RNA interference analysis. J. Biol. Chem. 2004, 279, 32660–32666. [Google Scholar] [CrossRef] [Green Version]
- Duan, C.; Xu, Q. Roles of insulin-like growth factor (IGF) binding proteins in regulating IGF actions. Gen. Comp. Endocrinol. 2005, 142, 44–52. [Google Scholar] [CrossRef]
- Oh, Y.; Nagalla, S.R.; Yamanaka, Y.; Kim, H.-S.; Wilson, E.; Rosenfeld, R.G. Synthesis and characterization of insulin-like growth factor-binding protein (IGFBP)-7 Recombinant human mac25 protein specifically binds IGF-I and-II. J. Biol. Chem. 1996, 271, 30322–30325. [Google Scholar] [CrossRef] [PubMed] [Green Version]
- Shimasaki, S.; Ling, N. Identification and molecular characterization of insulin-like growth factor binding proteins (IGFBP-1,-2,-3,-4,-5 and-6). Prog. Growth Factor Res. 1991, 3, 243–266. [Google Scholar] [CrossRef]
- Schoen, T.; Mazuruk, K.; Waldbillig, R.; Potts, J.; Beebe, D.; Chader, G.; Rodriguez, I. Cloning and characterization of a chick embryo cDNA and gene for IGF-binding protein-2. J. Mol. Endocrinol. 1995, 15, 49–59. [Google Scholar] [CrossRef] [PubMed]
- Eckstein, F.; Pavicic, T.; Nedbal, S.; Schmidt, C.; Wehr, U.; Rambeck, W.; Wolf, E.; Hoeflich, A. Insulin-like growth factor-binding protein-2 (IGFBP-2) overexpression negatively regulates bone size and mass, but not density, in the absence and presence of growth hormone/IGF-I excess in transgenic mice. Anat. Embryol. 2002, 206, 139–148. [Google Scholar] [CrossRef] [PubMed]
- Wu, S.; Zhu, L.; Tang, J.; Wu, G. TGFβ3 gene polymorphism and correlations between TGFβ3 gene and reproduction traits in Liboyaoshan chicken. Southwest. China J. Agric. Sci. 2017, 30, 1923–1928. [Google Scholar]
- Gu, L.; Sun, C.; Gong, Y.; Yu, M.; Li, S. Novel copy number variation of the TGFβ3 gene is associated with TGFβ3 gene expression and duration of fertility traits in hens. PLoS ONE 2017, 12, e0173696. [Google Scholar] [CrossRef]
- Ye, X.; Avendano, S.; Dekkers, J.; Lamont, S. Association of twelve immune-related genes with performance of three broiler lines in two different hygiene environments. Poult. Sci. 2006, 85, 1555–1569. [Google Scholar] [CrossRef]
- Malek, M.; Lamont, S.J. Association of INOS, TRAIL, TGF-β2, TGF-β3, and IgL genes with response to Salmonella enteritidis in poultry. Genet Sel. Evol. 2003, 35, S99. [Google Scholar] [CrossRef] [Green Version]
- Tohidi, R.; Idris, I.; Malar Panandam, J.; Hair Bejo, M. The effects of polymorphisms in 7 candidate genes on resistance to Salmonella Enteritidis in native chickens. Poult. Sci. 2013, 92, 900–909. [Google Scholar] [CrossRef]
- Enayati, B.; Rahimi-Mianji, G. Genomic growth hormone, growth hormone receptor and transforming growth factor β-3 gene polymorphism in breeder hens of Mazandaran native fowls. Afr. J. Biotechnol. 2009, 8, 3154–3159. [Google Scholar]


| Day | The Proportion of Light and Darkness Within 24 h | |
|---|---|---|
| Light (h) | Dark (h) | |
| 1–7 | 23 | 1 |
| 8–37 | 18 | 6 |
| 38 | 20 | 4 |
| 39 | 22 | 2 |
| 40–42 | 23 | 1 |
| Nutrient | Feeding Mixture * | ||
|---|---|---|---|
| BR1 | BR2 | BR3 | |
| Period | |||
| 1st–10th Day | 11th–35th Day | 36th–42nd Day | |
| Crude protein (%) | 22.01 | 19.86 | 18.50 |
| Fat (%) | 3.85 | 5.76 | 7.64 |
| Lysine (%) | 1.16 | 1.22 | 1.07 |
| Methionine (%) | 0.56 | 0.56 | 0.51 |
| Calcium (%) | 0.91 | 0.84 | 0.81 |
| Phosphorus (%) | 0.60 | 0.54 | 0.47 |
| Vitamin A (IU/kg) | 15,300 | 12,300 | 10,300 |
| Vitamin D3 (IU/kg) | 5,000 | 5,000 | 5,000 |
| Metabolizable energy (MJ/kg) | 12.64 | 13.07 | 13.59 |
| Gene | Primer Sequence | Product Length (bp) | Restriction Enzyme | Restriction Enzyme Production Size (bp) * | |
|---|---|---|---|---|---|
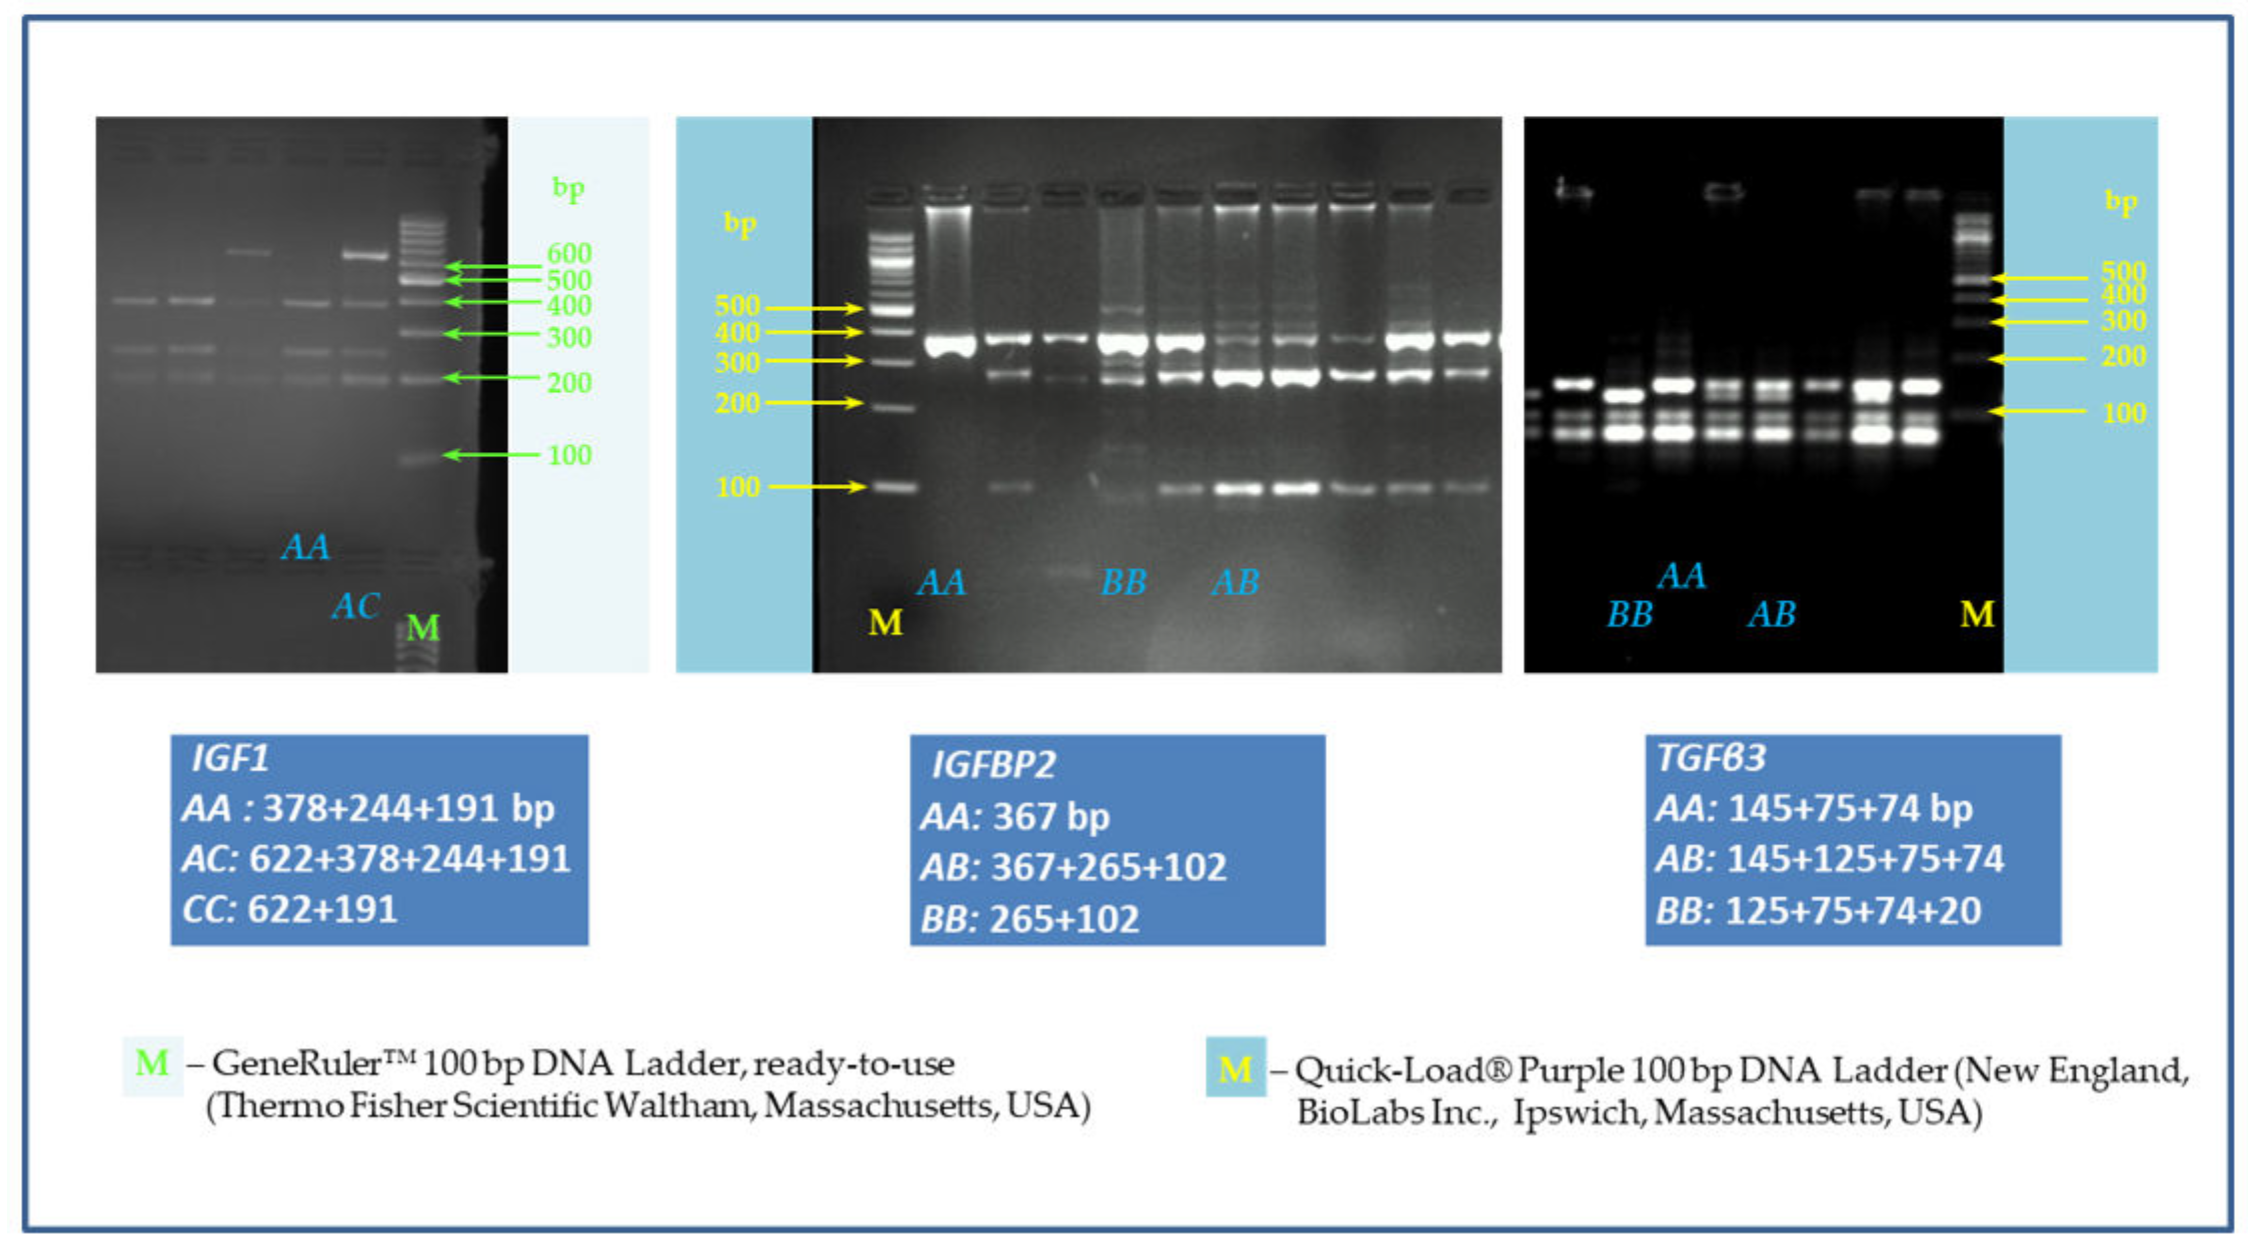
| IGF1 SNP/site A>C/Promoter and 5′UTR | forward a | 5’-CATTGCGCAGGCTCTATCTG-3´ | 813 | HinfI | AA: 378+244+191 AC: 622+378+244+191 CC: 622+191 |
| reverse a | 5´-TCAAGAGAAGCCCTTCAAGC-3´ | ||||
| IGFBP2 intron 2 C1032T (accession number AY 326194) | forward b | 5´-GTCCCAGATAAACCTTGCT-3´ | 367 | Eco72I | AA: 367 AB: 367+265+102 BB: 265+102 |
| reverse b | 5´-GCTGGCAAGGGGTCTG-3´ | ||||
| TGFβ3 A C/A SNP at base 2,833 (accession number X60091) | forward c | 5´-TCAGGGCAGGTAGAGGGTGT-3´ | 294 | BslI | AA: 145+75+74 AB: 145+125+75+74 BB: 125+75+74+20 |
| reverse c | 5´-GCCACTGGCAGGATTCTCAC-3´ |
| Broiler Line | Gene | Genotype Frequencies a | Allele Frequencies a | χ2 Test HWE b (p-Value) | |||
|---|---|---|---|---|---|---|---|
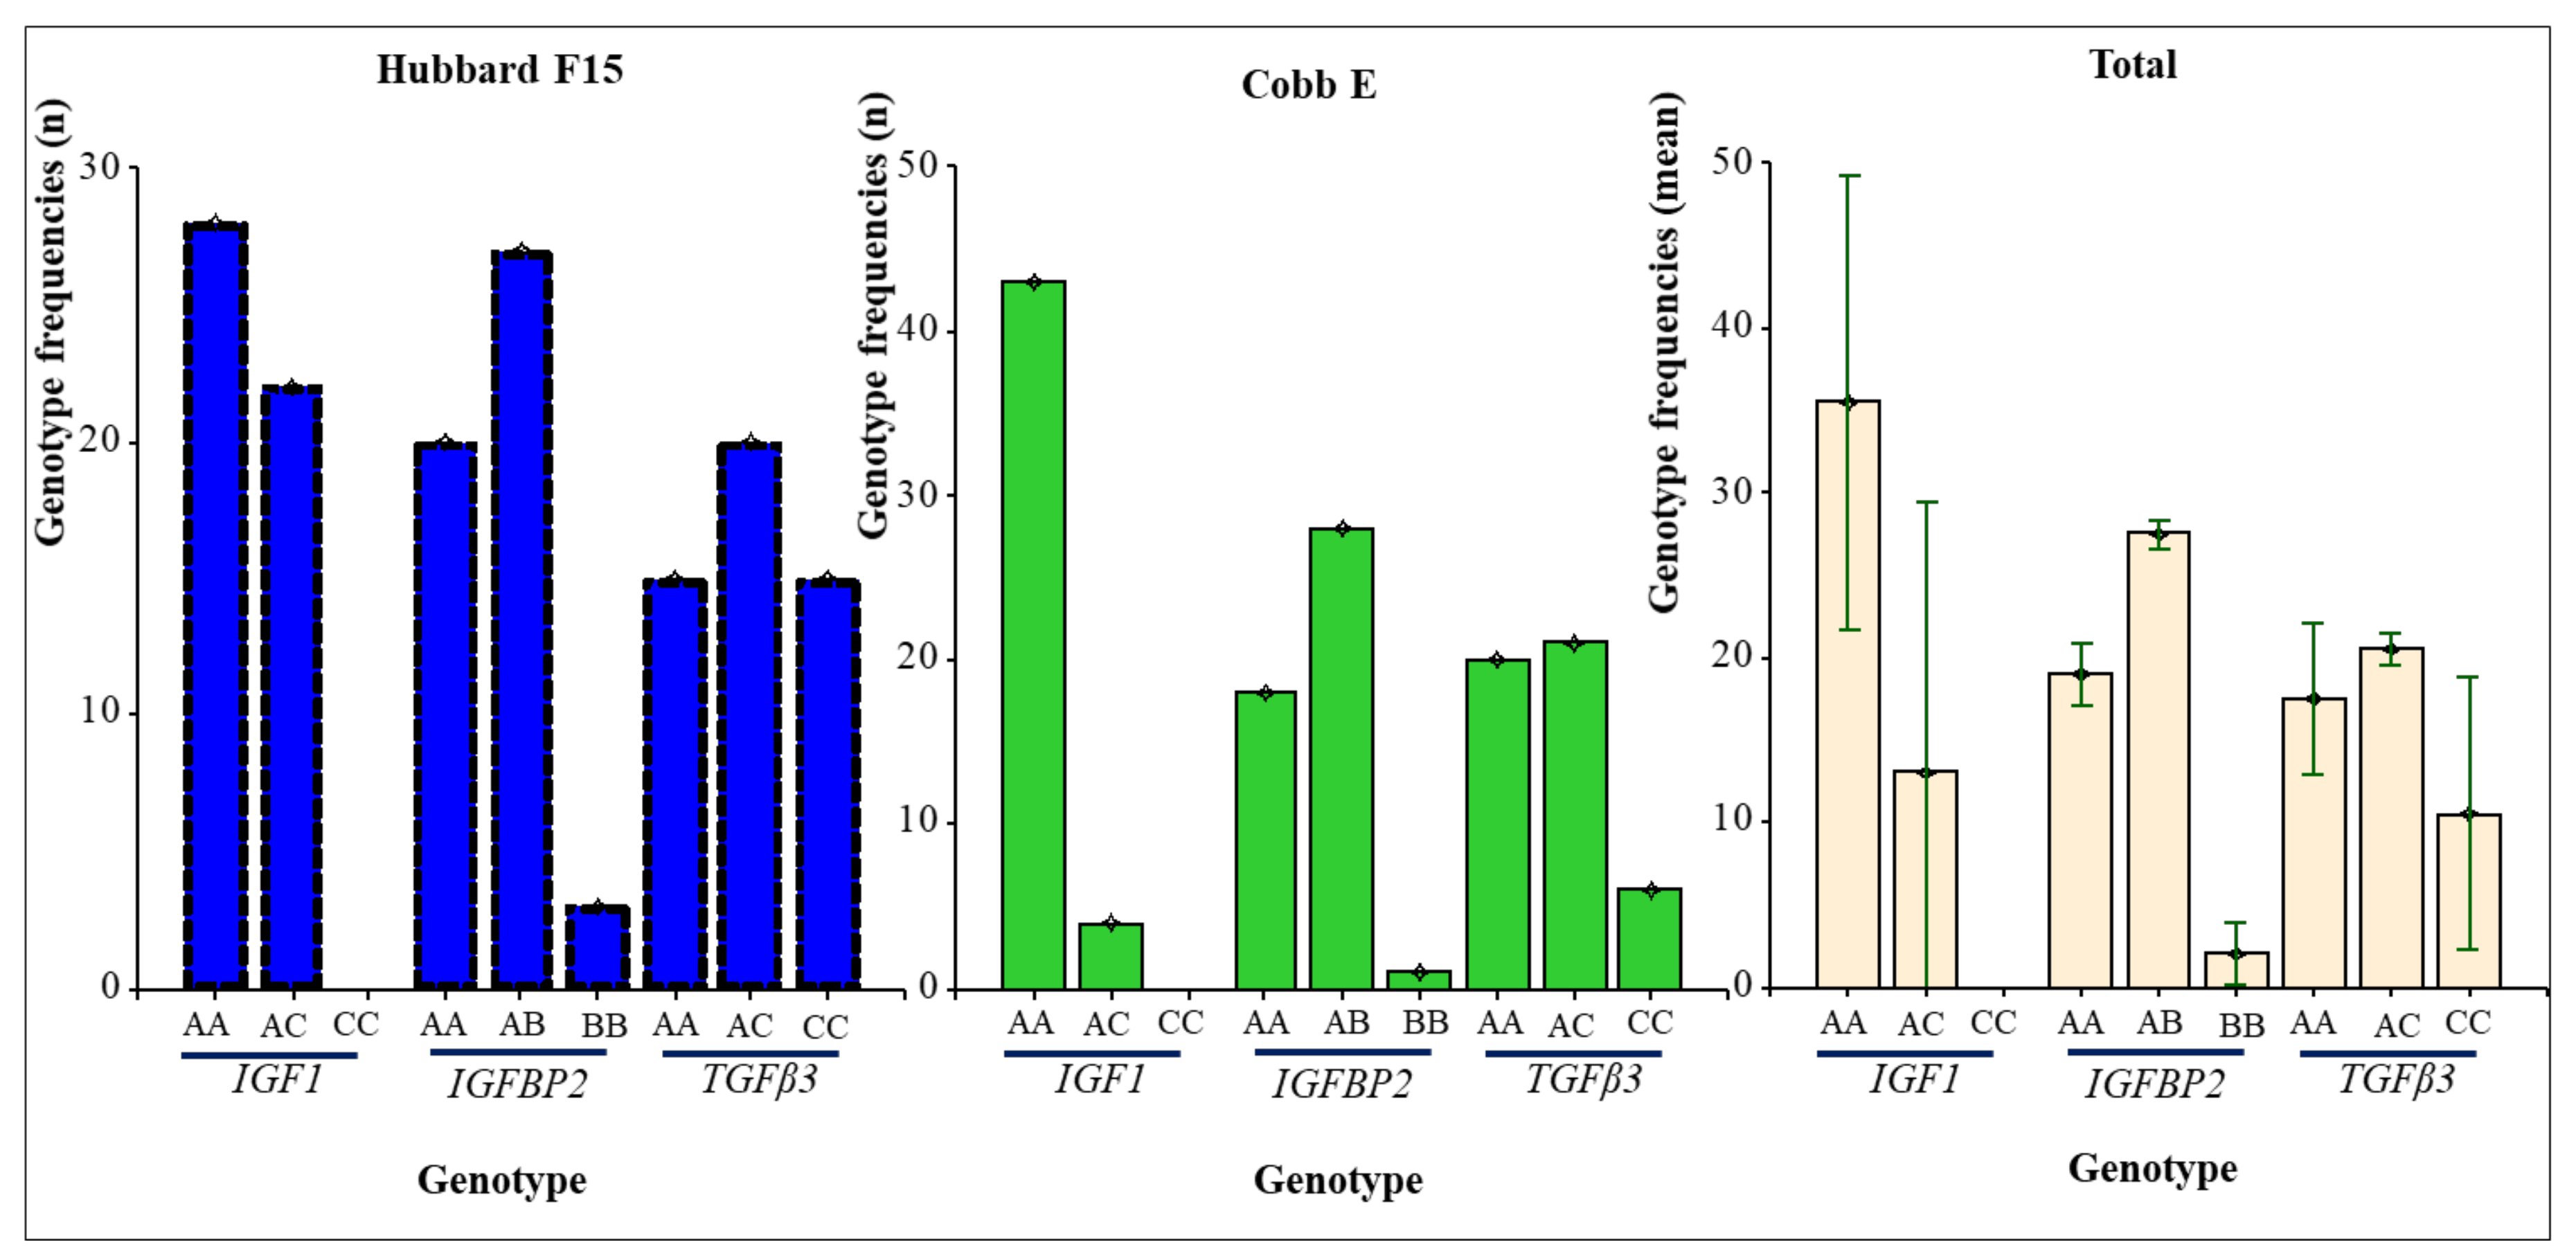
| Hubbard F15 | IGF1 | AA | AC | CC | A | C | |
| 28 (56.00) | 22 (44.00) | nf | 78 (78.00) | 22 (22.00) | 0.0908 | ||
| IGFBP2 | AA | AB | BB | A | B | ||
| 20 (40.00) | 27 (54.00) | 3 (6.00) | 67 (67.00) | 33 (33.00) | 0.1998 | ||
| TGFβ3 | AA | AB | BB | A | B | ||
| 15 (30.00) | 20 (40.00) | 15 (30.00) | 50 (50.00) | 50 (50.00) | 0.1639 | ||
| Cobb E | IGF1 | AA | AC | CC | A | C | |
| 43 (91.49) | 4 (8.51) | nf | 90 (95.74) | 4 (4.26) | 1.00 | ||
| IGFBP2 | AA | AB | BB | A | B | ||
| 18 (38.30) | 28 (59.57) | 1 (2.13) | 64 (68.09) | 30 (31.91) | 0.0172* | ||
| TGFβ3 | AA | AB | BB | A | B | ||
| 20 (42.55) | 21 (44.68) | 6 (12.77) | 61 (64.89) | 33 (35.11) | 1.00 | ||
| Total | IGF1 | AA | AC | CC | A | C | |
| 71 (73.20) | 26 (26.80) | 0 (0) | 168 (86.60) | 26 (13.40) | 0.2066 | ||
| IGFBP2 | AA | AB | BB | A | B | ||
| 38 (39.18) | 55 (56.70) | 4 (4.12) | 131 (67.53) | 63 (32.47) | 0.0050* | ||
| TGFβ3 | AA | AB | BB | A | B | ||
| 35 (36.08) | 41 (42.27) | 21 (21.65) | 111 (57.22) | 83 (42.78) | 0.2125 | ||
| Parameter | Line | |||||
|---|---|---|---|---|---|---|
| Hubbard F15 | Cobb E | |||||
| Genotype | Genotype | |||||
| AA (n = 28) | AC (n = 22) | CC | AA (n = 43) | AC (n = 4) | CC | |
| Mean ± SD; CI | ||||||
| BW at 14 days * | 421.07 ± 32 433; 408 | 428.18 ± 31 442; 414 | - | 473.24 ± 40 485; 461 | 462.50 ± 43 530; 394 | - |
| BW at 21 days * | 840.00 ± 69 866; 813 | 865.00 ± 67 894; 835 | - | 933.25 ± 96 962; 903 | 940.00 ± 113 1120; 760 | - |
| BW at 28 days * | 1393,21 ± 137 1446; 1340 | 1436.82 ± 114 1487; 1386 | - | 1558.84 ± 182 1614; 1502 | 1552.50 ± 204 1877; 1227 | - |
| BW at 35 days * | 1913.21 ± 183 1984; 1842 | 1947.27 ± 161 2018; 1876 | - | 2103.95 ± 240 2178; 2030 | 2152.50 ± 281 2600; 1705 | - |
| BW at 42 days before slaughter * | 2585.00 ± 298 2700; 2469 | 2588.64 ± 265 2706; 2471 | - | 2919.77 ± 318 3018; 2822 | 2967.50 ± 415 3627; 2308 | - |
| Trunk weight * | 1798.00 ± 190 1871; 1724 | 1817.45 ± 188 1901; 1734 | - | 1989.60 ± 224 2058; 1920 | 2060.25 ± 289 2520; 1600 | - |
| Giblets weight * | 156.79 ± 18 163; 149 | 161.45 ± 14 168; 155 | - | 169.14 ± 18 174; 163 | 165.50 ± 21 199; 132 | - |
| Abdominal fat weight * | 35.32 ± 9 38; 32 | 35.68 ± 13 41; 30 | - | 51.47 ± 12 55; 47 | 52.50 ± 17 80; 25 | - |
| Breast muscle with skin * | 542.18± 53 562; 521 | 558.00± 64 586; 529 | - | 668.81± 84 694; 643 | 684.50± 106 853; 515 | - |
| Breast muscle without skin * | 501.75 ± 50 521; 482 | 517.09 ± 61 544; 489 | - | 615.98 ± 83 641; 590 | 629.25 ± 98 712; 530 | - |
| Thigh muscle with skin * | 470.68 ± 61 494; 447 | 475.14 ± 55 499; 450 | - | 499.98 ± 60 519; 584 | 519.75 ± 94 669; 371 | - |
| Thigh muscle without skin * | 421.39 ± 55 442; 400 | 426.77 ± 53 450; 402 | - | 441.88 ± 60 460; 423 | 464.25 ± 90 608; 320 | - |
| Slaughter value ** | 69.66 | 70.22 | - | 68.14 | 69.42 | - |
| Slaughter percentage *** | 75.74 | 76.48 | - | 73.94 | 75.01 | - |
| Parameter | Line | |||||
|---|---|---|---|---|---|---|
| Hubbard F15 | Cobb E | |||||
| Genotype | Genotype | |||||
| AA (20) | AB (27) | BB (3) | AA (17) | AB (27) | BB (1) | |
| Mean ± SD; CI | ||||||
| BW at 14 days * | 419.50 ± 33 435; 403 | 427.78 ± 32 440; 415 | 423.33 ± 15 461; 385 | 468.82 ± 39 489; 449 | 474.81 ± 43 492; 458 | 460.00 |
| BW at 21 days * | 839.50 ± 72 873; 805 | 864.07 ± 66 890; 838 | 810.00 ± 62 965; 655 | 927.65 ± 95 976; 879 | 932.22 ± 103 973; 892 | 1010.00 |
| BW at 28 days * | 1392.50 ± 128 1452; 1333 | 1436.67 ± 128 1487; 1385 | 1326.67 ± 90 1552; 1101 | 1535.29 ± 184 1630; 1441 | 1554.81 ± 184 1628; 1482 | 1750.00 |
| BW at 35 days * | 1894.00 ± 179 1978; 1810 | 1967.78 ± 164 2032; 1902 | 1800.00 ± 125 2110; 1489 | 2096.47 ± 232 2216; 1977 | 2097.41 ± 256 2199; 1996 | 2300.00 |
| BW at 42 days before slaughter * | 2578.50 ± 320 2728; 2428 | 2611.85 ± 257 2713; 2510 | 2413.33± 240 3009; 1818 | 2891.76 ± 344 3069; 2716 | 2912.59 ± 311 3036; 2789 | 3170.00 |
| trunk weight * | 1791.20 ± 206 1887; 1695 | 1827.41 ± 178 1898; 1757 | 1721.33 ± 157 2110; 1333 | 1958.06 ± 226 2074; 1842 | 1996.22 ± 228 2086; 1906 | 2251.00 |
| giblets weight * | 159.45 ± 19 168; 151 | 159.44 ± 15 165; 154 | 149.33 ± 18 194; 105 | 166.53 ± 20 177; 156 | 168.74 ± 18 176; 162 | 194.00 |
| abdominal fat weight * | 35.55 ± 11 41; 30 | 36.00 ± 9 40; 32 | 30.33 ± 18 75; (-14) | 50.59 ± 13 57; 44 | 51.26 ± 12 56; 46 | 63.00 |
| breast muscle with skin * | 539.65 ± 64 569; 510 | 555.85 ± 56 578; 533 | 552.00 ± 33 634; 470 | 651.24 ± 74 689; 613 | 676.11 ± 90 712; 641 | 809.00 |
| breast muscle without skin * | 498.75 ± 60 527; 471 | 515.59 ± 53 537; 495 | 509.67 ± 36 600; 420 | 598.82 ± 72 636; 562 | 622.37 ± 89 658; 587 | 753.00 |
| thigh muscle with skin * | 471.80 ± 63 501; 442 | 476.33 ± 56 498; 454 | 445.00 ± 52 575; 316 | 488.06 ± 65 522; 455 | 503.33 ± 61 527; 479 | 552.00 |
| thigh muscle without skin * | 423.25 ± 59 451; 396 | 426.74 ± 52 447; 406 | 400.33 ± 49 522; 278 | 431.24 ± 63 464; 399 | 445.56 ± 62 470; 421 | 487.00 |
| slaughter value ** | 69.57 | 69.99 | 71.36 | 67.77 | 68.51 | 71.01 |
| slaughter percentage *** | 75.78 | 76.12 | 77.54 | 73.53 | 74.31 | 77.13 |
| Parameter | Line | |||||
|---|---|---|---|---|---|---|
| Hubbard F15 | Cobb E | |||||
| Genotype | Genotype | |||||
| AA (15) | AB (20) | BB (15) | AA (20) | AB (21) | BB (6) | |
| Mean ± SD; CI | ||||||
| BW at 14 days * | 420.67 ± 40 443; 398 | 433.00 ± 24 444; 422 | 416.00 ± 30 433; 399 | 462.00 ± 38 480; 444 | 484.76 ± 41 503; 466 | 463.33 ± 34 499; 428 |
| BW at 21 days * | 842.67 ± 72 883; 803 | 866.00 ± 65 896; 836 | 839.33 ± 72 879; 799 | 888.50 ± 93 932; 845 | 980.00 ± 91 1021; 939 | 923.33 ± 50 976; 871 |
| BW at 28 days * | 1399.33 ± 122 1467; 1332 | 1420.50 ± 117 1475; 1366 | 1414.67 ± 154 1499; 1330 | 1453.00 ± 167 1531; 1375 | 1664.76 ± 149 1733; 1597 | 1536.67 ± 125 1668; 1405 |
| BW at 35 days * | 1884.67 ± 171 1979; 1790 | 1938.00 ± 165 2015; 1861 | 1958.67 ± 187 2062; 1855 | 1986.00 ± 240 2098; 1874 | 2241.91 ± 190 2328; 2155 | 2046.67 ± 176 2231; 1862 |
| BW at 42 days before slaughter * | 2541.33 ± 255 2682; 2400 | 2597.00 ± 302 2738; 2456 | 2618.00 ± 292 2780; 2456 | 2778.50 ± 312 2924; 2633 | 3104.29 ± 270 3227; 2982 | 2780.00 ± 208 2998; 2562 |
| trunk weight * | 1773.27 ± 175 1870; 1676 | 1825.40 ± 209 1923; 1728 | 1814.73 ± 177 1913; 1717 | 1896.95 ± 223 2001; 1793 | 2129.19 ± 181 2211; 2047 | 1857.00 ± 136 1999; 1715 |
| giblets weight * | 159.00 ± 15 168; 150 | 158.15 ± 19 167; 149 | 159.60 ± 15 168; 151 | 161.45 ± 19 170; 153 | 177.43 ± 16 185; 170 | 163.33 ± 14 178; 148 |
| abdominal fat weight * | 31.53 ± 7 35; 28 | 37.05 ± 13 43; 31 | 37.33 ± 10 43; 32 | 54.95 ± 14 62; 48 | 48.90 ± 9 53; 45 | 49.50 ± 15 66; 33 |
| breast muscle with skin * | 533.67 ± 59 566; 501 | 555.15 ± 68 587; 523 | 556.60 ± 41 580; 534 | 648.30 ± 86 689; 608 | 710.48 ± 72 743; 678 | 601.83 ± 51 656; 548 |
| breast muscle without skin * | 494.33 ± 54 525; 465 | 515.55 ± 66 546; 485 | 513.27 ± 39 535; 491 | 598.60 ± 86 639; 559 | 653.62 ± 73 687; 621 | 551.00 ± 52 605; 497 |
| thigh muscle with skin * | 469.00 ± 63 504; 434 | 476.75 ± 63 506; 447 | 470.80 ± 49 498; 444 | 475.65 ± 61 504; 447 | 538.72 ± 51 562; 516 | 458.67 ± 30 490; 428 |
| thigh muscle without skin * | 421.47 ± 56 453; 390 | 429.10 ± 61 458; 401 | 418.93 ± 45 444; 394 | 419.65 ± 61 448; 391 | 477.05 ± 54 502; 452 | 407.83 ± 32 441; 375 |
| slaughter value * * | 69.80 | 70.34 | 69.44 | 68.26 | 68.62 | 66.93 |
| slaughter percentage * * * | 76.08 | 76.43 | 75.57 | 74.08 | 74.34 | 72.81 |
| Parameter | Genetic Model | ||||
|---|---|---|---|---|---|
| Codominant | Dominant | Recessive | Overdominant | Log-Additive | |
| BW at 14 days | ns | ns | ns | ns | ns |
| BW at 21 days | −0.013 | 0.014 | 0.606 | 0.005 | 0.199 |
| BW at 28 days | −0.004 | 0.002 | 0.847 | 0.004 | 0.035 |
| BW at 35 days | −0.004 | 0.001 | 0.560 | 0.008 | 0.016 |
| BW at 42 days before slaughter | ns | ns | ns | ns | ns |
| trunk weight | −0.010 | 0.013 | 0.535 | 0.003 | 0.215 |
| giblets weight | ns | ns | ns | ns | ns |
| abdominal fat weight | ns | ns | ns | ns | ns |
| breast muscle with skin | ns | ns | ns | ns | ns |
| breast muscle without skin | ns | ns | ns | ns | ns |
| thigh muscle with skin | ns | ns | ns | ns | ns |
| thigh muscle without skin | ns | ns | ns | ns | ns |
| slaughter value | −0.015 | 0.646 | 0.015 | 0.014 | 0.306 |
| slaughter percentage | ns | ns | ns | ns | ns |
© 2020 by the authors. Licensee MDPI, Basel, Switzerland. This article is an open access article distributed under the terms and conditions of the Creative Commons Attribution (CC BY) license (http://creativecommons.org/licenses/by/4.0/).
Share and Cite
Hosnedlova, B.; Vernerova, K.; Kizek, R.; Bozzi, R.; Kadlec, J.; Curn, V.; Kouba, F.; Fernandez, C.; Machander, V.; Horna, H. Associations Between IGF1, IGFBP2 and TGFß3 Genes Polymorphisms and Growth Performance of Broiler Chicken Lines. Animals 2020, 10, 800. https://doi.org/10.3390/ani10050800
Hosnedlova B, Vernerova K, Kizek R, Bozzi R, Kadlec J, Curn V, Kouba F, Fernandez C, Machander V, Horna H. Associations Between IGF1, IGFBP2 and TGFß3 Genes Polymorphisms and Growth Performance of Broiler Chicken Lines. Animals. 2020; 10(5):800. https://doi.org/10.3390/ani10050800
Chicago/Turabian StyleHosnedlova, Bozena, Katerina Vernerova, Rene Kizek, Riccardo Bozzi, Jaromir Kadlec, Vladislav Curn, Frantisek Kouba, Carlos Fernandez, Vlastislav Machander, and Hana Horna. 2020. "Associations Between IGF1, IGFBP2 and TGFß3 Genes Polymorphisms and Growth Performance of Broiler Chicken Lines" Animals 10, no. 5: 800. https://doi.org/10.3390/ani10050800