Article

Hepatic Inflammatory Response to Exogenous LPS Challenge is Exacerbated in Broilers with Fatty Liver Disease

Key Laboratory of Animal Physiology & Biochemistry, Nanjing Agricultural University, Nanjing 210095, China
*
Author to whom correspondence should be addressed.
Animals 2020, 10(3), 514; https://doi.org/10.3390/ani10030514
Submission received: 20 January 2020 / Revised: 6 March 2020 / Accepted: 13 March 2020 / Published: 19 March 2020
(This article belongs to the Special Issue Fatty Liver in Domestic Animals)

Abstract

:

Simple Summary

Fatty liver disease is the most common liver abnormality, characterized by lipid accumulation within the hepatocytes. The disease results in a significant economic burden on the poultry industry. Microbial infection is recognized as a continuous challenge worldwide. The current study evaluated hepatic function and inflammatory response in broilers with fatty livers following acute lipopolysaccharide (LPS) challenge. Results indicate that broilers suffering from fatty liver disease are more susceptible to the negative effects of LPS, showing inflammatory response activation and more severe damage to the liver.

Abstract

This study aimed to examine hepatic function and inflammatory response in broilers with fatty livers, following acute lipopolysaccharide (LPS) challenge. One-day-old Lihua yellow broilers were fed a basal diet. Broilers were divided into four groups: control (CON), corticosterone treatment (CORT), LPS treatment (LPS), and LPS and CORT treatment (LPS&CORT). Results show that CORT induced an increase in plasma and liver triglycerides (TGs), which were accompanied by severe hepatic steatosis. The LPS group showed hepatocyte necrosis with inflammatory cell infiltration. Total liver damage score in the LPS&CORT group was significantly higher than that in the LPS group (p < 0.05). Activity levels of plasma alanine aminotransferase (ALT) and aspartate aminotransferase (AST) were similar in the CON and CORT groups, but higher in the LPS group. Gene expression upregulation of the proinflammatory cytokines (NF-κB, IL-1β, IL-6, IFN-γ, and iNOS) was also noted in the LPS group (p < 0.05). In particular, LPS injection exacerbated the gene expression of these proinflammatory cytokines, even when accompanied by CORT injections (p < 0.05). In summary, our results indicate that broilers suffering from fatty liver disease are more susceptible to the negative effects of LPS, showing inflammatory response activation and more severe damages to the liver.

1. Introduction

Non-alcoholic fatty liver disease (NAFLD) is an emerging health problem that affects a considerable proportion of adults in developing countries [1]. NAFLD is a complex, consisting of a range of diseases including hepatocellular steatosis, steatohepatitis, fibrosis, and irreversible cirrhosis [2]. The condition is tightly related to obesity, metabolic diseases, and insulin resistance [3]. In chickens, the relatively basic lymphatic system and chylomicrons transport of fat through the portal vein enhance fat synthesis and deposition in the liver [4]. Moreover, the de novo lipogenesis pathway is mainly active in the liver, similar to humans. Such a feature increases the susceptibility to fatty liver disease [5]. Thus, fatty liver disease is a concern for chickens, and causes a significant economic burden on the poultry industry [6]. It has been demonstrated that excessive glucocorticoid (GC) exposure can cause metabolic syndrome, including fatty liver disease, in both mammals and birds [7]. The active form of GC in chickens is primarily corticosterone (CORT), an indicator of stress [8]. Moreover, it is well known that treatment with exogenous CORT can cause abnormal fat deposition in the liver [9,10].
Microbial infection is recognized as a continuous challenge in the poultry industry. In the intensive poultry production system, broilers are confined to a limited space in large numbers [11], which exacerbates the risk of microbial infection. Approximately 70% of the liver’s blood supply arrives through the portal vein. Among other functions, the portal vein delivers substances absorbed through the intestine. Because of this, the liver is also the first barrier against intestinal pathogenic microorganisms such as bacteria and bacterial byproducts [12]. Bacterial products, such as lipopolysaccharide (LPS), a main component of the cell wall of gram-negative bacteria, are identified by the hepatic immune system and cause hepatic inflammation [13]. Intraperitoneal LPS injection was shown to simulate exogenous infection and induce hepatic inflammation [14]. Mechanisms of LPS-induced inflammatory response have been extensively explored. Extracellular LPS can be recognized by the toll-like receptor 4 (TLR4), which leads to an activation of myeloid differentiation factor 88 (MyD88). The triggering of MyD88 pathways ultimately leads to the transcription factor nuclear factor-κB (NF-κB) [15,16] and the activation of inflammatory cascades. This cascade produces various proinflammatory cytokines, such as tumor necrosis factor α (TNF-α), interleukin (IL)-1, and IL-6 [17]. C-reactive protein (CRP) and serum amyloid A (SAA) are acute-phase proteins. They are upregulated in response to LPS-induced inflammatory cytokines, leading to the acute-phase reaction.
Inflammation and fatty liver disease appear to be tightly linked. It has been reported that inflammasome-mediated dysbiosis regulates progression of NAFLD and obesity, and results in exacerbation of hepatic steatosis in mice [18]. Similarly, small doses of LPS administered to Wistar rats has promoted the development of NAFLD [19]. In contrast, a study by Sharifnia et al. showed that NAFLD increased fatty acid damage and hepatic sensitivity to LPS in a human cell culture model [20]. However, hepatic sensitivity to acute infection in birds with fatty liver disease remains unknown.
In this study, we hypothesized that exposure to LPS could exacerbate inflammatory responses in birds suffering from fatty liver disease. The aim of this study was to verify this hypothesis, using a CORT-induced fatty liver model and LPS-induced acute inflammation, to further explore how fatty liver disease affects the inflammatory response to an acute stimulus such as LPS.

2. Materials and Methods

All animal procedures in this study were approved by the Nanjing Agricultural University Animal Care and Use Committee (Approval #2012CB124703). Sampling procedures were in accordance with the “Guidelines on Ethical Treatment of Experimental Animals” (2006) No. 398, formulated by the Ministry of Science and Technology of China.

2.1. Animals and Treatment

One-day-old Lihua yellow broilers were purchased and raised at the Yangzhou Poultry Research Institute. All chicks had free access to food and water and received continuous illumination. Environmental temperature was maintained at 35 to 37 °C for the first week, then gradually decreased by approximately 3 °C per week until reaching a final temperature of 21 °C. The relative humidity was controlled at 55–65%. Dietary composition is shown in Table 1. After four weeks, broilers were randomly divided into four groups (n = 8/group): control (CON), CORT treatment (CORT), LPS treatment (LPS), and LPS and CORT treatment (LPS&CORT). Birds in the CON and LPS groups received vehicle treatment through daily subcutaneous injection of solvent (15% ethanol). Birds in the CORT and LPS&CORT groups received, for one week, CORT treatment (4.0 mg/kg) through daily (9:00–10:30 and 16:00–17:30) subcutaneous injections [10]. Corticosterone (C2505, Sigma-Aldrich, USA) was dissolved in 15% ethanol, and LPS (L2880, Sigma-Aldrich, St. Louis, MO, USA) was dissolved in saline. The LPS was extracted from Escherichia coli serotype O55:B5 by phenol. Body weight was recorded weekly from 1 to 35 days of age. At 35 days of age, two hours before sample collection, broilers from the LPS and LPS&CORT groups were injected intraperitoneally with 0.5 mg/kg LPS. Broilers from all groups were weighed and killed by rapid decapitation, in accordance with the American Veterinary Medical Association (AVMA) Guidelines for the Euthanasia of Animals (2013 Edition). Subsequently, blood samples were collected, centrifuged at 3500 rmp for 10 min, and the plasma was aspirated and stored at −20 °C, pending analysis. Liver samples were collected, rapidly frozen in liquid nitrogen, and kept at −80 °C until assayed. Liver tissue slices were also placed in 4% paraformaldehyde.

2.2. Histopathology

For histological analysis, liver specimens fixed in 4% formaldehyde-buffered solution were embedded in paraffin, then sectioned. Samples were rated based on the severity of damage. The degree of damages in liver specimens was assessed by the histopathologist using three parameters including hepatocytic vacuolation, hepatocyte necrosis, and the proliferation of interstitial substance. A five-point scale (0–4 equaling none, slight, mild, moderate, and severe, respectively) was used to assess these three parameters [21]. In each case, three tissue sections were examined and a numerical score was assigned.

2.3. Plasma Biochemical Indicators Measurement and Triglycerides Content in the Liver

Plasma activity of alanine aminotransferase (ALT) and aspartate aminotransferase (AST), and the levels of triglycerides (TG), total cholesterol (TCHOL), high- and low-density lipoprotein cholesterol (HDL and LDL, respectively), and glucose (GLU) were analyzed using an automatic biochemical analyzer (7020, HITACHI, Tokyo, Japan), as previously described [22]. Hepatic triglycerides were measured using a tissue triglyceride assay kit (E1013; Applygen Technologies Inc., Beijing, China) as previously described [8].

2.4. Reverse Transcription and Quantitative Real-Time PCR

Total RNA was extracted from liver samples (30 mg) with TRIzol Reagent (15596026, Invitrogen, Carlsbad, CA, USA). RNA concentration was assessed by a NanoDrop ND-1000 spectrophotometer (Thermo Fisher Scientific, Waltham, MA, USA). Subsequently, 500 ng of total RNA were reverse transcribed into cDNA, using random hexamer primers (Promega, USA). The cDNA was diluted 20× (1:20, v/v) before performing quantitative Real-Time PCR (RT-qPCR) on Mx3000 P Real-Time PCR System (Stratagene, San Diego, CA, USA). All primers were synthesized by Generay Biotech (Shanghai, China) and their sequences are listed in Table 2. The 18S rRNA gene was selected as a reference to normalize the expression of the other genes. The fold-expressions of the genes were analyzed by the 2−ΔΔCT method [23].

2.5. Statistical Analysis

Statistical analysis was performed using SPSS 20.0 for Windows (SPSS 20.0, SPSS, IBM, Armonk, NY, USA). Descriptive statistics were used to examine homogeneity of variances, and normal distribution was assessed by a Shapiro–Wilk test. Log10 transformation was performed before analysis if data distribution was not normal. Data involving the four groups were analyzed by one-way Analysis of Variance (ANOVA), and the General Linear Model (GLM) procedure was conducted to analyze body weight. Graphical presentations were prepared using GraphPad Prism 5.0. Results are presented as means ± standard error of mean (SEM). Statements of statistical significance were based on the probability value p < 0.05.

3. Results

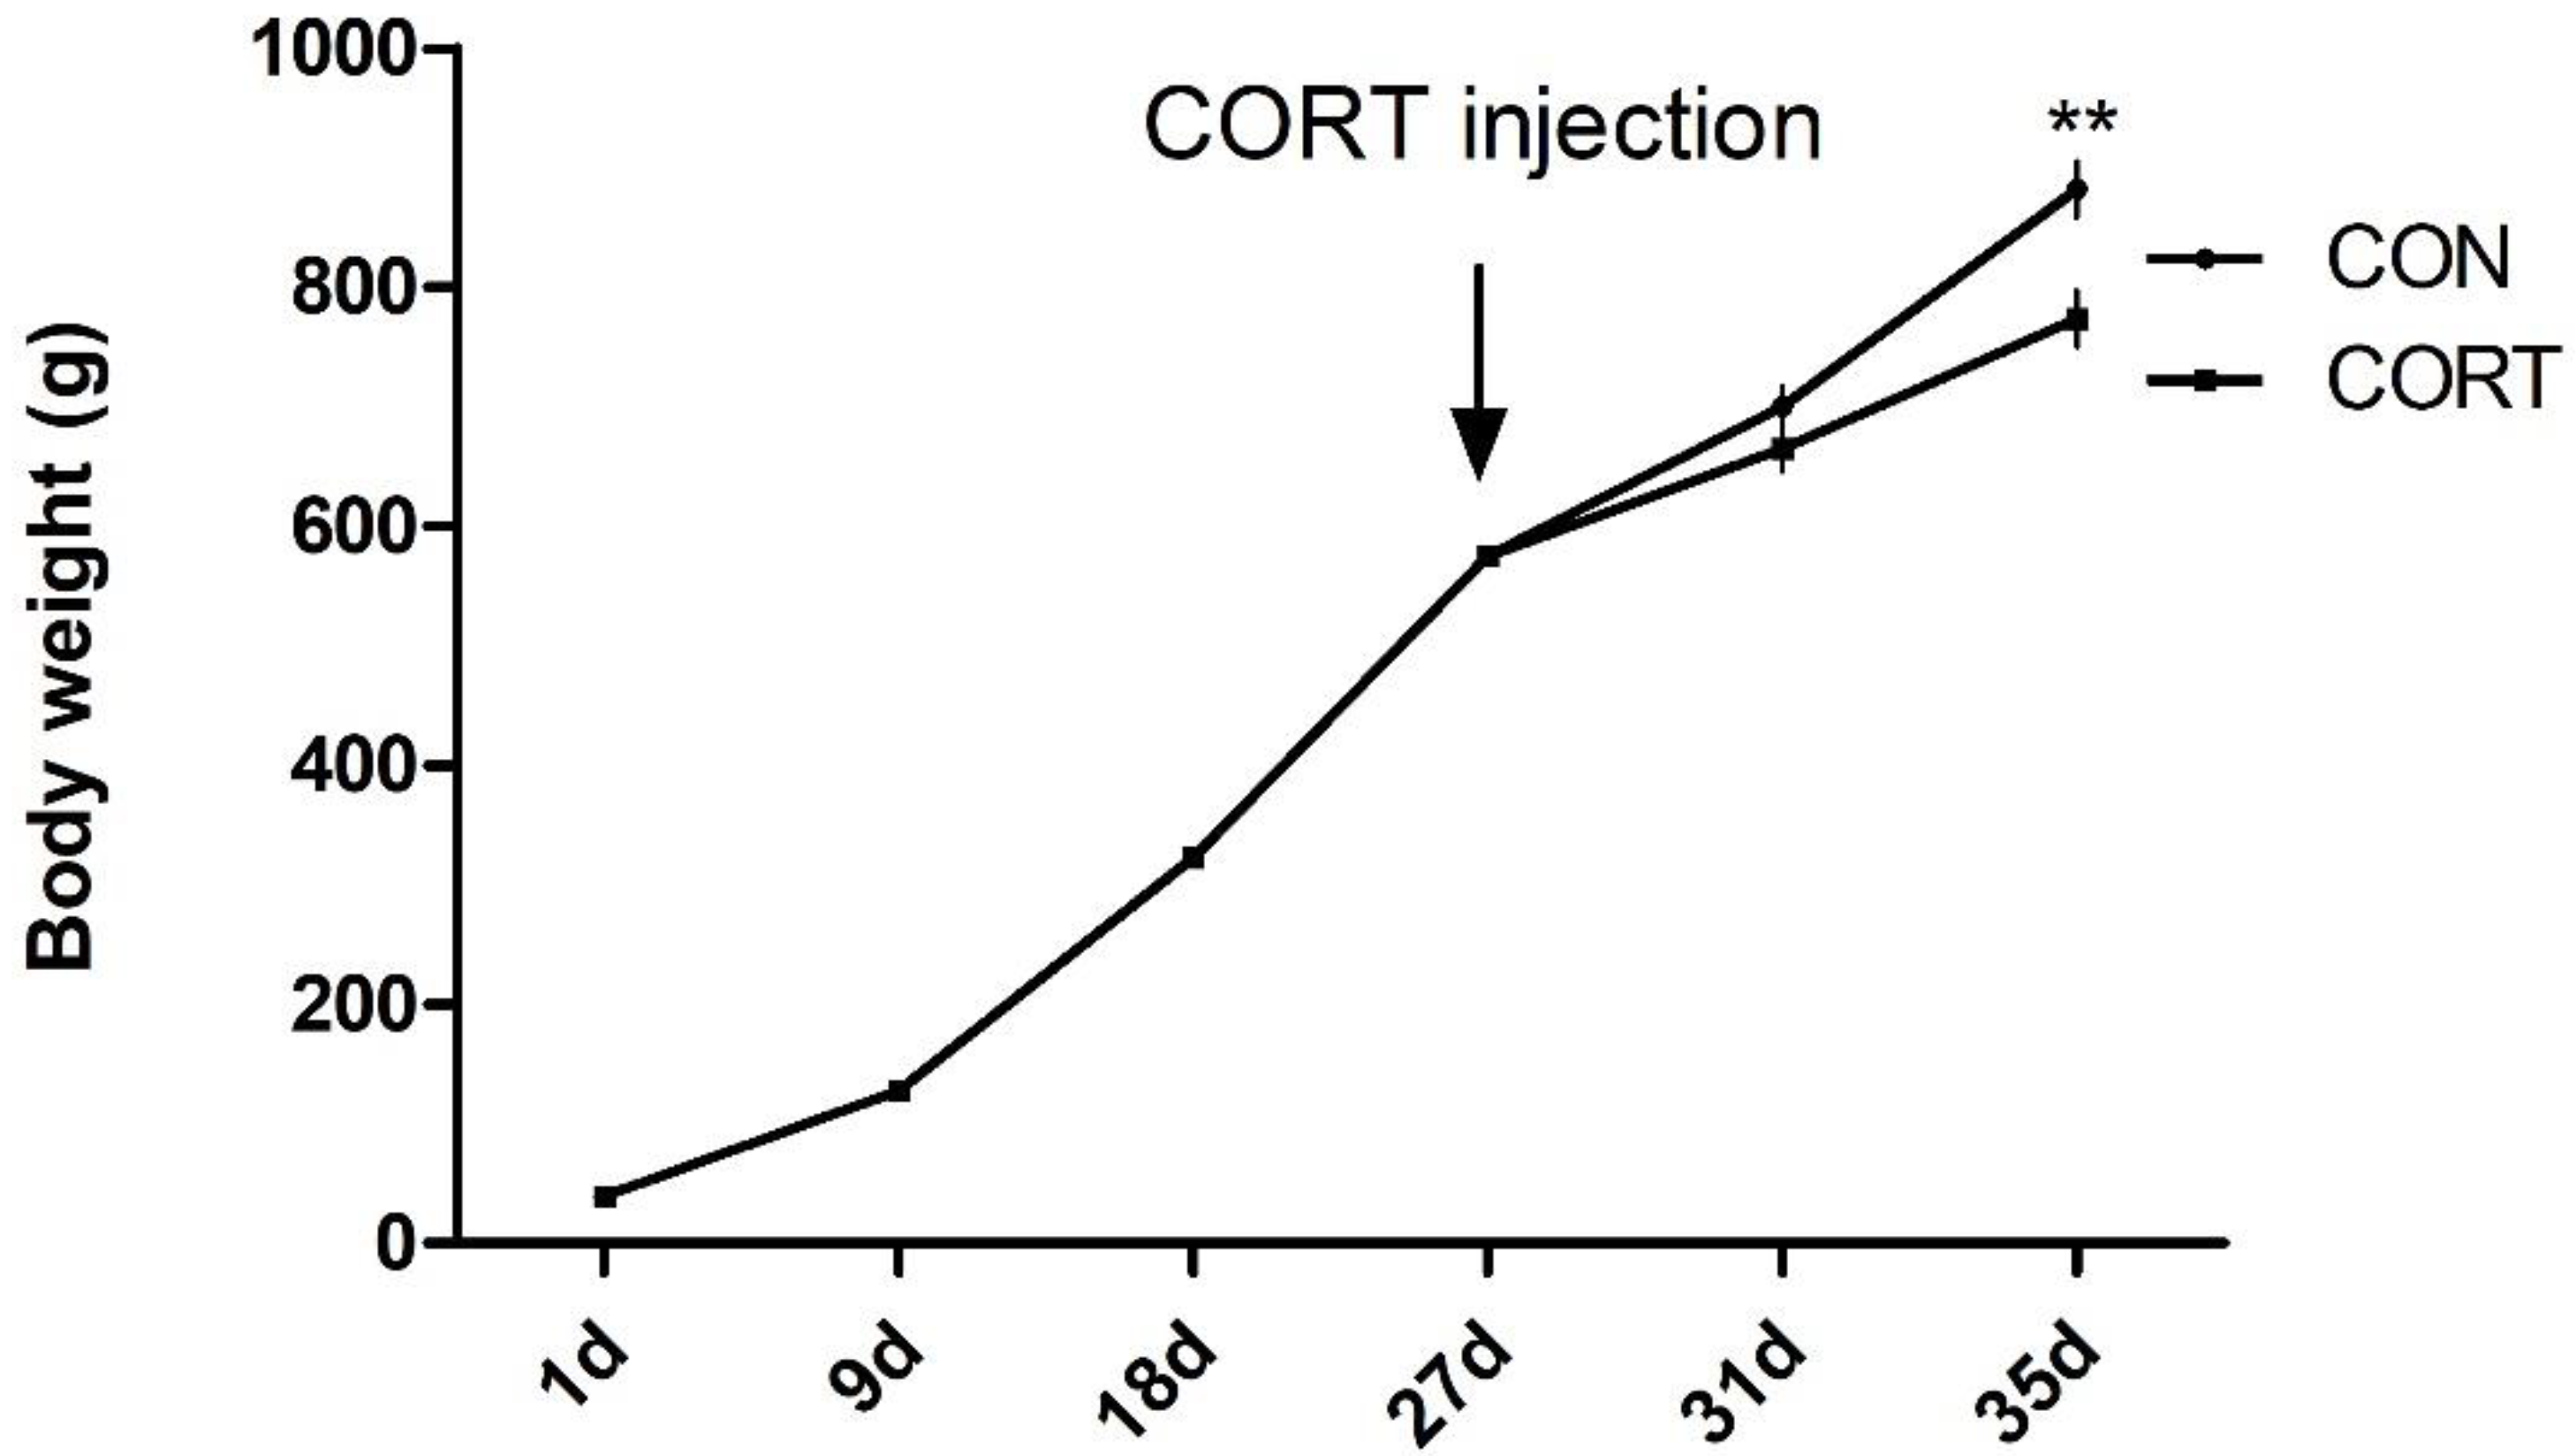
3.1. Growth Performance

Broilers showed linear growth from 1 to 35 days of age. However, consecutive CORT injections for seven days significantly slowed weight gain when compared to control chickens (p < 0.01; Figure 1).

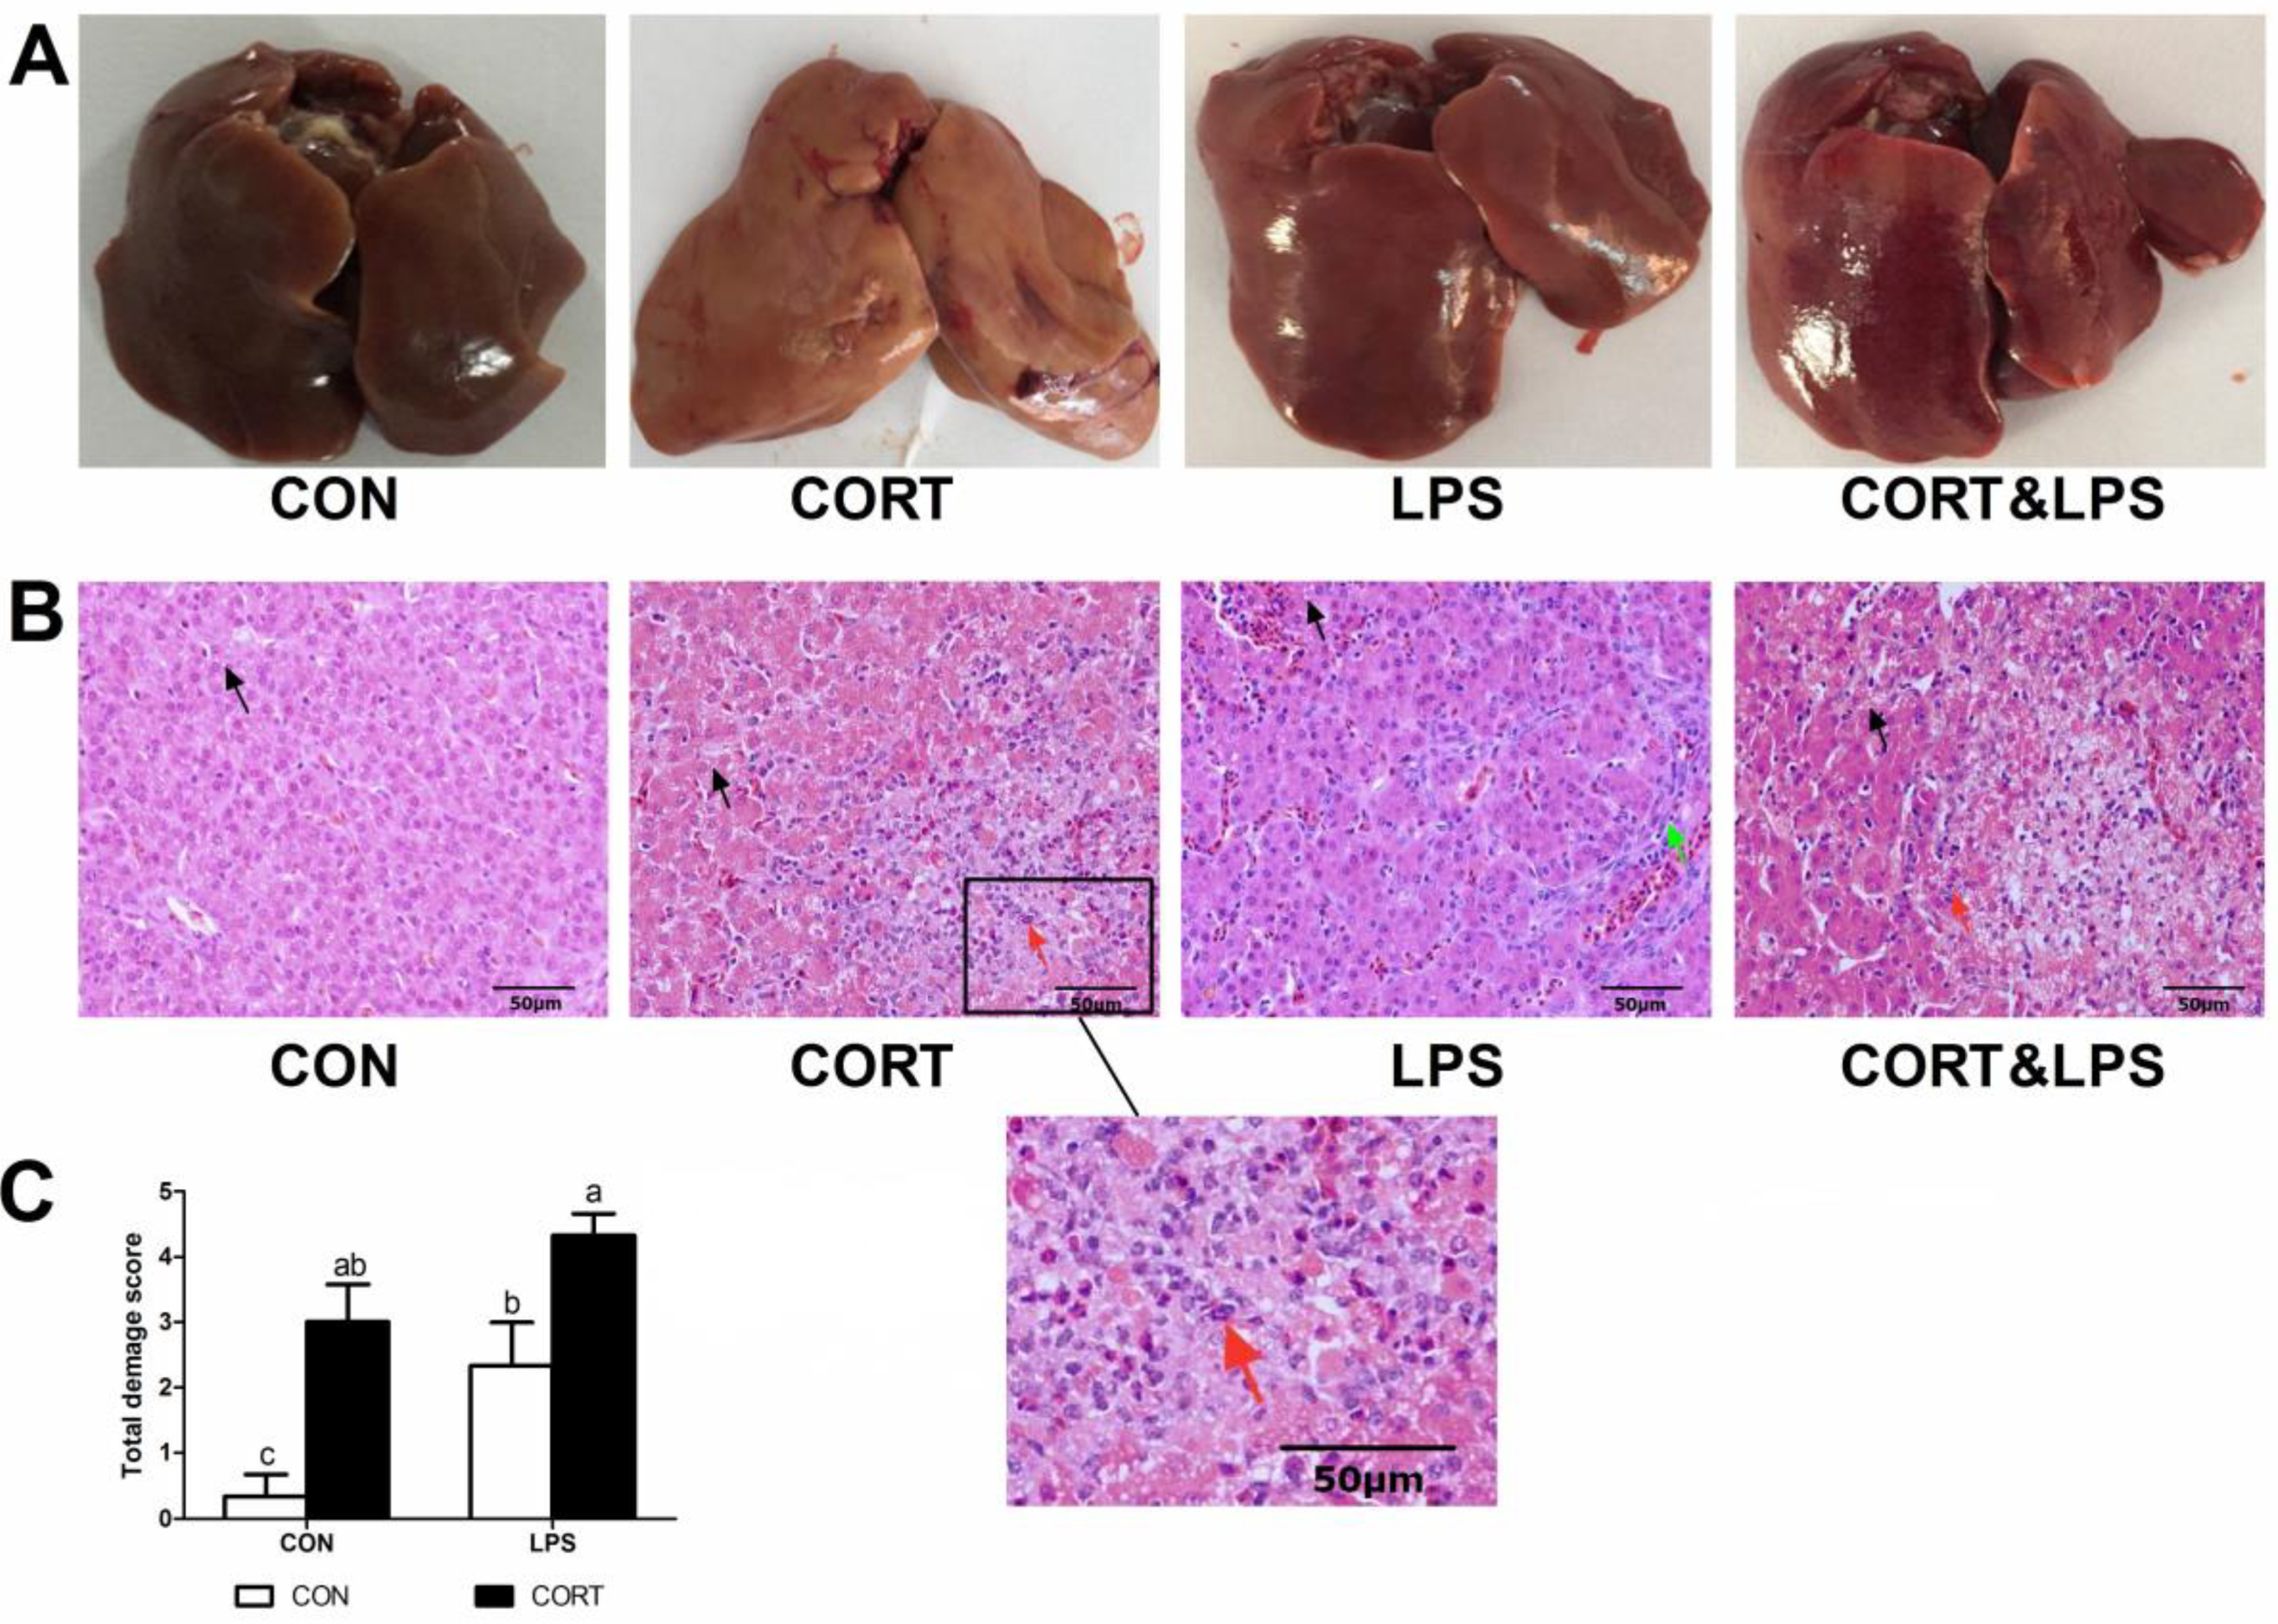
3.2. Hepatic Histological Analysis and Liver Damage Evaluation

In the CON group, chicken livers exhibited normal size and red color, while CORT injection caused liver swelling as well as yellow coloration, which is indicative of steatosis (Figure 2A). LPS induced liver swelling and slight congestion, whereas injection of CORT, along with LPS, resulted in liver swelling and severe congestion (Figure 2A).
Hepatic histological sections stained with hematoxylin and eosin (HE) showed that fine droplets of fat were diffusely distributed through the hepatocytes of the CON group. However, more-extensive hepatocytic vacuolation due to fat deposition and hepatocyte swelling were observed in the CORT group. This manifestation was even more obvious in the CORT&LPS group. LPS challenge induced hepatic interstitial substance proliferation. Abnormalities such as dilated sinusoids and hepatocyte necrosis, accompanied by inflammatory cell infiltration, were also observed in the LPS groups (Figure 2B). As shown in Figure 2C, CORT or LPS injection alone significantly affected the total damage score (p < 0.05). However, the CORT&LPS combined treatment group showed a higher total damage score when compared to the LPS group (p < 0.05 Figure 2C).

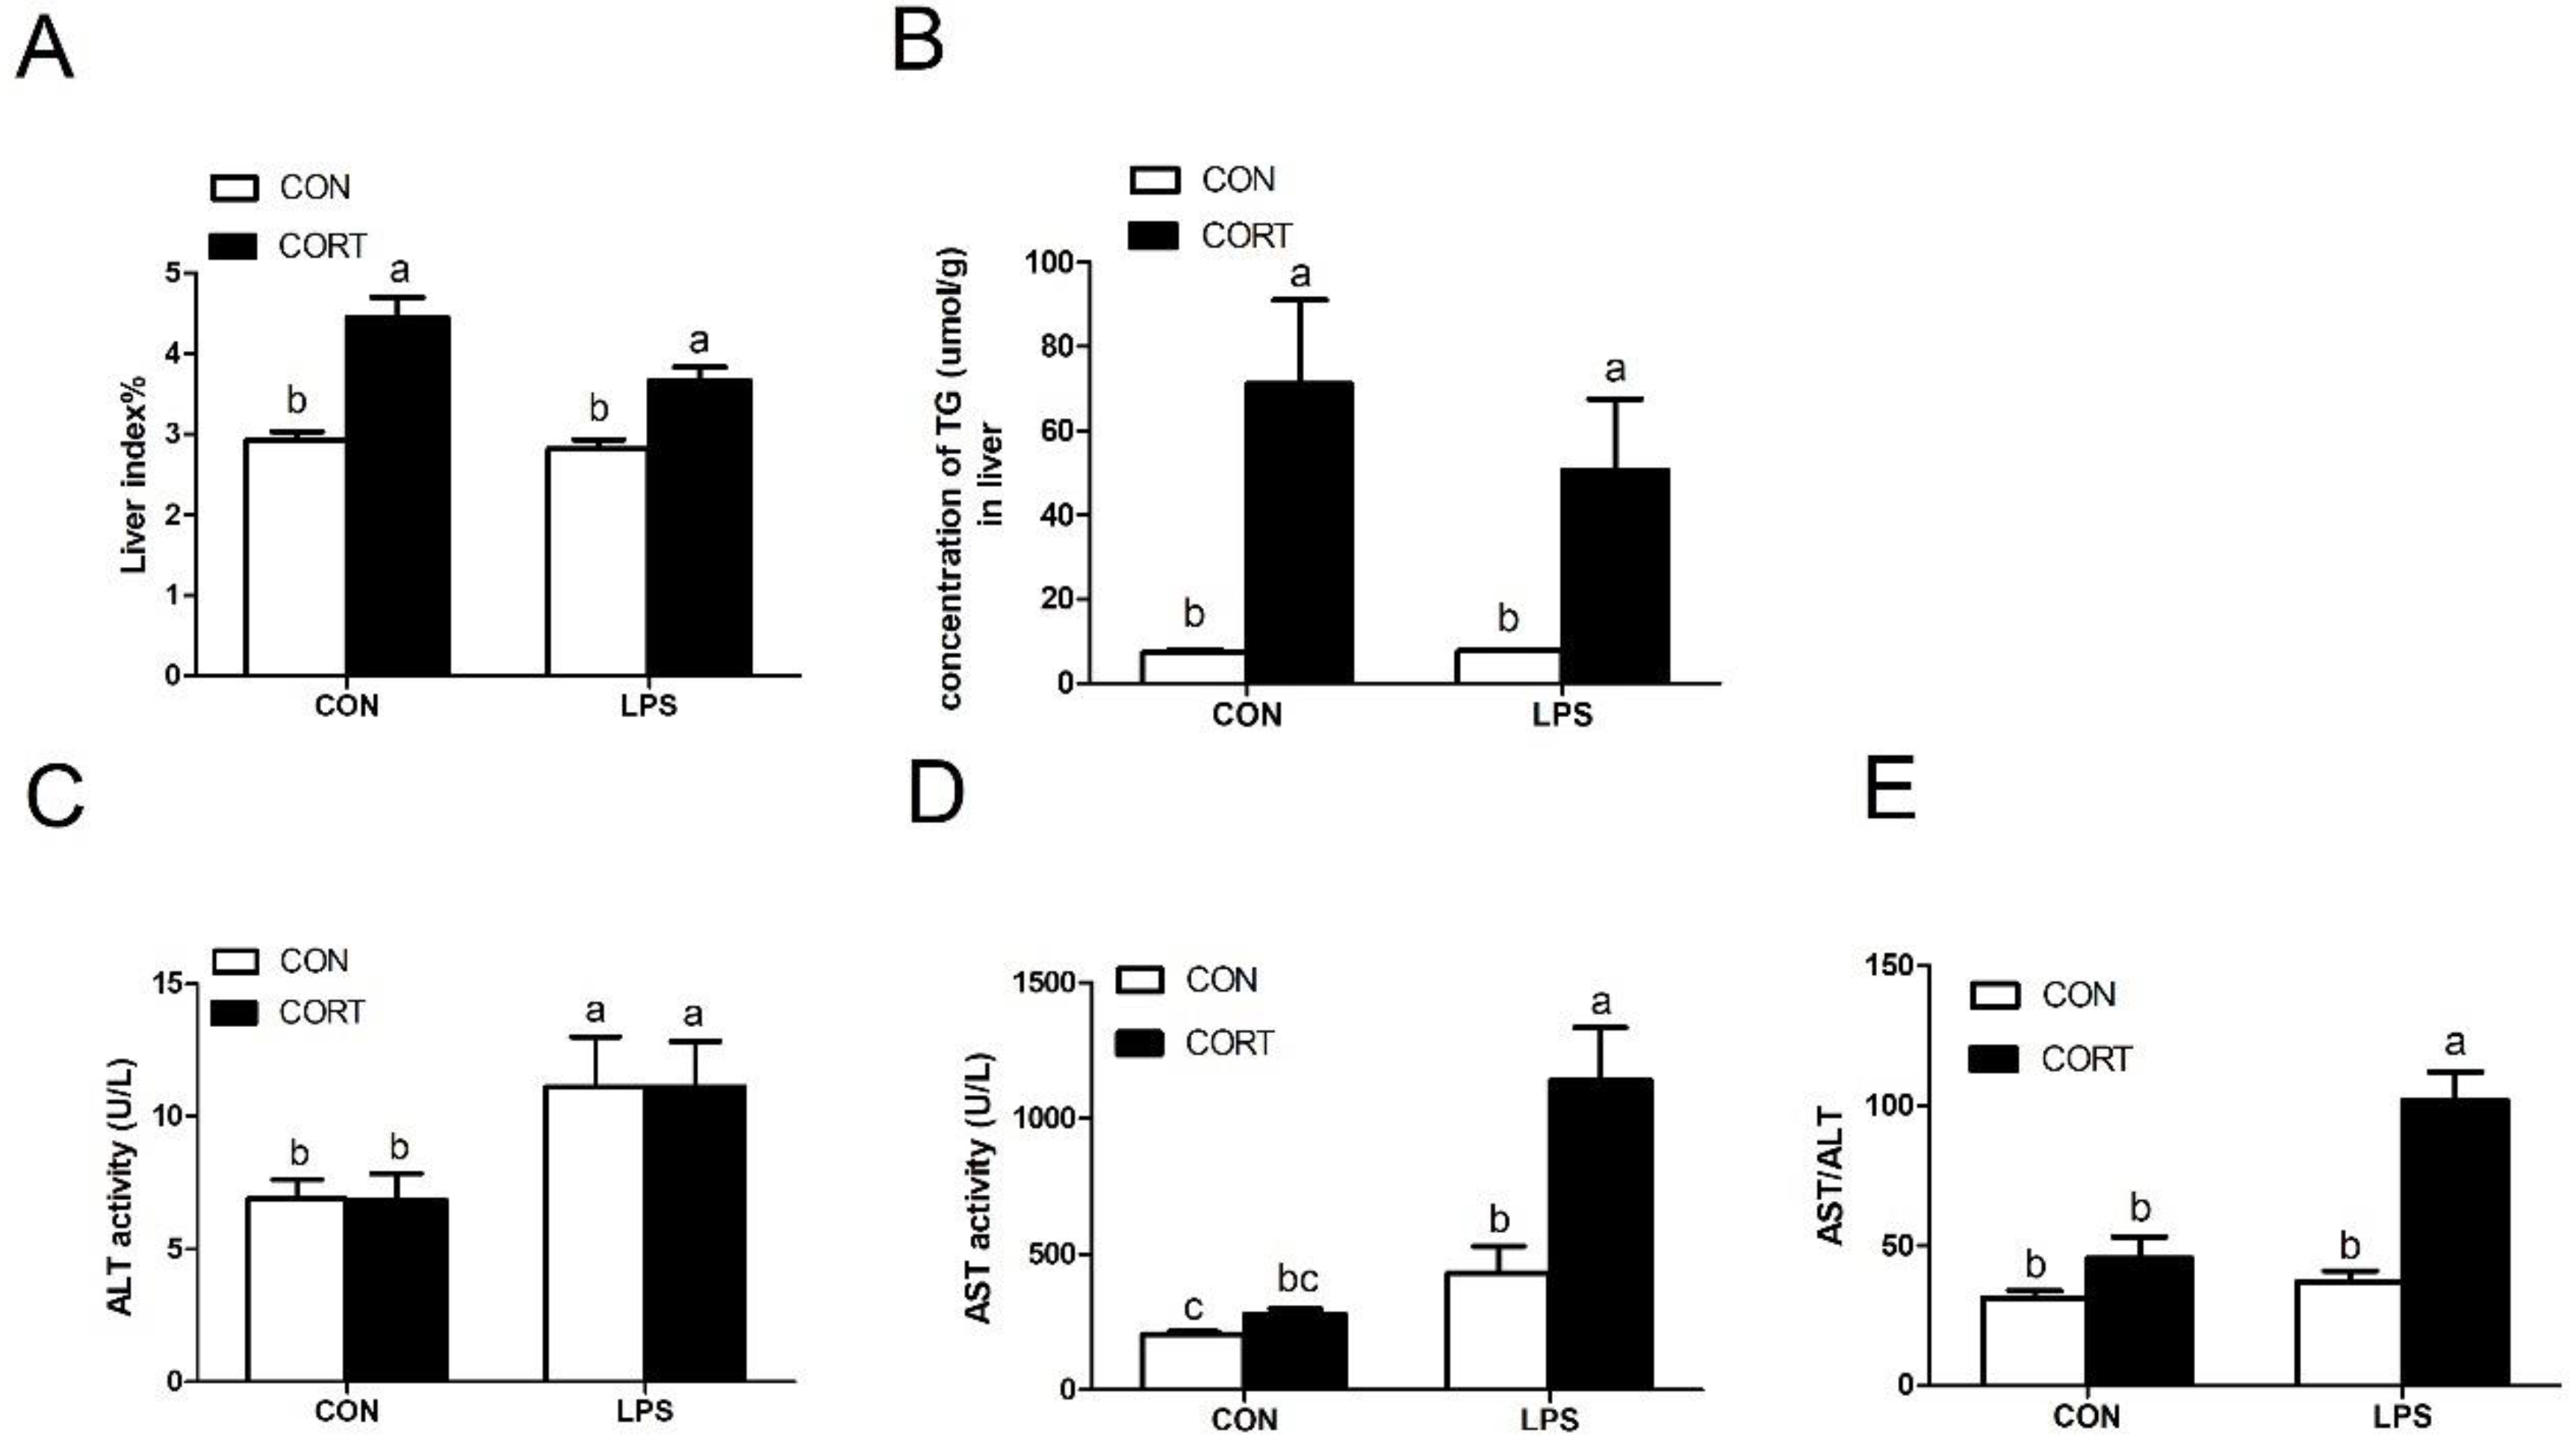
3.3. Plasma Biochemical Indicators

As shown in Table 3, when compared with the CON group, CORT treatment significantly enhanced the levels of plasma TG, TCHOL, HDL, and LDL (p < 0.05), while LPS treatment decreased plasma TG concentration. The CORT&LPS group had lower plasma levels of TCHOL and HDL when compared to the CORT group (p < 0.05). There was no significant difference in plasma glucose concentration among these groups.

3.4. Liver Damage Index

As shown in Figure 3, CORT challenge significantly increased the liver index and hepatic TG content (p < 0.05), but no differences were observed following LPS administration. Moreover, compared with the CON group, LPS injection significantly enhanced plasma ALT and AST activities (p < 0.05), but did not change the AST/ALT ratio. CORT administration had no effect on plasma activity or ratio. Interestingly, when combined with CORT, LPS exacerbated AST activity and altered the AST/ALT ratio when compared to the LPS group (p < 0.05).

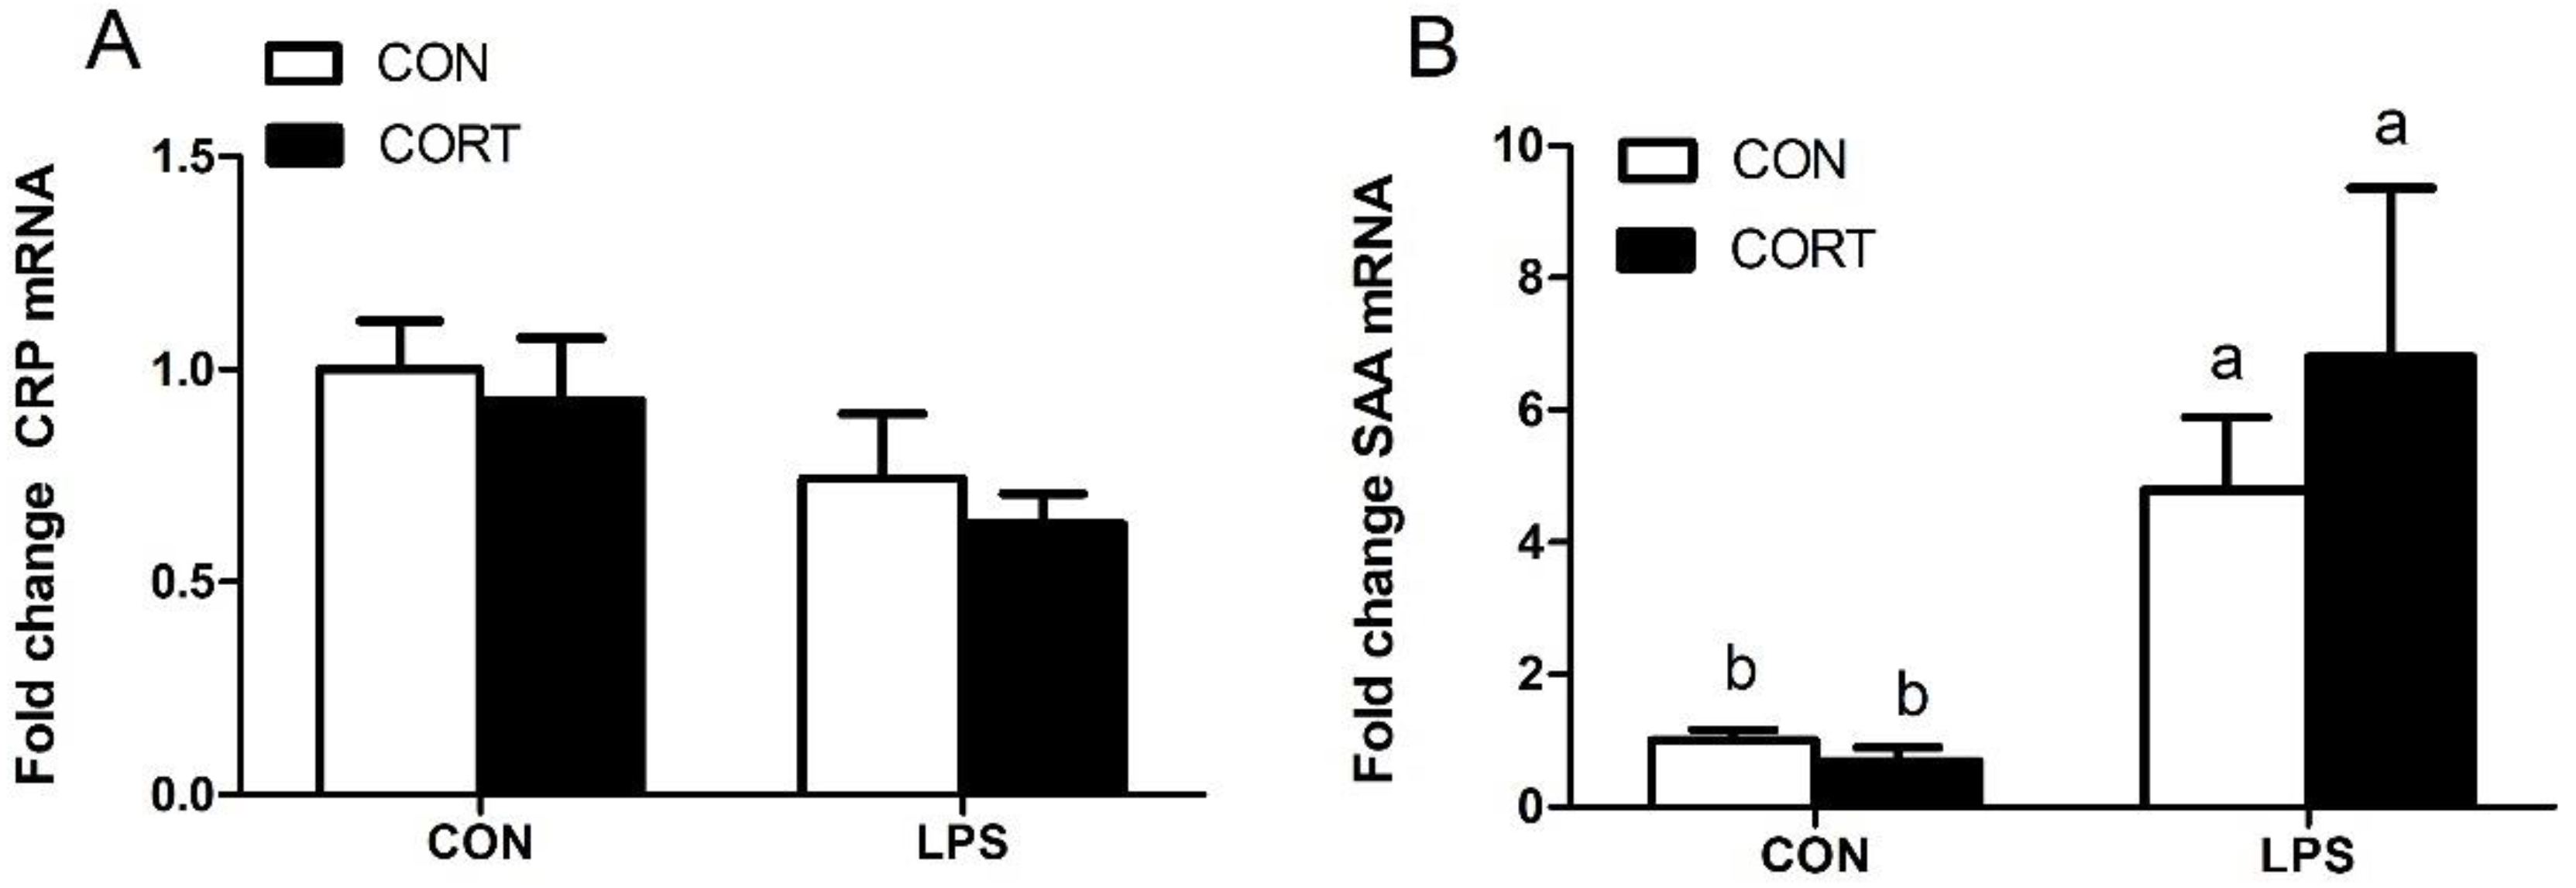
3.5. Hepatic Expression of Genes Encoding Acute-Phase Proteins

As shown in Figure 4, LPS, but not CORT, significantly upregulated hepatic expression of SAA mRNA (p < 0.05). Hepatic expression of CRP mRNA did not change following treatment with either CORT or LPS.

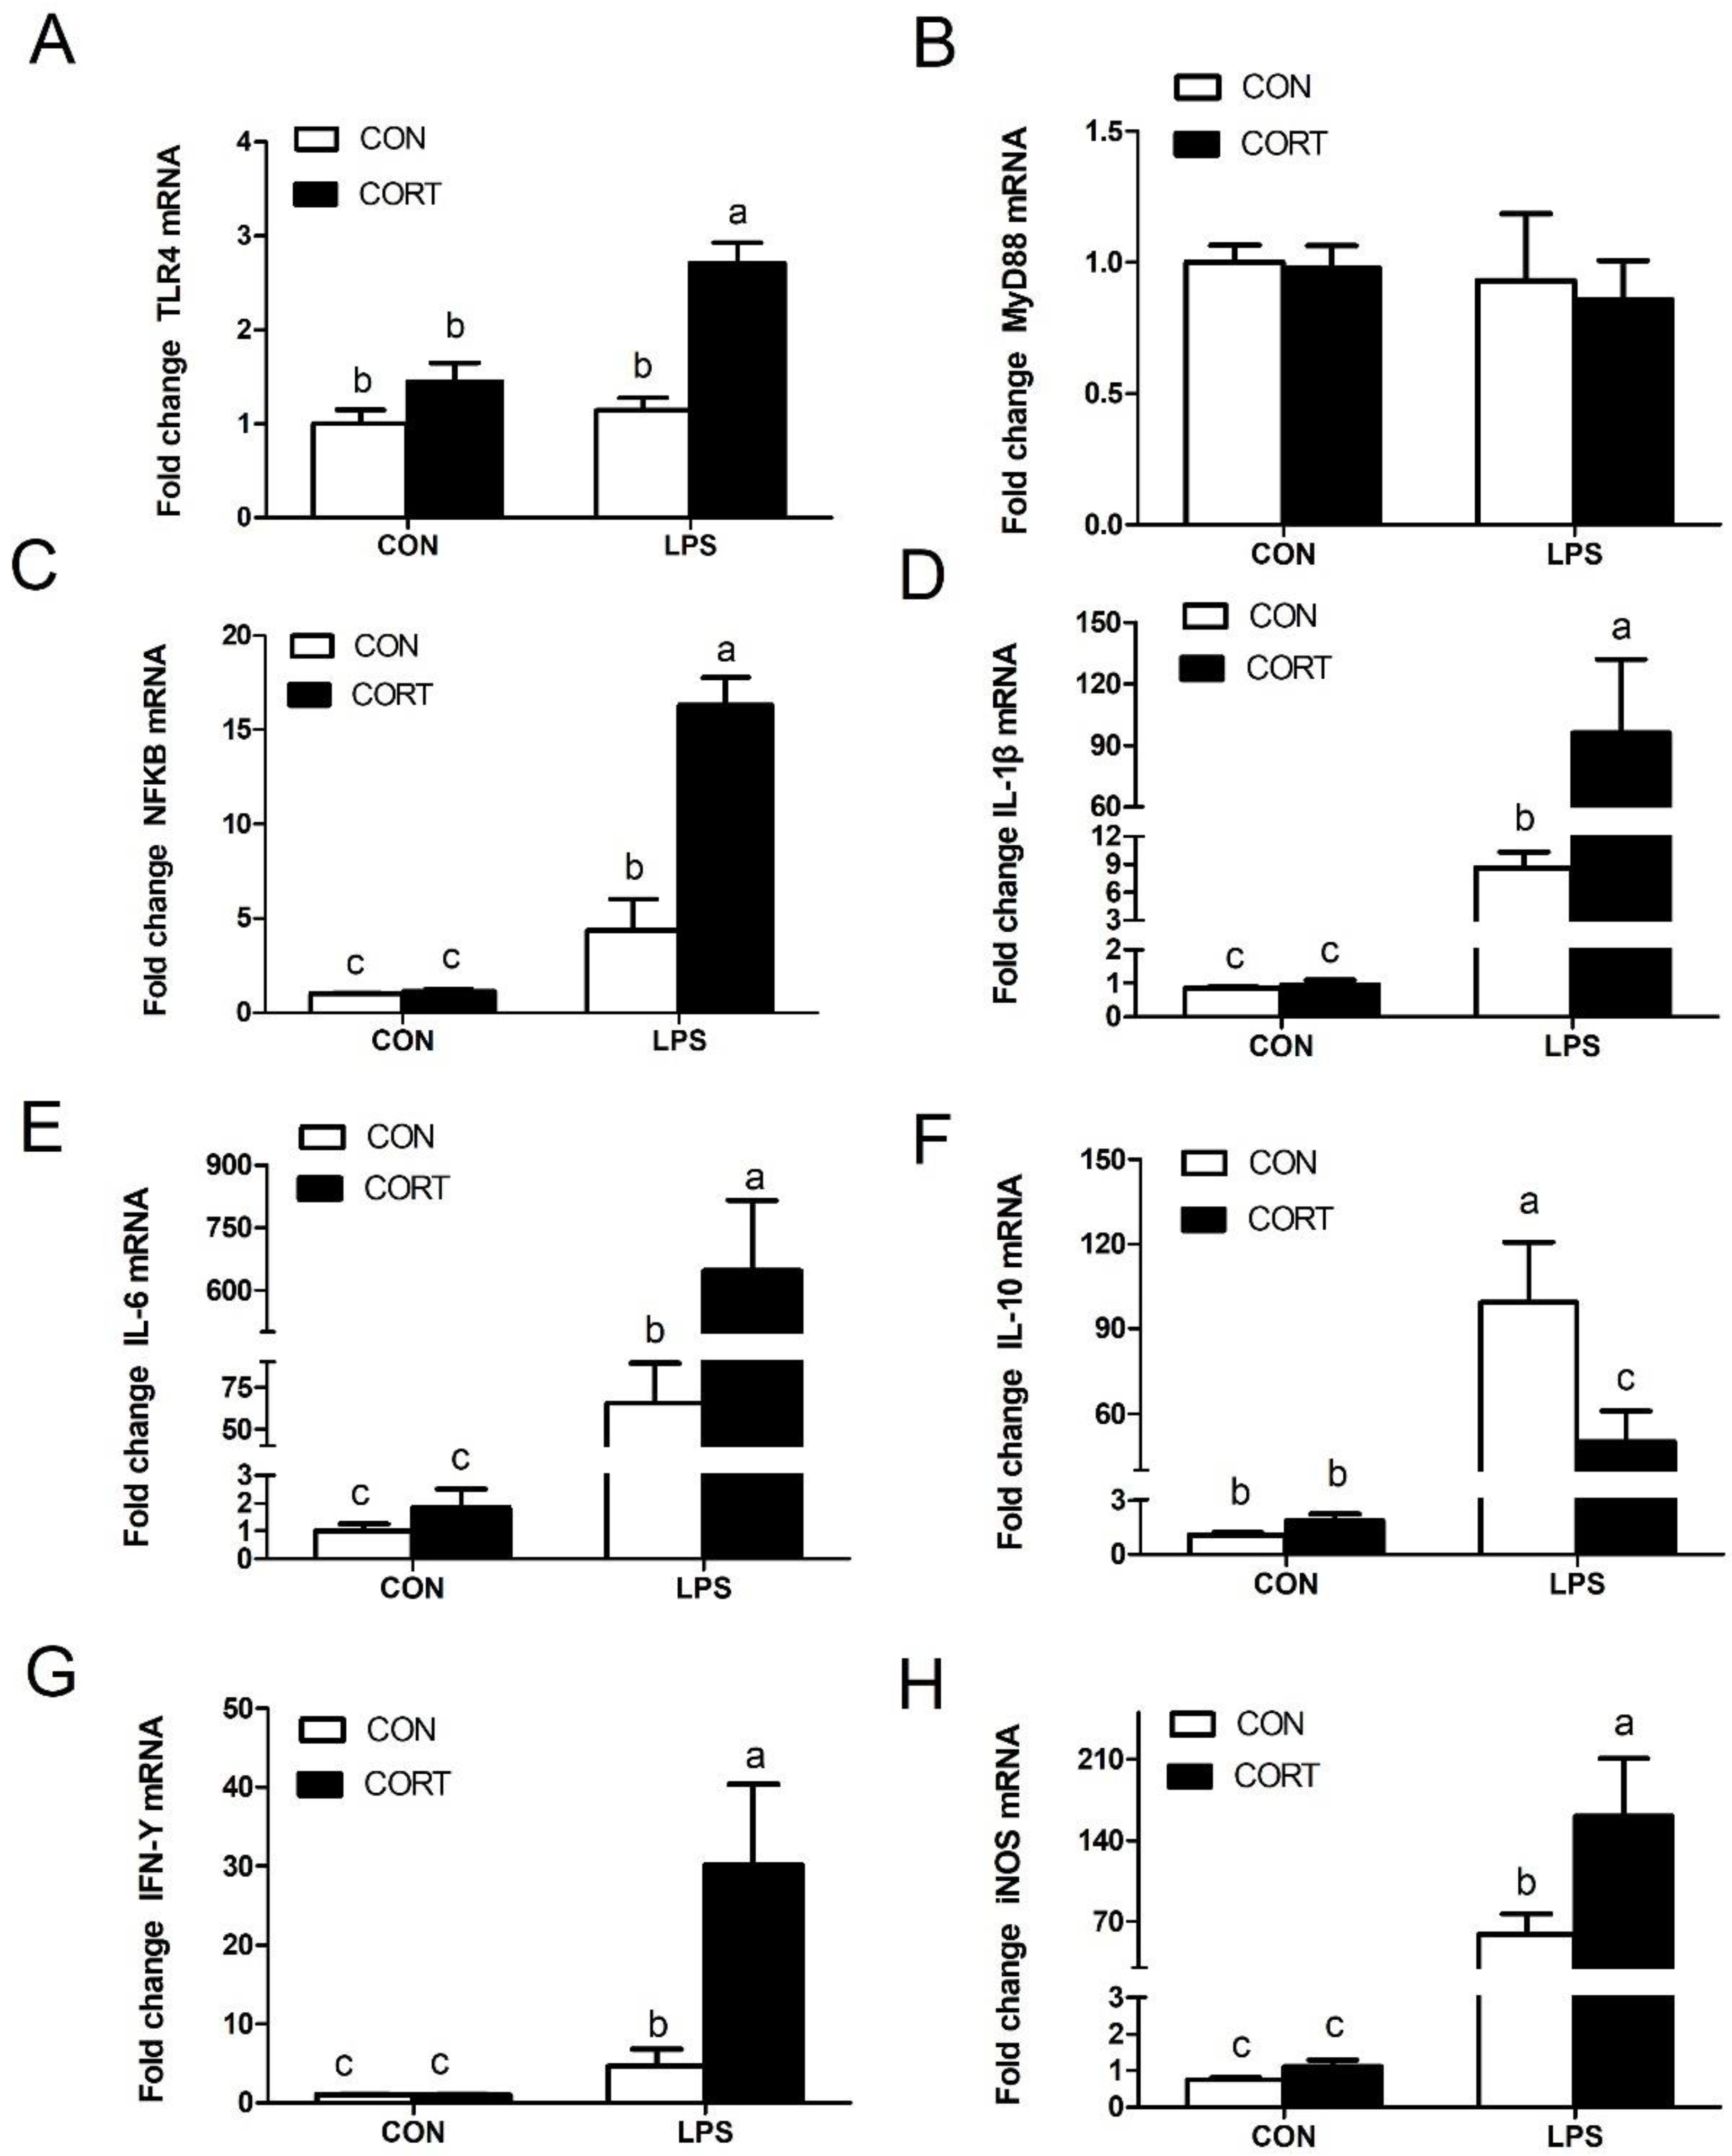
3.6. Liver Expression of Genes Related to Inflammation

Compared to the CON group, the CORT challenge was not able to induce an inflammatory response. However, LPS treatment greatly upregulated liver expression of downstream genes to the LPS-TLR4-NF-κB pathway. It also activated gene expression of hepatic iNOS, IFN-γ, IL-1β, and IL-6 (p < 0.05; Figure 5). In particular, LPS injection exacerbated the expression of NF-κB, IL-1β, IL-6, IFN-γ, and iNOS in the liver when combined with CORT injections (p < 0.05). With respect to the anti-inflammatory cytokine, IL-10, expression of its mRNA was significantly upregulated by CORT or LPS injection, but was significantly downregulated by co-administration of CORT and LPS (p < 0.05).

4. Discussion

Fatty liver disease not only poses a considerable threat to human health, but also increases the risk of infection in the poultry industry. Broadly similar findings were observed in broilers following chronic CORT treatment, showing reduced protein synthesis and promoted protein degradation. Together, these cause loss of body weight [8,24]. In this study, body weight of CORT-treated broilers was lower than in the control under the same dietary formulations (Figure 1), in line with previous studies. Hepatocellular steatosis is a characteristic of NAFLD. More than 5% of hepatocyte steatosis is necessary for the diagnosis of NAFLD [25,26]. In addition, it has been reported that exacerbations of steatosis are positively correlated with lobular inflammation, zone-3 fibrosis, and definite steatohepatitis [25]. The gross appearance of the liver and HE staining of liver sections in broilers with CORT injection-induced fatty liver disease in our results support these findings (Figure 2). In rats, chronic treatment with dexamethasone (DEX), a synthetic GC, led to an increase in TG levels both in the blood and in the liver [27]. Similarly, in chickens, CORT induced a significant increase in plasma and hepatic TG content [8,28]. Our results were consistent with these studies, showing that CORT treatment significantly increased plasma levels of TG, CHOL, HDLC, and LDLC. These results also confirmed that the fatty liver model was successfully induced in the broilers, as in previous reports [8,10].
Many studies have shown that LPS can induce an inflammatory response in broilers [29]. The activities of AST and ALT in the plasma are usually used clinically as specific indicators of liver injury [30]. Our results are consistent with those of Chen et al. [31], who reported that LPS caused significant increases in levels of AST and ALT, as well as in hepatocyte necrosis and the accompanying inflammatory cell infiltration. Our results indicate that broilers treated with combined LPS and CORT showed higher plasma levels of AST and the AST/ALT ratio than following LPS or CORT treatment alone (Figure 3). In addition, histological analysis confirmed hepatic pathological changes. These results indicate that the inflammatory response could be exacerbated in broilers with fatty liver disease.
Two short acute-phase proteins of CRP and SAA expressed by hepatocyte act as a systemic response to local inflammation [32]. Our results show that LPS treatment significantly upregulated liver gene expression of SAA but not of CRP (Figure 4). This indicates that SAA was a sensitive indicator of gram-negative bacterial infection in this study.
As an important immune organ, the liver is a target for LPS, and is primarily affected by bacterial LPS [33,34]. In this study, results show that liver gene expression of proinflammatory cytokines was enhanced by LPS administration. Consistent with these results, Yang et al. [33] found that liver gene expression of IL-6, TNF α, and iNOS was considerably higher in the LPS-treated group than in the unchallenged broilers. Notably, although CORT treatment alone did not induce inflammatory gene expression, it could exacerbate LPS-induced mRNA expression of NF-κB and its downstream proinflammatory cytokines, such as TNF-α and iNOS, in broilers. A crosstalk occurs between steatosis and inflammation, influencing the hepatic immune system and the progression of NFALD [35]. Bertola et al. [36] found that livers of obese patients showed slight inflammation and were more sensitive to activators of the TLR pathway, even when histological abnormalities were absent. The outcome was the development of liver disease. However, the change in inflammatory gene expression was not consistent with the findings of Forn-Cuni and coworkers [37], who reported no significant change in inflammatory gene expression, when compared to the expression of LPS-stimulated and non-stimulated livers in obese zebrafish. These findings indicate that a fatty liver enhances the response to acute inflammatory stimuli and is dependent on health status of the animals, dose of the LPS injection, and the animal species.

5. Conclusions

Broilers with fatty livers are more susceptible to LPS stimulation, showing activation of the inflammatory response and more severe damage to the liver. LPS stimulation in broilers with fatty livers represent a second assault on the already damaged liver. Our findings extend the knowledge on the potential threat of pathogenic infections in the presence of fatty liver disease in poultry.

Author Contributions

Formal analysis, W.M., Y.H., and H.X.; Supervision, Y.N.; Writing—original draft, W.M.; Writing—review & editing, Y.N. and R.Z. All authors have read and agreed to the published version of the manuscript.

Funding

This work was funded by the National Key R&D Program of China (2017YFE0114400) and Priority Academic Program Development of Jiangsu Higher Education Institutions

Acknowledgments

The author wish to thank Yun Hu and Qu Chen for their assistance with this study.

Conflicts of Interest

The authors declare no conflict of interest in the present work.

References

  1. Cohen, J.C.; Horton, J.D.; Hobbs, H.H. Human fatty liver disease: Old questions and new insights. Science 2011, 332, 1519–1523. [Google Scholar] [CrossRef] [PubMed] [Green Version]
  2. Boursier, J.; Mueller, O.; Barret, M.; Machado, M.; Fizanne, L.; Araujo-Perez, F.; Guy, C.D.; Seed, P.C.; Rawls, J.F.; David, L.A. The severity of nonalcoholic fatty liver disease is associated with gut dysbiosis and shift in the metabolic function of the gut microbiota. Hepatology 2016, 63, 764–775. [Google Scholar] [CrossRef] [PubMed] [Green Version]
  3. Zhou, Y.; Ding, Y.-L.; Zhang, J.-L.; Zhang, P.; Wang, J.-Q.; Li, Z.-H. Alpinetin improved high fat diet-induced non-alcoholic fatty liver disease (NAFLD) through improving oxidative stress, inflammatory response and lipid metabolism. Biomed. Pharmacother. 2018, 97, 1397–1408. [Google Scholar] [CrossRef] [PubMed]
  4. Cherian, G.; Holsonbake, T.B.; Goeger, M.P.; Bildfell, R. Dietary CLA alters yolk and tissue FA composition and hepatic histopathology of laying hens. Lipids 2002, 37, 751–757. [Google Scholar] [CrossRef]
  5. Paglialunga, S.; Dehn, C.A. Clinical assessment of hepatic de novo lipogenesis in non-alcoholic fatty liver disease. Lipids Health Dis. 2016, 15, 159. [Google Scholar] [CrossRef] [Green Version]
  6. Davis, J.; Cain, J.; Small, C.; Hales, D. Therapeutic effect of flax-based diets on fatty liver in aged laying hens. Poult. Sci. 2016, 95, 2624–2632. [Google Scholar] [CrossRef] [PubMed]
  7. Woods, C.P.; Hazlehurst, J.M.; Tomlinson, J.W. Glucocorticoids and non-alcoholic fatty liver disease. J. Steroid Biochem. Mol. Biol. 2015, 154, 94–103. [Google Scholar] [CrossRef]
  8. Hu, Y.; Sun, Q.; Hu, Y.; Hou, Z.; Zong, Y.; Omer, N.A.; Abobaker, H.; Zhao, R. Corticosterone-induced Lipogenesis activation and Lipophagy inhibition in chicken liver are alleviated by maternal Betaine supplementation. J. Nutr. 2018, 148, 316–325. [Google Scholar] [CrossRef] [Green Version]
  9. Jiang, K.; Jiao, H.; Song, Z.; Yuan, L.; Zhao, J.; Lin, H. Corticosterone administration and dietary glucose supplementation enhance fat accumulation in broiler chickens. Br. Poult. Sci. 2008, 49, 625–631. [Google Scholar] [CrossRef]
  10. Hu, Y.; Sun, Q.; Liu, J.; Jia, Y.; Cai, D.; Idriss, A.A.; Omer, N.A.; Zhao, R. In ovo injection of betaine alleviates corticosterone-induced fatty liver in chickens through epigenetic modifications. Sci. Rep. 2017, 7, 40251. [Google Scholar] [CrossRef]
  11. Chanie, M.; Negash, T.; Tilahun, S.B. Occurrence of concurrent infectious diseases in broiler chickens is a threat to commercial poultry farms in Central Ethiopia. Trop. Anim. Health Prod. 2009, 41, 1309. [Google Scholar] [CrossRef] [PubMed]
  12. Compare, D.; Coccoli, P.; Rocco, A.; Nardone, O.; De Maria, S.; Cartenì, M.; Nardone, G. Gut–liver axis: The impact of gut microbiota on non alcoholic fatty liver disease. Nutr. Metab. Cardiovas 2012, 22, 471–476. [Google Scholar] [CrossRef] [PubMed]
  13. Yang, J.; Liu, L.; Sheikhahmadi, A.; Wang, Y.; Li, C.; Jiao, H.; Lin, H.; Song, Z. Effects of corticosterone and dietary energy on immune function of broiler chickens. PLoS ONE 2015, 10, e0119750. [Google Scholar] [CrossRef] [PubMed]
  14. Jirillo, E.; Caccavo, D.; Magrone, T.; Piccigallo, E.; Amati, L.; Lembo, A.; Kalis, C.; Gumenscheimer, M. The role of the liver in the response to LPS: Experimental and clinical findings. J. Endotoxin Res. 2002, 8, 319–327. [Google Scholar] [CrossRef]
  15. Triantafilou, M.; Triantafilou, K. Lipopolysaccharide recognition: CD14, TLRs and the LPS-activation cluster. Trends Immunol. 2002, 23, 301–304. [Google Scholar] [CrossRef]
  16. Jerala, R. Structural biology of the LPS recognition. Int. J. Med. Microbiol. 2007, 297, 353–363. [Google Scholar] [CrossRef]
  17. Verstrepen, L.; Bekaert, T.; Chau, T.-L.; Tavernier, J.; Chariot, A.; Beyaert, R. TLR-4, IL-1R and TNF-R signaling to NF-κB: Variations on a common theme. Cell. Mol. Life Sci. 2008, 65, 2964–2978. [Google Scholar] [CrossRef]
  18. Henao-Mejia, J.; Elinav, E.; Jin, C.; Hao, L.; Mehal, W.Z.; Strowig, T.; Thaiss, C.A.; Kau, A.L.; Eisenbarth, S.C.; Jurczak, M.J. Inflammasome-mediated dysbiosis regulates progression of NAFLD and obesity. Nature 2012, 482, 179–185. [Google Scholar] [CrossRef] [Green Version]
  19. Guo, J.; Han, D.; Li, X.; Zhang, Y.; Zhao, Y. The impact of small doses of LPS on NASH in high sucrose and high fat diet induced rats. Eur. Rev. Med. Pharmacol. Sci. 2014, 18, 2742–2747. [Google Scholar]
  20. Sharifnia, T.; Antoun, J.; Verriere, T.G.; Suarez, G.; Wattacheril, J.; Wilson, K.T.; Peek, R.M., Jr.; Abumrad, N.N.; Flynn, C.R. Hepatic TLR4 signaling in obese NAFLD. Am. J. Physiol. Gastrointest. Liver Physiol. 2015, 309, G270–G278. [Google Scholar] [CrossRef] [Green Version]
  21. Chen, L.; Ren, F.; Zhang, H.; Wen, T.; Piao, Z.; Zhou, L.; Zheng, S.; Zhang, J.; Chen, Y.; Han, Y. Inhibition of glycogen synthase kinase 3β ameliorates D-GalN/LPS-induced liver injury by reducing endoplasmic reticulum stress-triggered apoptosis. PLoS ONE 2012, 7, e45202. [Google Scholar] [CrossRef] [PubMed] [Green Version]
  22. Sun, L.; Dong, H.; Zhang, Z.; Liu, J.; Hu, Y.; Ni, Y.; Grossmann, R.; Zhao, R. Activation of epithelial proliferation induced by Eimeria acervulina infection in the duodenum may be associated with cholesterol metabolism. Oncotarget 2016, 7, 27627–27640. [Google Scholar] [CrossRef] [PubMed] [Green Version]
  23. Livak, K.J.; Schmittgen, T.D. Analysis of relative gene expression data using real-time quantitative PCR and the 2−ΔΔCT method. Methods 2001, 25, 402–408. [Google Scholar] [CrossRef] [PubMed]
  24. Takahashi, Y.; Fukusato, T. Histopathology of nonalcoholic fatty liver disease/nonalcoholic steatohepatitis. World J. Gastroenterol. 2014, 20, 15539–15548. [Google Scholar] [CrossRef]
  25. Chalasani, N.; Wilson, L.; Kleiner, D.E.; Cummings, O.W.; Brunt, E.M.; Ünalp, A.; Network, N.C.R. Relationship of steatosis grade and zonal location to histological features of steatohepatitis in adult patients with non-alcoholic fatty liver disease. J. Hepatol. 2008, 48, 829–834. [Google Scholar] [CrossRef] [Green Version]
  26. Xu, X.; Chen, X.; Huang, Z.; Chen, D.; He, J.; Zheng, P.; Chen, H.; Luo, J.; Luo, Y.; Yu, B. Effects of dietary apple polyphenols supplementation on hepatic fat deposition and antioxidant capacity in finishing pigs. Animals 2019, 9, 937. [Google Scholar] [CrossRef] [Green Version]
  27. Wu, T.; Yang, L.; Jiang, J.; Ni, Y.; Zhu, J.; Zheng, X.; Wang, Q.; Lu, X.; Fu, Z. Chronic glucocorticoid treatment induced circadian clock disorder leads to lipid metabolism and gut microbiota alterations in rats. Life Sci. 2018, 192, 173–182. [Google Scholar] [CrossRef]
  28. Lin, H.; Sui, S.; Jiao, H.; Buyse, J.; Decuypere, E. Impaired development of broiler chickens by stress mimicked by corticosterone exposure. Comp. Biochem. Phys. A 2006, 143, 400–405. [Google Scholar] [CrossRef]
  29. Zhang, H.; Chen, Y.; Chen, Y.; Li, Y.; Jia, P.; Ji, S.; Zhou, Y.; Wang, T. Dietary pterostilbene supplementation attenuates intestinal damage and immunological stress of broiler chickens challenged with lipopolysaccharide. J. Anim. Sci. 2019, 98. [Google Scholar] [CrossRef]
  30. Senior, J. Alanine aminotransferase: A clinical and regulatory tool for detecting liver injury—Past, present, and future. Clin. Pharmacol. Ther. 2012, 92, 332–339. [Google Scholar] [CrossRef]
  31. Chen, Z.; Yang, Y.; Mi, S.; Fan, Q.; Sun, X.; Deng, B.; Wu, G.; Li, Y.; Zhou, Q.; Ruan, Z. Hepatoprotective effect of chlorogenic acid against chronic liver injury in inflammatory rats. J. Funct. Foods 2019, 62, 103540. [Google Scholar] [CrossRef]
  32. Lim, J.W.; Dillon, J.; Miller, M. Proteomic and genomic studies of non-alcoholic fatty liver disease-clues in the pathogenesis. World J. Gastroenterol. 2014, 20, 8325–8340. [Google Scholar] [CrossRef] [PubMed]
  33. Yang, L.; Liu, G.; Liang, X.; Wang, M.; Zhu, X.; Luo, Y.; Shang, Y.; Yang, J.; Zhou, P.; Gu, X.L. Effects of berberine on the growth performance, antioxidative capacity and immune response to lipopolysaccharide challenge in broilers. Anim. Sci. J. 2019, 90, 1229–1238. [Google Scholar] [CrossRef] [PubMed]
  34. Liu, Y.; Wan, D.; Zhou, X.; Ruan, Z.; Zhang, T.; Wu, X.; Yin, Y. Effects of dynamic feeding low-and high-methionine diets on the variation of glucose and lipid metabolism-related genes in the liver of laying hens. Poult. Sci. 2019, 98, 2231–2240. [Google Scholar] [CrossRef] [PubMed]
  35. Valenti, L.; Fracanzani, A.L.; Fargion, S. The immunopathogenesis of alcoholic and nonalcoholic steatohepatitis: Two triggers for one disease? Semin. Immunopathol. 2009, 31, 359. [Google Scholar] [CrossRef]
  36. Bertola, A.; Bonnafous, S.; Anty, R.; Patouraux, S.; Saint-Paul, M.-C.; Iannelli, A.; Gugenheim, J.; Barr, J.; Mato, J.M.; Le Marchand-Brustel, Y. Hepatic expression patterns of inflammatory and immune response genes associated with obesity and NASH in morbidly obese patients. PLoS ONE 2010, 5, e13577. [Google Scholar] [CrossRef] [Green Version]
  37. Forn-Cuni, G.; Varela, M.; Fernandez-Rodriguez, C.M.; Figueras, A.; Novoa, B. Liver immune responses to inflammatory stimuli in a diet-induced obesity model of zebrafish. J. Endocrinol. 2015, 224, 159–170. [Google Scholar] [CrossRef]
Figure 1. Changes in body weight. Data are presented as means ± SEM (n = 16); ** p < 0.01. CON, control group; CORT, corticosterone-treated group.
Animals 10 00514 g001
Figure 2. Phenotypic characterization of liver damages. (A) Phenotypic presentation of the liver. (B) Hepatic histological sections stained with hematoxylin and eosin (HE). (C) Total damage score of hepatic histological sections. Representative histological sections of the liver were observed with x40 magnification. Black, red, and green arrows indicate vacuolar degeneration, hepatocytes necrosis, and interstitial substance proliferation, respectively. CON, control group; CORT, corticosterone-treated group; LPS, lipopolysaccharide -treated group; CORT&LPS, corticosterone- and LPS-treated group. a–c Means with different small letter superscripts are significantly different (p < 0.05).
Animals 10 00514 g002
Figure 3. Level of liver index and biochemical parameters. (A) Liver index; (B) Hepatic TG content; (C) plasma alanine aminotransferase (ALT) activity; (D) plasma aspartate aminotransferase (AST) activity; (E) AST/ALT ratio. C-CON, control group; C-CORT, corticosterone-treated group; L-CON, LPS-treated group; L-CORT, LPS- and corticosterone-treated group. Data are presented as means ± SEM (n = 8). a–c Means with different small letter superscripts are significantly different (p < 0.05).
Animals 10 00514 g003
Figure 4. Expression of hepatic genes related to acute-phase proteins. (A) Hepatic expression of CRP mRNA. (B) Hepatic expression of SAA mRNA; C-CON, control group; C-CORT, corticosterone-treated group; L-CON, LPS-treated group; L-CORT, LPS- and corticosterone-treated group. Data were normalized to the expression of the 18S rRNA gene and are presented as means ± SEM (n = 8). a–c Means with different small letter superscripts are significantly different (p < 0.05).
Animals 10 00514 g004
Figure 5. Expression of hepatic genes related to inflammation. (A) Hepatic TLR4 mRNA expression. (B) Hepatic MyD88 mRNA expression. (C) Hepatic NFκB mRNA expression. (D) Hepatic IL-1β mRNA expression. (E) Hepatic IL-6 mRNA expression. (F) Hepatic IL-10 mRNA expression. (G) Hepatic IFN-γ mRNA expression; (H) Hepatic iNOS mRNA expression. C-CON, control group; C-CORT, corticosterone-treated group; L-CON, LPS-treated group; L-CORT, LPS- and corticosterone-treated group; Data were normalized to the expression of the 18S rRNA gene and are presented as means ± SEM (n = 8). a–c Means with different small letter superscripts are significantly different (p < 0.05).
Animals 10 00514 g005
Table 1. The composition of a chicken’s diet.
Ingredient %Content
Corn58.80
Soybean meal30.50
Corn gluten meal5.00
soybean oil1.42
Calcium carbonate powder1.34
Calcium hydrogen phosphate1.33
Methionine0.18
65% Lysine0.45
93% Threonine0.05
Sodium chloride0.30
50% Choline chloride0.30
Chlortetracycline0.10
Trace elements0.20
Vitamins0.03
Calculated Chemical Composition
Metabolizable energy (MJ/kg)12.34
Crude protein (g/kg)221.53
Crude fat (g/kg)43.58
Crude fiber (g/kg)27.90
Calcium (g/kg)8.90
Available P (g/kg)3.50
Lysine (g/kg)12.91
Methionine (g/kg)5.50
Methionine + Cysteine (g/kg)9.17
Table 2. Nucleotide sequences of specific primers.
Target GenesGenbank AccessionPrimer Sequences (5′-3′)PCR Products (bp)
TLR4NM_001030693F: AAACACCACCCTGGACTTGGAC188
R: GTGCTGGAGTGAATTGGCAGTTA
MyD88NM_001030962F: CCTGGAAAGTGATGAATGTGA165
R: TTGGTGCAAGGATTGGTGTA
NF-κBNM_205134.1F: TCAACGCAGGACCTAAAGACAT162
R: GCAGATAGCCAAGTTCAGGATG
INF-γX99774.1F: ACACTGACAAGTCAAAGCCGCACA129
R: AGTCGTTCATCGGGAGCTTGGC
iNOSD85422F: CCTGGAGGTCCTGGAAGAGT185
R: CCTGGGTTTCAGAAGTGGC
IL-6AJ309541.1F: CGTGTGCGAGAACAGCATGGAGA130
R: TCAGGCATTTCTCCTCGTCGAAGC
IL-1βY15006F: CATTCAGCGTCCAGGTA91
R: TCTCGGCAGTTTCTTTT
IL-10NM_001004414.2F: AGCAGATCAAGGAGACGTTC103
R: ATCAGCAGGTACTCCTCGAT
CRPDQ374639.1F: TGTCACGGCCCAGGAAGA175
R: TTTGGTGGCGTAGGAGAAGA
SAAGU929209.1F: AGCGGTATCAAGTTTGTCAGG129
R: TCCGAGCATCGTAATT
18S>AF173612.1F: GAAACGGCTACCACATCC168
R: CACCAGACTTGCCCTCCA
TLR4, toll-like receptor4; MyD88, myeloid differentiation factor88; NFκB, nuclear factor kappa-light-chain-enhancer of activated B cells; IFN-γ, interferon γ; iNOS, inducible nitric oxide synthase; IL-6, IL-1β, and IL-10, interleukin 6, 1β, and 10, respectively; CRP, C-reactive protein; SAA, serum amyloid A.
Table 3. Effect of CORT and LPS on plasma biochemical parameters.
ParametersCONCORTLPSLPS&CORT
TG (mmol/l)0.40 ± 0.03 b0.70 ± 0.10 a0.27 ± 0.02 c0.64 ± 0.14 a,b
TCHOL (mmol/l)2.67 ± 0.22 c5.66 ± 0.53 a2.24 ± 0.18 c4.23 ± 0.32 b
HDL (mmol/l)1.48 ± 0.12 c3.25 ± 0.27 a1.14 ± 0.12 c2.22 ± 0.17 b
LDL (mmol/l)0.28 ± 0.02 b0.53 ± 0.08 a0.39 ± 0.03 a,b0.44 ± 0.06 a
GLU (mmol/L)14.80 ± 0.3114.80 ± 0.4814.40 ± 0.6415.81 ± 0.67
CON, control group; CORT, corticosterone-treated group; LPS, LPS-treated group; LPS&CORT, LPS- and corticosterone-treated group. TG, triglycerides; TCHOL, total cholesterol; HDL, high density lipoprotein cholesterol; LDL, low density lipoprotein cholesterol; GLU, glucose. Data are presented as means ± SEM (n = 8). a–c Means with different small letter superscripts within a row are significantly different (p < 0.05).

