Modelling Methionine Requirements of Fast- and Slow-Growing Chinese Yellow-Feathered Chickens during the Starter Phase

 , and
, and 
Abstract
:Simple Summary
Abstract
1. Introduction
2. Materials and Methods
2.1. Birds, Diet and Management
2.2. Growth Performance
2.3. Statistical Analysis
3. Results
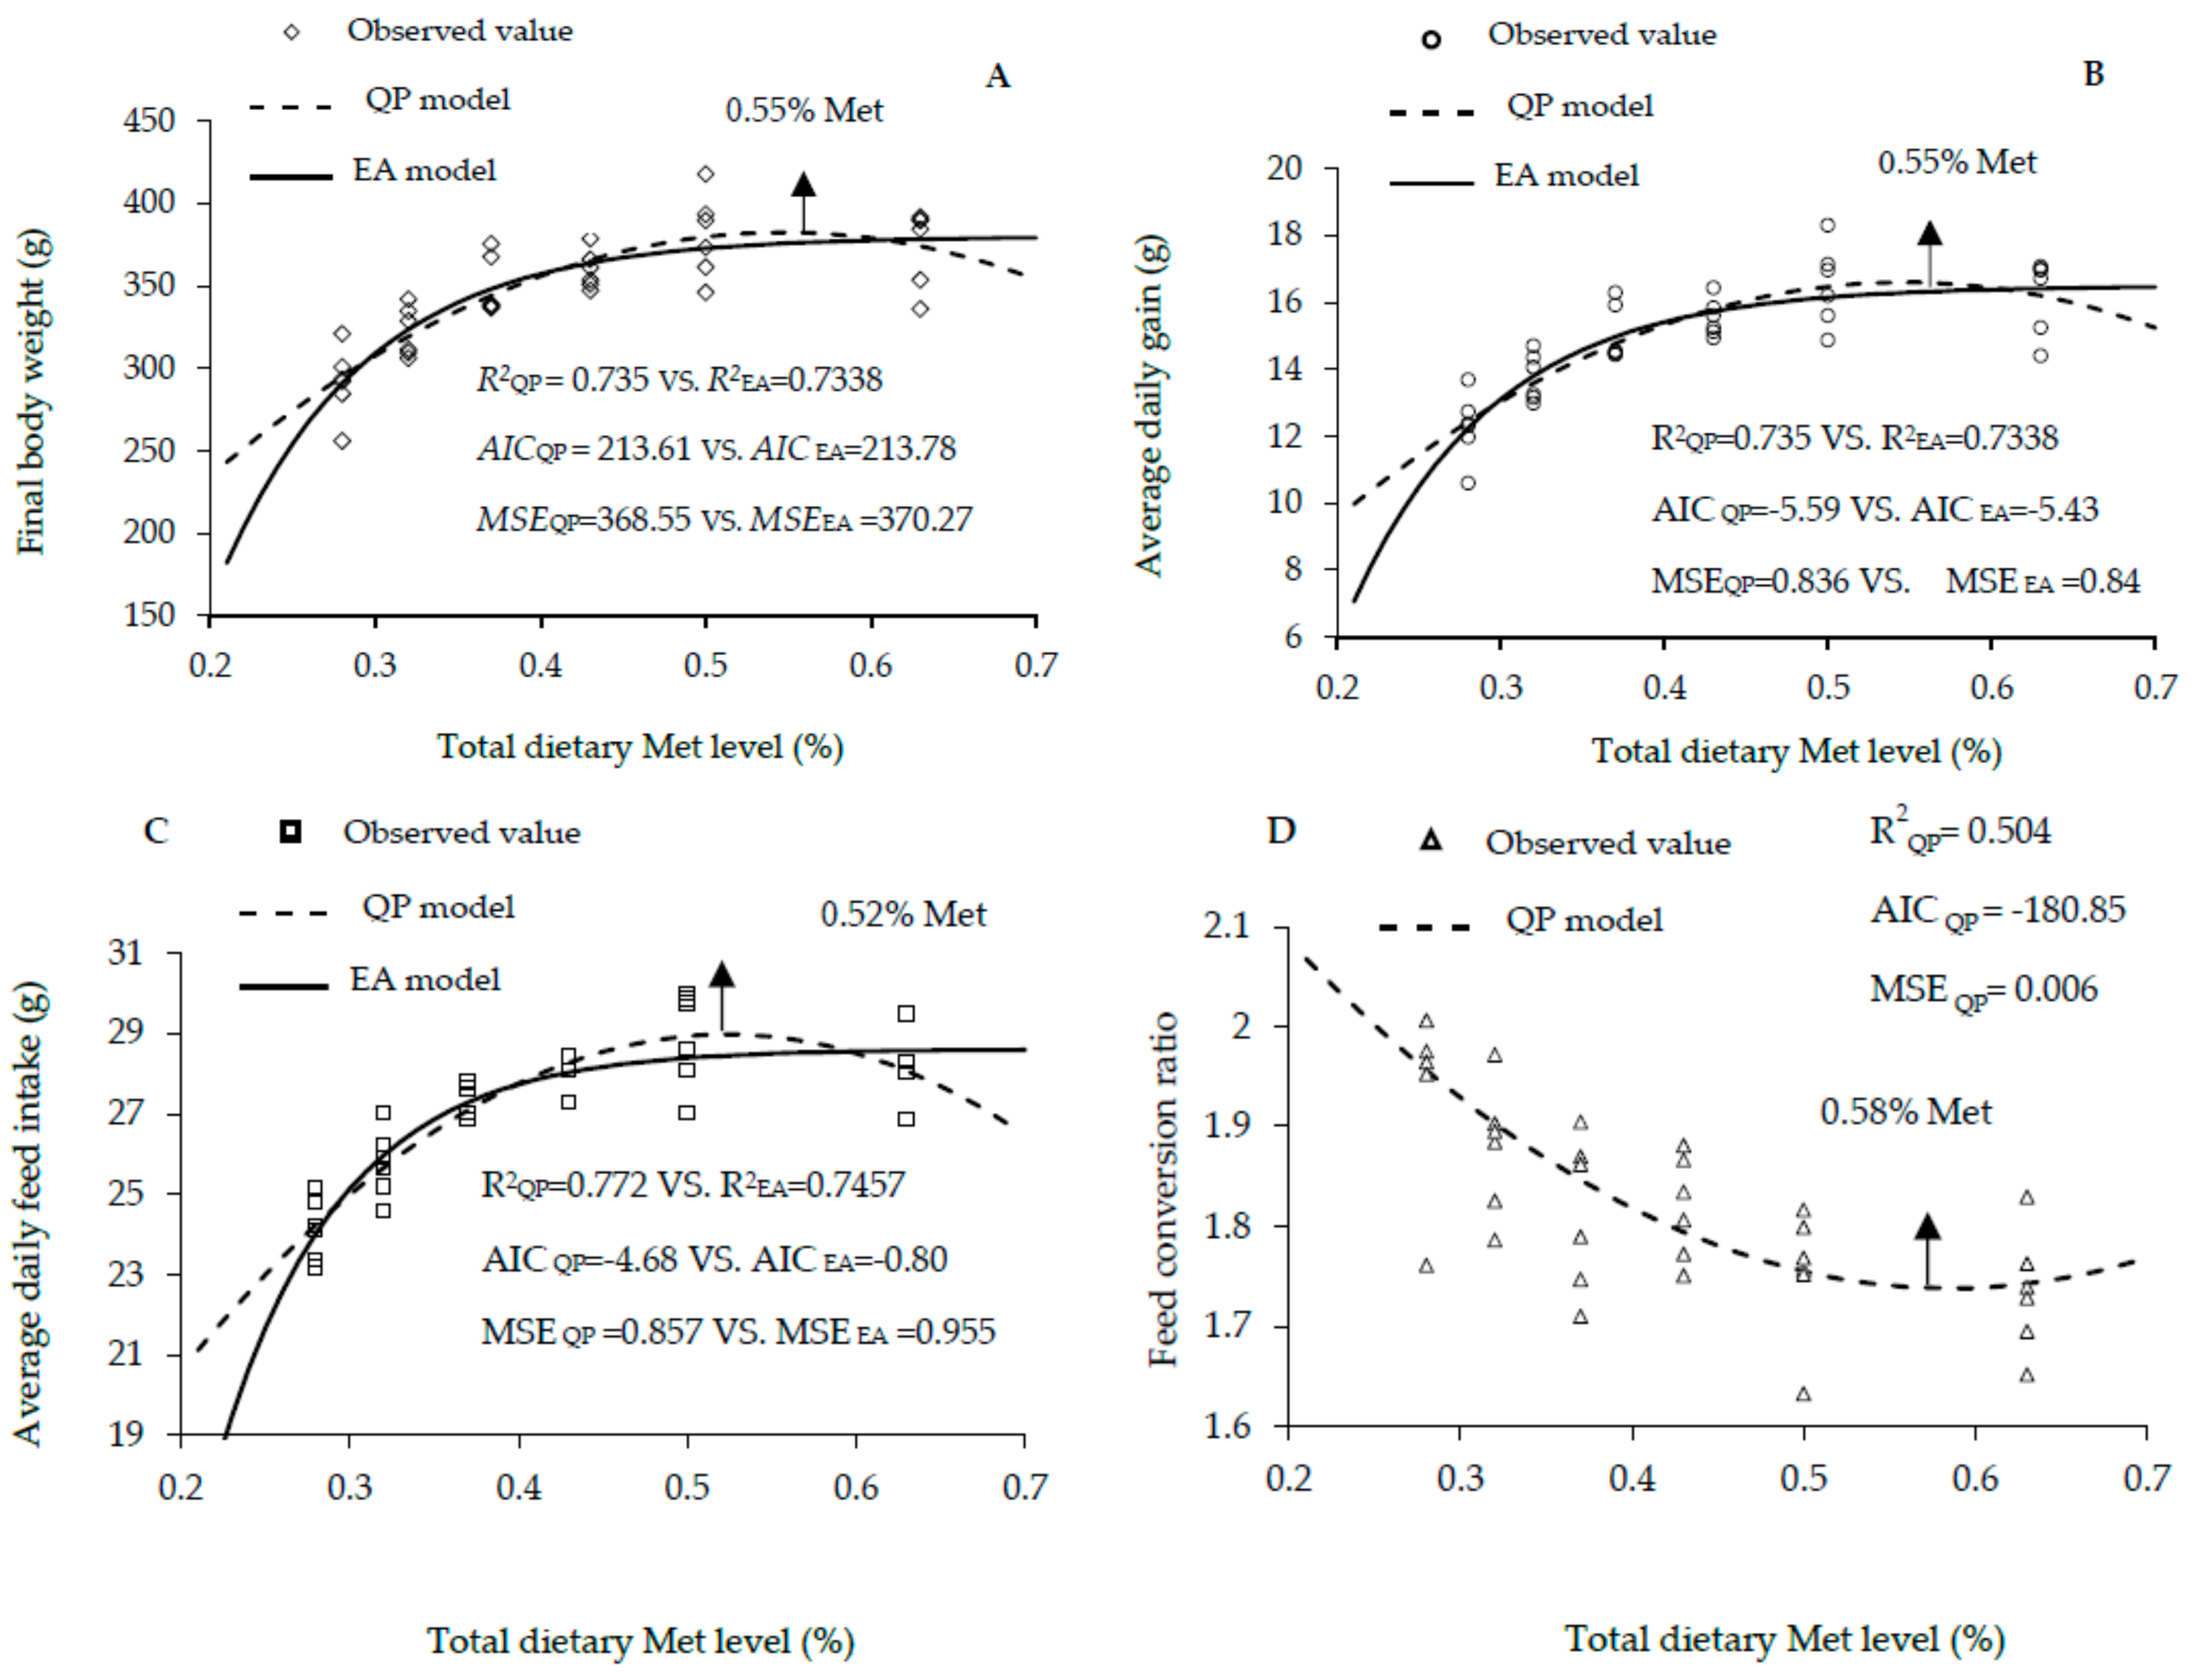
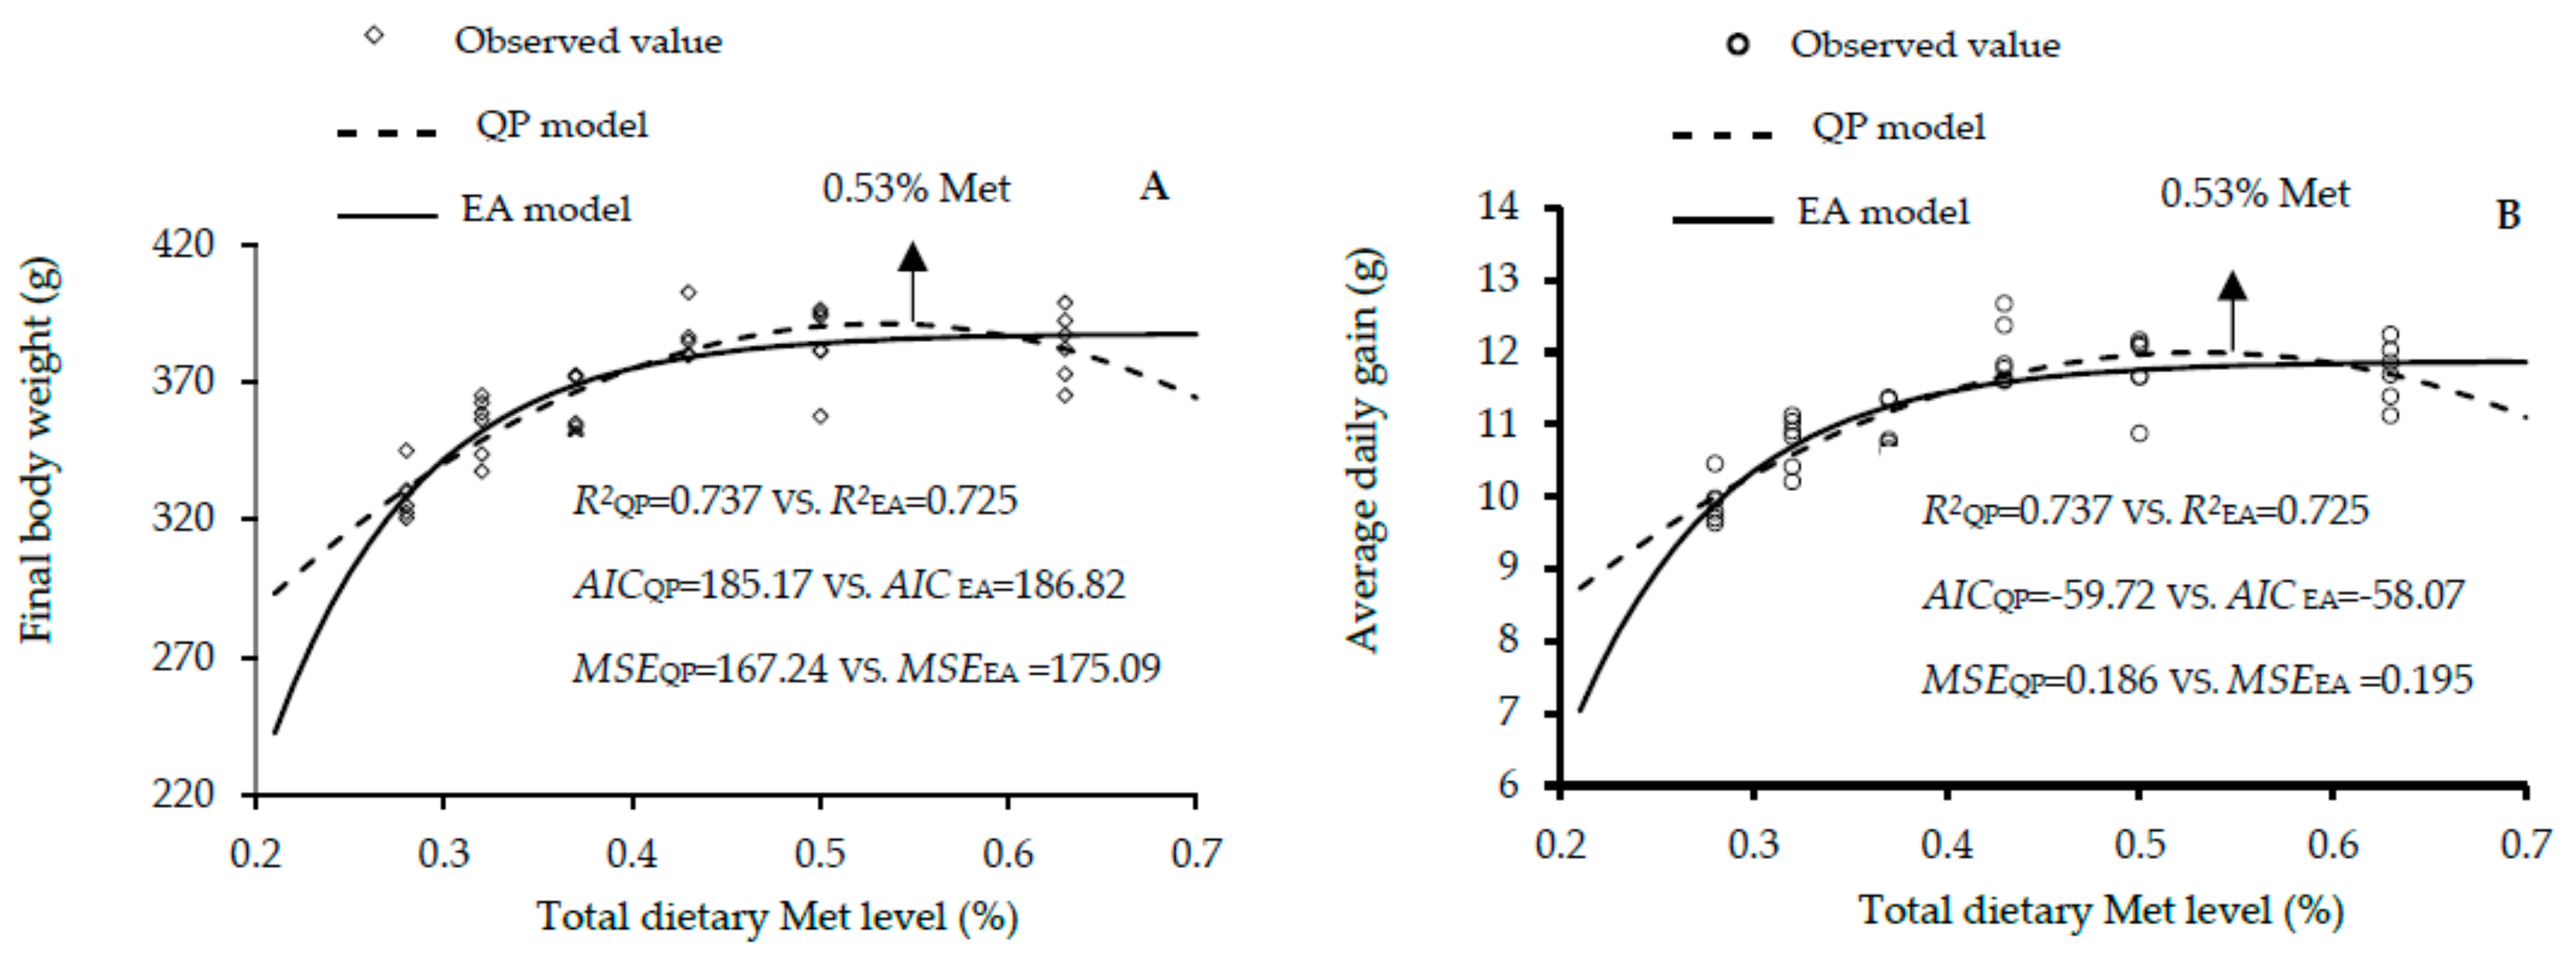
3.1. Growth Performance of Lingnan Broilers Aged 1 to 21 Days (Exp 1)
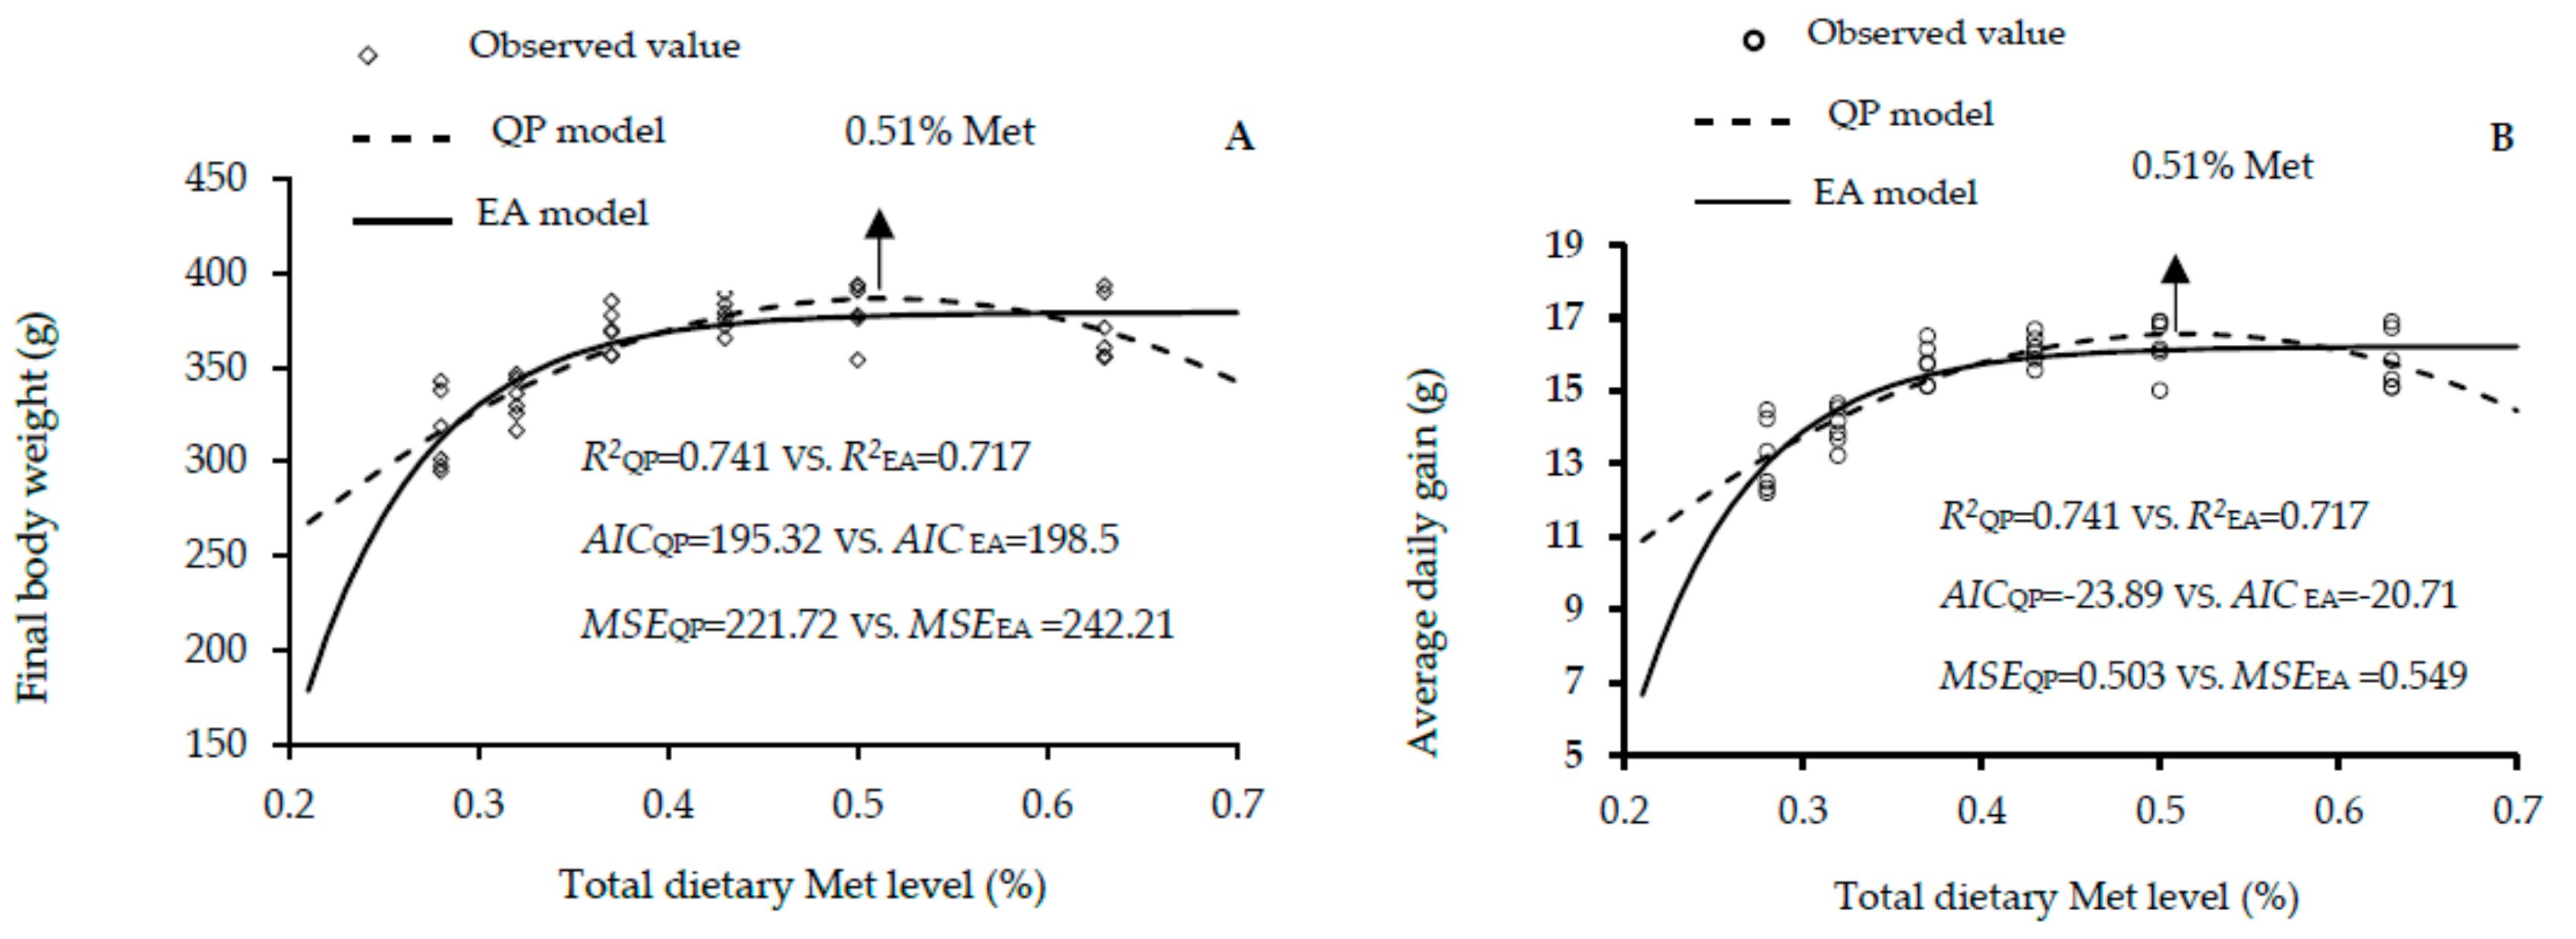
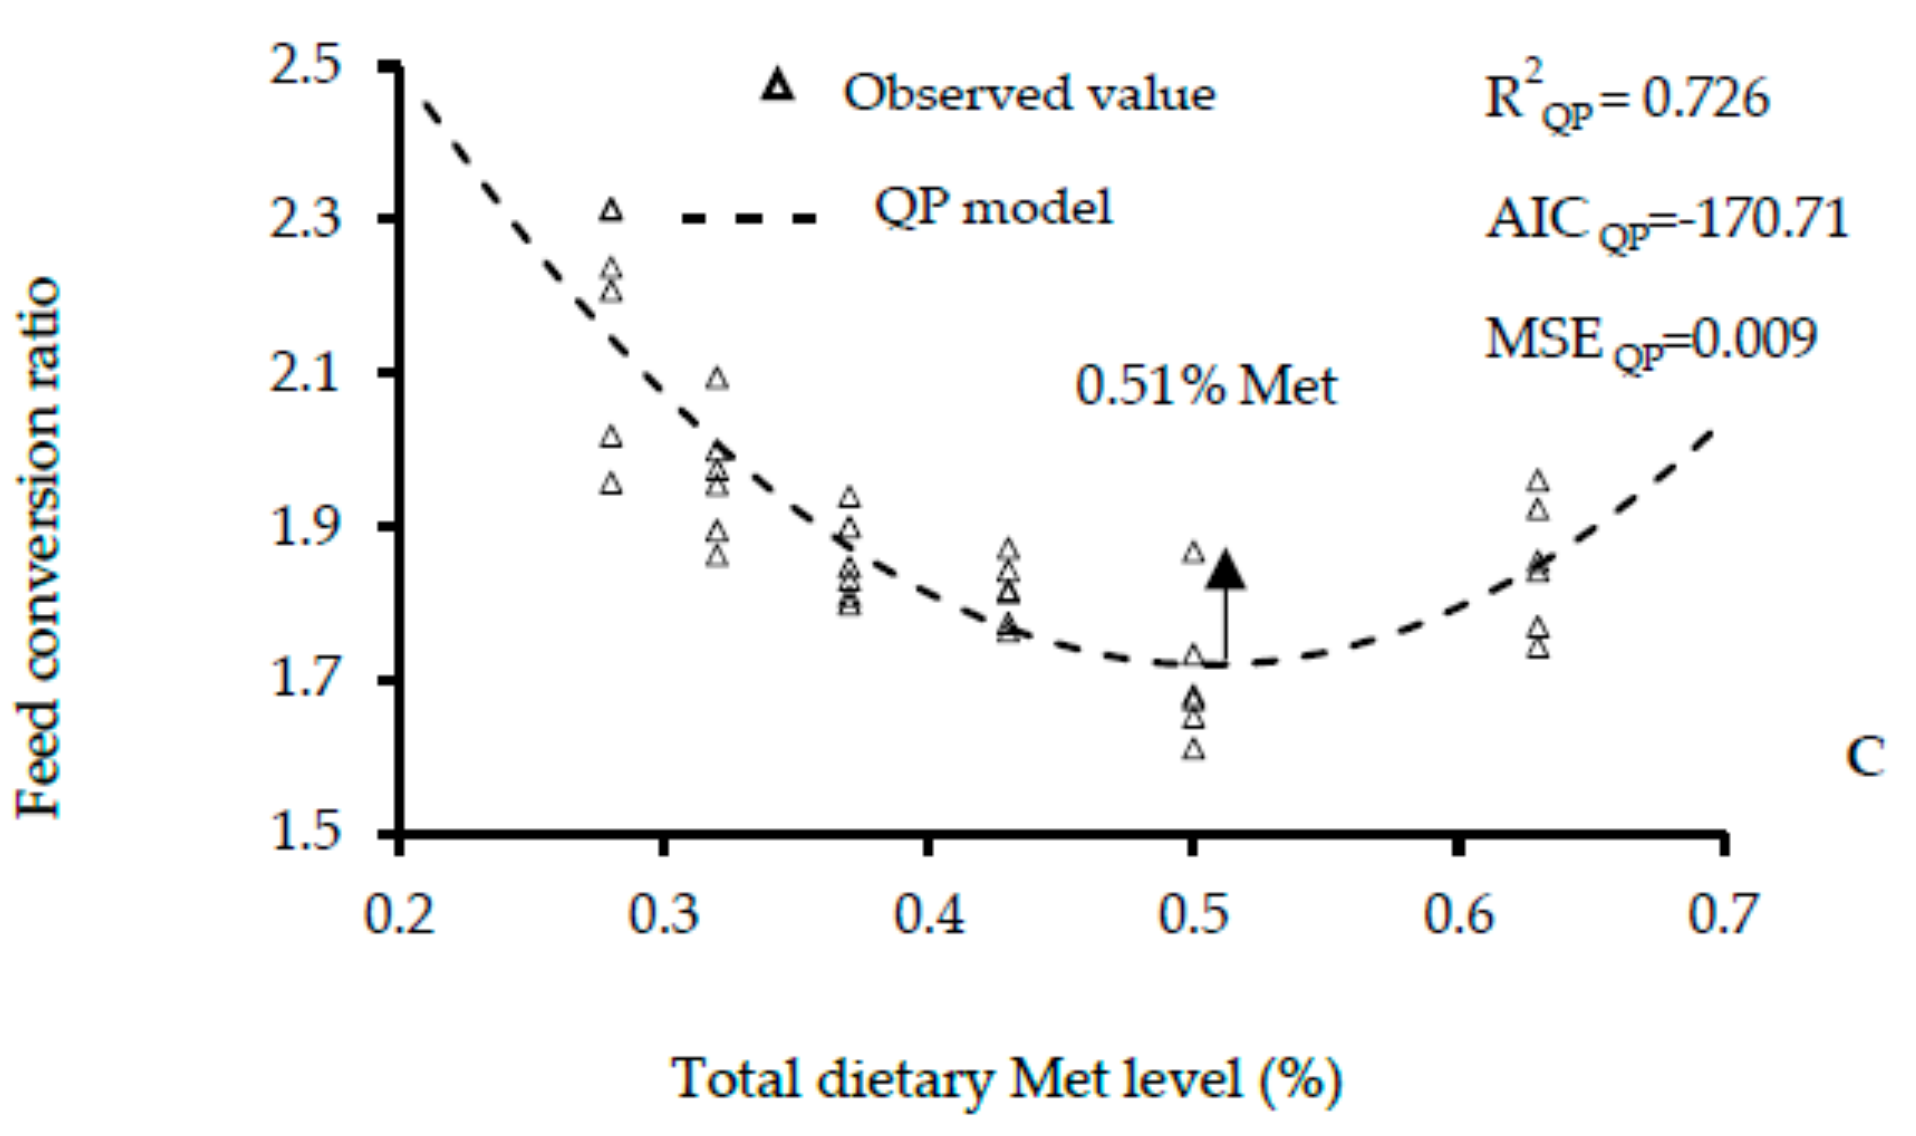
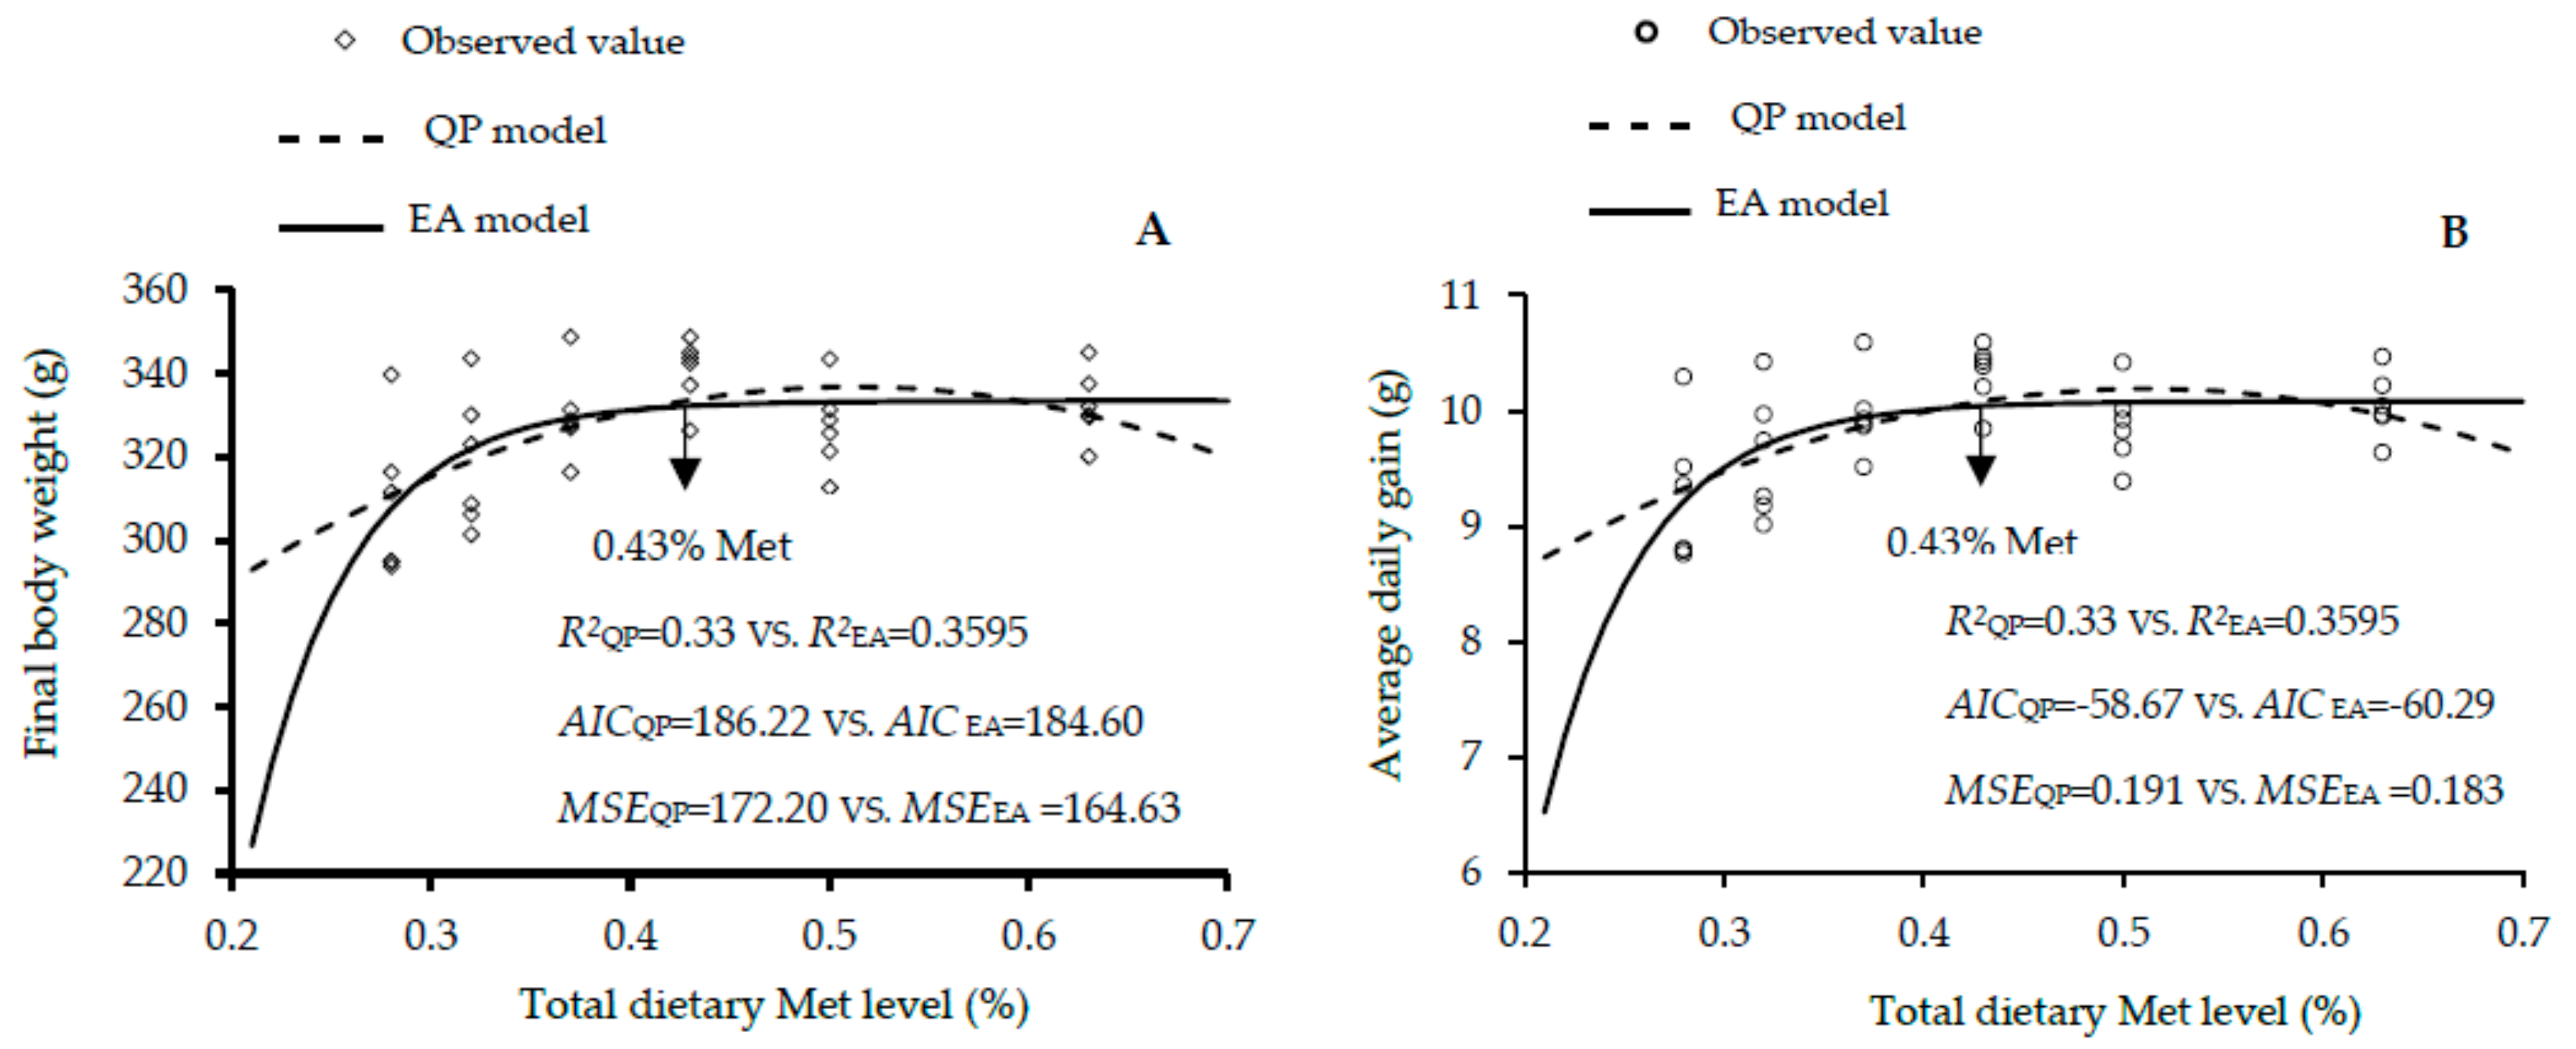
3.2. Growth Performance of Guangxi Broilers Aged from 1 to 30 Days (Exp 2)
4. Discussion
5. Conclusions
Author Contributions
Funding
Conflicts of Interest
References
- Jiang, S.; Gou, Z.; Li, L.; Lin, X.; Jiang, Z. Growth performance, carcass traits and meat quality of yellow-feathered broilers fed graded levels of alfalfa meal with or without wheat. Anim. Sci. J. 2017, 89, 561–569. [Google Scholar] [CrossRef] [PubMed]
- Li, L.; Abouelezz, K.F.M.; Gou, Z.; Lin, X.; Wang, Y.; Fan, Q.; Cheng, Z.; Ding, F.; Jiang, S.; Jiang, Z. Optimization of dietary zinc requirement for broiler breeder hens of chinese yellow-feathered chicken. Animals 2019, 9, 472. [Google Scholar] [CrossRef] [Green Version]
- Abouelezz, K.F.M.; Wang, Y.; Wang, W.; Lin, X.; Li, L.; Gou, Z.; Fan, Q.; Jiang, S. Impacts of Graded Levels of Metabolizable Energy on Growth Performance and Carcass Characteristics of Slow-Growing Yellow-Feathered Male Chickens. Animals 2019, 9, 461. [Google Scholar] [CrossRef] [PubMed] [Green Version]
- Xi, P.; Lin, Y.; Jiang, S.; Zheng, C.; Zhou, G.; Jiang, Z. Effects of dietary Methionine levels on growth performance, carcass quality, feather protein retention and meat quality in yellow-feathered broiler chickens aged from 43 to 63 days. Chin. J. Anim. Nutr. 2011, 23, 210–218. [Google Scholar]
- Xi, P.; Lin, Y.; Zheng, C.; Jiang, S.; Zhou, G.; Jiang, Z. Digestible Methionine requirement of Yellow-feathered broiler chickens from 0 to 21 and 22 to 42 day of age. Chin. J. Anim. Sci. 2010, 46, 31–35. [Google Scholar]
- Wisuttipongtarvorn, S. Methionine Requirement of Suwan-6 Crossbred Native Chicken at 0–6 Weeks of Age. 1994. Available online: http://agris.fao.org/agris-search/search.do?recordID=TH1998000282 (accessed on 18 January 2020).
- Attia, Y.A.; Hassan, R.A.; Shehatta, M.H.; Abd El-Hady, S.B. Growth, carcass quality and blood serum constituents of slow growth chicks as affected by betaine additions to diets containing 2. Different levels of methionine. Int. J. Poult. Sci. 2005, 4, 856–865. [Google Scholar]
- Attia, Y.A. Responses of growth performance, carcass characteristics, meat quality and plasma constituents of male Campbell ducks to dietary levels of methionine and phytase and their interactions. Egypt. Poult. Sci. J. 2003, 23, 557–580. [Google Scholar]
- Wen, C.; Jiang, X.Y.; Ding, L.R.; Wang, T.; Zhou, Y.M. Effects of dietary methionine on growth performance, meat quality and oxidative status of breast muscle in fast- and slow-growing broilers. Poult. Sci. 2017, 96, 1707–1714. [Google Scholar] [CrossRef]
- Chen, Y.P.; Chen, X.; Zhang, H.; Zhou, Y.M. Effects of dietary concentrations of methionine on growth performance and oxidative status of broiler chickens with different hatching weight. Br. Poult. Sci. 2013, 54, 531–537. [Google Scholar] [CrossRef]
- Rama Rao, S.V.; Praharaj, N.K.; Reddy, M.R.; Panda, A.K. Interaction between genotype and dietary concentrations of methionine for immune function in commercial broilers. Br. Poult. Sci. 2003, 44, 104–112. [Google Scholar] [CrossRef]
- Shini, S.; Li, X.; Bryden, W.L. Methionine requirement and cell-mediated immunity in chicks. Br. J. Nutr. 2005, 94, 746–752. [Google Scholar]
- Martínez, Y.; Li, X.; Liu, G.; Bin, P.; Yan, W.; Más, D.; Valdivié, M.; Hu, C.A.; Ren, W.; Yin, Y. The role of methionine on metabolism, oxidative stress, and diseases. Amino Acids 2017, 49, 2091–2098. [Google Scholar] [CrossRef] [PubMed]
- Soares, M.S.; Oliveira, P.S.; Debom, G.N.; da Silveira Mattos, B.; Polachini, C.R.; Baldissarelli, J.; Morsch, V.M.; Schetinger, M.R.; Tavares, R.G.; Stefanello, F.M.; et al. Chronic administration of methionine and/or methionine sulfoxide alters oxidative stress parameters and ALA-D activity in liver and kidney of young rats. Amino Acids 2017, 49, 129–138. [Google Scholar] [CrossRef] [PubMed]
- Ministry of Agriculture, China. Feeding Management Regulations of Yellow Feathered-Chicken, 1st ed.; Standards Press of China: Beijing, China, 2010. [Google Scholar]
- Ministry of Agriculture, China. Feeding Standard of Chicken, 1st ed.; Standards Press of China: Beijing, China, 2004. [Google Scholar]
- Xi, P.B.; Yi, G.F.; Lin, Y.C.; Zheng, C.T.; Jiang, Z.Y.; Song, G.L.; Knight, C.D. Effect of methionine source and dietary crude protein level on growth performance, carcass traits and nutrient retention in Chinese color-feathered chicks. AJAS 2007, 20, 962–970. [Google Scholar] [CrossRef]
- Pesti, G.M.; Vedenov, D.; Cason, J.A.; Billard, L.A. Comparison of methods to estimate nutritional requirements from experimental data. Br. Poult. Sci. 2009, 50, 16–32. [Google Scholar] [CrossRef] [PubMed] [Green Version]
- Robbins, K.R.; Saxton, A.M.; Southern, L.L. Estimation of nutrient requirements using broken-line regression analysis. J. Anim. Sci. 2006, 84, 155–165. [Google Scholar] [CrossRef]
- Mayer, A.N.; Vieira, S.L.; Berwanger, E.; Angel, C.R.; Kindlein, L.; França, I.; Noetzold, T.L. Zinc requirements of broiler breeder hens. Poul. Sci. 2019, 98, 1288–1301. [Google Scholar] [CrossRef]
- Leeson, S.; Zubair, A. Nutrition of the broiler chicken around the period of compensatory growth. Poult. Sci. 1997, 76, 992–999. [Google Scholar] [CrossRef]
- Motl, M.A.; Fritts, C.A.; Waldroup, P.W. Influence of Dietary Sodium Level on Utilization of Methionine from DL-Methionine and Liquid Methionine-Hydroxy Analogue. J. Appl. Poult. Res. 2005, 14, 147–155. [Google Scholar] [CrossRef] [Green Version]
- Liu, Y.L.; Song, G.L.; Yi, G.F.; Hou, Y.Q.; Huang, J.W.; Knight, C.D. Effect of supplementing 2-hydroxy-4-(methylthio) butanoic acid and DL-methionine in corn-soybean-cottonseed meal diets on growth performance and carcass quality of broilers. AJAS 2006, 19, 1197–1205. [Google Scholar] [CrossRef]
- Kalinowski, A.; Moran, E.; Wyatt, C. Methionine and cystine requirements of slow- and fast-feathering male broilers from zero to three weeks of age. Poult. Sci. 2003, 82, 1423–1427. [Google Scholar] [CrossRef] [PubMed]
- Tsiagbe, V.K.; Cook, M.E.; Harper, A.E.; Sunde, M.L. Enhanced immune-responses in broiler chicks fed methionine-supplemented diets. Poult. Sci. 1987, 66, 1147–1154. [Google Scholar] [CrossRef] [PubMed]
- Carew, L.B.; McMurtry, J.P.; Alster, F.A. Effects of methionine deficiencies on plasma levels of thyroid hormones, insulin-like growth factors-I and -II, liver and body weights, and feed intake in growing chickens. Poult. Sci. 2003, 82, 1932–1938. [Google Scholar] [CrossRef] [PubMed]
- National Research Council. Nutrient Requirements of Poultry; National Academies Press: Washington, WA, USA, 1994. [Google Scholar]
- Jamroz, D.; Wiliczkiewicz, A.; Lemme, A.; Orda, J.; Skorupińska, J.; Wertelecki, T. Effect of increased methionine level on performance and apparent ileal digestibility of amino acids in ducks. J. Anim. Phys. Anim. Nutr. 2009, 93, 622–630. [Google Scholar] [CrossRef] [PubMed]
- D’Mello, J.P.F.; D’Mello, J. An outline of pathways in amino acid metabolism. In Amino Acids in Animal Nutrition; CABI Publishing: Wallingford, UK, 2003; pp. 71–86. [Google Scholar]
- Edmonds, M.S.; Baker, D.H. Comparative effects of individual amino acid excesses when added to a corn-soybean meal diet: Effects on growth and dietary choice in the chick. J. Anim. Sci. 1987, 65, 699–705. [Google Scholar] [CrossRef] [PubMed] [Green Version]
- Sokołowicz, Z.; Krawczyk, J.; Świątkiewicz, S. Quality of Poultry Meat from Native Chicken Breeds—A Review. Ann. Anim. Sci. 2016, 16, 347–368. [Google Scholar] [CrossRef] [Green Version]
- Dozier, W.A.; Moran, E.T.; Kidd, M.T. Responses of Fast- and Slow- Feathering Male Broilers to Dietary Threonine During 42 to 56 Days of Age. J. Appl. Poult. Res. 2000, 9, 460–467. [Google Scholar] [CrossRef] [Green Version]
- Xia, W.G.; Chen, W.; Abouelezz, K.F.; Azzam, M.M.; Ruan, D.; Wang, S.; Zhang, Y.N.; Luo, X.; Wang, S.L.; Zheng, C.T. Estimation of calcium requirements for optimal productive and reproductive performance, eggshell and tibial quality in egg-type duck breeders. Animal 2019, 13, 2207–2215. [Google Scholar] [CrossRef]


| Ingredient (%) | Amount | Nutrients 2 | Value |
|---|---|---|---|
| Corn | 63.62 | AME (MJ/kg) | (12.55) |
| Soybean meal | 20.01 | Crude protein (%) | 21 |
| Pea protein concentrate | 9.68 | Lysine (%) | 1.2 |
| Soybean oil | 2.56 | Met 3 (%) | 0.28 |
| Calcium Carbonate | 1.35 | Cys 3 (%) | 0.26 |
| Dicalcium phosphate | 1.9 | Threonine (%) | 0.84 |
| Mineral premix 1 | 0.20 | Tryptophan (%) | 0.21 |
| Vitamin premix 1 | 0.02 | Isoleucine (%) | 0.89 |
| Salt | 0.49 | Valine (%) | 0.99 |
| Choline chloride (50%) | 0.10 | Calcium (%) | 1.0 |
| L-Threonine | 0.07 | Non-phytate phosphorus (%) | 0.45 |
| Total | 100 |
| Variables | Total Dietary Methionine Levels (%) | SEM 1 | p-Value | |||||||||
| 0.28 | 0.32 | 0.37 | 0.43 | 0.50 | 0.63 | Met Level | Linear | Quadratic | ||||
| Final body weight (g) | 291.67 d | 322.44 c | 349.26 b | 359.79 ab | 380.44 a | 374.56 a | 8.62 | <0.0001 | <0.0001 | <0.0001 | ||
| Average daily gain (g) | 12.28 d | 13.74 c | 15.02 b | 15.52 ab | 16.50 a | 16.22 a | 0.41 | <0.0001 | <0.0001 | <0.0001 | ||
| Average daily feed intake (g) | 24.13 d | 25.77 c | 27.19 b | 28.70 a | 28.89 a | 28.09 ab | 0.47 | <0.0001 | <0.0001 | <0.0001 | ||
| Feed conversion ratio (g feed: g weight) | 1.97 a | 1.88 b | 1.81 bc | 1.82 bc | 1.75 c | 1.73 c | 0.003 | <0.0001 | <0.0001 | <0.0001 | ||
| Variables | Model | Regression Equation 2 | TotalDietary Met Level (%) | TotalDaily Met Allowance (g/day) | SSR3 | p-Value | ||||||
| Final body weight (g) | Quadratic Polynomial | Y = 15.81 + 1340.52X − 1225.08X2 | 0.55 | 0.149 | 12162.24 | <0.0001 | ||||||
| Exponential Asymptotic | Y = 291 + 88.99 × (1 − EXP (−11.42 × (X − 0.28))) | 0.54 | 0.146 | 12218.97 | <0.0001 | |||||||
| Average daily gain (g) | Quadratic Polynomial | Y = −0.86 + 63.83X − 58.34X2 | 0.55 | 0.149 | 27.58 | <0.0001 | ||||||
| Exponential Asymptotic | Y = 12.25 + 4.24 × (1 − EXP (−11.42 × (X − 0.28))) | 0.54 | 0.146 | 27.71 | <0.0001 | |||||||
| Average daily feed intake (g) | Quadratic Polynomial | Y = 7.04 + 83.86X − 80.13X2 | 0.52 | 0.141 | 28.29 | <0.0001 | ||||||
| Exponential Asymptotic | Y = 24.03 + 4.58 × (1 − EXP (−13.85 × (X − 0.28))) | 0.50 | 0.135 | 31.50 | <0.0001 | |||||||
| Feed conversion ratio | Y = 2.54−2.74X + 2.34X2 | 0.58 | 0.157 | 0.212 | <0.0001 | |||||||
| Variables | Total Dietary Methionine Levels (%) | SEM 1 | p-Value | ||||||||
| 0.28 | 0.32 | 0.37 | 0.43 | 0.50 | 0.63 | Met Level | Linear | Quadratic | |||
| Final body weight (g) | 315.34 c | 332.84 b | 368.9 a | 377.26 a | 380.81 a | 370.91 a | 4.73 | <0.0001 | <0.0001 | <0.0001 | |
| Average daily gain (g) | 13.17 c | 14.00 b | 15.72 a | 16.12 a | 16.29 a | 15.82 a | 0.23 | <0.0001 | <0.0001 | <0.0001 | |
| Average daily feed intake (g) | 28.53 b | 27.46 c | 29.13 ab | 29.48 a | 27.69 c | 29.19 ab | 0.15 | <0.0001 | 0.147 | 0.342 | |
| Feed conversion ratio (g:g) | 2.17 a | 1.96 b | 1.852 bc | 1.83 c | 1.70 d | 1.85 bc | 0.029 | <0.0001 | <0.0001 | <0.0001 | |
| Variables | Model | Regression Equation 2 | Total Dietary Met Level, % | TotalDaily Met Fed Allowance, g/day | SSR 3 | p-Value | |||||
| Final body weight (g) | Quadratic Polynomial | Y = 46.14 + 1323.09X − 1285.88X2 | 0.51 | 0.145 | 7316.66 | <0.0001 | |||||
| Exponential Asymptotic | Y = 311.9 + 67.2 × (1 − EXP(−15.64 × (X − 0.28))) | 0.47 | 0.134 | 7992.86 | <0.0001 | ||||||
| Average daily gain (g) | Quadratic Polynomial | Y = 0.35 + 63.00X − 61.23X2 | 0.51 | 0.145 | 16.59 | <0.0001 | |||||
| Feed conversion ratio | Exponential Asymptotic | Y = 13.01 + 3.20 × (1 − EXP(−15.64 × (X − 0.28))) | 0.47 | 0.134 | 18.12 | <0.0001 | |||||
| Quadratic Polynomial | Y = 3.86 − 8.47X + 8.38X2 | 0.51 | 0.145 | 0.281 | <0.0001 | ||||||
| Variables | Total Dietary Methionine Levels (%) | SEM 1 | p-Value | ||||||||
| 0.28 | 0.32 | 0.37 | 0.43 | 0.50 | 0.63 | Met level | Linear | Quadratic | |||
| Final body weight (g) | 303.50 d | 327.65 c | 359.10 b | 368.53 ab | 380.62 a | 372.73 ab | 3.87 | <0.0001 | <0.0001 | <0.0001 | |
| Average daily gain (g) | 12.72 d | 13.87 c | 15.37 b | 15.82 ab | 16.40 a | 16.02 ab | 0.18 | <0.0001 | <0.0001 | <0.0001 | |
| Average daily feed intake (g) | 26.33 b | 26.62 b | 28.16 a | 28.72 a | 28.29 a | 28.64 a | 0.19 | <0.0001 | <0.0001 | <0.0001 | |
| Feed conversion ratio (g:g) | 2.07 a | 1.92 b | 1.83 c | 1.82 c | 1.73 d | 1.79 cd | 0.017 | <0.0001 | 0.123 | 0.108 | |
| Variables | Model | Regression Equation 2 | Total Dietary Met Level, % | Total Daily Met Fed Allowance, g/day | SSR 3 | p-Value | |||||
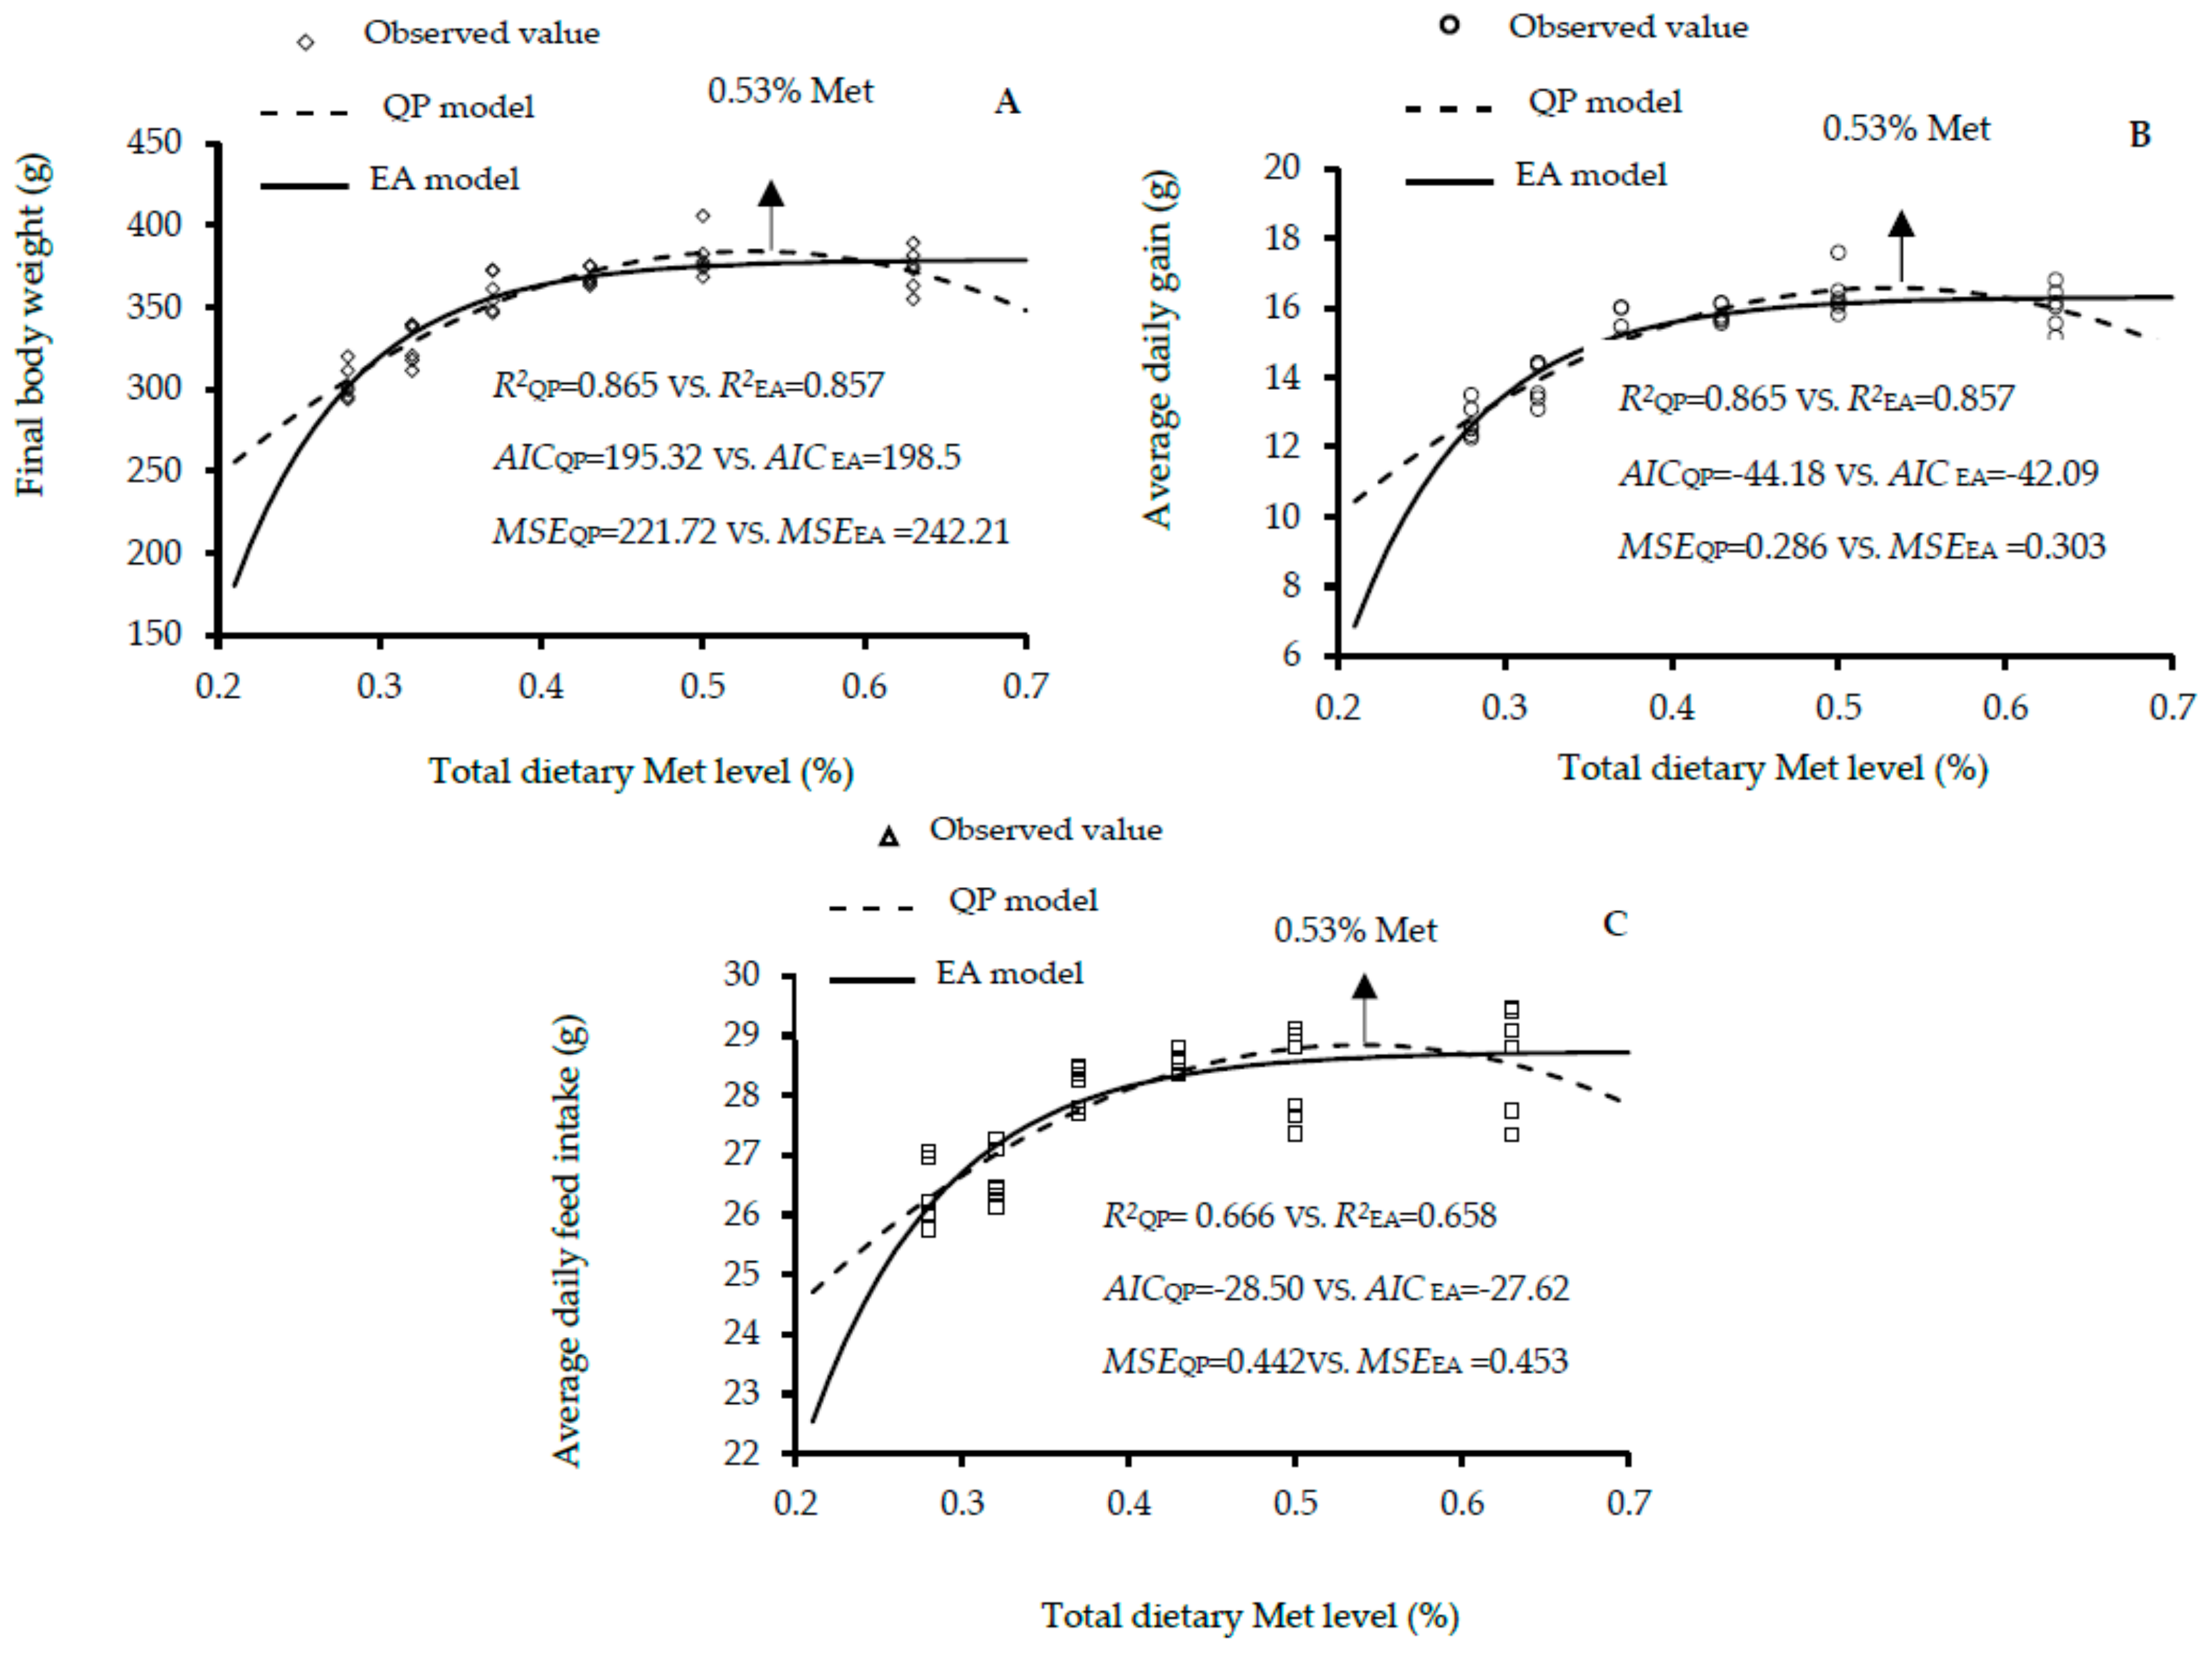
| Final body weight (g) | Quadratic Polynomial | Y = 30.97 + 1331.80X − 1255.48X2 | 0.53 | 0.147 | 4164.46 | <0.0001 | |||||
| Exponential Asymptotic | Y = 301.3 + 77.56 × (1 − EXP(−13.46 × (X − 0.28))) | 0.50 | 0.139 | 4413.55 | <0.0001 | ||||||
| Average daily gain (g) | Quadratic Polynomial | Y = −0.25 + 63.42X − 59.79X2 | 0.53 | 0.147 | 9.443 | <0.0001 | |||||
| Exponential Asymptotic | Y = 12.62 + 3.69 × (1 − EXP(−13.46 × (X − 0.28))) | 0.50 | 0.139 | 10.008 | <0.0001 | ||||||
| Average daily feed intake (g) | Quadratic Polynomial | Y = 17.71 + 41.35X − 38.39X2 | 0.53 | 0.147 | 14.597 | <0.0001 | |||||
| Exponential Asymptotic | Y = 26.14 + 2.59 × (1 − EXP(−12.47 × (X − 0.28))) | 0.52 | 0.145 | 14.958 | <0.0001 | ||||||
| Variables | Total Dietary Methionine Levels (%) | SEM 1 | p-Value | ||||||||
| 0.28 | 0.32 | 0.37 | 0.43 | 0.50 | 0.63 | Met Level | Linear | Quadratic | |||
| Final body weight (g) | 328.96 c | 353.96 b | 359.07 b | 390.74 a | 384.15 a | 383.04 a | 6.18 | <0.0001 | <0.0001 | <0.0001 | |
| Average daily gain (g) | 9.92 c | 10.75 b | 10.92 b | 11.97 a | 11.75 a | 11.70 a | 0.21 | <0.0001 | <0.0001 | <0.0001 | |
| Average daily feed intake (g) | 25.76 b | 25.82 b | 26.37 ab | 28.21 ab | 27.29 ab | 28.84 a | 0.82 | 0.0035 | 0.003 | 0.114 | |
| Feed conversion ratio (g:g) | 2.6 | 2.41 | 2.41 | 2.35 | 2.32 | 2.46 | 0.08 | 0.1508 | |||
| Variables | Model | Regression Equation 2 | Total Dietary Met Level (%) | Total Daily Met fed Allowance (g/day) | SSR3 | p-Value | |||||
| Final body weight (g) | Quadratic Polynomial | Y = 123.45 + 1007.30X − 947.59X2 | 0.53 | 0.143 | 5518.908 | <0.0001 | |||||
| Exponential Asymptotic | Y = 328.50 + 59.13 × (1 − EXP(−12.83 × (X − 0.28))) | 0.51 | 0.138 | 5777.969 | <0.0001 | ||||||
| Average daily gain (g) | Quadratic Polynomial | Y = 3.07 + 33.58X − 31.59X2 | 0.53 | 0.143 | 6.132 | <0.0001 | |||||
| Exponential Asymptotic | Y = 9.90 + 1.97 × (1 − EXP(−12.83 × (X − 0.28))) | 0.51 | 0.138 | 6.42 | <0.0001 | ||||||
| Variables | Total Dietary Methionine levels (%) | SEM 1 | p-Value | |||||||
| 0.28 | 0.32 | 0.37 | 0.43 | 0.50 | 0.63 | Met Level | Linear | Quadratic | ||
| Final body weight (g) | 308.50 c | 318.82 bc | 329.90 ab | 340.57 a | 327.14 ab | 332.34 ab | 5.61 | 0.0023 | 0.011 | 0.001 |
| Average daily gain (g) | 9.25 c | 9.59 bc | 9.96 ab | 10.31 a | 9.87 ab | 10.04 ab | 0.19 | 0.0023 | 0.011 | 0.001 |
| Average daily feed intake (g) | 25.57 | 26.82 | 24.96 | 26.31 | 25.58 | 24.62 | 1.11 | 0.45 | ||
| Feed conversion ratio (g:g) | 2.77 | 2.79 | 2.51 | 2.55 | 2.59 | 2.45 | 0.11 | 0.21 | ||
| Variables | Model | Regression Equation 2 | Total Dietary Met Level, % | Total Daily Met Fed Allowance, g/day | SSR 3 | p-Value | ||||
| Final body weight (g) | Quadratic Polynomial | Y = 210.40 + 493.91X − 482.58X2 | 0.51 | 0.131 | 5682.55 | 0.001 | ||||
| Exponential Asymptotic | Y = 307.6 + 25.8 × (1 − EXP(−20.29 × (X − 0.28))) | 0.43 | 0.110 | 5432.792 | 0.0006 | |||||
| Average daily gain (g) | Quadratic Polynomial | Y = 5.98 + 16.46X − 16.09X2 | 0.51 | 0.131 | 6.314 | 0.001 | ||||
| Exponential Asymptotic | Y = 9.22 + 0.86 × (1 − EXP(−20.29 × (X − 0.28))) | 0.43 | 0.110 | 6.036 | 0.0006 | |||||
| Variables | Total Dietary Methionine Levels (%) | SEM 1 | p-Value | |||||||
| 0.28 | 0.32 | 0.37 | 0.43 | 0.50 | 0.63 | Met Level | Linear | Quadratic | ||
| Final body weight (g) | 318.73 c | 336.39 bc | 344.49 ab | 365.66 a | 355.64 ab | 357.69 ab | 4.28 | <0.0001 | <0.0001 | <0.0001 |
| Average daily gain (g) | 9.58 c | 10.17 bc | 10.44 ab | 11.15 a | 10.81 ab | 10.88 ab | 0.14 | <0.0001 | <0.0001 | <0.0001 |
| Average daily feed intake (g) | 25.67 | 26.32 | 25.67 | 27.26 | 26.44 | 26.73 | 0.43 | 0.2473 | ||
| Feed conversion ratio (g:g) | 2.68 a | 2.60 ab | 2.46 b | 2.45 b | 2.45 b | 2.46 b | 0.041 | 0.0105 | 0.027 | 0.016 |
| Variables | Model | Regression Equation 2 | Total Dietary Met Level, % | Total Daily Met Fed Allowance, g/day | SSR3 | p-Value | ||||
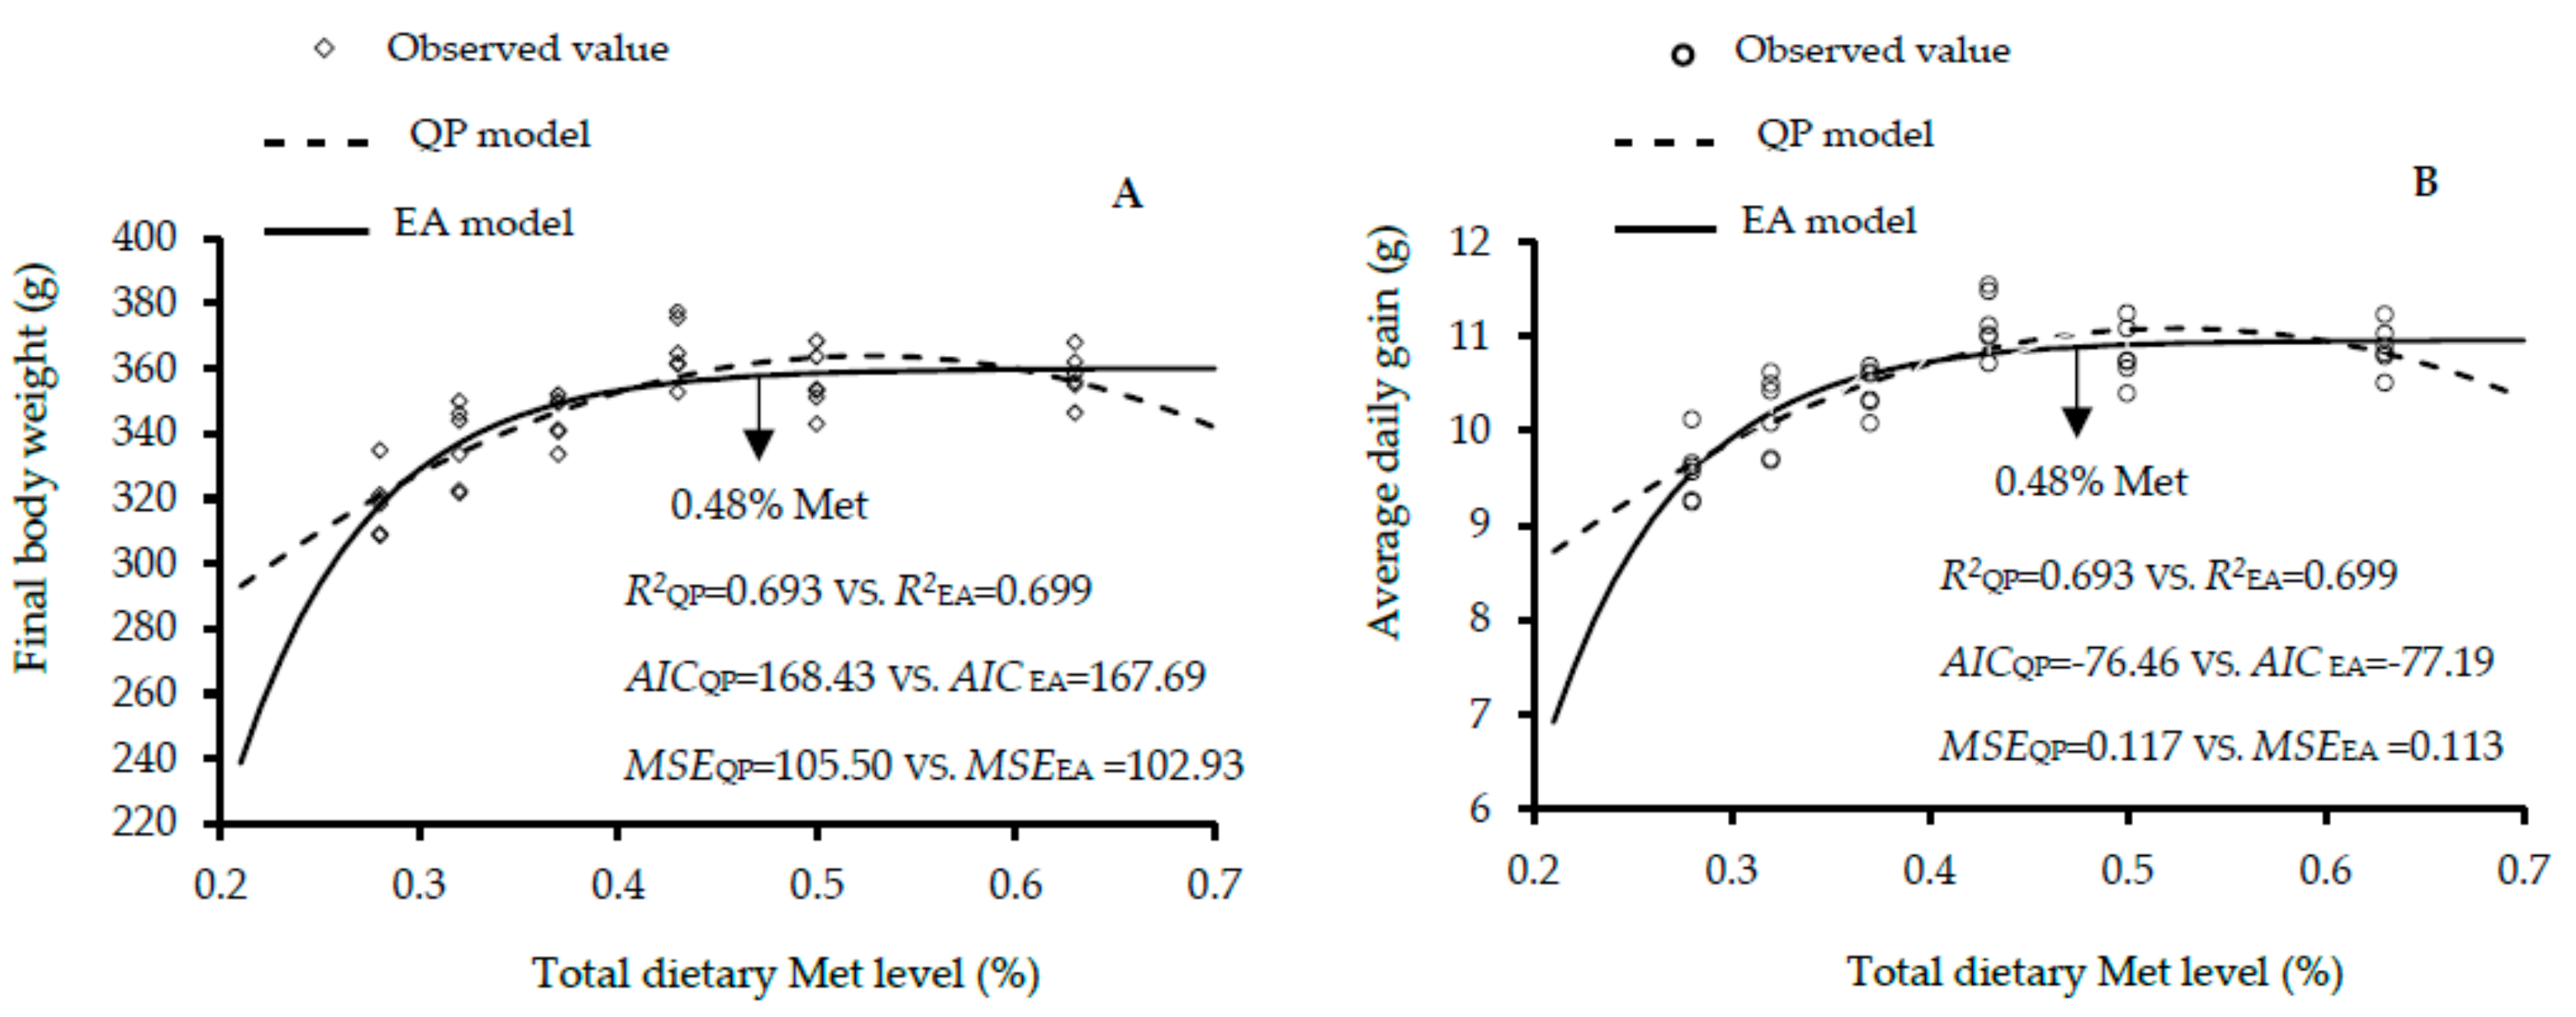
| Final body weight (g) | Quadratic Polynomial | Y = 166.93 + 750.60X − 715.09X2 | 0.52 | 0.137 | 3466.707 | <0.0001 | ||||
| Exponential Asymptotic | Y = 318.0 + 42.06 × (1 − EXP(−15.14 × (X − 0.28))) | 0.48 | 0.126 | 3396.603 | <0.0001 | |||||
| Average daily gain (g) | Quadratic Polynomial | Y = 4.52 + 25.02X − 23.84X2 | 0.52 | 0.137 | 3.852 | <0.0001 | ||||
| Exponential Asymptotic | Y = 9.56 + 1.40 × (1 − EXP(−15.14 × (X − 0.28))) | 0.48 | 0.126 | 3.774 | <0.0001 | |||||
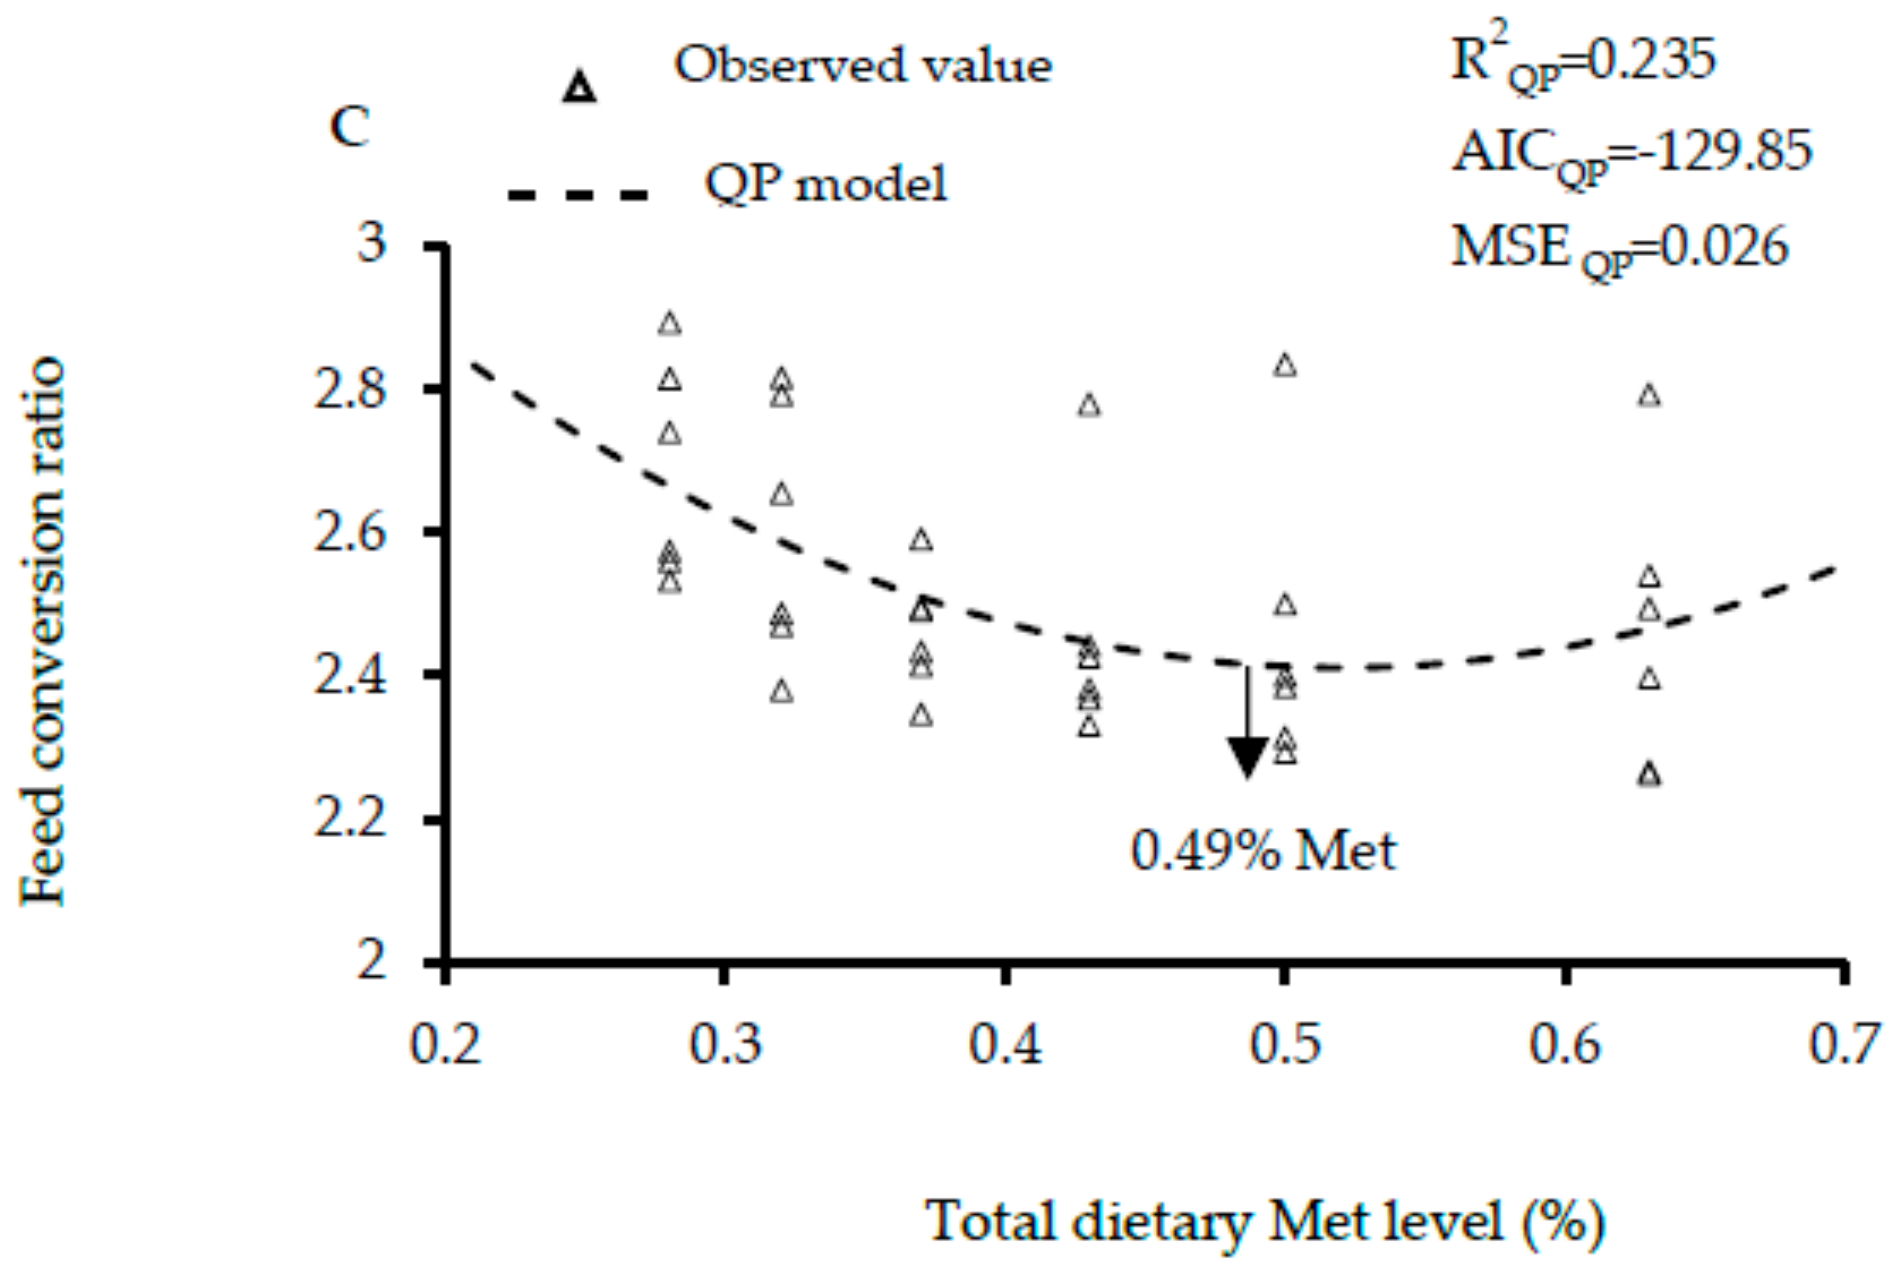
| Feed conversion ratio | Quadratic Polynomial | Y = 3.60 − 4.58X + 4.41X2 | 0.49 | 0.129 | 0.874 | 0.016 | ||||
© 2020 by the authors. Licensee MDPI, Basel, Switzerland. This article is an open access article distributed under the terms and conditions of the Creative Commons Attribution (CC BY) license (http://creativecommons.org/licenses/by/4.0/).
Share and Cite
Li, L.; Abouelezz, K.F.M.; Cheng, Z.; Gad-Elkareem, A.E.G.; Fan, Q.; Ding, F.; Gao, J.; Jiang, S.; Jiang, Z. Modelling Methionine Requirements of Fast- and Slow-Growing Chinese Yellow-Feathered Chickens during the Starter Phase. Animals 2020, 10, 443. https://doi.org/10.3390/ani10030443
Li L, Abouelezz KFM, Cheng Z, Gad-Elkareem AEG, Fan Q, Ding F, Gao J, Jiang S, Jiang Z. Modelling Methionine Requirements of Fast- and Slow-Growing Chinese Yellow-Feathered Chickens during the Starter Phase. Animals. 2020; 10(3):443. https://doi.org/10.3390/ani10030443
Chicago/Turabian StyleLi, Long, K.F.M. Abouelezz, Zhonggang Cheng, A.E.G. Gad-Elkareem, Qiuli Fan, Fayuan Ding, Jun Gao, Shouqun Jiang, and Zongyong Jiang. 2020. "Modelling Methionine Requirements of Fast- and Slow-Growing Chinese Yellow-Feathered Chickens during the Starter Phase" Animals 10, no. 3: 443. https://doi.org/10.3390/ani10030443