Article

Effects of a Dietary L-Carnitine Supplementation on Performance, Energy Metabolism and Recovery from Calving in Dairy Cows

1
Institute of Animal Nutrition, Friedrich-Loeffler-Institut, Federal Research Institute for Animal Health, Bundesallee 37, 38116 Braunschweig, Germany
2
Institute of Animal Science, Functional Anatomy of Livestock, University of Hohenheim, Fruwirthstraße 35, 70593 Stuttgart, Germany
3
Institute of Animal Science, Feed-Gut Microbiota Interaction, University of Hohenheim, Emil-Wolff-Str. 8, 70593 Stuttgart, Germany
4
Institute for Animal Science, Physiology and Hygiene, University of Bonn, Katzenburgweg 7–9, 53115 Bonn, Germany
5
Institute of Animal Nutrition and Nutrition Physiology, Justus-Liebig-University Gießen, Heinrich-Buff-Ring 26-32, 35392 Gießen, Germany
6
Clinic for Cattle, University of Veterinary Medicine Hannover, Foundation, Bischofsholer Damm 15, 30173 Hannover, Germany
*
Author to whom correspondence should be addressed.
Animals 2020, 10(2), 342; https://doi.org/10.3390/ani10020342
Submission received: 31 January 2020 / Revised: 17 February 2020 / Accepted: 18 February 2020 / Published: 21 February 2020
(This article belongs to the Section Animal Nutrition)

Abstract

:

Simple Summary

Dairy cows develop metabolic diseases especially in the transition period due to high energy requirements for the process of calving, beginning milk production and, simultaneously, restricted feed intake capacity. L-carnitine is endogenously synthesised as an obligatory, quaternary amine for the initial step of ß-oxidation, but with the onset of lactation it is also excreted with milk, whereby its availability for other metabolic pathways might be limited. Supplemental L-carnitine might be able to fill in this apparent gap and to enhance the efficiency of ß-oxidation, whereby the magnitude of negative energy balance would be decreased. The present experiment mainly focused on the energy-consuming process of calving itself and on the energy metabolism during the first weeks of lactation.

Abstract

Dairy cows are metabolically challenged during the transition period. Furthermore, the process of parturition represents an energy-consuming process. The degree of negative energy balance and recovery from calving also depends on the efficiency of mitochondrial energy generation. At this point, L-carnitine plays an important role for the transfer of fatty acids to the site of their mitochondrial utilisation. A control (n = 30) and an L-carnitine group (n = 29, 25 g rumen-protected L-carnitine per cow and day) were created and blood samples were taken from day 42 ante partum (ap) until day 110 post-partum (pp) to clarify the impact of L-carnitine supplementation on dairy cows, especially during the transition period and early puerperium. Blood and clinical parameters were recorded in high resolution from 0.5 h to 72 h pp. L-carnitine-supplemented cows had higher amounts of milk fat in early lactation and higher triacylglyceride concentrations in plasma ap, indicating increased efficiency of fat oxidation. However, neither recovery from calving nor energy balance and lipomobilisation were influenced by L-carnitine.

1. Introduction

Dairy cows are metabolically challenged during the transition period which is characterised by a negative energy balance due to high energy requirements for beginning milk production and an inadequate feed intake capacity [1]. Pancreatic insulin production decreases post-partum (pp) and induces a decrease in glucose utilisation by insulin-sensitive organs [2], whereby the mammary gland obtains additional glucose for milk production [3]. In response to the energy deficit, a mobilisation of body fat reserves occurs and thus, the concentration of non-esterified fatty acids (NEFA) increases in blood. When the capacity of the carboxylic acid cycle is exceeded, excess of acetyl-CoA resulting from NEFA degradation are utilised in ketogenesis, and ketone bodies, such as ß-hydroxybutyrate (BHB), are formed. Moreover, a fatty liver syndrome might evolve from an insufficient export of triacyglycerides (TG), which are synthesised from surplus NEFA [4]. An efficient utilisation of NEFA depends on an adequate L-carnitine availability for fatty acid transfer into the mitochondrial matrix as the site of their oxidation. Therefore, an insufficient L-carnitine availability at times of an increased energy requirement, such as shortly after calving, might exacerbate the pathophysiological events discussed above [5]. An insufficient L-carnitine supply was proposed as a limiting factor for fatty acid metabolism [1]. Recent studies with L-carnitine-supplemented dairy cows demonstrated, among other things, a decreased TG accumulation in liver [5,6] and increased BHB levels in plasma [5,7], which might hint at modulations in lipid and energy metabolism.
The process of calving induces stress and pain [8], which further reduces feed intake on the day of parturition [9] and, therefore, increases energy deficit. Especially in this early period after calving, a sufficient L-carnitine availability might be important to compensate the loss of L-carnitine via milk [10] and facilitate recovery from calving. The extent of stress resulting from calving and the consequence on energy consumption might be evaluated by clinical variables such as respiratory rate, heart rate, primary rumen contractions and rectal temperature.
Therefore, the aim of the study was to investigate if L-carnitine-supplemented dairy cows were less affected by calving, and if L-carnitine supplementation affected pp lipid mobilisation with special attention to the first 72 h pp.

2. Materials and Methods

The experiment was carried out at the experimental station of the Institute of Animal Nutrition, Friedrich-Loeffler-Institut (FLI), in Braunschweig, Germany, in accordance with the German Animal Welfare Act approved by the LAVES (Lower Saxony Office for Consumer Protection and Food Safety, Germany) (AZ33.19-42502-04-16/2378).

2.1. Experimental Design

The experiment started individually for each cow with the expected day 42 ante partum (ap) and ended at day 110 pp. A total of 59 pluriparous German Holstein dairy cows, including eight rumen- and duodenum-cannulated cows, were assigned to two groups, a control (CON, n = 30) and an L-carnitine group (CAR, n = 29), balanced for numbers of lactation (2–5 lactations), body weight (568–1008 kg), body condition score (2.5–4.75) and fat-corrected milk yield of previous lactation. To circumvent ruminal degradation, the cows in CAR received 125 g of a rumen-protected L-carnitine product (Carneon 20 Rumin-Pro, Kaesler Nutrition GmbH, Cuxhaven, Germany) per cow and day, which was included in the concentrate feed. This amount corresponded to a daily L-carnitine intake of 25 g per cow and day. To balance the fat content of the L-carnitine product, CON obtained an equivalent fat product (BergaFat F-100 HP, Berg+Schmidt GmbH & Co. KG, Hamburg, Germany) as used for the rumen protection of the L-carnitine. The cows were kept in a free-stall barn with slatted floors and cubicles with rubber pads and were rehoused for calving in the calving pen, where a maximum of two cows were kept in one straw bedding box.
Both groups were fed with a partial mixed ration (PMR). Whereas the composition of roughage remained unchanged during the whole trial (70% maize silage and 30% grass silage), the proportion of roughage to concentrate was variable in accordance with the recommendation of nutrient and energy supply of the Society of Nutrition Physiology (GfE). Initially, up to day 1 ap, diets of 80% roughage and 20% concentrate were fed. The amount of concentrate was increased from 30% to 50% up to 14 days pp and from then on, 50% concentrate was constantly fed up to day 110 pp. The PMR was offered by feed-weigh troughs (Roughage Intake Control, System Insentec B.V., Marknesse, The Netherlands) and the supplementary, restricted, pelleted concentrate was provided via concentrate feeding stations (Insentec B.V., Marknesse, The Netherlands). Water was offered for ad libitum intake. The components and the chemical composition of roughages and concentrate feed are shown in Table 1.

2.2. Measurements and Sample Collection

Samples of the PMR were taken daily, whereas the concentrate feed was sampled once a week. The feed samples were pooled over four-week periods. Cows were equipped with ear transponders to enable the individual recording of feed and water intake.
Before calving, the body weight (BW) was recorded once a week, and during the lactation period, twice a day with a scale situated between the milking parlour and barn. Once a week, the same person also evaluated the body condition score (BCS) according to Edmonson et al. [14] (5-point scale, 1 = lean, 5 = obese). The cows were milked at 5:30 am and 3:30 pm. During milking, the milk yield was recorded by a milk counter (Lemmer Fullwood GmbH, Lohmar, Germany). Milk samples were taken twice a week during morning and evening milking to analyse milk ingredients.
Blood samples were collected from Vena jugularis externa by needle puncture or for frequent sampling, pp by indwelling catheters (from 0.5 h until 12 h after calving). Prior to blood collection, 20 mL of blood were aspirated and discarded from a catheter which was flushed with 20 mL of 0.9% saline solution after the collection. Blood samples were taken at the following time points: day 42, 14, 7, 3 and 1 ap, 0.5, 1, 2, 3, 4, 6, 9, 12, 24, 48 and 72 h pp, day 7, 14, 21, 28, 42, 56, 100 and 110 pp. Furthermore, ultrasonic measurements according to Raschka et al. [15] were performed on day 42 ap, 72 h pp, day 42 pp and day 100 pp to estimate masses of adipose tissues (subcutaneous (SAT), retroperitoneal (RAT), omental (OAT), mesenteric adipose tissue (MAT)) by using a Mindray M5 Vet (Mindray, Shenzhen, China) diagnostic ultrasound system with a linear (6 MHz, Mindray 6LE5Vs) and a convex probe (3 MHz, Mindray 3C5s).

2.3. Analyses

In accordance with the methods of the Association of German Agricultural Analytic and Research Institutes (VDLUFA) [16], the pooled feed samples were analysed for dry matter (method number 3.1), crude ash (method number 8.1), crude protein (method number 4.1.2), ether extract (method number 5.1.1), crude fibre (method number 6.1), neutral detergent fibre without ash (NDFom, method number 6.5.1) and acid detergent fibre without ash (ADFom, method number 6.5.2).
Milk ingredients (fat, protein, lactose and urea) were analysed by an infrared milk analyser (Milkoscan FT 6000®, Foss Electric, Hillerød, Denmark) and somatic cell count (SCC) was determined by a flow cytometric measurement (Fossomatic 500®, Foss Electric, Hillerød, Denmark).
For analyses of NEFA, BHB and TG, serum tubes were incubated for 30 min at 30 °C and the serum was separated via centrifugation of blood samples for 15 min at 15 °C and 3000 g (Varifuge 3.0, Heraeus, Hanau, Germany). The extracted serum was kept at a temperature of −80 °C until the day of measurement. Analyses were performed by a photometric method using the Eurolyser CCA 180 (Eurolyser Diagnostica GmbH, Salzburg, Austria). The insulin concentration in serum was determined by a sandwich-enzyme-linked immunosorbent assay (ELISA) (Bovine Insulin ELISA, 10-1201-01, Mecordia AB, Uppsala, Sweden) according to the manufacturer’s protocol.
Furthermore, an automated blood gas and electrolyte analyser (GEM Premier 4000, Werfen, Kirchheim, Germany) was used for determination of sodium, potassium, chloride, hydrogen carbonate and calcium ions, glucose and lactate concentration, the temperature-corrected partial pressure of oxygen and carbon dioxide (TpO2, TpCO2), oxygen saturation (sO2), total carbon dioxide, temperature-corrected pH, base excess (BE) and base excess in extra cellular fluid (Beecf) in heparinized blood which was collected in sample syringes (Werfen, Kirchheim, Germany). Total calcium and total phosphorous were measured spectrometrically in blood serum (Calcium AS III Arsenazo III colour test/Phosphorus (mono) ultraviolet (UV)-method kit, Greiner Diagnostic GmbH, Bahlingen am Kaiserstuhl, Germany). The concentrations of NƸ-trimethyllysine (TML), y-butyrobetaine (yBB), acetylcarnitine (ACA) and free carnitine (CA) were analysed in ethylenediamine tetraacetic acid (EDTA) plasma by a tandem mass spectrometry method according to Hirche et al. [17].

2.4. Clinical Examinations and Assessment of Health Status

Each cow was frequently clinically examined from 0.5 up to 72 h after calving according to the methods of Dirksen et al. [18]. To evaluate the collected clinical findings, a cumulative clinical score was created, in which the physiological level was defined as 0 and deviations with numbers increasing with severity (see Table A1, Appendix A). For example, a wet muzzle was regarded as physiological and received the score of 0, while a score of 1 was assigned to a dry muzzle. Clinical variables which might differ into both directions from the physiological range were treated differently. For example, a score of 0 was assigned to the physiological range of heart rate (65 to 85 beats per minute, bpm) while a deviation in direction of bradycardia or tachycardia was scored with 1, 2 or 3. Finally, the individual scores were cumulated and related to the maximum possible score of 29. Thus, a score of 29 represented a cow which deviated at maximum from the physiological value for each individual clinical parameter while a score of 0 indicated a clinically inconspicuous cow.

2.5. Calculations

The fat-corrected milk (FCM) was calculated according to Gaines et al. [19]:
FCM (4% fat) (kg/d) = (milk fat (%) × 0.15 + 0.4) × milk yield (kg/d)
Energy-corrected milk (ECM), milk energy, net energy requirement for maintenance (NEM) and net energy requirement for lactation (NEL) were calculated according to the Society of Nutrition Physiology (GfE) [11]:
ECM   ( kg / d ) = milk   yield   ( kg / d ) × 1.05 + 0.38 m i l k   f a t   ( % ) + 0.21 m i l k   p r o t e i n   ( % ) 3.28
Milk energy (MJ NEL/kg) = 0.38 × milk fat (%) + 0.21 × milk protein (%) + 0.95
NEM (MJ NEL/d) = 0.293 × BW0.75 (kg)
NEL (MJ NEL/d) = (milk energy (MJ NEL/kg) + 0.086) × milk yield (kg/d)
Net energy balance (NEB) was calculated by using the following equation:
NEB (MJ NEL/d) = total NEL intake (MJ NEL/d) − (NEM (MJ NEL/d) + NEL (MJ NEL/d))
Gestational requirements were taken into account by addition of 13 MJ NEL/d for week six up to week 3 ap and of 18 MJ NEL/d for the last 3 weeks ap.
According to Hurley et al. [20], the feed efficiency (FE) corresponds to the ratio of ECM and dry matter intake (DMI) (kg) and the residual energy intake (REI) was calculated by using the following formula:
REI (MJ NEL/d) = Total NEL intake (MJ NEL) − expected energy intake (EEI) (MJ NEL).
To calculate the EEI, a non-linear regression model was used, whereby significant variables and related coefficients were determined:
EEI (MJ NEL/d) = −95.98 + 6.09 × milk yield − 0.06 × milk yield2 + 17.61 × week of lactation − 1.96 × week of lactation2 + 0.07 × week of lactation3 + 0.08 × body weight.
The Revised Quantitative Insulin Sensitivity Check Index (RQUICKI) was calculated according to Caloni et al. [21]:
1 log I n s u l i n   [ µ U m l ] + l o g G l u c o s e [ m g d l ] + l o g N E F A [ m m o l l ]
Anion gap was calculated by using following equation according to Brouwer et al. [22]:
(Na+) − ((HCO3) + (Cl))
The mass of SAT, RAT, OAT and MAT was calculated according to Raschka et al. [15] in consideration of different anatomic locations for ultra-sonographic measurements: twelfth rib at the level of the greater trochanter (R12), centre of paralumbar fossa from skin to peritoneum (AW3c), intertransverse space cranial to lumbar, intertransverse space where caudal pole of kidney is visible from skin to kidney margin away from transducer (KD3b), back fat thickness (BFT), centre of paralumbar fossa from skin to muscle margin away from transducer (AW3b), point of interception of a vertical line through the last lumbar vertebra and a horizontal line through the greater trochanter from skin to muscle margin away from transducer (AW1b), intertransverse space cranial to lumbar intertransverse space where caudal pole of kidney is visible from skin to peritoneum (KD2c).
SAT (kg) = −6.66 + 0.72 × R12 + 0.31 × AW3c,
RAT (kg) = −9.55 + 0.62 × R12 + 0.06 × KD3b,
OAT (kg) = −2.32 + 0.55 × BFT + 0.37 × AW3b and
MAT (kg) = −12.8 + 0.38 × AW1b + 1.73 × AW3b − 1.45 × AW3c + 0.07 × KD2c.
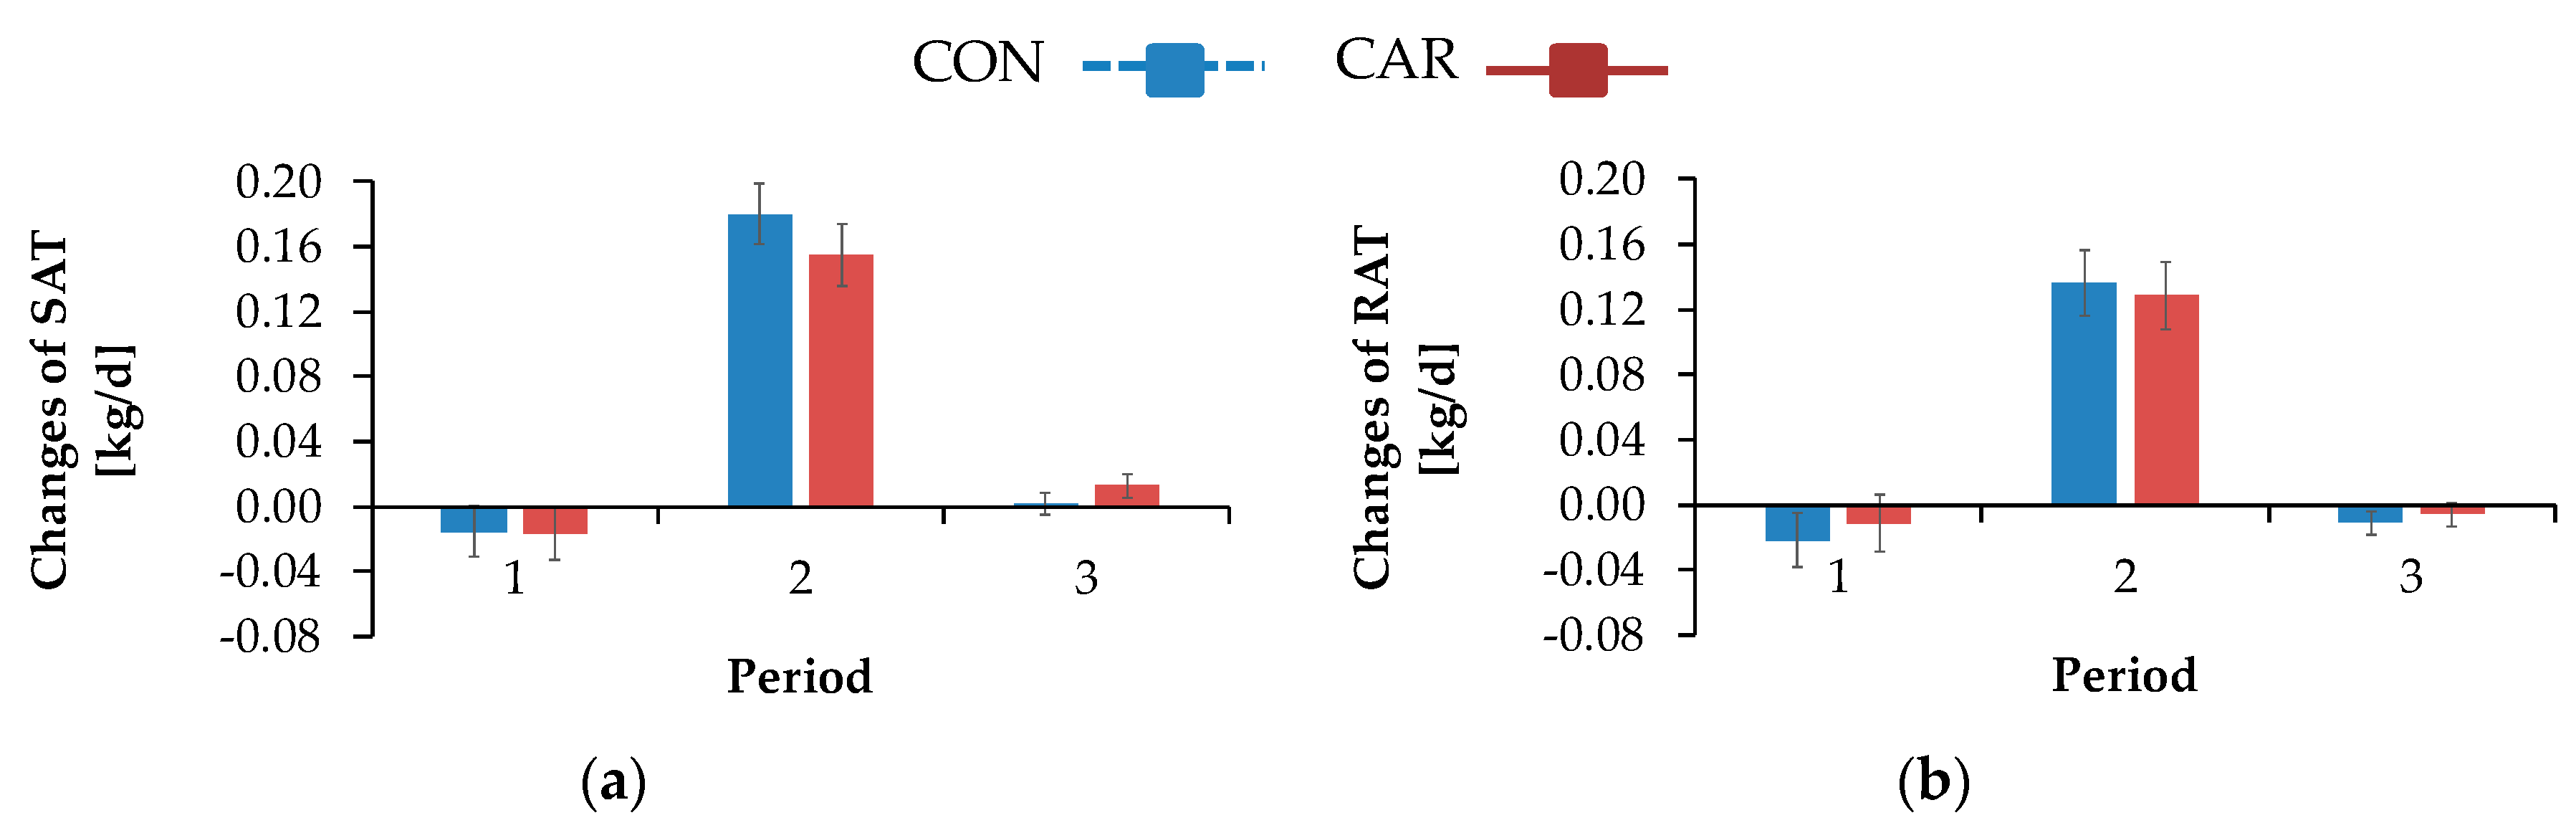
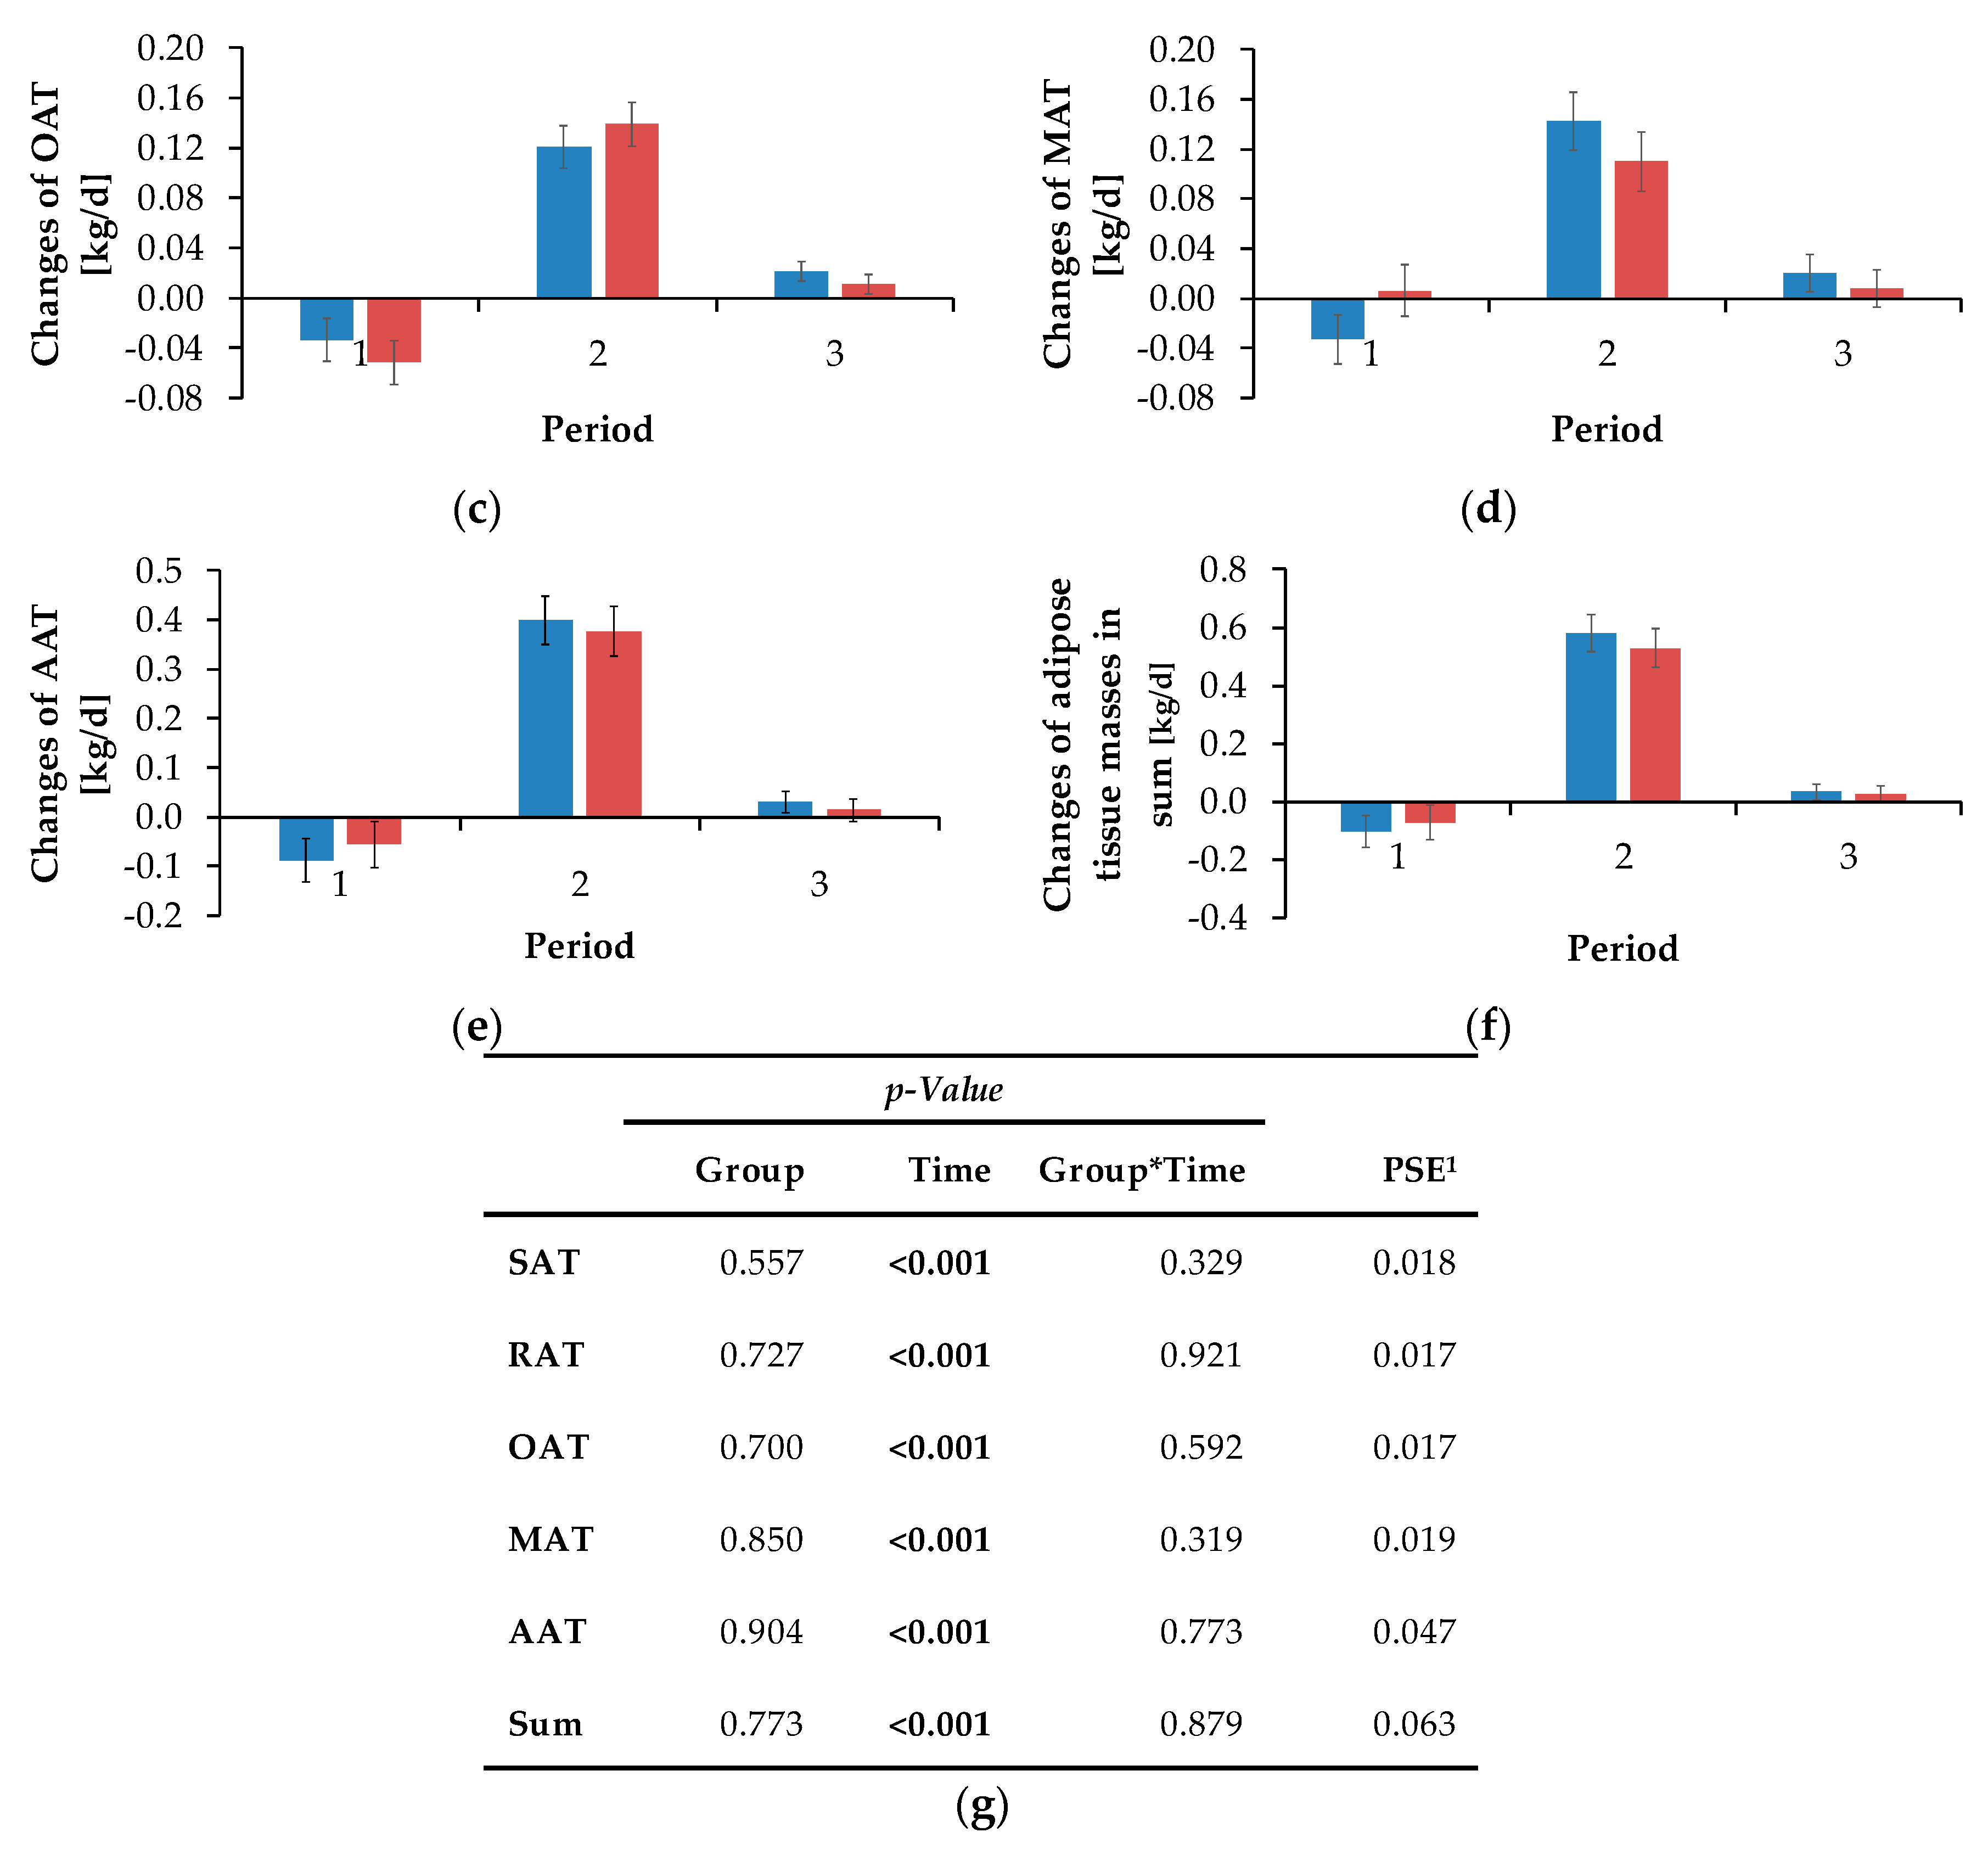
The sum of the masses of OAT, MAT and RAT results in the abdominal adipose tissue mass (AAT). Additionally, the changes in adipose tissue masses (FM (kg/d)) were calculated by the differences between the different time points, whereby negative values indicated a gain and positive values indicated a reduction of masses in the particular localisation. The corresponding release of energy (considering that 1 g fat results in 39.8 kJ gross energy [23], whereby 16% of them is lost as heat [24]) was calculated as follows:
Release   of   energy   [ MJ / d ] = F M   [ k g d ] × 39.8 [ k J k g ] × 0.84 1000 .

2.6. Statistical Analyses

Before statistical analyses were carried out, weekly mean values were calculated for performance and feeding data. Analyses were performed using the MIXED procedure of SAS software (SAS Enterprise Guide 6.1, SAS Institute Inc., Cary, NC, USA) with the restricted maximum likelihood method (reml). The model included the group (G, CON or CAR), the time (T) and the interaction between G and T as fixed factors. For blood variables, the values of day 42 ap were considered as covariables. The choice of covariance structure (compound symmetry, autoregressive or unstructured) for the respective parameter were based on the smallest Akaike information criterion for a finite sample size (AICC). Effects were assumed as significant when p-values were equal or smaller than 0.05. Least Squares (LS) Mean comparisons were carried out with the Tukey–Kramer test.
The relationships between REI and NEB, NEB and energy release from adipose tissue were evaluated by linear regressions for each experimental group. Additionally, linear regressions for the relationship between REI and NEB for cows in negative NEB and positive NEB (independent of treatment groups) were carried out and slopes were compared. All results are given as LS Means and additionally, the standard deviation is listed in the text. In tables and figures, the pooled standard error (PSE) of LS Means over both groups and all time points is indicated.

3. Results

Initially, CON included 30 cows and CAR only 29 cows, because of one non-pregnant cow. In total, five cows left the experiment before day 110 pp due to health problems. In CON, one cow had to be excluded in the first week of lactation because of a displaced abomasum with perforation. During the second week of lactation, two cows from CAR left due to high-grade lameness and atypical recumbency, respectively. In CON, one cow developed pneumonia, fatty liver, pyometra and a proliferative glomerulonephritis struck due to an impairment of general health status in week 8 of lactation, and a second cow in this group had to be excluded in week 8 of lactation because of a teat injury. In total, 27 cows in CON and 27 cows in CAR finished the entire trial. Results, which are not presented in this section, are presented in Appendix A.

3.1. Feed Intake

Water intake decreased from week 6 ap until week 1 ap by 29% to the minimal level of 33 ± 2.64 kg/d (Table A2, Appendix A). Afterwards, it rose by 156% until week 5 pp to reach a level which remained unchanged until the end of trial (pT < 0.001). Also, for DMI, a time-dependent variation was found (pT < 0.001) (Figure 1a). It dropped by 25% from week 6 ap until week 1 ap. Afterwards, there was a continuous increase by 100% until week 5 pp. This level remained unchanged until the end of the experiment. The concentrate intake (Figure 1b) was differently affected by L-carnitine supplementation over time (pG*T = 0.041). From week 6 ap until week 2 ap, concentrate intake in CAR was on average 29% higher than in CON. Both groups reached the minimum level of 0.6 (CON)/0.8 (CAR) ± 0.12 kg/d in week 1 ap, which was not significantly different between both groups. In the following, there was a steep ascent until week 3 pp up to a 10 times higher level, which was kept until week 15 pp, whereby CON was 11% higher than CAR from week 5 until week 11 pp.

3.2. Milk, BW and BCS

Progression of milk yield (pG*T = 0.008), milk fat (pG*T = 0.043) and protein (pG*T < 0.001) was differently affected by L-carnitine supplementation over time. First, there was a slight increase in milk yield (Figure 1c). CON reached a first peak in week 6 pp, whereas this had occurred already in week 5 pp in CAR. Milk yield in CAR was on average 7% higher than in CON in the first 5 weeks pp. In the following, milk yields between both groups and between the time points were not significantly different.
Maximum milk fat content of 5.3% (CON)/5.8% (CAR) ± 0.19% was detected in week 1 of lactation (Figure 2a). In CON, it decreased by 18% from week 2 to week 3 of lactation, whereas milk fat in CAR began to fall from week 1 and decreased by 29% until week 3 of lactation to the same level as CON. Milk fat contents remained at this level for the rest of the experiment. Also, the highest level of milk protein (Figure 2a) occurred in week 1 of lactation. Initially, milk protein in CON reached 4.2% ± 0.05% and was therefore 7% higher than initial level of CAR (4.0% ± 0.05%). Until week 3 of lactation, there was a decrease by 25% in CON and 20% in CAR. Afterwards, both groups reached the same level and there were no differences until the end of the trial. For all other analysed milk ingredients, a typical time-dependent variation was found (pT < 0.001) which was, however, independent of treatment. The fat-protein ratio (Figure 2b) increased from week 1 to week 2 of lactation. Afterwards, it dropped with some fluctuations by 22% until week 9 of lactation. Thereafter, this level was kept constant until the end of the experiment. From week 1 until week 5 of lactation, milk lactose rose by 9% and stayed at this level for the rest of the trial (Table A3, Appendix A). Milk urea (Table A3, Appendix A) dropped from week 1 until week 3 of lactation by 41% and did not change further until the last week of the experiment. Until week 6 of lactation, there was a continuous decline of SCC and it remained unaltered for the rest of the experiment. The FCM (Table A3, Appendix A) was differently affected by L-carnitine supplementation over time (pG*T < 0.05). There was an increase in FCM by 32% in CON and 11% in CAR from week 1 until week 2 of lactation, whereby FCM in CAR was on average 8% higher than in CON during the first 6 weeks of lactation. Thereafter, the treatment groups differed only slightly. The ECM (Figure 1d) changed in the same manner. Also, BW and BCS (Table A3, Appendix A) differed independently of the supplementation but were affected by the time relative to parturition (pT < 0.001).
The BW showed a continuous increase and reached a peak 2 weeks ap. There was a sharp decline from week 1 ap until week 1 pp by 17%. This level was then maintained until the end of the trial. The BCS followed a similar time course.

3.3. Energy Metabolism

The NEL (Table A2, Appendix A) was differently affected by L-carnitine supplementation over time (pG*T = 0.045). The initial level of NEL in CAR was 22% higher than in CON. It increased in CON by 33% and in CAR by 15% until week 4 pp. This level remained unchanged until the end of the trial. Total NEL intake (Figure 3b) decreased from week 6 ap until week 1 ap by 24% to the minimum level of 68 ± 2.4 MJ, which was followed by a continuous increase until week 14 pp to the maximum level of 163 ± 3.7 MJ. This level remained unchanged until the end of the experimental time (pT < 0.001). Also, for NEB, a time-dependent variation was found (pT < 0.001) (Figure 3a). The initial level of NEB rose by 48% to the maximum level of 39.1 ± 3.04 MJ NEL/d until 5 weeks ap. In the following, there was a continuous decline. NEB decreased further with a sharp decline from 1-week ap until week 1 pp to −52.4 ± 3.67 MJ NEL/d. At this point, NEB reached a negative value for the first time and at once, the lowest level. Afterwards, there was an irregular ascent and the cows started to enter a positive NEB from week 13 pp onwards. In week 13 pp, NEB was 97 times lower than in week 6 ap. As NEB increased, the energy released from mobilised adipose tissue decreased in a more or less pronounced linear fashion (Figure 3c). In CON, 0.15 MJ were mobilised from adipose tissue per 1 MJ NEB, while a steeper increase of 0.40 MJ per MJ NEB was estimated for cows in CAR. Statistically, the slopes were not significantly different (p > 0.05) between both groups. The FE (Table A2, Appendix A) was differently affected by the supplementation over time (pG*T = 0.045). The initial level of FE was 5% higher than in CON. In CAR, FE decreased continuously by 32% until week 4 of lactation, whereby FE in CON decreased more slowly than in CAR and only by 15% until week 4 of lactation. From 2 weeks until 4 weeks of lactation, FE in CON was on average 17% higher than in CAR. In week 5 of lactation, both groups reached the same level, which remained unchanged up to the end of the experiment. The initial level of REI (Table A2, Appendix A) was −0.9 ± 2.48 MJ NEL/d, and a minimum level of −2.9 ± 2.94 MJ NEL/d was reached in week 6 pp. In the following, there were no significant deviations, but the highest value of 7.5 ± 2.77 MJ NEL/d occurred in week 14 pp. This level remained unchanged until the end of the trial (pT < 0.001).
The feeding group-dependent regressions over the whole range of REI and NEB did not suggest treatment differences (Figure 3d). To answer the question of whether mobilising cows displaying a negative NEB differ in efficiency compared to those with a positive NEB, cows were regrouped according to negative or positive NEB. These NEB-dependent regressions of REI (x) on NEB (y) did not reveal significantly different slopes (ynegative = 0.56x − 21.85, r2 = 0.326; ypositive = 0.51x + 5.03, r2 = 0.325). Therefore, all data were merged to one regression. An increase in REI by 1 MJ was associated with an increase of the NEB by 0.86 MJ, independently of the L-carnitine supplementation (y = 0.86x − 14.23, r2 = 0.545).

3.4. Clinical Findings and Clinical Cumulative Score

Depending on the time after calving (pT < 0.001), there was a steep increase of respiratory rate by 19% from 0.5 h until 1 h pp, where the maximum value of 50.7 ± 1.640 breaths/min was reached (Figure 4a). In the following, it decreased to a value which was 26% lower than the initial level until 72 h pp. Independently of treatments, the highest heart rate was detected at 0.5 h pp and decreased thereafter until 3 h pp (Figure 4b). Afterwards, heart rate increased within 6 h to a level which was only 4% lower than the initial rate. A continuous decrease followed until 72 h pp (pT < 0.001). Primary rumen contractions (Figure 4c) reached the lowest level of 0.5 ± 0.15 numbers/2 min at 1 h pp. Until 72 h pp, there was a continuous enhancement to a level being 4 times higher than the initial level. The rectal temperature (Figure 4d) was differently affected by L-carnitine supplementation over time (pG*T = 0.041). While rectal temperature in CON decreased continuously by 2% until 9 h pp, in CAR, it increased from 0.5 h until 1 h pp by 1% to a maximum level of 39.1 ± 0.10 °C, and decreased afterwards slightly until 12 h pp and finally increased again until 72 h pp. In CON, another decrease in the period from 9 h until 72 h pp was observed. Cumulative clinical score (Figure 5) reached a peak level after an increase by 16% from 0.5 h until 1 h pp. Subsequently, it dropped by 48% until 12 h pp. Afterwards, the score remained unchanged (pT < 0.001).

3.5. Blood Parameters

3.5.1. Carnitine

Irrespective of treatment groups, the concentration of TML (Figure 6a) increased by 29% from day 42 ap until day 3 ap, decreased slightly until 0.5 h pp, and this level remained unchanged until 72 h pp. Afterwards, TML concentration dropped by 18% until 100 days pp (pT < 0.001). The concentration of yBB (Figure 6b) was affected by L-carnitine supplementation over time (pG*T < 0.001) and mean of yBB concentration was on average 15 times smaller in CON than in CAR, whereby the initial level of both groups was the same. In CON, there were no significant differences between the different time points. Until 14 d ap, there was a steep increase in CAR to a level which was 20 times higher than the initial level. Afterwards, there was a decrease until 0.5 h pp and this level persisted until 9 h pp. Until 48 h pp, the concentration of yBB increased by 90% and decreased in the following until 72 h pp. Dependent on treatments (pG*T < 0.001), the mean of the ACA concentration (Figure 6c) was 6 times higher in CAR in comparison to CON, whereby for both groups, there was no significant difference between the initial level. The level of ACA concentration in CON did not alter during the whole trial. In CAR, the concentration of ACA increased to 12 times higher than the initial level until 0.5 h pp. In the following, it dropped until 12 h pp and then rose to the highest level of 17.63 ± 0.777 μM until 48 h pp. Afterwards, there was another decrease until day 110 pp to a level which was only 4 times higher than the initial level. Also, the CA concentration (Figure 6d) was differently affected by L-carnitine supplementation over time (pG*T < 0.001). The initial level of the concentration of CA was the same in both groups, whereas the mean of CAR was on average 6 times higher than in CON. The concentration of CA level in CON was unchanged over the whole experiment. In CAR, CA concentration rose by 8 times until 14 d ap to decrease afterwards by 56% until 0.5 h pp. Thereafter, it dropped further by 36% until 72 h pp followed by a slight increase until day 110 pp.

3.5.2. Serum Parameters with Relevance for Energy Metabolism

Regardless of treatment, the concentration of NEFA (Figure 7a) reached a peak of 0.87 ± 0.032 mmol/L at 0.5 h pp, which was more than 5 times higher than the initial value. Afterwards, a continuous decrease was noticed, and the initial level was reached again at day 110 pp (pT < 0.001). Also, irrespective of treatment, there was a steady increase of BHB concentration (Figure 7b) until 72 h pp, where the maximum level of 1.39 ± 0.071 mmol/L was reached. This was followed by a decrease from day 7 until day 14 pp down to the initial levels (pT < 0.001). The concentrations of TG (Figure 7c) were differently affected by the supplementation over time (pG*T = 0.003). CON and CAR started with comparable concentrations of TG contents in blood, which decreased until 0.5 h pp to a nadir. The concentrations of TG in CAR were on average 34% higher than in CON at days 3 and 1 ap, whereby these differences reached significance at day 1 ap. Subsequently, the low levels persisted up to the end of the trial.
The concentration of lactate (Table A4, Appendix A) remained unchanged at the first time points and increased from 1-day ap until 1 h pp to the maximum level of 1.09 ± 0.055 mmol/L, which was 2 times higher than the initial level. In the following, it dropped to the initial level again until day 14 pp and this level was kept constant until the end of the trial (pT < 0.001). For glucose concentration (Table A4, Appendix A), a time-dependent variation was found (pT < 0.001), its level remained unchanged during the last weeks of gestation and began to increase up to 3 days ap. At 2 h pp, glucose concentration reached the maximum level at 7.75 ± 0.136 mmol/L, which was over 2 times higher than the initial level. Afterwards, it dropped and reached the initial level again at 6 h pp. This level was kept until the end of the trial. No impact of the supplementation on insulin concentration (Table A4, Appendix A) was found. There was a steep increase of insulin concentration by 62% from the initial level until day 14 ap to a maximum value of 143.83 ± 9.339 pmol/L. Afterwards, there was a sharp decline. The minimum was reached 1 h pp and was 78% lower than the initial level of insulin concentration. At 4 h pp, a second peak occurred, at 72 h pp, there was another decrease and on day 110 pp, the initial level was reached again (pT < 0.001). The RQUICKI (Table A4, Appendix A) varied only slightly over time (pT < 0.001). There was a slow decline by 20% until 4 h pp, which was followed by a steady increase to maximum value at day 110 pp, which was 14% higher than the initial level.

3.5.3. Electrolytes

Data for electrolytes are presented in the Appendix A in Table A5. The initial blood sodium ion concentration increased by 2% from day 42 ap until day 1 ap, when the highest level occurred. Until 2 h pp, there was a decrease, whereby the initial level was reached again, and this level remained unchanged thereafter (pT < 0.001). The Potassium ion concentration differed over time (pT < 0.001), it increased from 6 h pp until 24 h pp by 6% to a maximum level of 3.98 ± 0.058 mmol/L. Afterwards, the concentration of potassium ions dropped until 7 h pp, where a minimal value was noticed and this level was kept until the end of the experiment. Independently of treatments, chloride ion concentration increased by 4% from the initial level until 0.5 h pp. This level persisted until 12 h pp followed by a sharp decline from 24 h pp until day 7 pp by 6% (pT < 0.001). For hydrogen carbonate ion concentration in blood, a time-dependent variation was found (pT < 0.001). It remained unaltered until day 14 ap. From there on, a decrease by 11% lasting up to 0.5 h pp was found. This level was kept until 4 h pp, when hydrogen carbonate ion concentration started to rise continuously by 17% until day 110 pp. The anion gap (pT < 0.001) was unchanged at the first time points and increased by 32% from 48 h pp until 7 days pp. This level was kept constant and was followed by a decrease by 25% from day 2 pp until day 56 pp, where a minimum level of 8.32 ± 0.396 mmol/L was reached and persisted until the end of the trial.

3.5.4. Calcium and Phosphorus

Data concerning concentrations of calcium and phosphorus are presented in the Appendix A in Table A6. Irrespective of treatment groups, calcium ion concentration was unchanged during the last weeks of pregnancy. From day 1 ap until 0.5 h pp there was a decrease by 15%, which was followed by a continuous increase to a maximum level of 1.29 ± 0.041 mmol/L at day 21 pp. This level was kept stable until the end of experiment (pT < 0.001). Depending on time relative to parturition (pT < 0.001), there was a steep increase by 8% for total calcium concentration from day 42 ap until day 14 ap. From day 7 ap until 1 h pp, it dropped by 19% and this level was kept constant until 2 h pp. From 3 h pp onwards until day 110 pp, the total calcium concentration increased to the maximum level. The mean of the ratio between calcium ions and total calcium concentration amounted to 0.59 irrespective of time and treatment. Total phosphorus concentration increased up to day 3 ap up to a maximum level of 1.79 ± 0.054 mmol/L. This was followed by a sharp decline by 45% to a minimum value at 0.5 h pp. This level was kept constant for a period of over 5 hours. Thereafter, a moderate increase from 6 h pp until day 110 pp was noticed (pT < 0.001). The ratio of total calcium to total phosphorus concentration was influenced by the time relative to parturition (pT < 0.001) and remained unchanged until day 3 ap. From this time point until 0.5 h pp, an increase by 69% to a maximum was found. Afterwards, the ratio dropped continuously to the initial level at day 110 pp.

3.5.5. Blood Gas Analyses

Data for blood gas analyses are presented in the Appendix A in Table A7 and for all of them, time-dependent variations were detected (pT < 0.001). Independently of treatment groups, TpO2 and sO2 increased from the initial levels until 1 h pp by 46% and 23% respectively, and dropped afterwards to a level which was slightly smaller than the initial one until day 110 pp. The TpCO2 remained unchanged until shortly after parturition. From 72 h pp until day 14 pp, there was an increase by 9% to a maximum level that did not change until the end of the trial. The concentration of total carbon dioxide dropped by 9% from the initial level until 1 h pp to the minimum level of 27.77 ± 0.519 mmol/L. Afterwards, there was a continuous increase until day 110 pp to a peak level, which was 9% lower than the initial level. Temperature-corrected pH remained on the same level until 14 days ap. In the following, it dropped until 2 h pp, where a nadir occurred. Afterwards, there was an increase by 1% to the maximum level of 7.72 ± 0.005, which was reached on day 110 pp. BE and Beecf decreased from day 14 ap until 1 h pp by 79% and 69% respectively, and rose thereafter until day 110 pp to a level which was 8 and 4 times higher respectively, than the initial level.

3.6. Ultrasonography

Irrespective of treatments, the adipose tissue masses (SAT, RAT, OAT, MAT, AAT) increased from day 42 ap up to 3 days pp, where all of them reached their maximum level (Table A8, Appendix A). After that, there was a decrease until day 42 pp and this level stayed constant until day 100 pp. The changes of adipose tissue masses in each localisation (SAT, RAT, OAT, MAT, AAT (Figure 8)) from day 42 ap until day 3 pp were in a slightly negative range. From day 3 pp until day 42 pp, the changes of adipose tissue masses reached positive and maximum values without exception. In the following (from day 42 pp until day 100 pp), the changes decreased but remained in a slightly positive range, whereby the changes of RAT reached a negative value again (pT < 0.001). The daily energy release (Table A8, Appendix A) behaved in the same manner.

4. Discussion

The aim of the present study was to investigate the hypothesis that L-carnitine supplementation improves the energy status of the cow around calving with consequences on the energy-consuming puerperium, including the recovery from calving and the magnitude of negative energy balance.
In doing so, clinical signs, milking performance, several indicators of energy metabolism including energy balance, adipose tissue dynamics, blood clinical-chemical traits and systemic carnitine levels, and electrolyte balance were evaluated with particular consideration of the first 72 h pp.
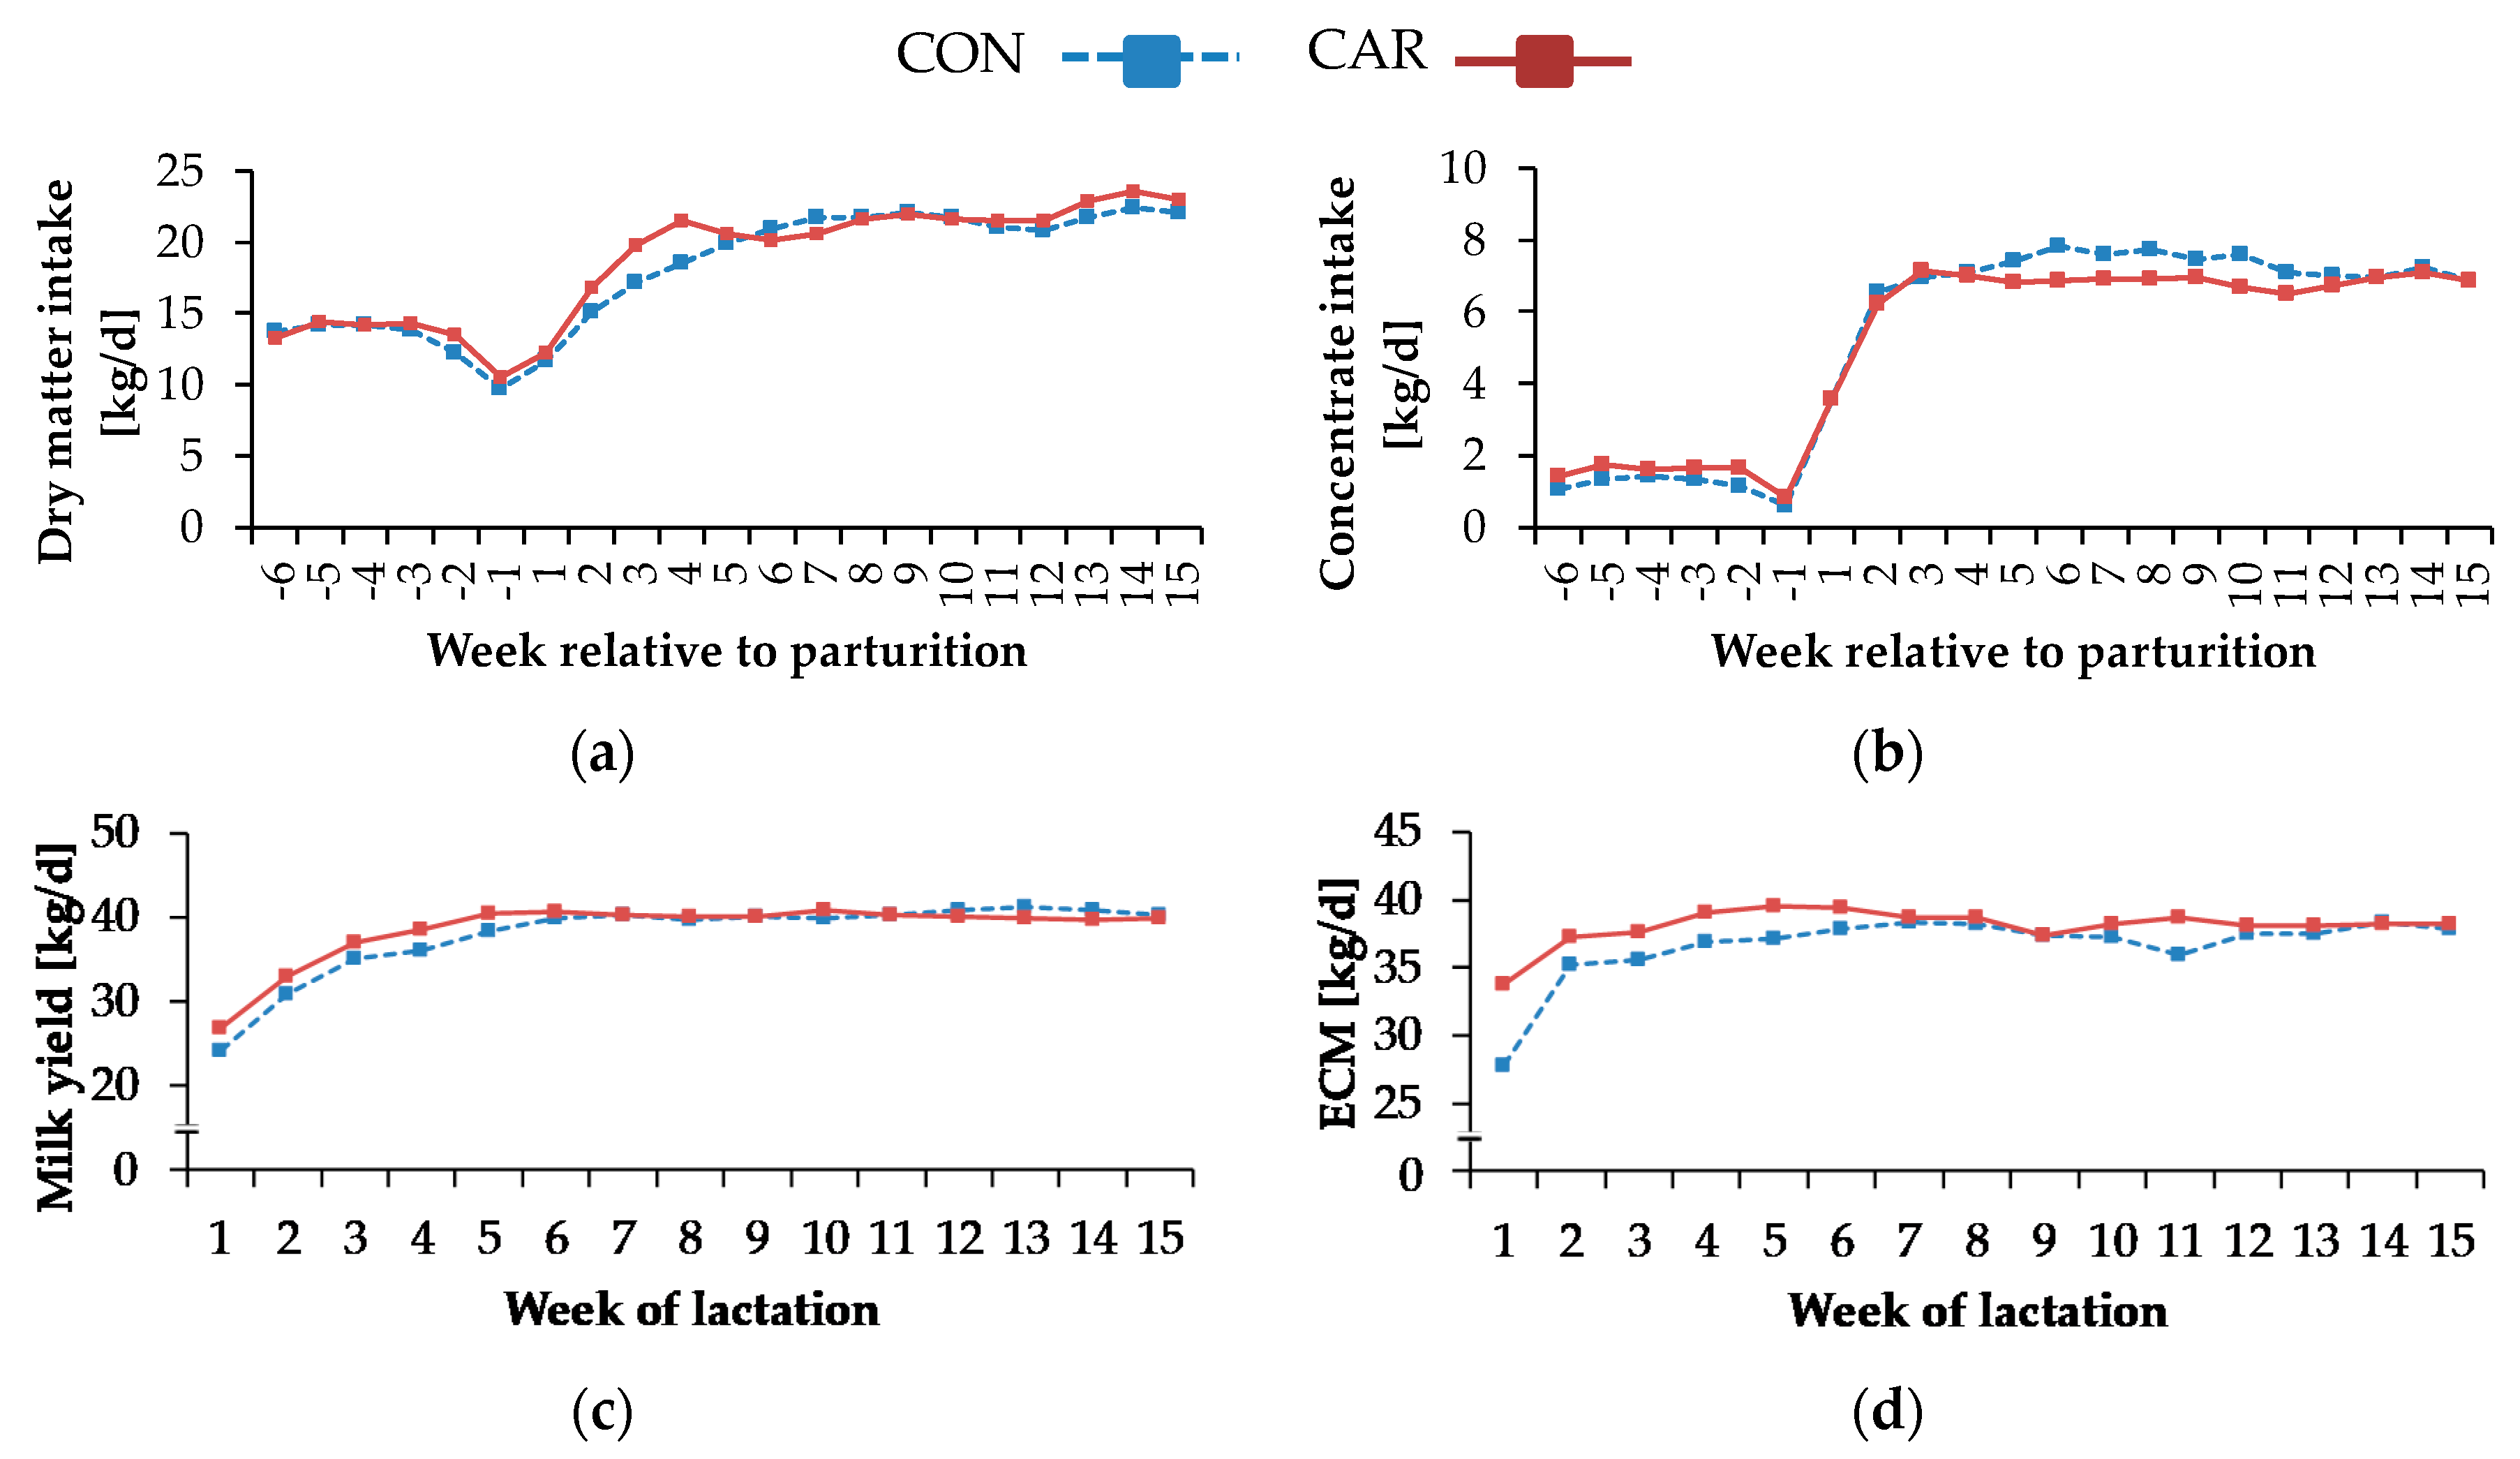
As rations were designed on an isoenergetic basis and DMI remained unaffected by the L-carnitine supplementation, the resulting NEL intake followed a similar pattern. Carlson et al. [6] reported that DMI did not differ between non-supplemented cows and cows receiving 6 or 50 g of non-rumen-protected L-carnitine per day, whereas at a dosage of 100 g dietary L-carnitine per day, DMI was lower during the first two weeks of lactation. Based on these findings and on the present results, we conclude that a moderate L-carnitine supplementation neither stimulates nor depresses feed intake of transition cows.
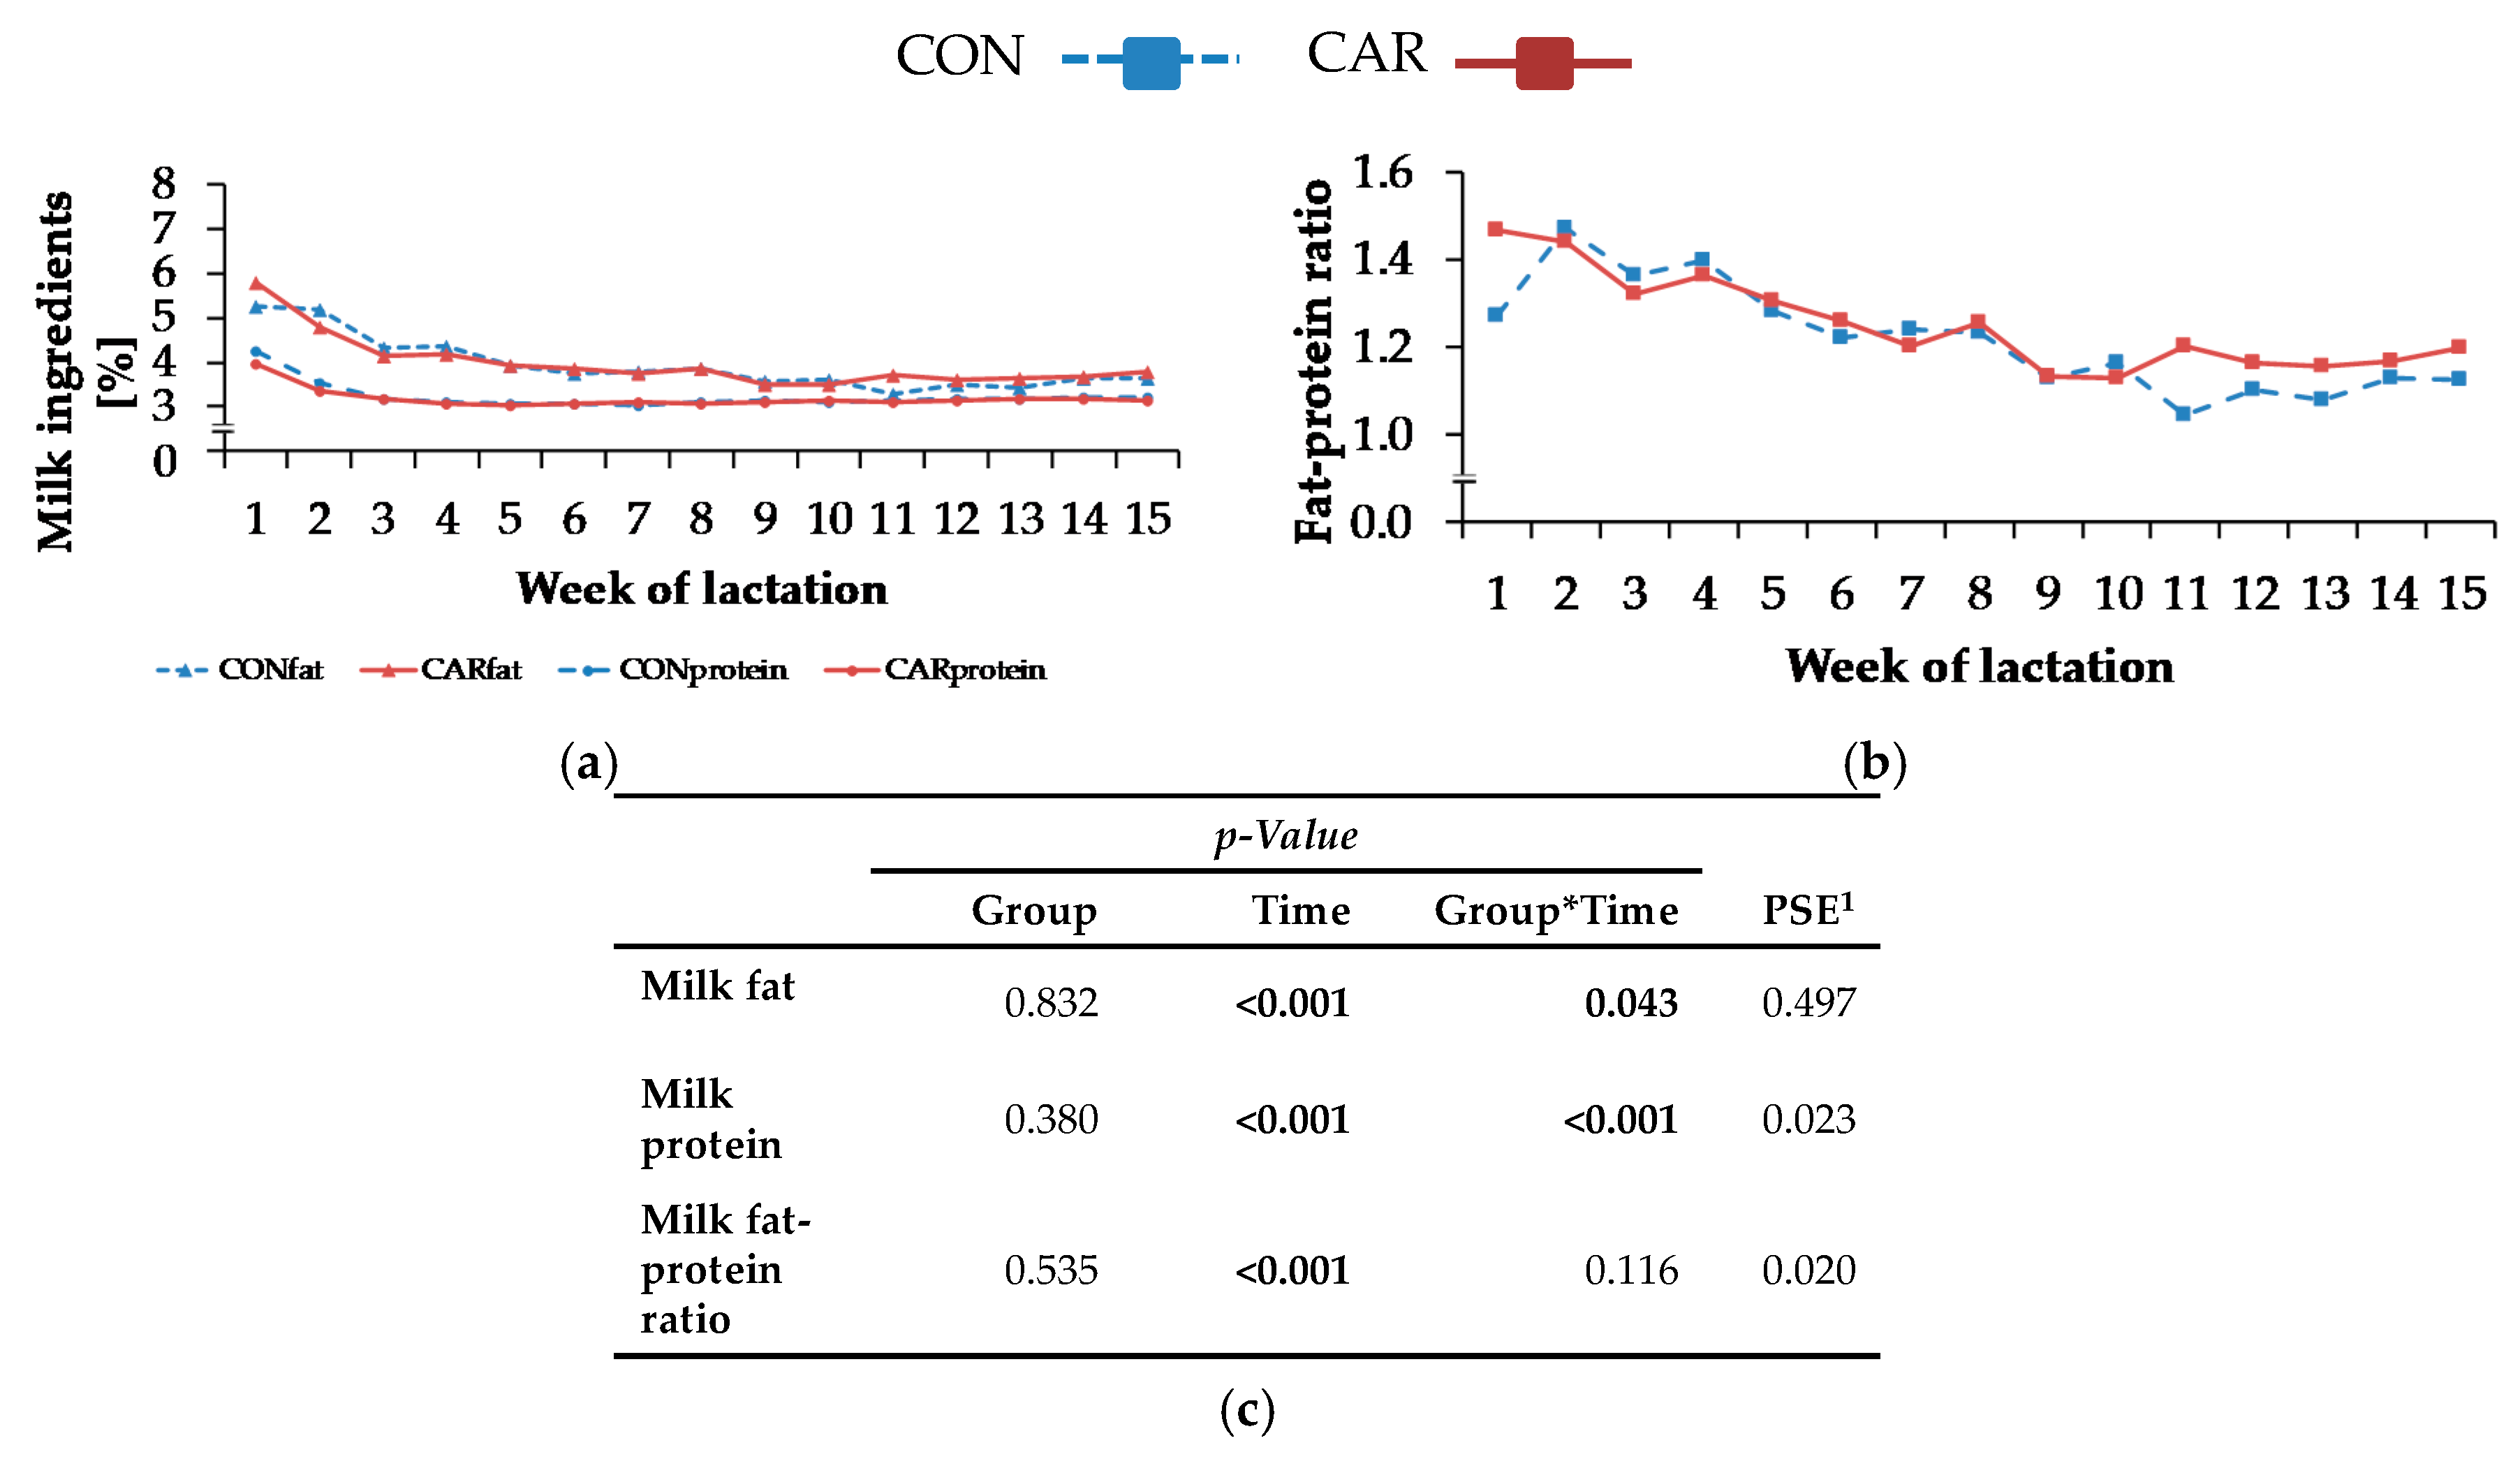
The REI represented the deviation of the EEI from total NEL intake, that could not be explained by the corresponding regression equation (Figure 3d). An individual positive REI represents a cow consuming more energy than expected and which is consequently less efficient compared to a cow showing a negative REI. As L-carnitine supplementation did not influence the REI, it might be concluded that energetic efficiency was not improved. Independent of dietary treatment, the NEB increased linearly and simultaneously with REI, suggesting the energetic efficiency to decrease with an increase in NEB. Here, cows in a negative NEB were as efficient as cows in a positive NEB, suggesting that efficiency during mobilisation is not different compared to periods of positive NEB. While the REI represented an estimate for the overall energetic efficiency, the contribution to the NEB by the energy mobilised from adipose tissues gave an indication for the energetic efficiency of lipomobilisation.
The reason for the initially higher milk energy of L-carnitine-supplemented cows might be the simultaneously increased milk fat at this time point, which in turn did not result from differences in various time intervals from first milk sampling to the colostrum phase. Furthermore, L-carnitine had no effect on NEB. The absence of an improved NEB in CAR during early lactation might have been caused by the increase of energy output in milk in this group and the simultaneously unchanged NEL intake. Carlson et al. [
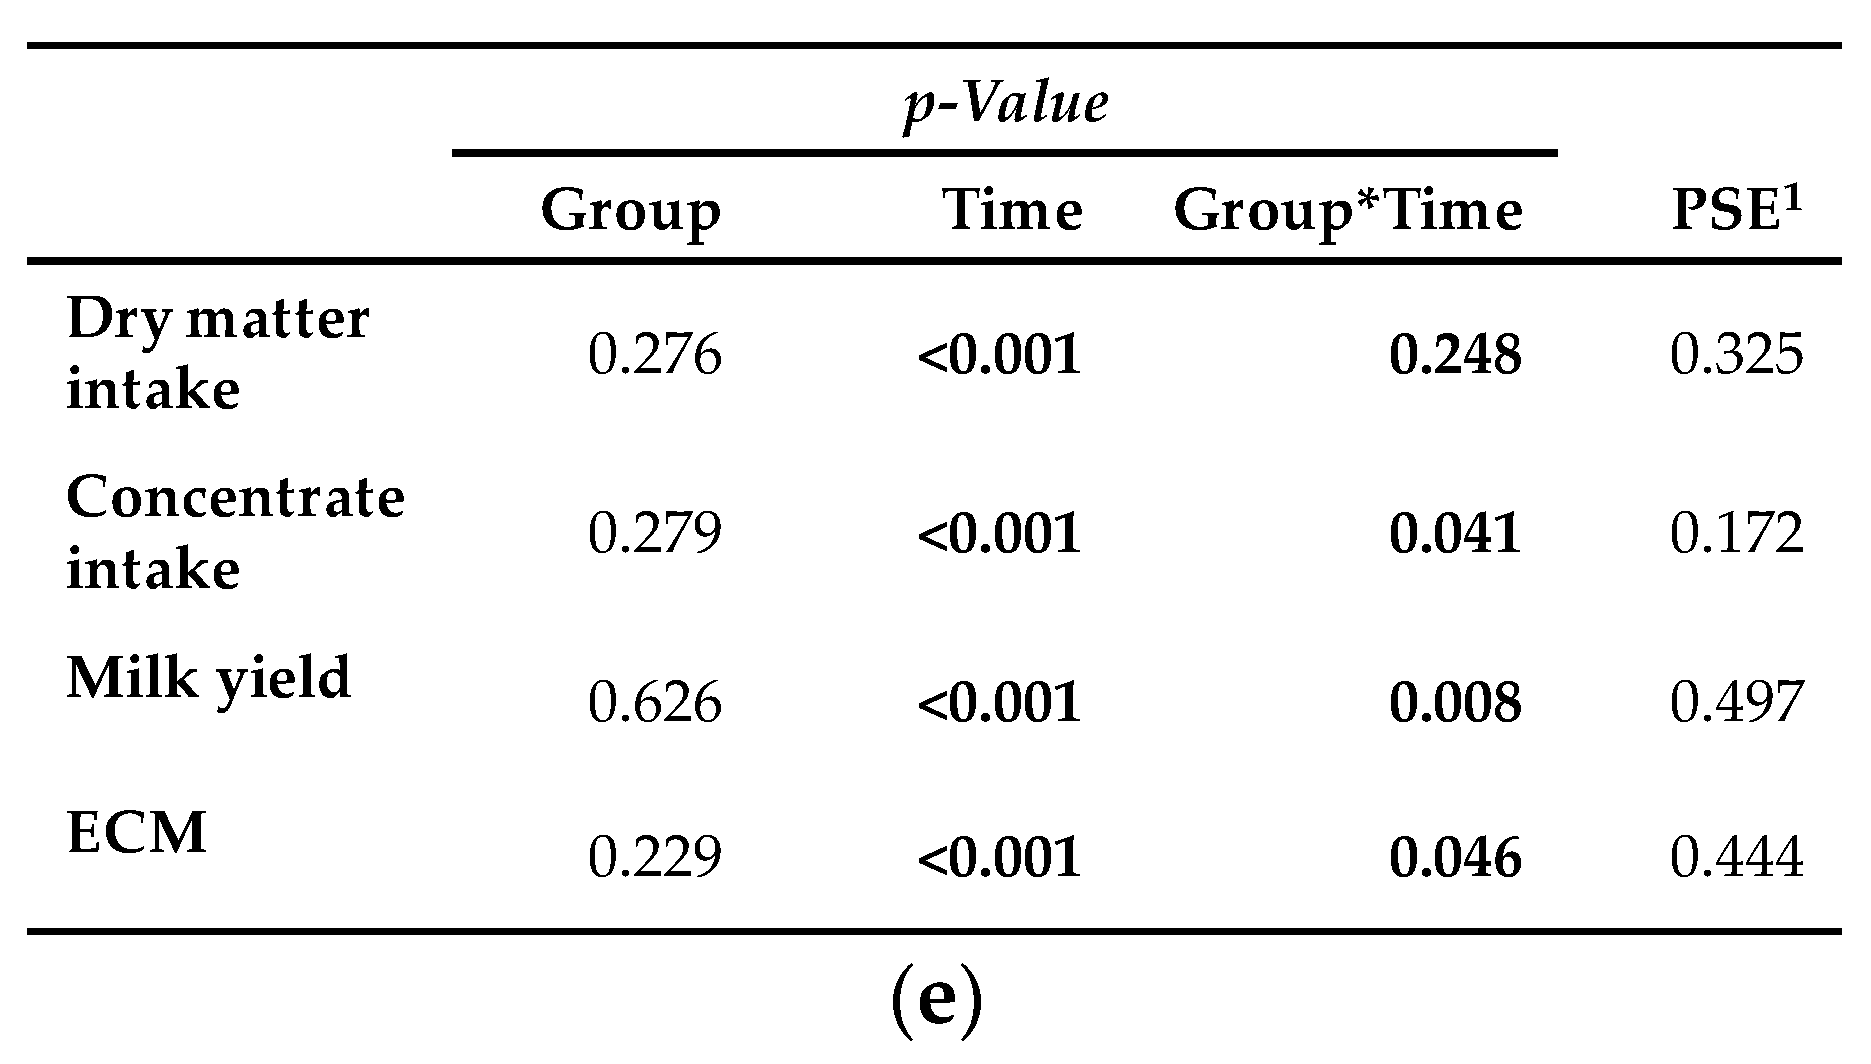
6] found lower milk yields in the first 6 weeks of lactation for cows supplemented with 100 g L-carnitine/d, which might be due to the lower DMI as discussed above, whereas a supplementation with 6 or 50 g/d had no impact on milk yield. In the present experiment, milk fat and protein were also differently affected by L-carnitine supplementation over time. Carlson et al. [6] detected higher milk fat concentrations in pluriparous Holstein cows, which received a top dress mixture with 50 or 100 g L-carnitine/d from day 14 ap until day 21 pp, and also, Pirestani et al. [7] reported the same effect in L-carnitine-supplemented pluriparous Holstein cows (50 g/d/cow). Higher serum TG concentrations in CAR ap, which were utilisable for milk fat synthesis, might be one possible explanation for higher milk fat percentages in the first week of lactation in CAR. According to Carlson et al. [5], L-carnitine-supplemented cows might have a higher capacity to oxidise NEFA to BHB, which represent precursors for milk fat synthesis.
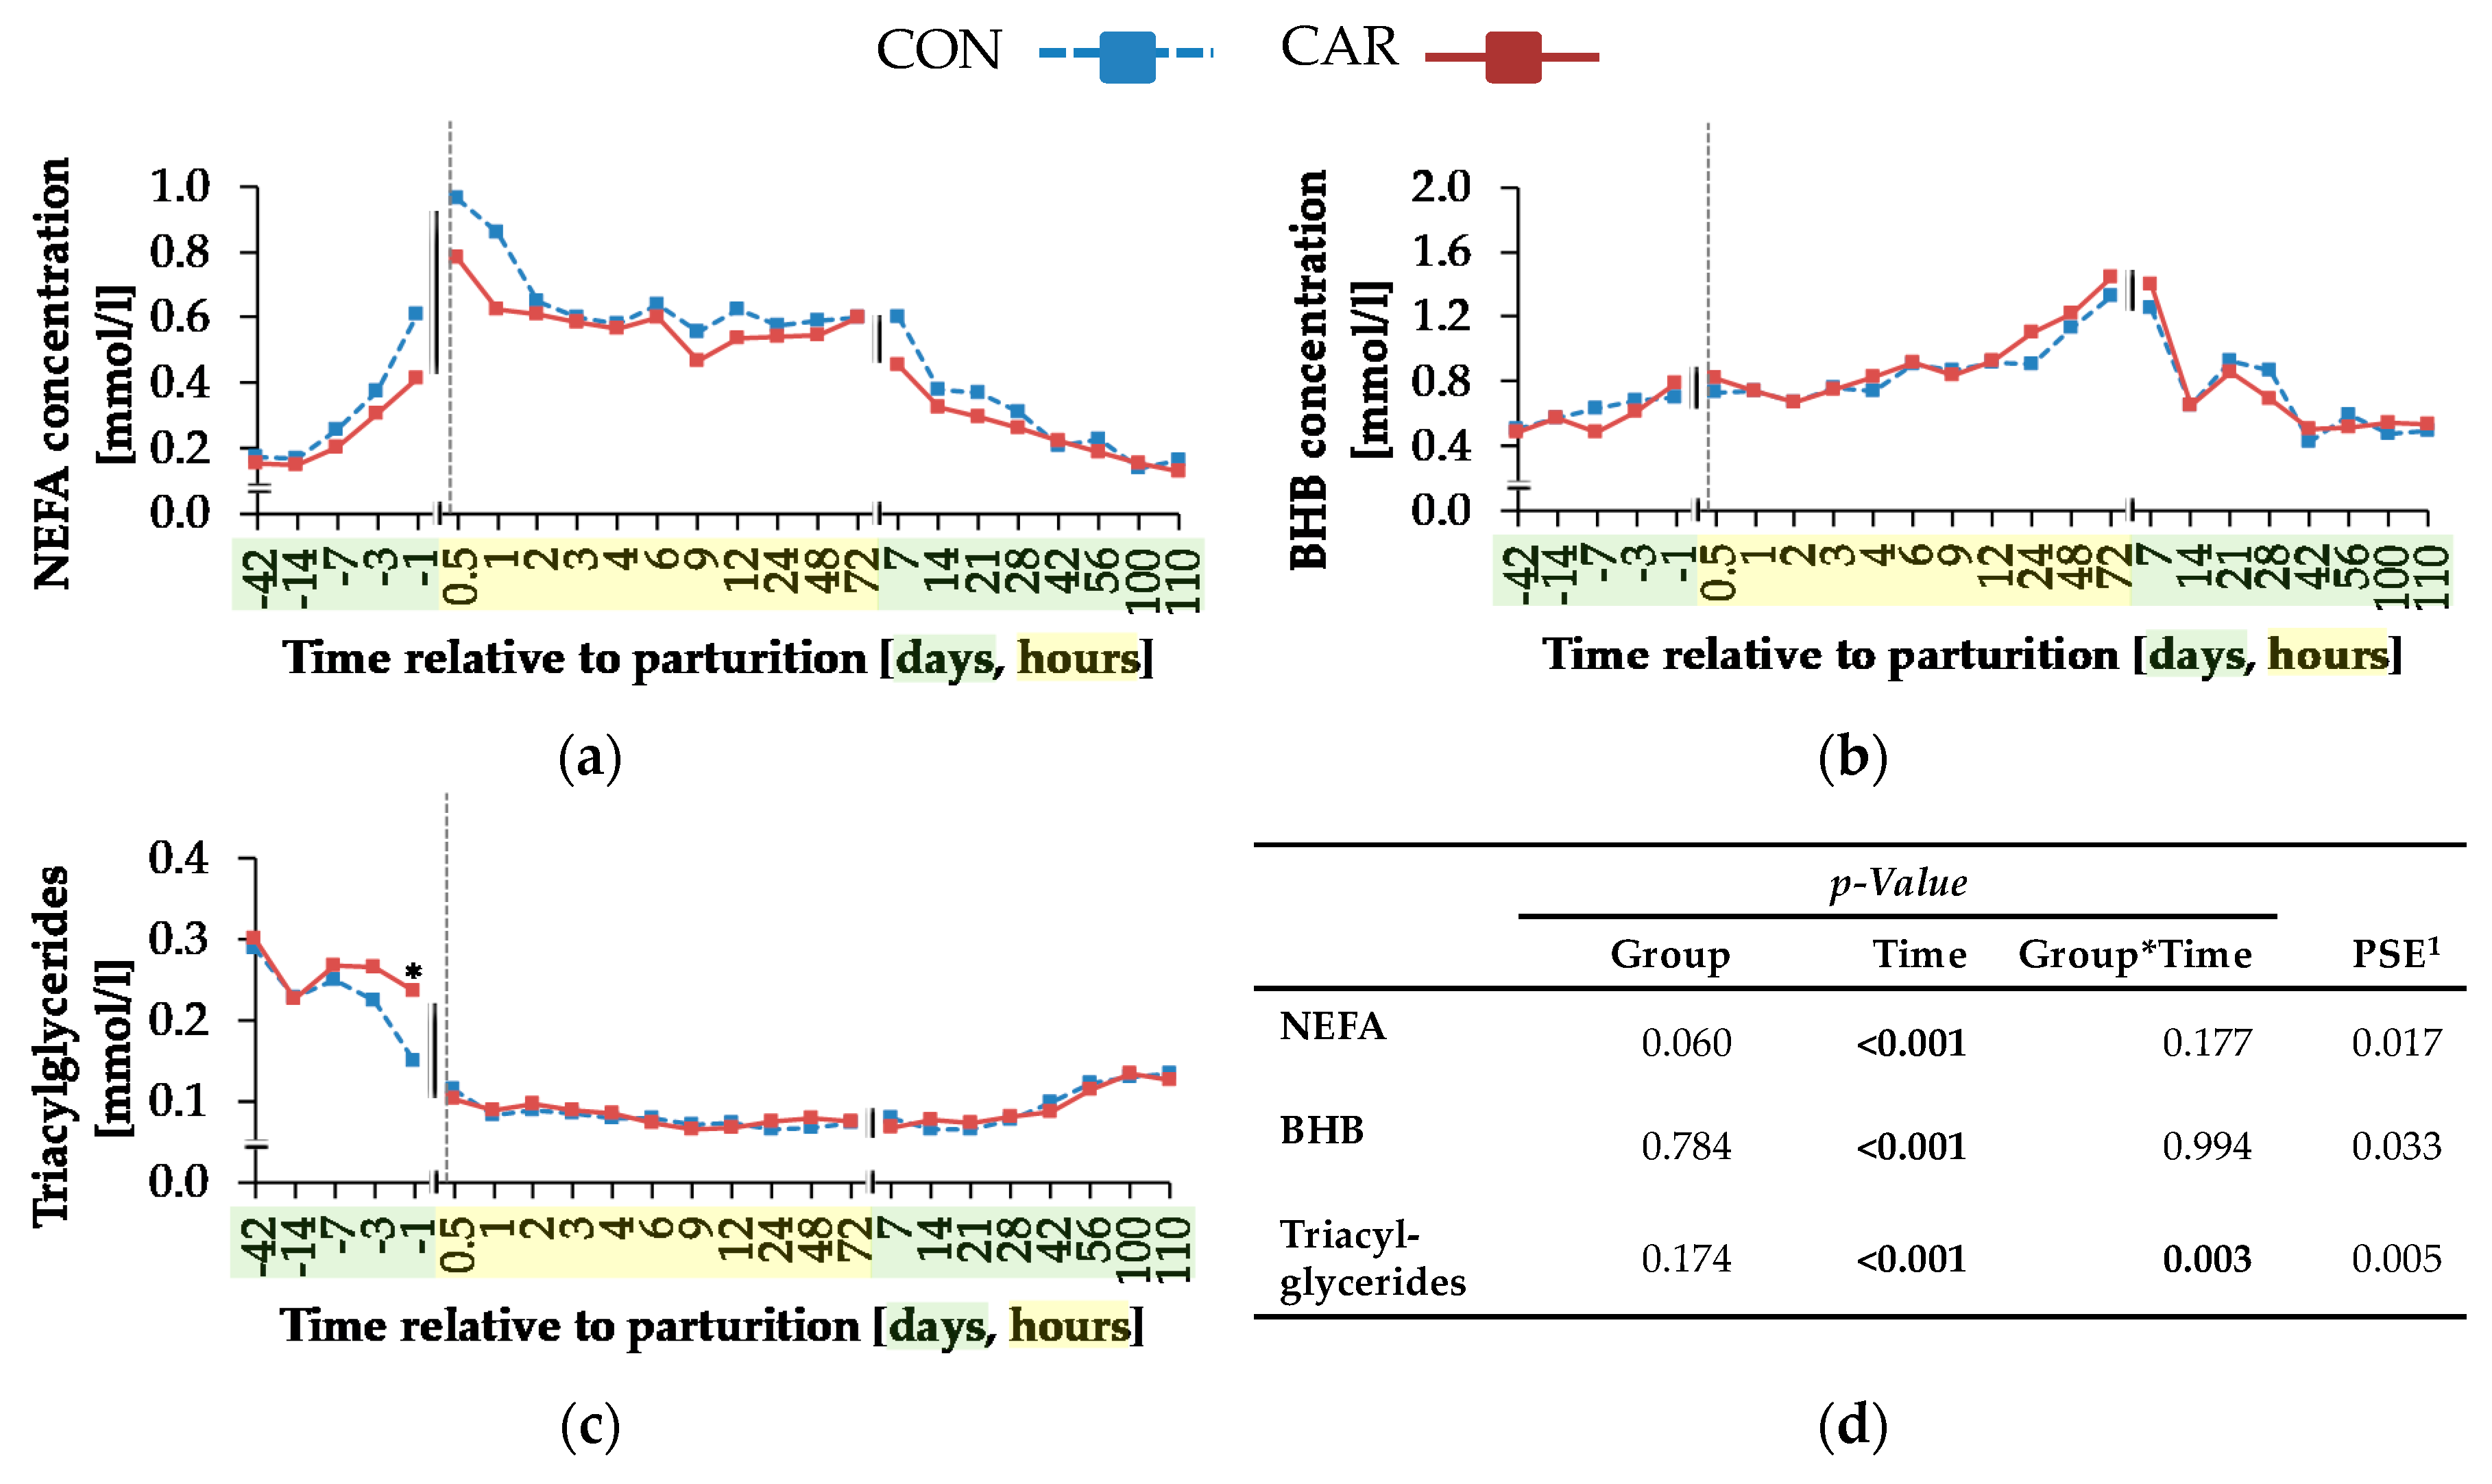
While NEFA and BHB concentrations were not influenced by L-carnitine, the concentrations of TG were significantly higher in L-carnitine-supplemented cows shortly before calving. The ultrasonographic evaluation of the dynamics of different adipose tissues confirmed the view that L-carnitine did not influence energy metabolism and thus lipomobilisation. Also, FPR was not affected by L-carnitine supplementation. According to Buttchereit et al. [25], FPR is an adequate indicator for NEB during early lactation. Therefore, the unaltered FPR further supports the lack of effects by L-carnitine on lipomobilisation. Carlson et al. [5] detected a decreased TG accumulation in liver and increased serum BHB concentrations in abomasal L-carnitine-infused (20 g L-carnitine/d) and feed-restricted cows by simultaneously unaltered NEFA concentrations in comparison to abomasal water-infused and feed-restricted cows. This L-carnitine supplementation was nearly equal to the dietary supplementation in the present experiment, in which 25 g L-carnitine per cow and day were available for intestinal absorption in consequence of using a rumen-protected L-carnitine product (80% of dietary carnitine would be degraded in the rumen [6]). The higher levels of TG concentration in serum in CAR in the present study might be a hint at the mentioned decreased TG accumulation in liver. Also, serum NEFA concentrations were unaffected, but no increase of the BHB concentration in L-carnitine-supplemented cows was observed in the present study. This controversial result might be due to the difference between the physiological progression of a negative energy balance during the period of transition in the present experiment and the induction of this by an abrupt feed restriction outside this period, as in the trial of Carlson et al. [5]. These results indicated that in dietary L-carnitine-supplemented periparturient cows, an increase of ketogenesis was not associated with putative simultaneously decreased TG accumulation in liver. Furthermore, Pirestani et al. [7] detected a higher BHB concentration in cows receiving a combination of L-carnitine (50 g/d) and choline (60 g/d). Carlson et al. [6] also found a decreased TG accumulation in liver of periparturient cows, which received 6, 50 or 100 g of a non-rumen-protected dietary L-carnitine product per day. The BHB concentration in blood was higher in the 50 and 100 g groups, while NEFA concentrations were unaffected by L-carnitine supplementation. Apart from the fact that the extent of ruminal degradation of L-carnitine is unclear, the cows in the experiment of Carlson et al. [6] received anionic salts, minerals and vitamins from different sources, which might have had an effect, too. Furthermore, the L-carnitine supplementation in the experiment of Carlson et al. [6] started at 14 days ap, whereas the cows in the present study were already supplemented from day 42 ap. This longer adaptation period might have also been a reason for differences between the results of both studies.
In the present experiment, the maximum NEFA concentration was reached at 0.5 h pp, when NEB was most negative and also fat mobilisation was at the maximum level. From day 100 pp, the initial NEFA concentration was reached again, which coincided with changing from a negative to a positive NEB. The increased BHB concentration went along with low glucose concentrations. The maximum BHB concentration occurred at 72 h pp. This might have been the time point, when the demand for glucose was higher than the capacity for gluconeogenesis in liver, resulting in an incomplete oxidation of NEFA—named ketogenesis [4]. Also, Carlson et al. [6] described that glucose in blood was unaffected by 6, 50 or 100 g of a dietary L-carnitine product. The concentration of glucose increased rapidly in the first hour pp, whereas insulin concentration reached the minimum level at this time point. Interestingly, the peak of glucose concentration in the present experiment occurred already at 2 h pp and at 12 h pp, the initial level was nearly reached again. According to Weber et al. [26], the concentration of glucose decreased rapidly after calving and also, insulin concentration decreased around calving, which corresponds to the results in the present experiment. The time-dependent changes in glucose, insulin and NEFA concentrations suggested a lower pp insulin sensitivity, as suggested by the lower RQUICKI that was, however, not influenced by L-carnitine supplementation. The significantly higher TG concentration in CAR on day 1 ap might be a hint at an increased hepatic export capacity for TG in the form of a very low density of lipoproteins in the blood.
Interestingly, in the first week of lactation, milk protein was higher in CON than in CAR. La Count et al. [1] could not detect this effect in lactating Holstein cows receiving a ruminal or abomasal infusion of 6 g non-rumen-protected L-carnitine/d, whereas an abomasal infusion of a larger amount of L-carnitine (20 g/d) also resulted in lower milk protein concentrations in Holstein cows with provoked negative energy balance through feed restriction [5]. Erfle et al. [10] detected a negative correlation between milk carnitine and milk protein during the first weeks after calving in non-supplemented cows. A competition between milk protein synthesis and carnitine synthesis might exist, but is not very likely in the present case because precursors of carnitine synthesis derived from tissue protein catabolism [10] and from milk protein were lower in CAR. Supplementation with L-carnitine should minimise the need for L-carnitine precursors from protein catabolism and endogenous L-carnitine synthesis should also be lower. In the study of Carlson et al. [6], the percentage of milk protein tended to be higher in cows supplemented with 100 g L-carnitine/d than in cows supplemented with 50 g L-carnitine/d. In consideration of the present data, no conclusive explanation for this effect could be found.
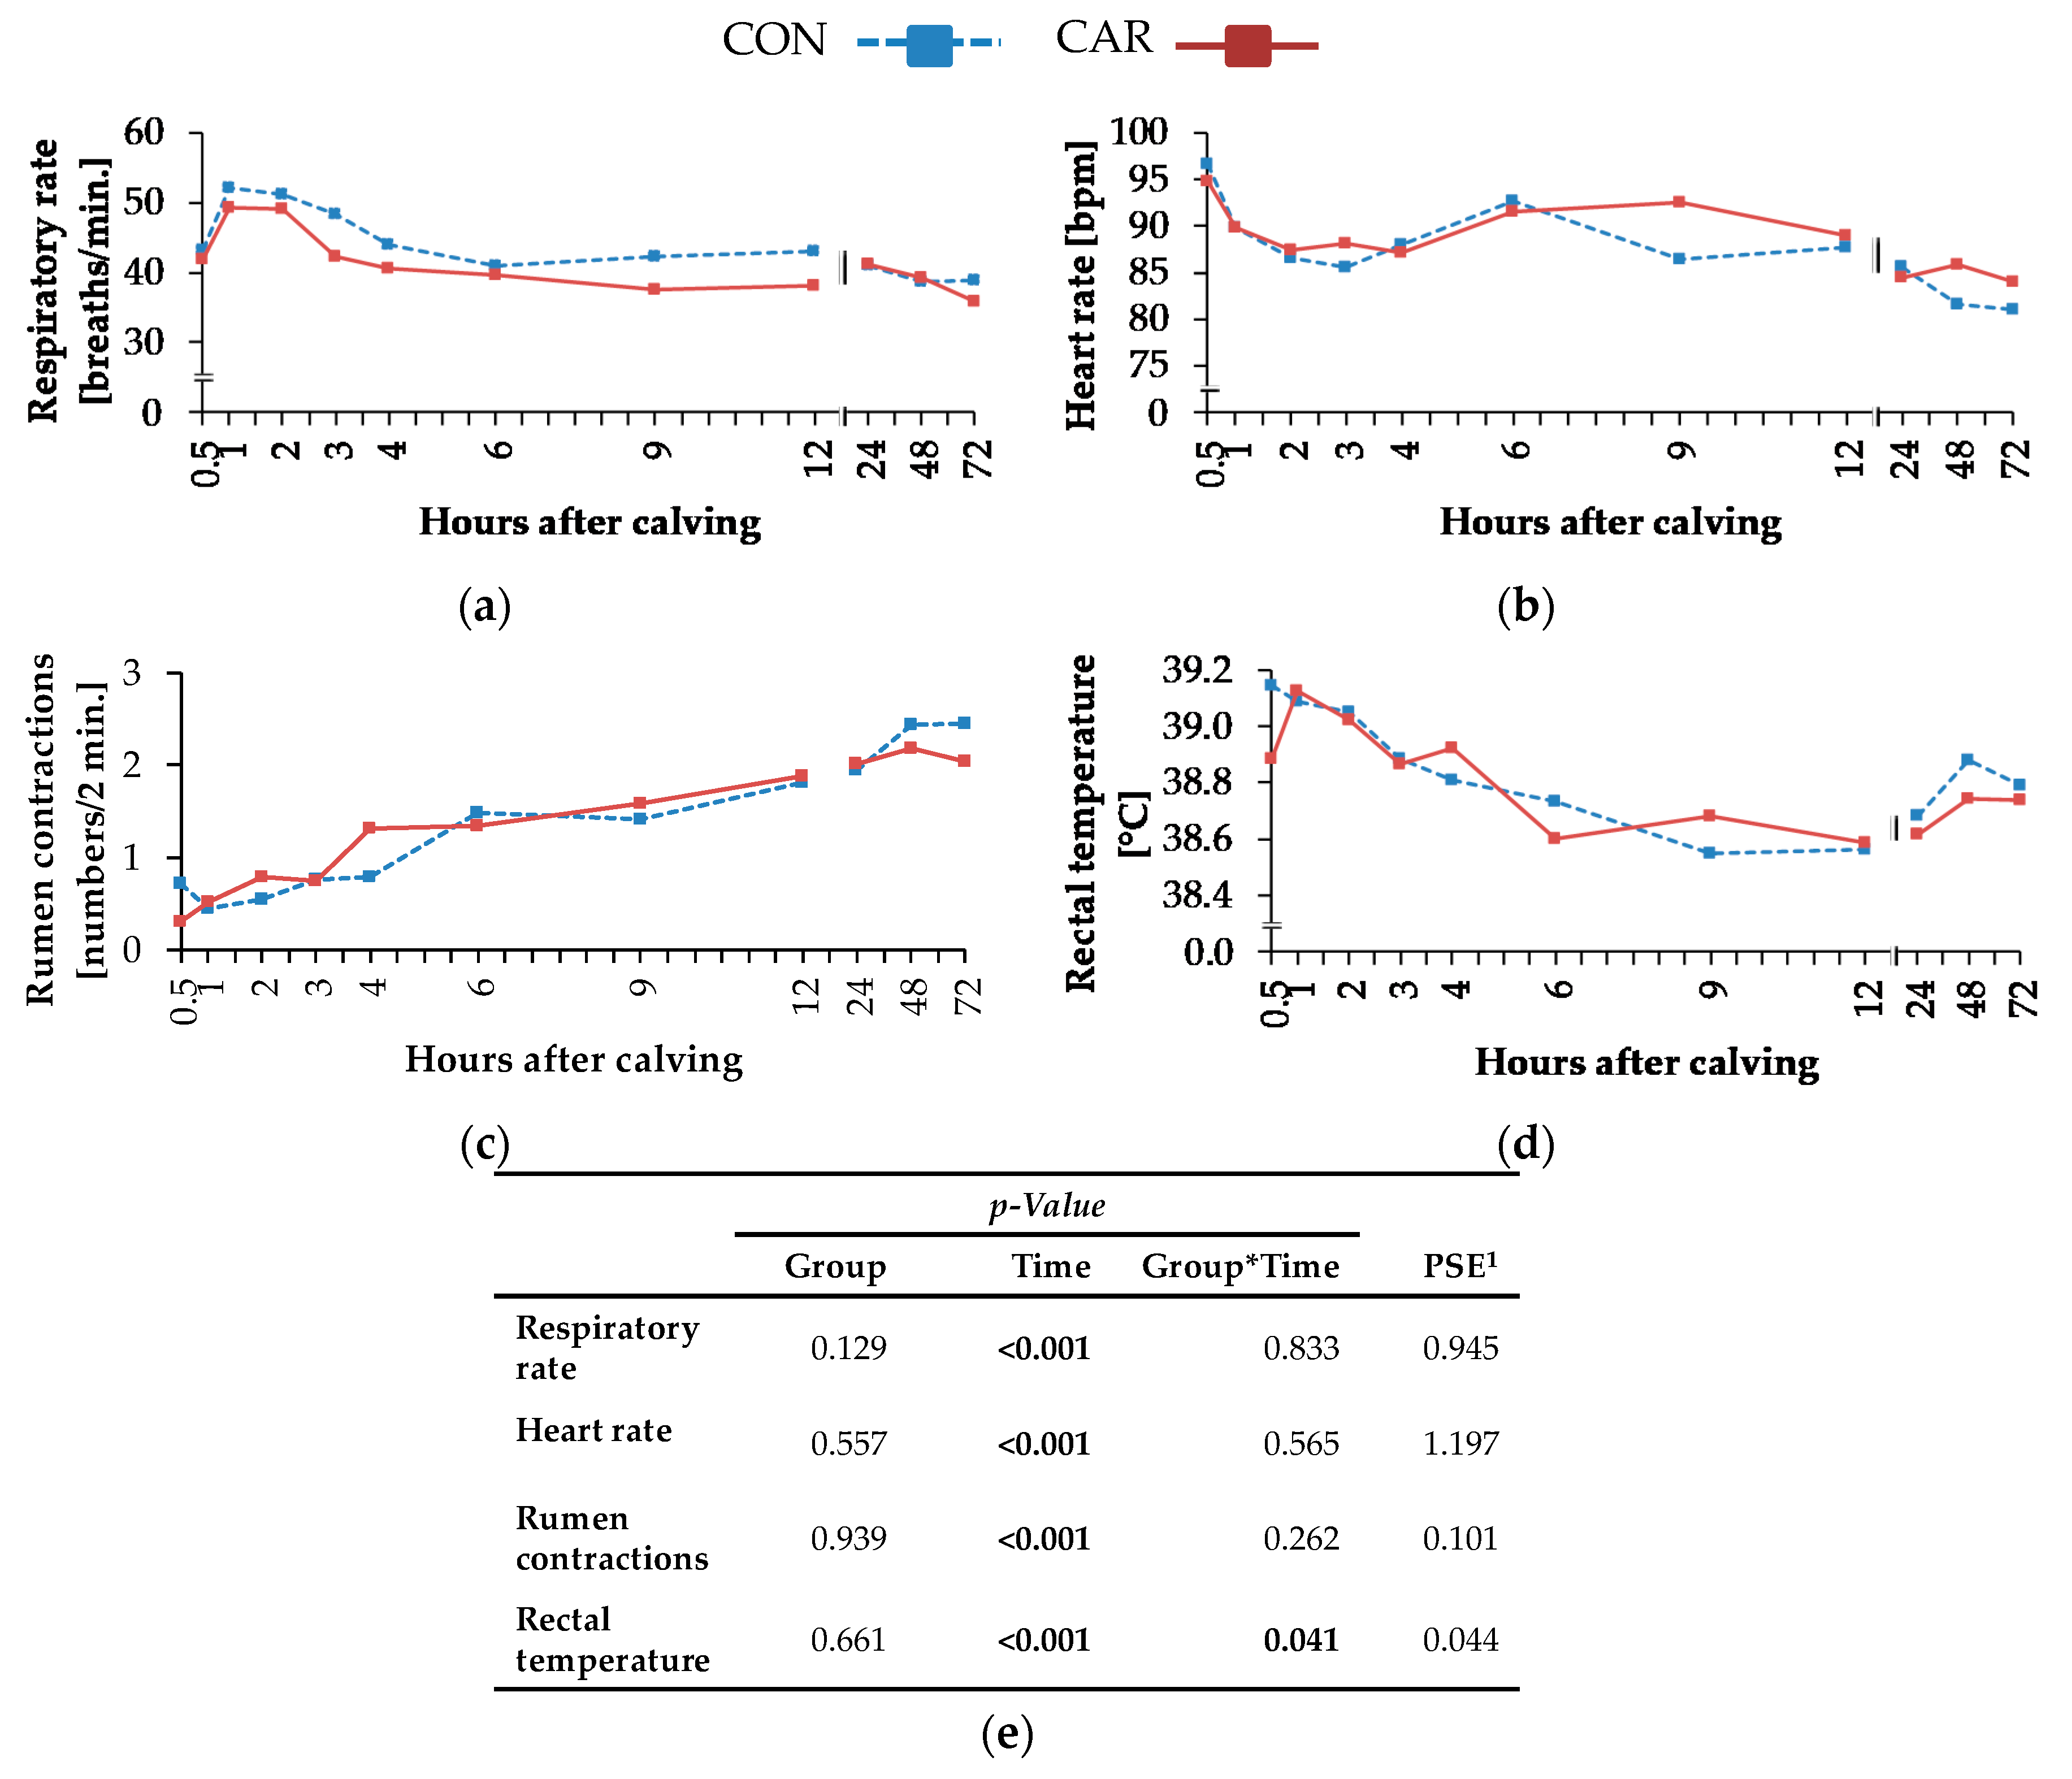
Most of the clinical signs and the cumulative clinical score were characterised by distinct dynamic profiles. Maximum heart rate of Holstein Friesian cows was detected directly during calving (Kovács et al. [27,28]). This effect resulted from exertions during parturition but also from loss of volume in the form of the calf and amniotic fluid. After this, peak heart rate remained on a high level from 0 h pp until 0.5 h pp and decreased until 1 h pp, which corresponded to the results of the present experiment. Georg et al. [29] found the heart frequency to increase 60–90 min ap in Holstein cows. The process of calving is stressful and goes along with pain for the dam [8]. Acute stress results in an activation of the sympathetic nervous system and concomitantly, a release of epinephrine from the adrenal glands causing an increase of heart rate [30]. Furthermore, the mentioned development of heart rate might be due to the decreased parasympathetic activity, which resulted in an increase of sympathetic activity [28]. Heart rate is closely related to metabolic oxygen consumption and consequently to energy expenditure [31]. Thus, an increased heart rate goes along with increased oxygen consumption and indicates enhanced energy expenditure. Based on the fact that both treatment groups showed similar patterns of heart rate kinetics during the first 72 h pp, the L-carnitine supplementation obviously failed to support energy metabolism in this particular period.
Respiratory rate is closely involved in oxygen supply of the organism and consequently to heart rate, but also in the regulation of acid-base homeostasis. In the present study, respiratory rate increased to maximum level 1 h pp and was 26% higher at this time point than 72 h pp, which was also caused by exertions due to parturition. Srikandakumar et al. [32] detected an increase of respiratory rate and venous TpO2 in heat-stressed Holstein cows, whereby TpCO2 and oxygen saturation decreased. Taking into account that the calving process is a stress challenge, too, this corresponds to most of the results in the present experiment, where the maximum value of TpO2 occurred simultaneously with highest respiratory rate (1 h pp), whereby TpCO2 was on a relatively low level at this time point in comparison to the following time points (maximum level of TpCO2 in the first 72 h pp occurred when respiratory rate reached the highest level). Maximum sO2 also happened at 1 h pp in this experiment, in which the cows calved outside the summer months and therefore, more oxygen was in the air. SO2 also increased in Jerseys and Australian Milking Zebus, but not in Holstein cows under heat stress [32]. The minimum concentration of hydrogen carbonate ions, total carbon dioxide, BE and Beecf occurred simultaneously to the peak of respiratory rate, whereby temperature-corrected pH reached the minimum level 1 h later. An increased respiratory rate results in an increase of carbon dioxide elimination [32]. In the following, TpCO2 and total carbon dioxide concentration decrease, whereby the limit of bicarbonate buffer system in blood is exceeded [32]. Due to decreasing concentration of hydrogen carbonate ions, temperature-corrected pH in blood decreases, too [32]. The discussed regulatory mechanisms between respiratory rate and acid-base homeostasis were not modulated by L-carnitine, further supporting the view that the energetic situation shortly after calving remained unaffected by L-carnitine.
Numbers of primary rumen contractions decreased due to a depressed DMI until week 1 ap. Also, Kandylis et al. [33] ascribed decreased ruminal motility to a decreased feed intake in sulfur-supplemented ruminants. Jørgensen et al. [34] detected decreased rumen motility in hypocalcaemic cows at a Ca2+ concentration of ≤1.0 mmol/L in blood. In the present experiment, Ca2+ concentration in blood was at 1.05 mmol/L when rumen contractions reached the minimal level (1 h pp). According to Hove et al. [35], decreased gastrointestinal motility went along with decreased calcium absorption because calcium absorption in the small intestine depends on a continuous flow of substrate.
Although the rectal temperature was differently affected by carnitine supplementation over time, the overall variation was minimum (38.58–39.11 °C) and inconsistently related to the dietary treatment. According to Suthar et al. [36] and Burfeind et al. [37], rectal temperature is influenced by parity, time of day and month, which might have contributed to the observed variation.
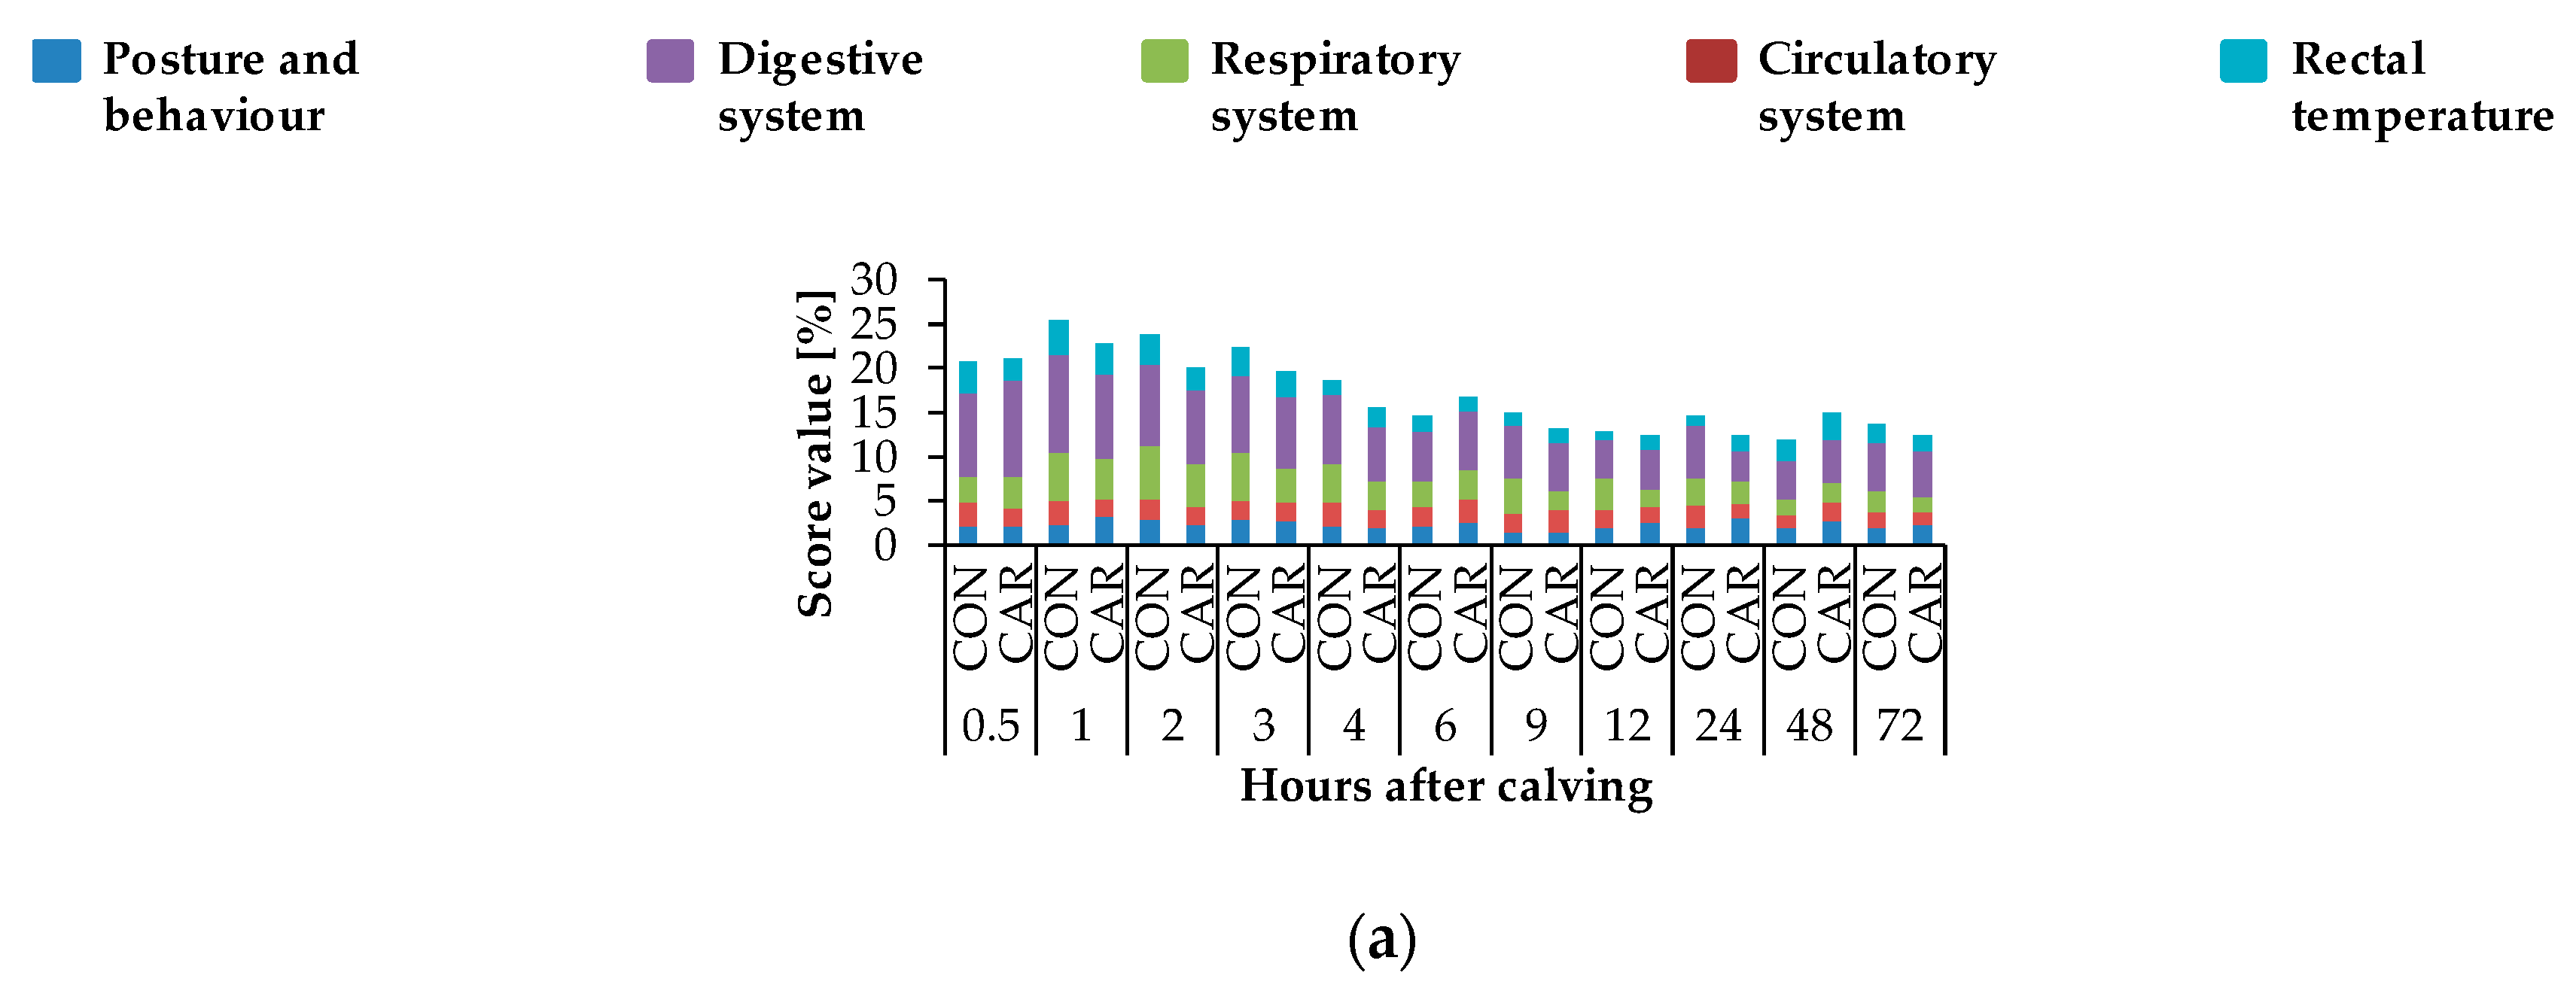
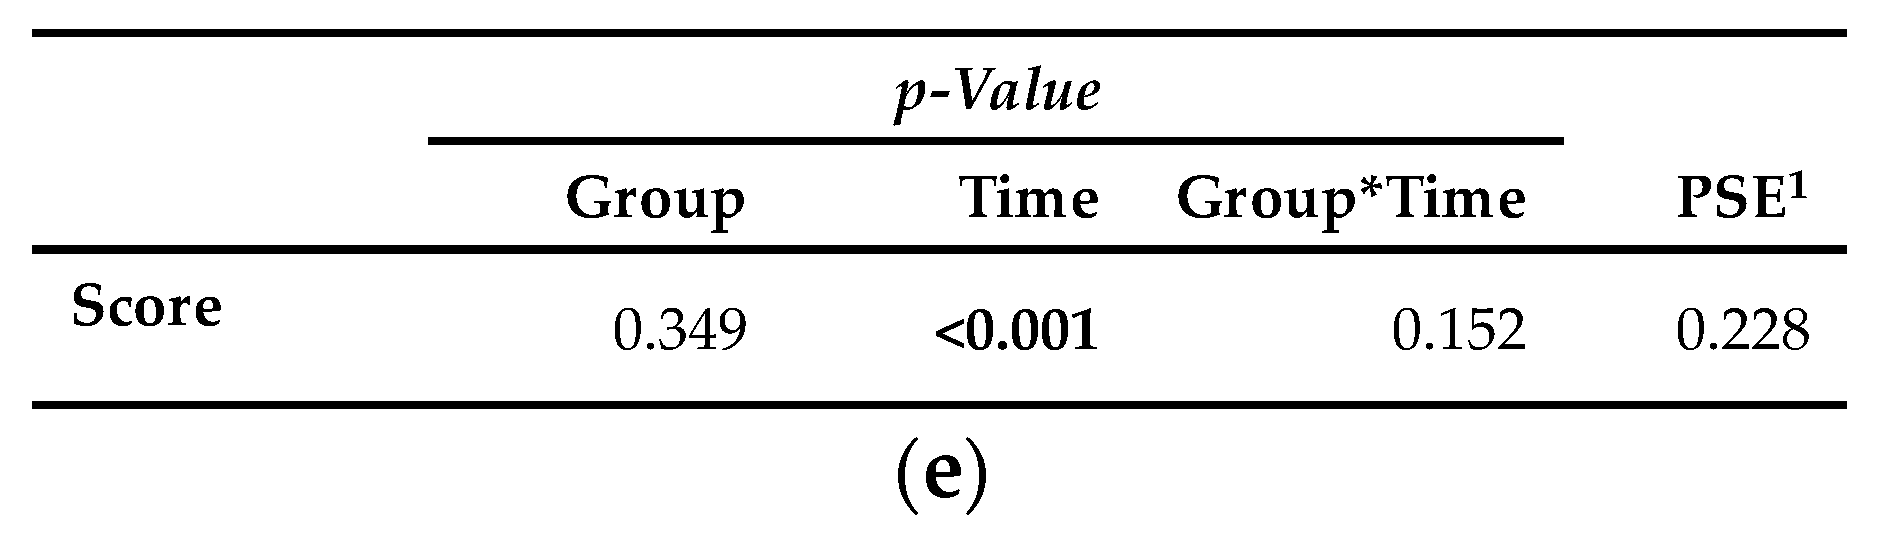
Just like most of the discussed clinical variables (heart rate, respiratory rate, primary rumen contractions and rectal temperature) showed maximum values shortly after calving, the resulting cumulative clinical score also peaked at 1 h pp, whereby deviations in the digestive system at each time point provided the largest part of the cumulative clinical score and reached the highest percentage during the first h pp.
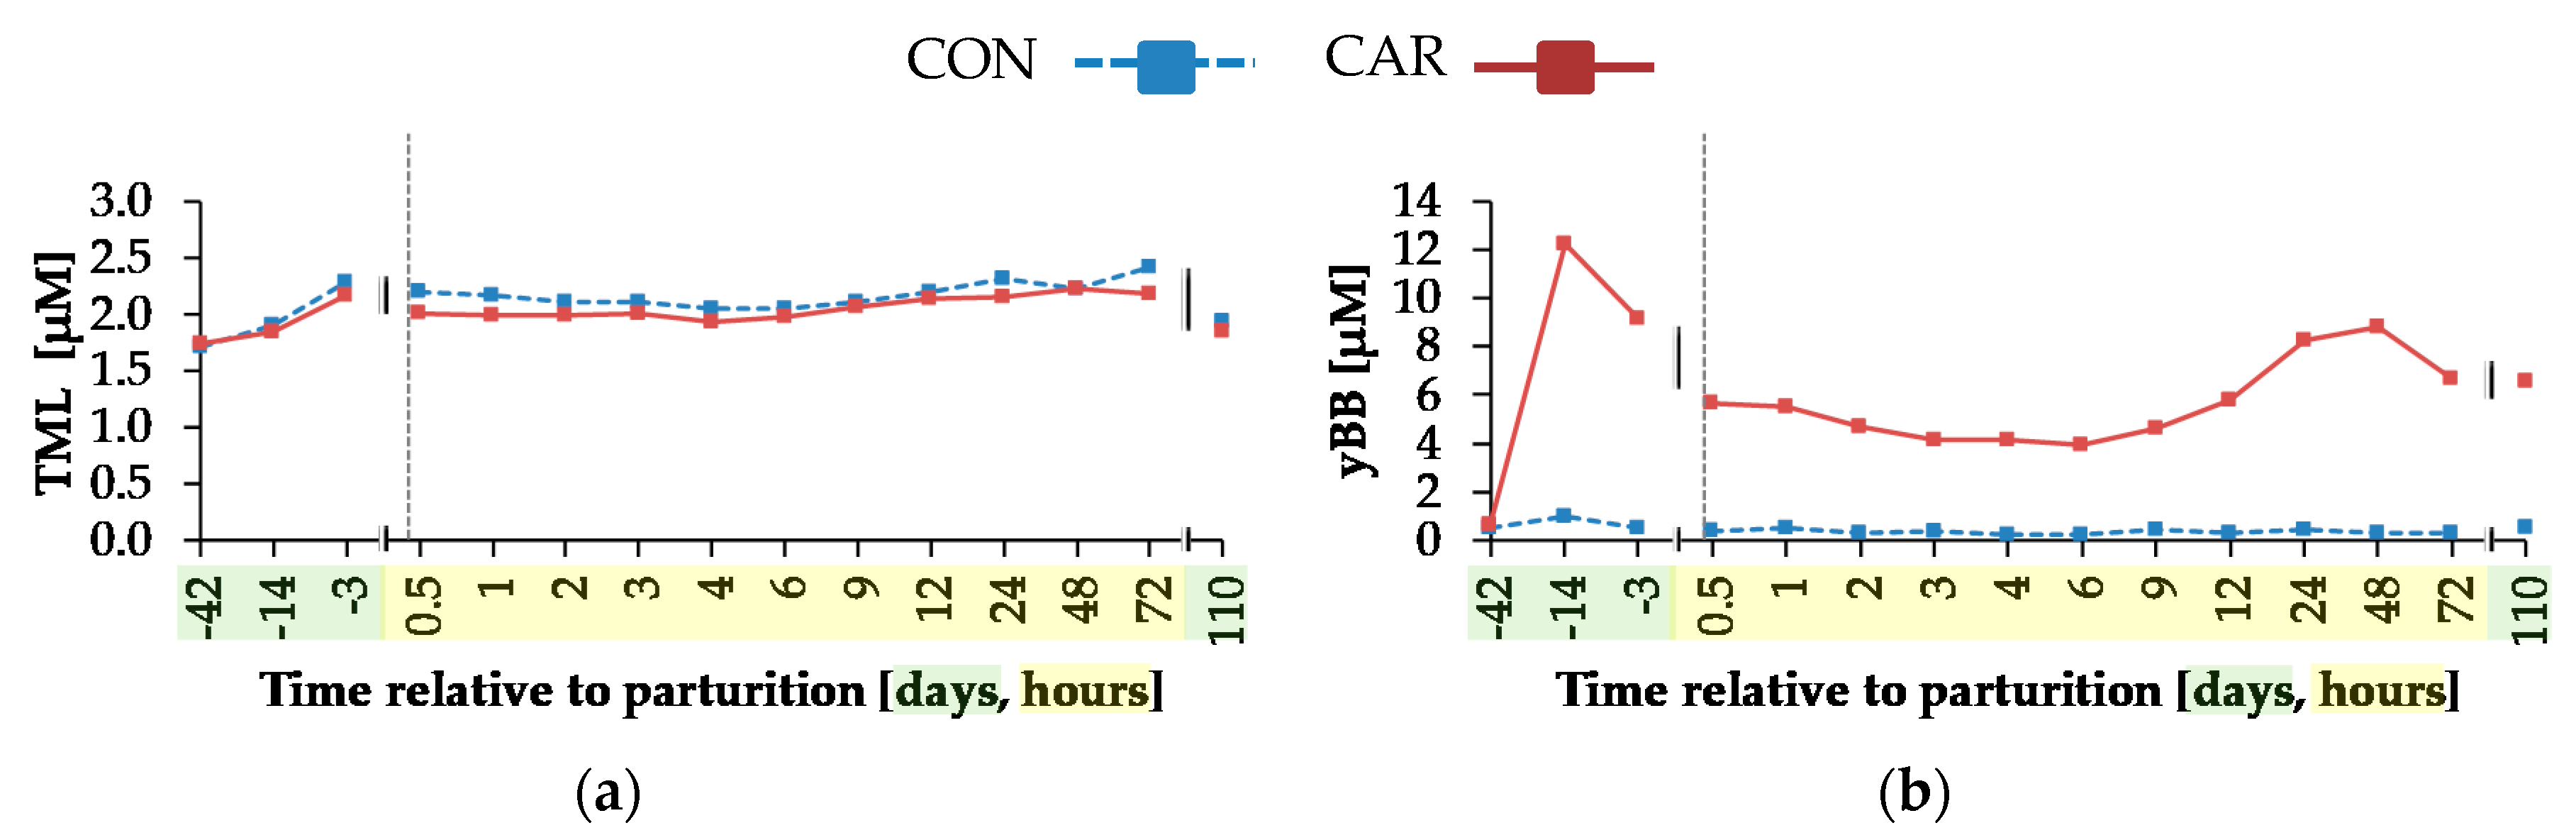
A time-dependent variation was detected for the concentration of TML as the precursor for endogenous carnitine synthesis. In mammals, TML originates primarily from protein degradation [38] and was found in different proteins like cytochrome c, calmodulin, actin, myosin and histones [39]. In the present experiment, increased TML concentrations were detected until day 3 ap independent of L-carnitine supplementation. The lack of treatment differences might be due to the equal total NEL intake, the NEB and therefore, an assumed equal protein catabolism between both groups. Davis et al. [40] described a significant increase of TML concentration in plasma of starved rats as compared to fed rats, which possibly resulted from an induced proteolysis. Dairy cows in the transition period also have an insufficient energy supply, triggering not only fat mobilisation but also protein degradation as already indicated by the TML concentration in blood.
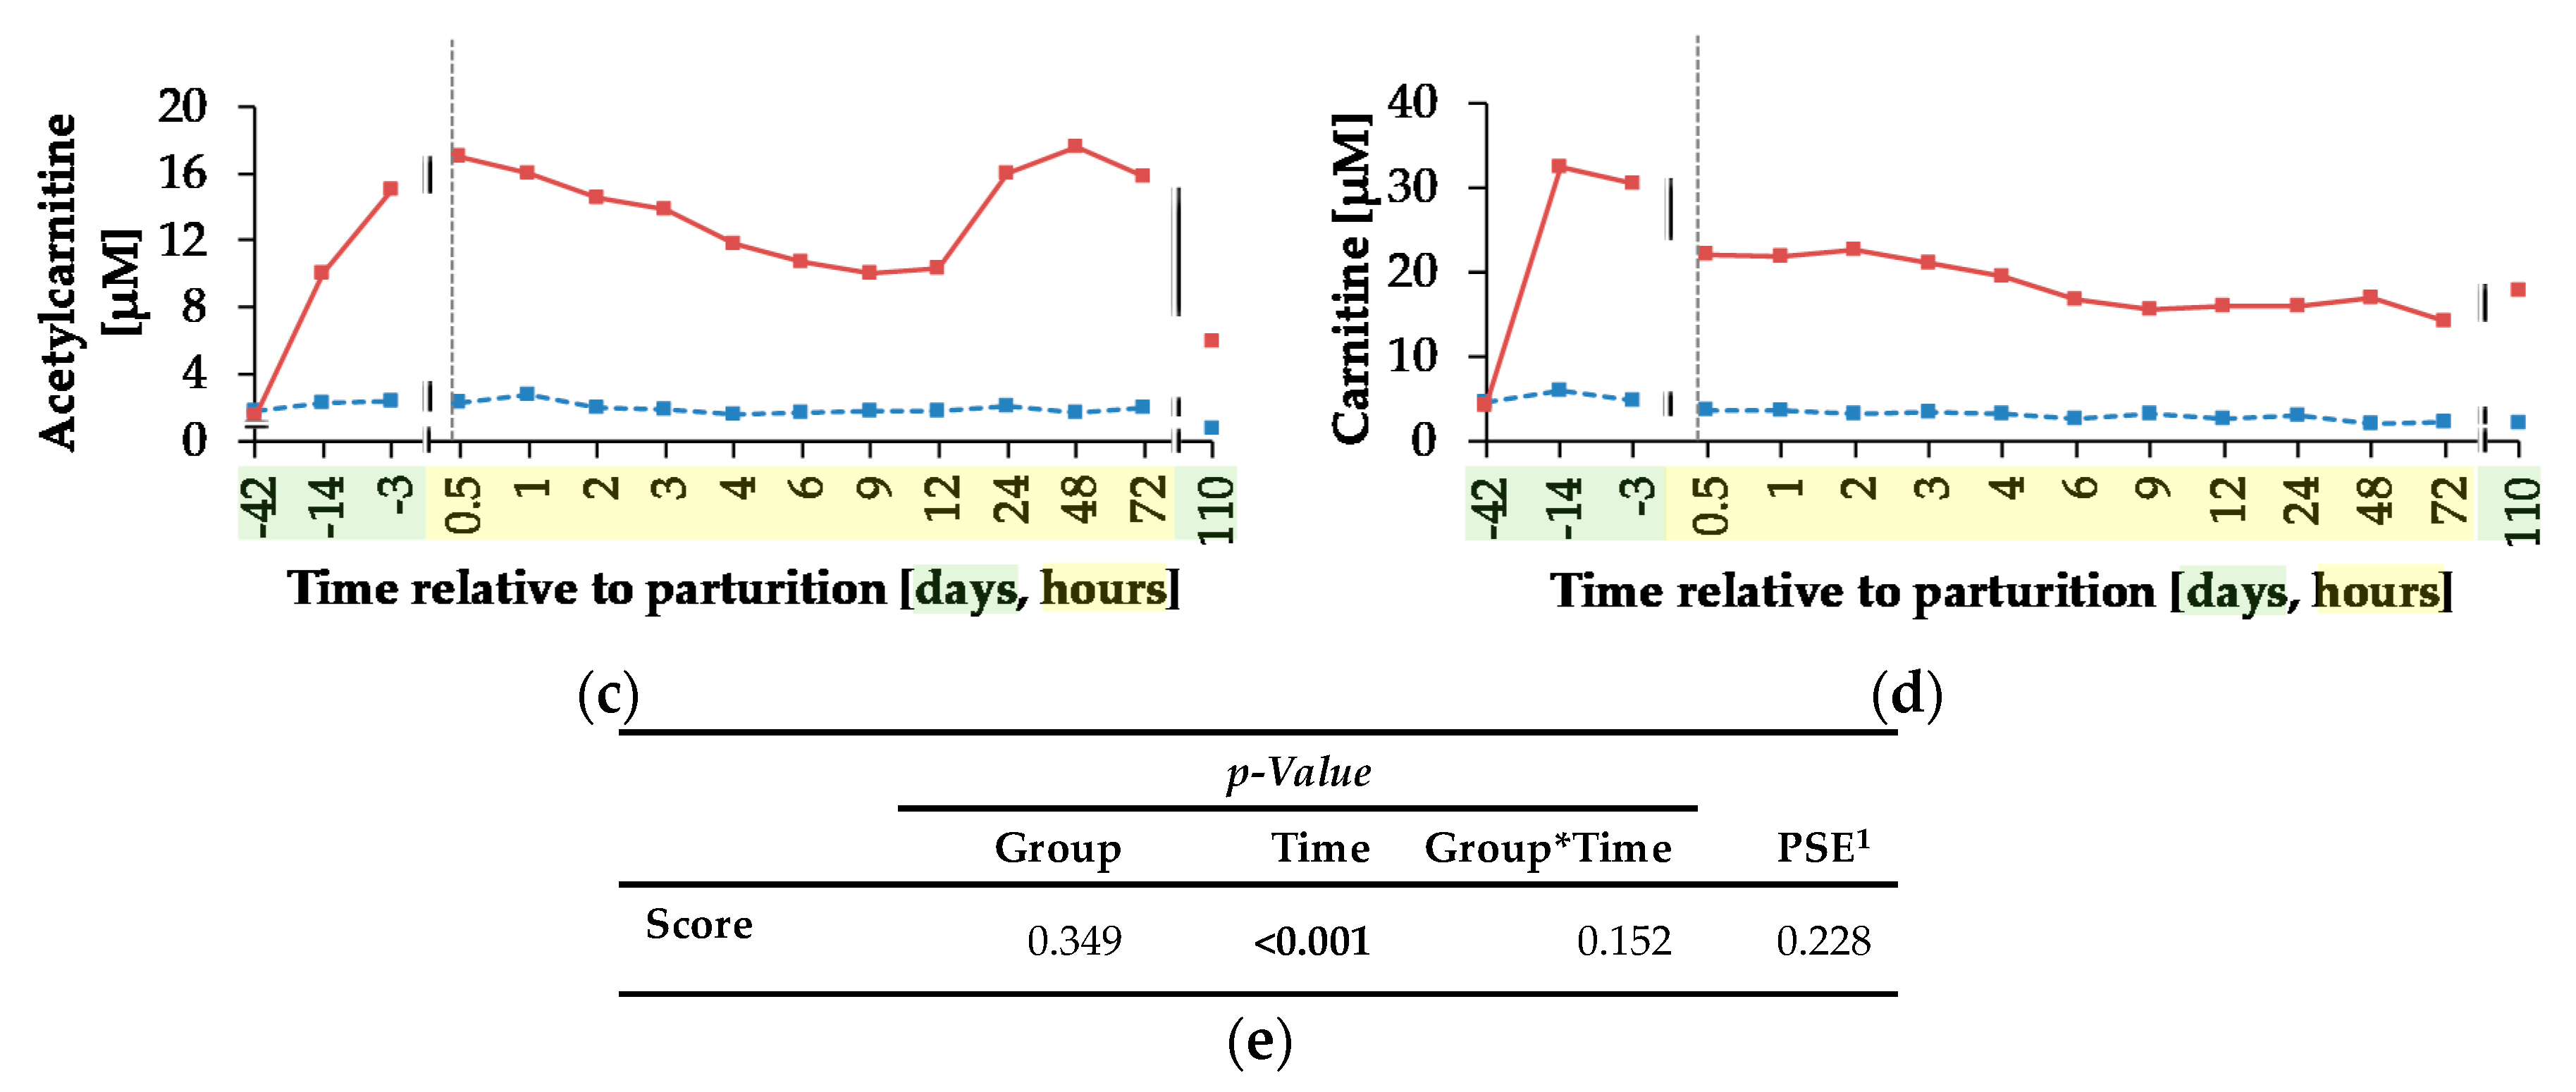
The concentrations of yBB, ACA and CA were affected by L-carnitine supplementation. All of them remained unchanged in CON over the whole trial, but in CAR, there was a sharp increase of yBB and CA concentration until day 14 ap, which represented the period of adaptation to the L-carnitine supplementation. yBB originated from the conversion of TML occurring primarily in kidney in rats [41]. Rebouche et al. [42] detected a decreased hepatic activity of yBB dioxygenase—converting yBB into CA—in carnitine-supplemented rats, which could be the reason for the higher yBB concentrations in CAR. The decreased yBB and CA concentrations from day 14 ap until 0.5 h pp in both groups could result from variations in carnitine metabolism during this period. Also, according to Schlegel et al. [43], mRNA abundances of genes involved in fatty acid uptake, fatty acid oxidation, ketogenesis and of enzymes of carnitine synthesis as well as carnitine uptake in liver increased from week 3 ap until week 1 pp in dairy Holstein cows and thus, liver cells received sufficient amounts of carnitine for the transport of excessive amounts of NEFA. CA is released primarily as ACA from liver cells into the blood stream [44], which explains the persistent increase of ACA concentration at 0.5 h pp, when concentrations of yBB and CA decreased in blood, but increased in liver cells [43].

5. Conclusions

The results demonstrated that a supplementation of 25 g rumen-protected L-carnitine/cow/d resulted in higher milk yields in early lactation and also higher milk fat percentages in the first week of lactation. On the given data basis, L-carnitine supplementation failed to improve the cows´ recovery from parturition and to reduce the extent of negative energy balance. Furthermore, equal levels of fat mobilisation (based on ultrasound measurements), NEFA and BHB concentrations indicated that the L-carnitine supplementation in the present experiment did not enhance the energy availability and energetic efficiency. Interestingly, the export of TG from liver into blood seemed to be increased in L-carnitine-supplemented dairy cows during the last 14 days ap, which could have consequences on pp hepatic lipid accumulation.

Author Contributions

Conceptualization: S.D., J.F., K.H., J.S., H.S.; Formal Analysis: J.M.; Investigation: J.M., S.U.D., K.H., S.G., J.T.-M., T.A., J.F., L.H., J.K., S.K., D.v.S., E.M., K.E., J.R.; Resources: J.M.; Data Curation: J.M.; Writing original draft preparation: J.M.; Review and editing: J.M., S.U.D, S.G., J.T.-M., M.A., J.F., L.H., J.K., S.K, D.v.S., U.M., E.M., K.E., H.S., J.S., K.H., J.R., S.D.; Visualization: J.M., S.U.D.; Supervision: J.F., S.K., S.D., J.R.; Project administration: K.H., S.D.; Funding Acquisition: K.H., S.D. All authors have read and agreed to the published version of the manuscript.

Funding

This experiment is part of the project MitoCow and funded by the German Research Foundation (DFG, 202989534).

Acknowledgments

The authors thank the co-workers of the Institute of Animal Nutrition and the co-workers of the experimental station of the Fredrich-Loeffler-Institute in Brunswick for their great support. Further thanks go to the German Research Foundation (DFG) for their financial support.

Conflicts of Interest

The authors declare no conflict of interest.

Appendix A

Table A1. Definition of the cumulative clinical score. The physiological level was defined as 0. Clinical findings were assigned to five different categories. The lines between parameters indicate that only the parameter above or below were considered for the cumulative score. A maximum of 29 points could be reached.
CategoryParameterScoreMeaning
Posture and behaviourEar position0, 1, 2Horizontal, tense and backwards, low
Behaviour
Calm0, 1, 2Calm and attentive, calm, apathetic
Nervous0, 1, 2Calm and attentive, nervous, hyper nervous
Circulatory Muzzle0, 1Wet, dry
Conjunctive
Hypoaemic 0, 1, 2Pale rose, pale, cyanotic
Hyperaemic 0, 1, 2Pale rose, rose red, red
Injected episcleral vessels0, 1, 2, 3No, low, medium, severe injected
Washed out episcleral vessels0, 1No, yes
Heart rate
Bradycardia0, 1, 2, 365–85, 44–64, 23–43, <43 (bpm)
Tachycardia0, 1, 2, 3 65–85, 86–106, 107–127, >127 (bpm)
RespiratoryRespiratory rate
Bradypnea0, 1, 2, 324–36, 15–23, 6–14, <6 (breaths/min)
Tachypnea0, 1, 2, 324–36, 37–49, 50–62, >62 (breaths/min)
Pathological breathing sound0, 1, 2, 3None, low, medium, severe laboured breathing
Digestive Primary rumen contractions
Hypoperistaltic0, 1, 22–3, 1, 0 (numbers/2 min)
Hyperperistaltic0, 1, 22–3, 4, >4 (numbers/2 min)
Rumen sound
Reduced0, 1Loud, less loud-silence
Increased0, 1Loud, intensive loud
Abdominal wall tension 0, 1, 2, 3No, low, medium, severe increased tension
Rectal temperatureRectal temperature
Hypothermia0, 1, 2, 338–39, 37–37.9, 36–36.9, <36 (°C)
Hyperthermia0, 1, 2, 338–39, 39.1–40, 40.1–41, 41.1–42 (°C)
Table A2. Effects of an L-carnitine supplementation on water intake, net energy requirement for lactation (NEL), feed efficiency and residual energy intake (REI).
Week 1Water Intake (kg/d)NEL 2 (MJ NEL/d)Feed Efficiency 3 (kg/kg)Residual Energy Intake 4 (MJ NEL/d)
CON 5CAR 6CON 5CAR 6
−646
−547
−445
−344
−243
−133
16490.6110.42.62.7−0.9
275114.9121.62.52.13.3
379116.2122.72.21.95.3
483120.3127.42.21.84.1
584121.1129.01.92.0−1.8
683123.4128.61.82.0−2.9
783125.1126.21.81.8−0.2
881124.8126.41.81.84.9
981121.8122.01.81.73.7
1082121.7124.81.81.82.6
1183117.4126.41.81.9−0.4
1282122.2124.31.81.80.5
1382122.4124.51.71.77.2
1481125.2124.91.71.67.5
1579123.5124.61.71.61.6
p-value 7
G0.7670.2290.4320.409
T<0.001<0.001<0.001<0.001
G*T0.1150.0450.0450.157
PSE 81.3311.4520.0351.645
Data are given as LS-means. 1 week relative to parturition, 2 NEL = (milk energy (MJ NEL/kg) + 0.086) * milk yield (kg/d), 3 feed efficiency = energy-corrected milk (kg/d)/dry matter intake (kg/d), 4 REI = NEL intake (MJ NEL)—expected energy intake (MJ NEL), 5 control group (non-supplemented diet), 6 L-carnitine group (L-carnitine-supplemented diet (25 g/d from 6 weeks ap up to week 15 pp)), 7 p-value for group (G), time (T) and interaction of G and T (G*T), 8 pooled standard error.
Table A3. Effects of an L-carnitine supplementation on body condition and milk parameters.
Week 1BW 2 (kg)BCS 3FPR 4Lactose (%)Urea (mg/kg)SCC 5 (log10/mL)FCM 6 (kg/d)
CON 7CAR 8
−67133.3
−57303.4
−47403.4
−37503.4
−27623.5
−17593.5
16583.21.374.451732.0827.434.5
26383.21.454.701361.7736.238.3
36313.01.344.811021.6136.438.3
46303.01.384.81991.5537.940.0
56323.11.294.86941.4737.840.3
66323.01.244.86921.4438.340.0
76343.01.224.86901.4338.939.0
86333.01.244.87911.4538.739.4
96343.01.134.88931.3737.337.4
106383.01.154.88911.4237.438.3
116403.11.124.87971.4135.639.1
126413.01.134.89971.4337.338.2
136443.11.124.87911.4137.338.2
146453.11.154.871001.4938.238.4
156453.11.164.89981.4437.638.5
p-value 9
G0.9350.7900.5350.3850.2660.6380.182
T<0.001<0.001<0.001<0.001<0.001<0.001<0.001
G*T0.1450.9350.1160.6310.2780.9950.029
PSE 105.0620.0280.0200.0143.3510.0370.496
Data are given as LS-means. 1 week relative to parturition, 2 body weight, 3 body condition score, 4 fat-protein ratio, 5 somatic cell count, 6 fat-corrected milk = (milk fat (%) * 1.05 + 0.4) * milk yield (kg/d), 7 control group (non-supplemented diet), 8 L-carnitine group (L-carnitine-supplemented diet (25 g/d from 6 weeks ap up to week 15 pp)), 9 p-value for group (G), time (T) and interaction of G and T (G*T), 10 pooled standard error.
Table A4. Effects of L-carnitine supplementation on lactate and glucose in blood, insulin in plasma and Revised Quantitative Insulin Sensitivity Check Index (RQUICKI).
Day/Hours 1Lactate (mmol/L)Glucose (mmol/L)Insulin (pmol/L)RQUICKI 2
−420.733.7288.600.48
−140.543.66143.830.44
−70.613.62--
−30.533.5176.830.46
−10.554.04--
0.51.065.8827.180.44
11.097.3119.470.47
20.997.7538.070.47
30.976.9484.820.43
40.935.60100.790.38
60.944.0470.340.42
90.764.0066.650.43
120.693.8670.220.42
240.723.5473.660.43
480.623.3559.320.44
720.613.2047.200.47
70.502.9752.540.49
140.423.3176.720.46
210.433.2068.340.49
280.413.25--
420.453.48--
560.443.49--
1000.493.52--
1100.523.59101.190.50
p-value 3
G0.5940.4630.2630.827
T<0.001<0.001<0.001<0.001
G*T0.7830.7510.7610.892
PSE 40.0260.1024.2540.006
Data are given as LS-means. - = no measurement for this parameter at particular time point. 1 day/hours relative to parturition, 2 RQUICKI = 1/(logInsulin (µU/mL) + logGlucose (mg/dl) + logNEFA (mmol/L), 3 p-value for group (G), time (T) and interaction of G and T (G*T), 4 pooled standard error.
Table A5. Effects of L-carnitine supplementation on electrolytes in blood and on anion gap.
Day/Hours 1Sodium (mmol/L)Potassium (mmol/L)Chloride (mmol/L)Hydrogencarbonate (mmol/L)Anion Gap 2 (mmol/L)
−42140.203.85106.2029.111.45
−14141.283.83106.5029.761.57
−7142.353.82108.1829.091.52
−3142.973.75108.8128.871.79
−1143.593.81109.2328.121.42
0.5141.893.84110.2626.580.98
1141.283.87109.6326.471.02
2140.893.81109.6826.811.02
3141.423.77109.7926.880.99
4141.713.81109.7427.111.03
6141.963.76109.0028.261.18
9141.693.82109.1227.701.36
12141.693.88109.0727.791.41
24141.473.98109.4127.111.20
48141.083.85108.0728.501.30
72140.353.84106.9028.371.39
7140.803.62103.0730.311.62
14140.303.66103.4030.111.46
21139.523.80103.1029.031.46
28139.753.71102.9330.221.50
42138.873.77103.5629.721.26
56139.373.69103.8930.881.32
100138.433.77102.3031.361.32
110139.193.69102.7931.631.48
p-value 3
G0.3930.7330.5940.3030.638
T<0.0010.019<0.001<0.001<0.001
G*T0.3060.7220.9670.9800.407
PSE 40.1290.0250.2340.2400.168
Data are given as LS-means. 1 day/hours relative to parturition, 2 anion gap = (Na+) − ((HCO3) + (Cl), 3 p-value for group (G), time (T) and interaction of G and T (G*T), 4 pooled standard error.
Table A6. Effects of L-carnitine supplementation on calcium ions (Ca2+), total calcium (Ca), ratio of Ca2+ and Ca and ratio of Ca and total phosphorus.
Day/Hours 1Ca2+ (mmol/L)Ca (mmol/L)Ca2+:Ca Phosphorus (mmol/L)Ca:Phosphorus
−421.322.150.631.451.58
−141.312.320.561.571.50
−71.292.320.561.521.60
−31.292.250.581.791.33
−11.242.090.571.421.58
0.51.051.930.530.982.25
11.051.870.561.022.01
21.061.880.581.022.02
31.051.860.570.992.17
41.051.910.561.032.06
61.081.940.561.181.81
91.111.970.571.361.67
121.112.020.561.411.62
241.091.940.571.201.89
481.151.980.581.301.65
721.182.080.731.391.65
71.262.120.881.621.43
141.292.290.561.461.68
211.292.270.571.461.68
281.272.270.561.501.62
421.282.180.591.261.83
561.272.240.571.321.81
1001.262.270.571.321.83
1101.242.320.521.481.65
p-value 2
G0.5420.8070.8220.6380.363
T<0.001<0.0010.530<0.001<0.001
G*T0.9540.9500.5160.4070.334
PSE 30.0090.0190.0610.0250.037
Data are given as LS-means. 1 day/hours relative to parturition, 2 p-value for group (G), time (T) and interaction of G and T (G*T), 3 pooled standard error.
Table A7. Effects of L-carnitine supplementation on temperature corrected oxygen and carbon dioxide partial pressure (TpO2, TpCO2), oxygen saturation (SO2), total carbon dioxide (CO2), pH in blood and base excess (BE), base excess in extra cellular fluid compartment (Beecf).
Day/Hours 1TpO2 (mmHg)SO2 (%)TpCO2 (mmHg)CO2 (mmol/L)pHBE (mmol/L)Beecf (mmol/L)
−4230.8261.3746.9130.477.413.354.72
−1434.8659.9147.5431.137.414.005.50
−736.6963.3547.7330.467.403.264.69
−339.9868.3047.6930.247.393.164.42
−140.6969.2147.7229.487.392.173.45
0.542.5972.0145.5227.867.380.99 1.95
145.1375.5846.0427.777.370.831.73
243.7072.7046.7328.137.370.952.04
342.7572.2545.6728.187.381.232.24
442.2271.4745.5328.417.391.582.58
641.3471.9445.7529.577.402.793.89
942.0372.5245.7229.037.392.193.17
1240.1970.5344.8229.107.402.293.36
2441.8573.3145.3828.417.391.672.54
4841.0971.2046.4929.837.402.914.08
7240.1669.4846.9629.707.392.703.89
736.0563.8250.4931.757.394.115.76
1435.3061.3651.2431.587.383.735.41
2135.4959.7149.8030.467.382.764.26
2835.4058.8251.0131.707.393.915.53
4233.6957.4049.2831.167.393.365.06
5632.5457.2150.9832.357.404.476.31
10029.9853.9349.8232.837.415.106.92
11029.6856.3148.0933.077.426.317.45
p-value 2
G0.7450.7580.3150.2830.4550.4530.412
T<0.001<0.001<0.001<0.001<0.001<0.001<0.001
G*T0.5130.5620.7760.9820.2980.7030.965
PSE 30.3790.7460.3410.2490.0020.2240.259
Data are given as LS-means. 1 day/hours relative to parturition, 2 p-value for group (G), time (T) and interaction of G and T (G*T), 3 pooled standard error.
Table A8. Effects of L-carnitine supplementation on ultrasonically determined subcutaneous (SAT), retroperitoneal (RAT), omental (OAT), mesenteric adipose tissue (MAT) and calculated total abdominal adipose tissue (AAT) as well as daily derived energy release for each of the mentioned fat depots.
p-Value 3
Adipose Tissue Masses (kg)d 42 apd 3 ppd 42 ppd 100 ppPSE 4GTG*T
SAT12.713.76.76.30.7290.402<0.0010.566
RAT8.79.74.14.50.5810.547<0.0010.953
OAT13.515.810.29.20.6740.535<0.0010.506
MAT15.716.511.310.50.6280.448<0.0010.611
AAT 137.942.025.724.21.7170.472<0.0010.950
Daily energy release 2 [MJ/d]d 42 ap up to 3 ppd 3 pp up to 42 ppd 42 pp up to 100 pp PSE 4GTG*T
SAT−0.535.600.24 0.6000.557<0.0010.329
RAT−0.554.43−0.28 0.5760.727<0.0010.921
OAT−1.414.350.55 0.5670.700<0.0010.592
MAT−0.444.220.48 0.6470.850<0.0010.319
AAT1−2.4012.960.75 1.5650.904<0.0010.773
Data are given as LS-means. 1 AAT = RAT + OAT + MAT, 2 energy release = (changes in adipose tissue masses (kg/d) * 39.8 (kJ/kg) * 0.84)/1000, 3 p-value for group (G), time (T) and interaction of G and T (G*T), 4 pooled standard error.

References

  1. LaCount, D.W.; Drackley, J.K.; Weigel, D.J. Responses of Dairy Cows During Early Lactation to Ruminal or Abomasal Administration of L-Carnitine. J. Dairy Sci. 1995, 78, 1824–1836. [Google Scholar] [CrossRef]
  2. Drackley, J.K.; Overton, T.R.; Douglas, G.N. Adaptations of glucose and long-chain fatty acid metabolism in liver of dairy cows during the periparturient period. J. Dairy Sci. 2001, 84, 100–112. [Google Scholar] [CrossRef]
  3. Komatsu, T.; Itoh, F.; Kushibiki, S.; Hodate, K. Changes in gene expression of glucose transporters in lactating and nonlactating cows. J. Anim. Sci. 2005, 83, 557–564. [Google Scholar] [CrossRef] [PubMed]
  4. Grummer, R.R. Etiology of Lipid-Related Metabolic Disorders in Periparturient Dairy Cows. J. Dairy Sci. 1993, 76, 3882–3896. [Google Scholar] [CrossRef]
  5. Carlson, D.B.; Litherland, N.B.; Dann, H.M.; Woodworth, J.C.; Drackley, J.K. Metabolic Effects of Abomasal l-Carnitine Infusion and Feed Restriction in Lactating Holstein Cows1. J. Dairy Sci. 2006, 89, 4819–4834. [Google Scholar] [CrossRef] [Green Version]
  6. Carlson, D.B.; McFadden, J.W.; D’Angelo, A.; Woodworth, J.C.; Drackley, J.K. Dietary l-Carnitine Affects Periparturient Nutrient Metabolism and Lactation in Multiparous Cows1. J. Dairy Sci. 2007, 90, 3422–3441. [Google Scholar] [CrossRef] [PubMed]
  7. Pirestani, A.; Aghakhani, M. The effects of rumen-protected choline and l-carnitine supplementation in the transition period on reproduction, production, and some metabolic diseases of dairy cattle. J. Appl. Anim. Res. 2018, 46, 435–440. [Google Scholar] [CrossRef]
  8. Hydbring, E.; Madej, A.; MacDonald, E.; Drugge-Boholm, G.; Berglund, B.; Olsson, K. Hormonal changes during parturition in heifers and goats are related to the phases and severity of labour. J. Endocinology 1999, 160, 75–86. [Google Scholar] [CrossRef] [PubMed] [Green Version]
  9. Marquardt, J.P.; Horst, R.L.; Jorgensen, N.A. Effect of Parity on Dry Matter Intake at Parturition in Dairy Cattle. J. Dairy Sci. 1977, 60, 929–934. [Google Scholar] [CrossRef]
  10. Erfle, J.D.; Sauer, F.D.; Fisher, L.J. Interrelationships Between Milk Carnitine and Blood and Milk Components and Tissue Carnitine in Normal and Ketotic Cows. J. Dairy Sci. 1974, 57, 671–676. [Google Scholar] [CrossRef]
  11. GfE. Empfehlungen zur Energie-und Nährstoffversorgung der Milchkühe und Aufzuchtrinder; DLG-Verlags-GmbH: Frankfurt am Main, Germany, 2001. [Google Scholar]
  12. GfE. Neue Gleichungen zur Schätzung der umsetzbaren Energie für Wiederkäuer von Gras-und Maisprodukten; DLG-Verlags-GmbH: Frankfurt am Main, Germany, 2008; Volume 17, pp. 191–197. [Google Scholar]
  13. GfE. New Equations for Predicting Metabolisable Energy of Compound Feeds for Cattle; DLG-Verlags-GmbH: Frankfurt am Main, Germany, 2009; Volume 18, pp. 143–146. [Google Scholar]
  14. Edmonson, A.; Lean, I.; Weaver, L.; Farver, T.; Webster, G. A body condition scoring chart for Holstein dairy cows. J. Dairy Sci. 1989, 72, 68–78. [Google Scholar] [CrossRef]
  15. Raschka, C.; Ruda, L.; Wenning, P.; von Stemm, C.I.; Pfarrer, C.; Huber, K.; Meyer, U.; Dänicke, S.; Rehage, J. In vivo determination of subcutaneous and abdominal adipose tissue depots in German Holstein dairy cattle. J. Anim. Sci. 2016, 94, 2821–2834. [Google Scholar] [CrossRef] [PubMed]
  16. VDLUFA. Verband Deutscher Landwirtschaftlicher Untersuchungs-und Forschungsanstalten; VDLUFA-Verlag: Darmstadt, Germany, 2006. [Google Scholar]
  17. Hirche, F.; Fischer, M.; Keller, J.; Eder, K. Determination of carnitine, its short chain acyl esters and metabolic precursors trimethyllysine and γ-butyrobetaine by quasi-solid phase extraction and MS/MS detection. J. Chromatogr. B 2009, 877, 2158–2162. [Google Scholar] [CrossRef] [PubMed]
  18. Dirksen, G.; Gründer, H.-D.; Stöber, M. Die klinische Untersuchung des Rindes; Enke: Stuttgart, Germany, 2012. [Google Scholar]
  19. Gaines, W. An efficiency formula for dairy cows. Science 1928, 67, 353–354. [Google Scholar] [CrossRef] [PubMed]
  20. Hurley, A.; López-Villalobos, N.; McParland, S.; Kennedy, E.; Lewis, E.; O’Donovan, M.; Burke, J.; Berry, D.P.J.J.o.d.s. Inter-relationships among alternative definitions of feed efficiency in grazing lactating dairy cows. J. Dairy Sci. 2016, 99, 468–479. [Google Scholar] [CrossRef] [PubMed] [Green Version]
  21. Caloni, M.; Perseghin, G.; Caumo, A.; Luzi, L.; Testolin, G. Incorporation of the Fasting Plasma FFA Concentration into QUICKI Improves Its Association with Insulin Sensitivity in Nonobese Individuals. J. Clin. Endocrinol. Metab. 2001, 86, 4776–4781. [Google Scholar] [CrossRef]
  22. Emmett, M.; Narins, R.G. Clinical use of the anion gap. Medicine 1977, 56, 38–54. [Google Scholar] [CrossRef]
  23. Brouwer, E. Report of Sub-Committee on Constants and Factors. In Proceedings of the 3rd Symposium on Energy Metabolism of Farm Animals, Rome, Italy, May 1964; pp. 441–443. [Google Scholar]
  24. AFRC. Agriculture and Food Research Council; CAB International: Wallingford, UK, 1993. [Google Scholar]
  25. Buttchereit, N.; Stamer, E.; Junge, W.; Thaller, G. Short communication: Genetic relationships among daily energy balance, feed intake, body condition score, and fat to protein ratio of milk in dairy cows. J. Dairy Sci. 2011, 94, 1586–1591. [Google Scholar] [CrossRef]
  26. Weber, C.; Schäff, C.T.; Kautzsch, U.; Börner, S.; Erdmann, S.; Görs, S.; Röntgen, M.; Sauerwein, H.; Bruckmaier, R.M.; Metges, C.C.; et al. Insulin-dependent glucose metabolism in dairy cows with variable fat mobilization around calving. J. Dairy Sci. 2016, 99, 6665–6679. [Google Scholar] [CrossRef]
  27. Kovács, L.; Kézér, F.L.; Ruff, F.; Szenci, O. Timing of obstetrical assistance affects peripartal cardiac autonomic function and early maternal behavior of dairy cows. Physiol. Behav. 2016, 165, 202–210. [Google Scholar] [CrossRef]
  28. Kovács, L.; Tőzsér, J.; Kézér, F.L.; Ruff, F.; Aubin-Wodala, M.; Albert, E.; Choukeir, A.; Szelényi, Z.; Szenci, O. Heart rate and heart rate variability in multiparous dairy cows with unassisted calvings in the periparturient period. Physiol. Behav. 2015, 139, 281–289. [Google Scholar] [CrossRef] [PubMed]
  29. Georg, H.; Beintmann, S.; Schwalm, A.; Ude, G. Evaluation of Heart Rate, Lying Behaviour and Activity Measurement to Predict Calving of Dairy Cows. In Proceedings of the Agricultural and Biosystems Engineering for a Sustainable World. International Conference on Agricultural Engineering, Hersonissos, Crete, Greece, 23–25 June 2008. [Google Scholar]
  30. Nagel, C.; Trenk, L.; Aurich, C.; Ille, N.; Pichler, M.; Drillich, M.; Pohl, W.; Aurich, J. Sympathoadrenal balance and physiological stress response in cattle at spontaneous and PGF2α-induced calving. Theriogenology 2016, 85, 979–985. [Google Scholar] [CrossRef] [PubMed]
  31. Brosh, A.; Aharoni, Y.; Degen, A.A.; Wright, D.; Young, B. Estimation of energy expenditure from heart rate measurements in cattle maintained under different conditions1. J. Anim. Sci. 1998, 76, 3054–3064. [Google Scholar] [CrossRef] [PubMed]
  32. Srikandakumar, A.; Johnson, E.J.T.a.h. Effect of heat stress on milk production, rectal temperature, respiratory rate and blood chemistry in Holstein, Jersey and Australian Milking Zebu cows. Trop. Anim. Health Prod. 2004, 36, 685–692. [Google Scholar] [CrossRef] [PubMed]
  33. Kandylis, K. Toxicology of Sulfur in Ruminants: Review. J. Dairy Sci. 1984, 67, 2179–2187. [Google Scholar] [CrossRef]
  34. Jørgensen, R.J.; Nyengaard, N.R.; Hara, S.; Enemark, J.M.; Andersen, P.H. Rumen motility during induced hyper-and hypocalcaemia. Acta Vet. Scand. 1998, 39, 331–338. [Google Scholar]
  35. Hove, K.; Hilde, B.L. Plasma calcium in the lactating cow: Dependence on continuous intestinal absorption. Can. J. Anim. Sci. 1984, 64, 227–228. [Google Scholar] [CrossRef]
  36. Suthar, V.; Burfeind, O.; Bonk, S.; Voigtsberger, R.; Keane, C.; Heuwieser, W. Factors associated with body temperature of healthy Holstein dairy cows during the first 10 days in milk. J. Dairy Res. 2012, 79, 135–142. [Google Scholar] [CrossRef] [Green Version]
  37. Burfeind, O.; Suthar, V.S.; Voigtsberger, R.; Bonk, S.; Heuwieser, W. Body temperature in early postpartum dairy cows. Theriogenology 2014, 82, 121–131. [Google Scholar] [CrossRef]
  38. Kakimoto, Y.; Akazawa, S.J.J.o.B.C. Isolation and identification of NG, NG-and NG, N’G-dimethylarginine, Nε-mono-, di-, and trimethyllysine, and glucosylgalactosyl-and galactosyl-δ-hydroxylysine from human urine. J. Biol. Chem. 1970, 245, 5751–5758. [Google Scholar]
  39. Paik, W.K.; Kim, S. Protein Methylation. Science 1971, 174, 114–119. [Google Scholar] [CrossRef] [PubMed]
  40. Davis, A.T.; Hoppel, C.L. Effect of Starvation on the Disposition of Free and Peptide-Linked Trimethyllysine in the Rat. J. Nutr. 1986, 116, 760–767. [Google Scholar] [CrossRef] [PubMed]
  41. Carter, A.L.; Frenkel, R.J.J.o.B.C. The role of the kidney in the biosynthesis of carnitine in the rat. J. Biol. Chem. 1979, 254, 10670–10674. [Google Scholar] [PubMed]
  42. Rebouche, C.J. Effect of Dietary Carnitine Isomers and γ-Butyrobetaine on L-Carnitine Biosynthesis and Metabolism in the Rat. J. Nutr. 1983, 113, 1906–1913. [Google Scholar] [CrossRef]
  43. Schlegel, G.; Keller, J.; Hirche, F.; Geißler, S.; Schwarz, F.J.; Ringseis, R.; Stangl, G.I.; Eder, K. Expression of genes involved in hepatic carnitine synthesis and uptake in dairy cows in the transition period and at different stages of lactation. BMC Vet. Res. 2012, 8, 28. [Google Scholar] [CrossRef] [Green Version]
  44. Christiansen, R.Z.; Bremer, J. Active transport of butyrobetaine and carnitine into isolated liver cells. Biochim. Biophys. Acta 1976, 448, 562–577. [Google Scholar] [CrossRef]
Figure 1. (a) Dry matter intake, (b) concentrate intake, (c) milk yield and (d) energy-corrected milk (ECM) of cows fed a non-supplemented (control, CON) or an L-carnitine-supplemented diet (25 g/d from 6 weeks ap up to week 15 pp, CAR). (e) Data statistics. Data are given as Least Square (LS)-Means. 1 pooled standard error.
Animals 10 00342 g001aAnimals 10 00342 g001b
Figure 2. (a) Milk fat and protein and (b) fat-protein ratio in milk of cows fed a non-supplemented (CON) or an L-carnitine-supplemented diet (25 g/d from 6 weeks ap up to week 15 pp, CAR). (c) Data statistics. Data are given as LS-means. 1 pooled standard error.
Animals 10 00342 g002
Figure 3. (a) Net energy balance (NEB), (b) total NEL intake of cows fed a non-supplemented (CON) or an L-carnitine-supplemented diet (25 g/d from 6 weeks ap up to week 15 pp, CAR), (c) regression of energy release from adipose tissue in dependence on net energy balance in the first six weeks of lactation. (yCON = −0.15 p > 0.05x + 16.25, r2 = 0.041; yCAR = −0.40 p < 0.05x + 8.00, r2 = 0.229; slopes were not significantly different (p > 0.05)), (d) and regression of net energy balance in dependence on residual energy intake from the first week until week 15 of lactation (yCON = 0.82 p < 0.05x − 12.88, r2 = 0.549; yCAR = 0.89 p < 0.05x − 15.67, r2 = 0.548); the slopes between CON and CAR were not significantly different (p > 0.05). (e) Data statistics. Data are given as LS-means in (a) and (b), 1 pooled standard error.
Animals 10 00342 g003
Figure 4. (a) Respiratory rate, (b) heart rate, (c) primary rumen contractions and (d) rectal temperature of cows fed a non-supplemented (CON) or an L-carnitine-supplemented diet (25 g/d from 6 weeks ap up to week 15 pp, CAR). Data are given as LS-means. (e) Data statistics. 1 pooled standard error.
Animals 10 00342 g004
Figure 5. (a) Percentages of different categories (posture and behaviour, digestive system, respiratory system, circulatory system and rectal temperature) of cumulative score from maximum reachable score (29 points/100%) of cows fed a non-supplemented (CON) or an L-carnitine-supplemented diet (25 g/d from 6 weeks ap up to week 15 pp, CAR). (b) Data statistics. 1 pooled standard error.
Animals 10 00342 g005aAnimals 10 00342 g005b
Figure 6. Concentrations of (a) Nε-trimethyllysine (TML), (b) y-butyrobetaine (yBB), (c) acetylcarnitine and (d) L-carnitine in plasma of cows fed a non-supplemented (CON) or an L-carnitine-supplemented diet (25 g/d from 6 weeks ap up to week 15 pp, CAR). (e) Data statistics. Data are given as LS-means. 1 pooled standard error.
Animals 10 00342 g006aAnimals 10 00342 g006b
Figure 7. Serum concentrations of (a) non-esterified fatty acids (NEFA), (b) ß-hydroxybutyrate (BHB) and (c) triacylglycerides of cows fed a non-supplemented (CON) or an L-carnitine-supplemented diet (25 g/d from 6 weeks ap up to week 15 pp, CAR). (d) Data statistics. Data are given as LS-means. * symbol indicates significant differences between groups in a particular week according to the Tukey–Kramer test (p ≤ 0.05). 1 pooled standard error.
Animals 10 00342 g007
Figure 8. Changes in the (a) subcutaneous (SAT), (b) retroperitoneal (RAT), (c) omental (OAT), (d) mesenteric (MAT), (e) abdominal (AAT) adipose tissue masses and changes in masses of (f) SAT, RAT, OAT and MAT in sum of cows fed a non-supplemented (CON) or an L-carnitine-supplemented diet (25 g/d from 6 weeks ap up to week 15 pp, CAR), while positive values indicate a reduction and negative values indicate a gain of particular masses. (g) Data statistics. Period 1 = day 42 ap until day 3 pp, period 2 = day 3 pp until day 42 pp, period 3 = day 42 pp until day 100 pp. Data are given as LS-means ± standard error. 1 pooled standard error.
Animals 10 00342 g008aAnimals 10 00342 g008b
Table 1. Components and chemical compositions of concentrates and roughages in experimental diets.
Concentrate FeedRoughage
PMR 1CON 2CAR 3Maize SilageGrass Silage
Components (g/kg)
Soybean meal 50115115--
Rapeseed meal200150150--
Wheat190290290--
Maize248----
Barley190----
Dried sugar beet pulp50274267--
Urea304040--
Soybean oil 101515--
Calcium carbonate1234 --
Mineral feed premix 4-4040--
Mineral feed premix 520----
carnEon 20 RUMIN-PRO 6--83--
BergaFat F-100 HP 7-42---
Chemical composition
Dry matter (g/kg)884885886363368
Nutrient (g/kg DM 8)
Crude ash 621029340105
Crude protein27130331377150
Ether extract 4781793038
Crude fibre 608281204261
A 9 NDFom 10162194186414503
Acid detergent fibreom 1087111116237296
Starch447275278337-
Sugar487674--
Energy (MJ/kg DM) 11
NEL 127.88.07.96.56.1
ME 1312.212.712.710.810.3
Values are given as means. 1 partial mixed ration, 2 control group, 3 L-carnitine group, 4 ingredients per kg mineral feed according to the manufacturer’s specifications: 13 g Ca, 60 g P, 120 g Na, 60 g Mg, 6 g Zn, 4 g Mn, 1.25 g Cu, 100 mg I, 50 mg Se, 35 mg Co, 800,000 IU vitamin A, 100,000 IU vitamin D3, 2500 mg vitamin E, 5 ingredients per kg mineral feed according to the manufacturer’s specifications: 140 g Ca, 70 g P, 120 g Na, 40 g Mg, 6 g Zn, 5.4 g Mn, 1 g Cu, 100 mg I, 40 mg Se, 25 mg Co, 815,000 IU vitamin A, 100,000 IU vitamin D3, 1500 mg vitamin E, 6 rumen-protected formula for L-carnitine supplementation, Kaesler Nutrition GmbH, 27472 Cuxhaven, Germany, 20% L-carnitine, 80% fat, 7 fractionated palm fatty acid, Berg + Schmidt GmbH & Co. KG, 20099 Hamburg, Germany, palmitic acid min 98%, 8 dry matter, 9 assayed with a heat-stable amylase, 10 expressed exclusive of residual ash, 11 calculation based on equations of References [11,12,13], 12 net energy lactation, 13 metabolisable energy.

