Distribution of Superficial Body Temperature in Horses Ridden by Two Riders with Varied Body Weights

 ,
,
Abstract
:Simple Summary
Abstract
1. Introduction
2. Materials and Methods
2.1. Horses and Riders
2.2. The Experimental Design
3. Research Methods
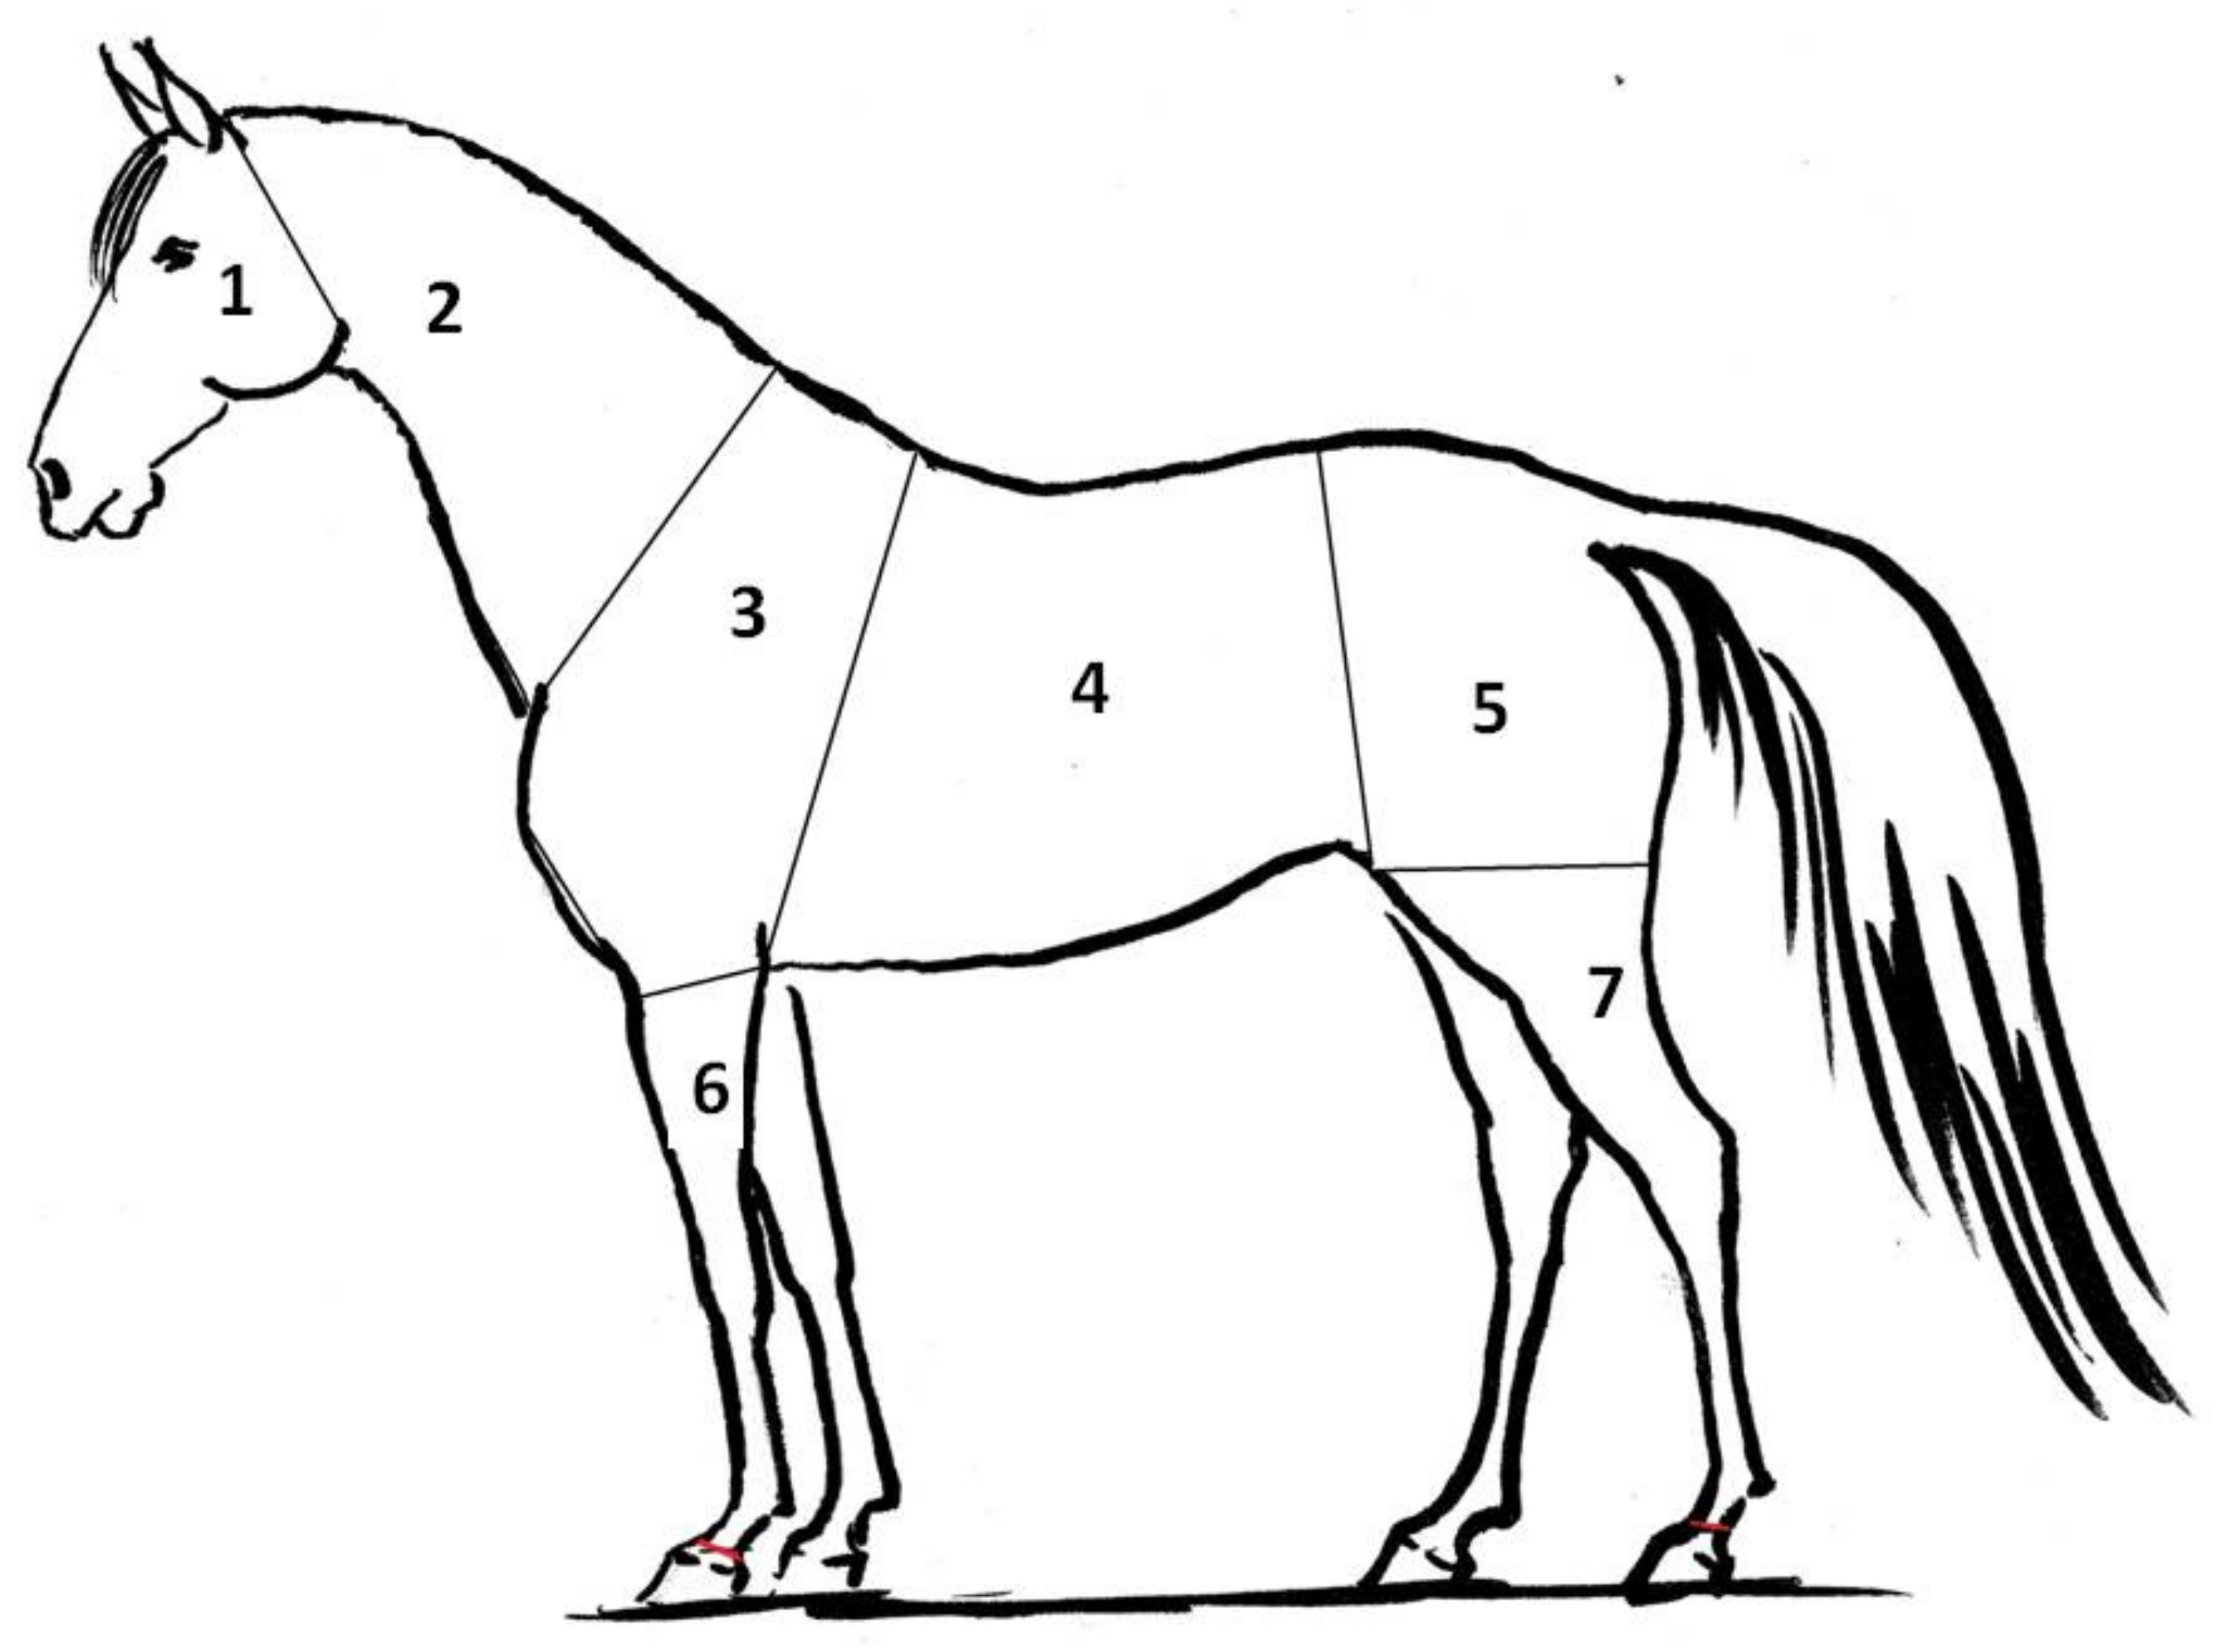
3.1. Body Temperature Measurements in Horses
- (1)
- Directly before saddling (resting superficial body temperature),
- (2)
- Directly after unsaddling (post-exercise superficial body temperature),
- (3)
- 10 min after unsaddling (recovery superficial body temperature).
3.2. Heart Rate Parameters
3.3. Statistical Methods
4. Results
5. Discussion
6. Conclusions
Author Contributions
Funding
Conflicts of Interest
References
- Mendes, M.; Santos, D. Childhood obesity: Problem present, future consequences. Investigação 2018, 17. [Google Scholar] [CrossRef]
- Pagan, J.; Hintz, H. Equine energetics. II. Energy expenditure in horses during submaximal exercise. J. Anim. Sci. 1986, 63, 822–830. [Google Scholar] [CrossRef] [PubMed] [Green Version]
- Powell, D.; Bennett-Wimbush, K.; Peeples, A.; Duthie, M. Evaluation of indicators of weight-carrying ability of light riding horses. J. Equine Vet. Sci. 2008, 28, 28–33. [Google Scholar] [CrossRef]
- Ille, N.; Aurich, C.; Erber, R.; Wulf, M.; Palme, R.; Aurich, J.; Von Lewinski, M. Physiological stress responses and horse rider interactions in horses ridden by male and female riders. Comp. Exerc. Physiol. 2014, 10, 131–138. [Google Scholar] [CrossRef]
- Halliday, E.; Randle, H. The horse and rider bodyweight relationship within the UK horse riding population. J. Vet. Behav. 2013, 8, e8–e9. [Google Scholar] [CrossRef]
- Dyson, S.; Ellis, A.; Mackechnie-Guire, R.; Douglas, J.; Bondi, A.; Harris, P. The influence of rider: Horse bodyweight ratio and rider-horse-saddle fit on equine gait and behaviour: A pilot study. Equine Vet. Educ. 2019, 1–15. [Google Scholar] [CrossRef] [Green Version]
- de Cocq, P.; Clayton, H.; Terada, K.; Muller, M.; van Leeuwen, J. Usability of normal force distribution measurements to evaluate asymmetrical loading of the back of the horse and different rider positions on a standing horse. Vet. J. 2009, 181, 266–273. [Google Scholar] [CrossRef]
- Greve, L.; Dyson, S. The horse-saddle-rider interaction. Vet. J. 2013, 195, 275–281. [Google Scholar] [CrossRef]
- Christensen, J.; Uldahl, M. Did you put on weight? The influence of increased rider weight on horse behavoural and physiological parameters. In Proceedings of the 15th International Equitation Science Conference: Bringing Science to the Stable, Guelph, ON, Canada, 19–21 August 2019; DuBois, C., Merkies, K., Widowski, T., Wentworth-Stanley, C., Eds.; University of Guelph: Guelph, ON, Canada, 2019; pp. 35–35. [Google Scholar]
- Snow, D.; Harris, R.; Gash, S. Metabolic response of equine muscle to intermittent maximal exercise. J. Appl. Physiol. 1985, 58, 1689–1697. [Google Scholar] [CrossRef]
- Hodgson, D.; McKeever, K.; McGowan, C. The Athletic Horse: Principles and Practice of Equine Sports Medicine, 2nd ed.; Elsevier Health Sciences: Amsterdam, The Netherlands, 2013. [Google Scholar]
- Nagashima, K. Central mechanisms for thermoregulation in a hot environment. Ind. Health 2006, 44, 359–367. [Google Scholar] [CrossRef] [Green Version]
- Carlomagno, G.; Cardone, G. Infrared thermography for convective heat transfer measurements. Exp. Fluids 2010, 49, 1187–1218. [Google Scholar] [CrossRef] [Green Version]
- von Schweinitz, D. Thermographic diagnostics in equine back pain. Vet. Clin. N. Am. Equine Pract. 1999, 15, 161–178. [Google Scholar] [CrossRef]
- Soroko, M.; Howell, K.; Dudek, K.; Henklewski, R.; Zielińska, P. The influence of breed, age, gender, training level and ambient temperature on forelimb and back temperature in racehorses. Anim. Sci. J. 2017, 88, 347–355. [Google Scholar] [CrossRef] [PubMed]
- Fonseca, B.; Alves, A.; Nicoletti, J.; Thomassian, A.; Hussni, C.; Mikail, S. Thermography and ultrasonography in back pain diagnosis of equine athletes. J. Equine Vet. Sci. 2006, 26, 507–516. [Google Scholar] [CrossRef]
- Michelotto, P.; Kozemjakin, D.; Granatto de Oliveira, E. Thermography and saddle fitting. Vet. Rec. 2016, 178, 173–174. [Google Scholar] [CrossRef] [PubMed]
- Tunley, B.; Henson, F. Reliability and repeteability of thermographic examination and the normal thermographic image of the thoracolumbar region in the horse. Equine Vet. J. 2004, 36, 306–312. [Google Scholar] [CrossRef]
- Yarnell, K.; Fleming, J.; Stratton, T.; Brassington, R. Monitoring changes in skin temperature associated with exercise in horses on a water treadmill by use of infrared thermography. J. Therm. Biol. 2014, 45, 110–116. [Google Scholar] [CrossRef] [Green Version]
- von Lewinski, M.; Biau, S.; Erber, R.; Ille, N.; Aurich, J.; Faure, J.; Aurich, C. Cortisol release, heart rate and heart rate variability in the horse and its rider: Different responses to training and performance. Vet. J. 2013, 197, 229–232. [Google Scholar] [CrossRef]
- von Borell, E.; Langbein, J.; Després, G.; Hansen, S.; Leterrier, C.; Marchant-Forde, J.; Valance, D. Heart rate variability as a measure of autonomic regulation of cardiac activity for assessing stress and welfare in farm animals—A review. Physiol. Behav. 2007, 92, 293–316. [Google Scholar] [CrossRef]
- Janczarek, I.; Wilk, I.; Kędzierski, W.; Stachurska, A.; Kowalik, S. Off track training ameliorates emotional excitability in Purebred Arabian racehorses. Can. J. Anim. Sci. 2016, 97, 42–50. [Google Scholar] [CrossRef]
- Visser, E.; Van Reenen, C.; Van der Werf, J.; Schilder, M.; Knaap, J.; Barneveld, A.; Blokhuis, H. Heart rate and heart rate variability during a novel object test and a handling test in young horses. Physiol. Behav. 2002, 76, 289–296. [Google Scholar] [CrossRef]
- Garlinghouse, S.; Burrill, M. Relationship of body condition score to completion rate during 160 km endurance races. Equine Vet. J. 1999, 31, 591–595. [Google Scholar] [CrossRef] [PubMed]
- Soroko, M.; Morel, M. Equine Thermography in Practice; CABI: Wallingford, UK, 2016. [Google Scholar]
- Turner, T.; Waldsmith, J.; Wilson, J. How to assess saddle fit in horses. Am. Assoc. Equine Pract. 2004, 50, 196–201. [Google Scholar]
- SAS Institute Inc. CNU SAS User’s Guide Statistics: Version 9.1.3; SAS Institute Inc.: Cary, NC, USA, 2003. [Google Scholar]
- Jodkowska, E.; Dudek, K.; Przewozny, M. The maximum temperatures (Tmax) distribution on the body surface of sport horses. J. Life Sci. 2011, 5, 291–297. [Google Scholar]
- Waldsmith, J.; Oltmann, J. Thermography: Subclinical inflammation, diagnosis, rehabilitation, and athletic evaluation. J. Equine Vet. Sci. 1994, 14, 8–10. [Google Scholar] [CrossRef]
- Webb, L. Build a Better Athlete! 16 Gymnastics Exercises for Your Horse; Trafalgar Square Books: North Pomfret, VT, USA, 2007. [Google Scholar]
- Morgan, K.; Funkquist, P.; Nyman, G. The effect of coat clipping on thermoregulation during intense exercise in trotters. Equine Vet. J. 2002, 34, 564–567. [Google Scholar] [CrossRef] [PubMed]
- Borodulin-Nadzieja, L.; Janocha, A.; Pietraszkiewicz, T.; Salomon, E.; Stańda, M. Wpływ pracy w kabinach klimatyzowanych i pobytu w kabinie wypoczynkowej na ciśnienie tętnicze i częstość skurczów serca u operatorów zatrudnionych na głęboko położonych stanowiskach pracy kopalni miedzi. Med. Pr. 2001, 1, 7–14. [Google Scholar]
- Marlin, D. Thermoregulation in the Horse at Rest and during Exercise. In Nutrition of the Exercising Horse; Saastamoinen, M., Martin-Rosset, W., Eds.; EAAP Publication: Rome, Italy, 2008; pp. 71–82. [Google Scholar]
- Podolak, M.; Kędzierski, W.; Janczarek, I. Intense training of Arabian horses and its effect on the level of selected biochemical indices in their blood and heart rate. Med. Weter. 2004, 60, 403–406. [Google Scholar]


| Horses | Rider No 1 | Rider No 2 | |||
|---|---|---|---|---|---|
| Average height at the withers ± SD (cm) | Average body weight ± SD (kg) | Body weight with saddle (kg)/% body weight of horse | Height (cm) | Body weight with saddle (kg)/% body weight of horse | Height (cm) |
| 163.4 ± 2.11 | 469.4 ± 32.8 | 100/21.3 | 178 | 50/10.6 | 158 |
| Day of the Study | Description and Air Temperature (°C) | Relative Air Humidity (%) | Wind Speed (m/s) | Atmospheric Pressure (hPa) |
|---|---|---|---|---|
| First day | Cloudy, 21 | 45 | 2 | 1022 |
| Second day | Cloudy, 22 | 47 | 2 | 1018 |
| Sources of Variation | Df | F | p |
|---|---|---|---|
| Superficial body temperatures | |||
| rider | 1 | 17.02 | 0.0194 |
| body part | 6 | 11.78 | 0.0000 |
| subsequent measurement | 2 | 250.73 | 0.0000 |
| rider * body part | 6 | 13.96 | 0.0000 |
| subsequent measurement * rider | 2 | 167.21 | 0.0315 |
| subsequent measurement * body part | 12 | 2.67 | 0.0021 |
| rider * body part * subsequent measurement | 12 | 4.94 | 0.0078 |
| Rectal body temperature | |||
| rider | 1 | 0.46 | 0.5057 |
| subsequent measurement | 2 | 21.21 | 0.0084 |
| rider * subsequent measurement | 2 | 19.7 | 0.0394 |
| HR | |||
| rider | 1 | 6.03 | 0.0378 |
| subsequent measurement | 2 | 40.76 | 0.0000 |
| rider * subsequent measurement | 2 | 23.28 | 0.0000 |
| rMSSD | |||
| rider | 1 | 4.72 | 0.0457 |
| subsequent measurement | 2 | 8.45 | 0.0009 |
| rider * subsequent measurement | 2 | 5.17 | 0.0399 |
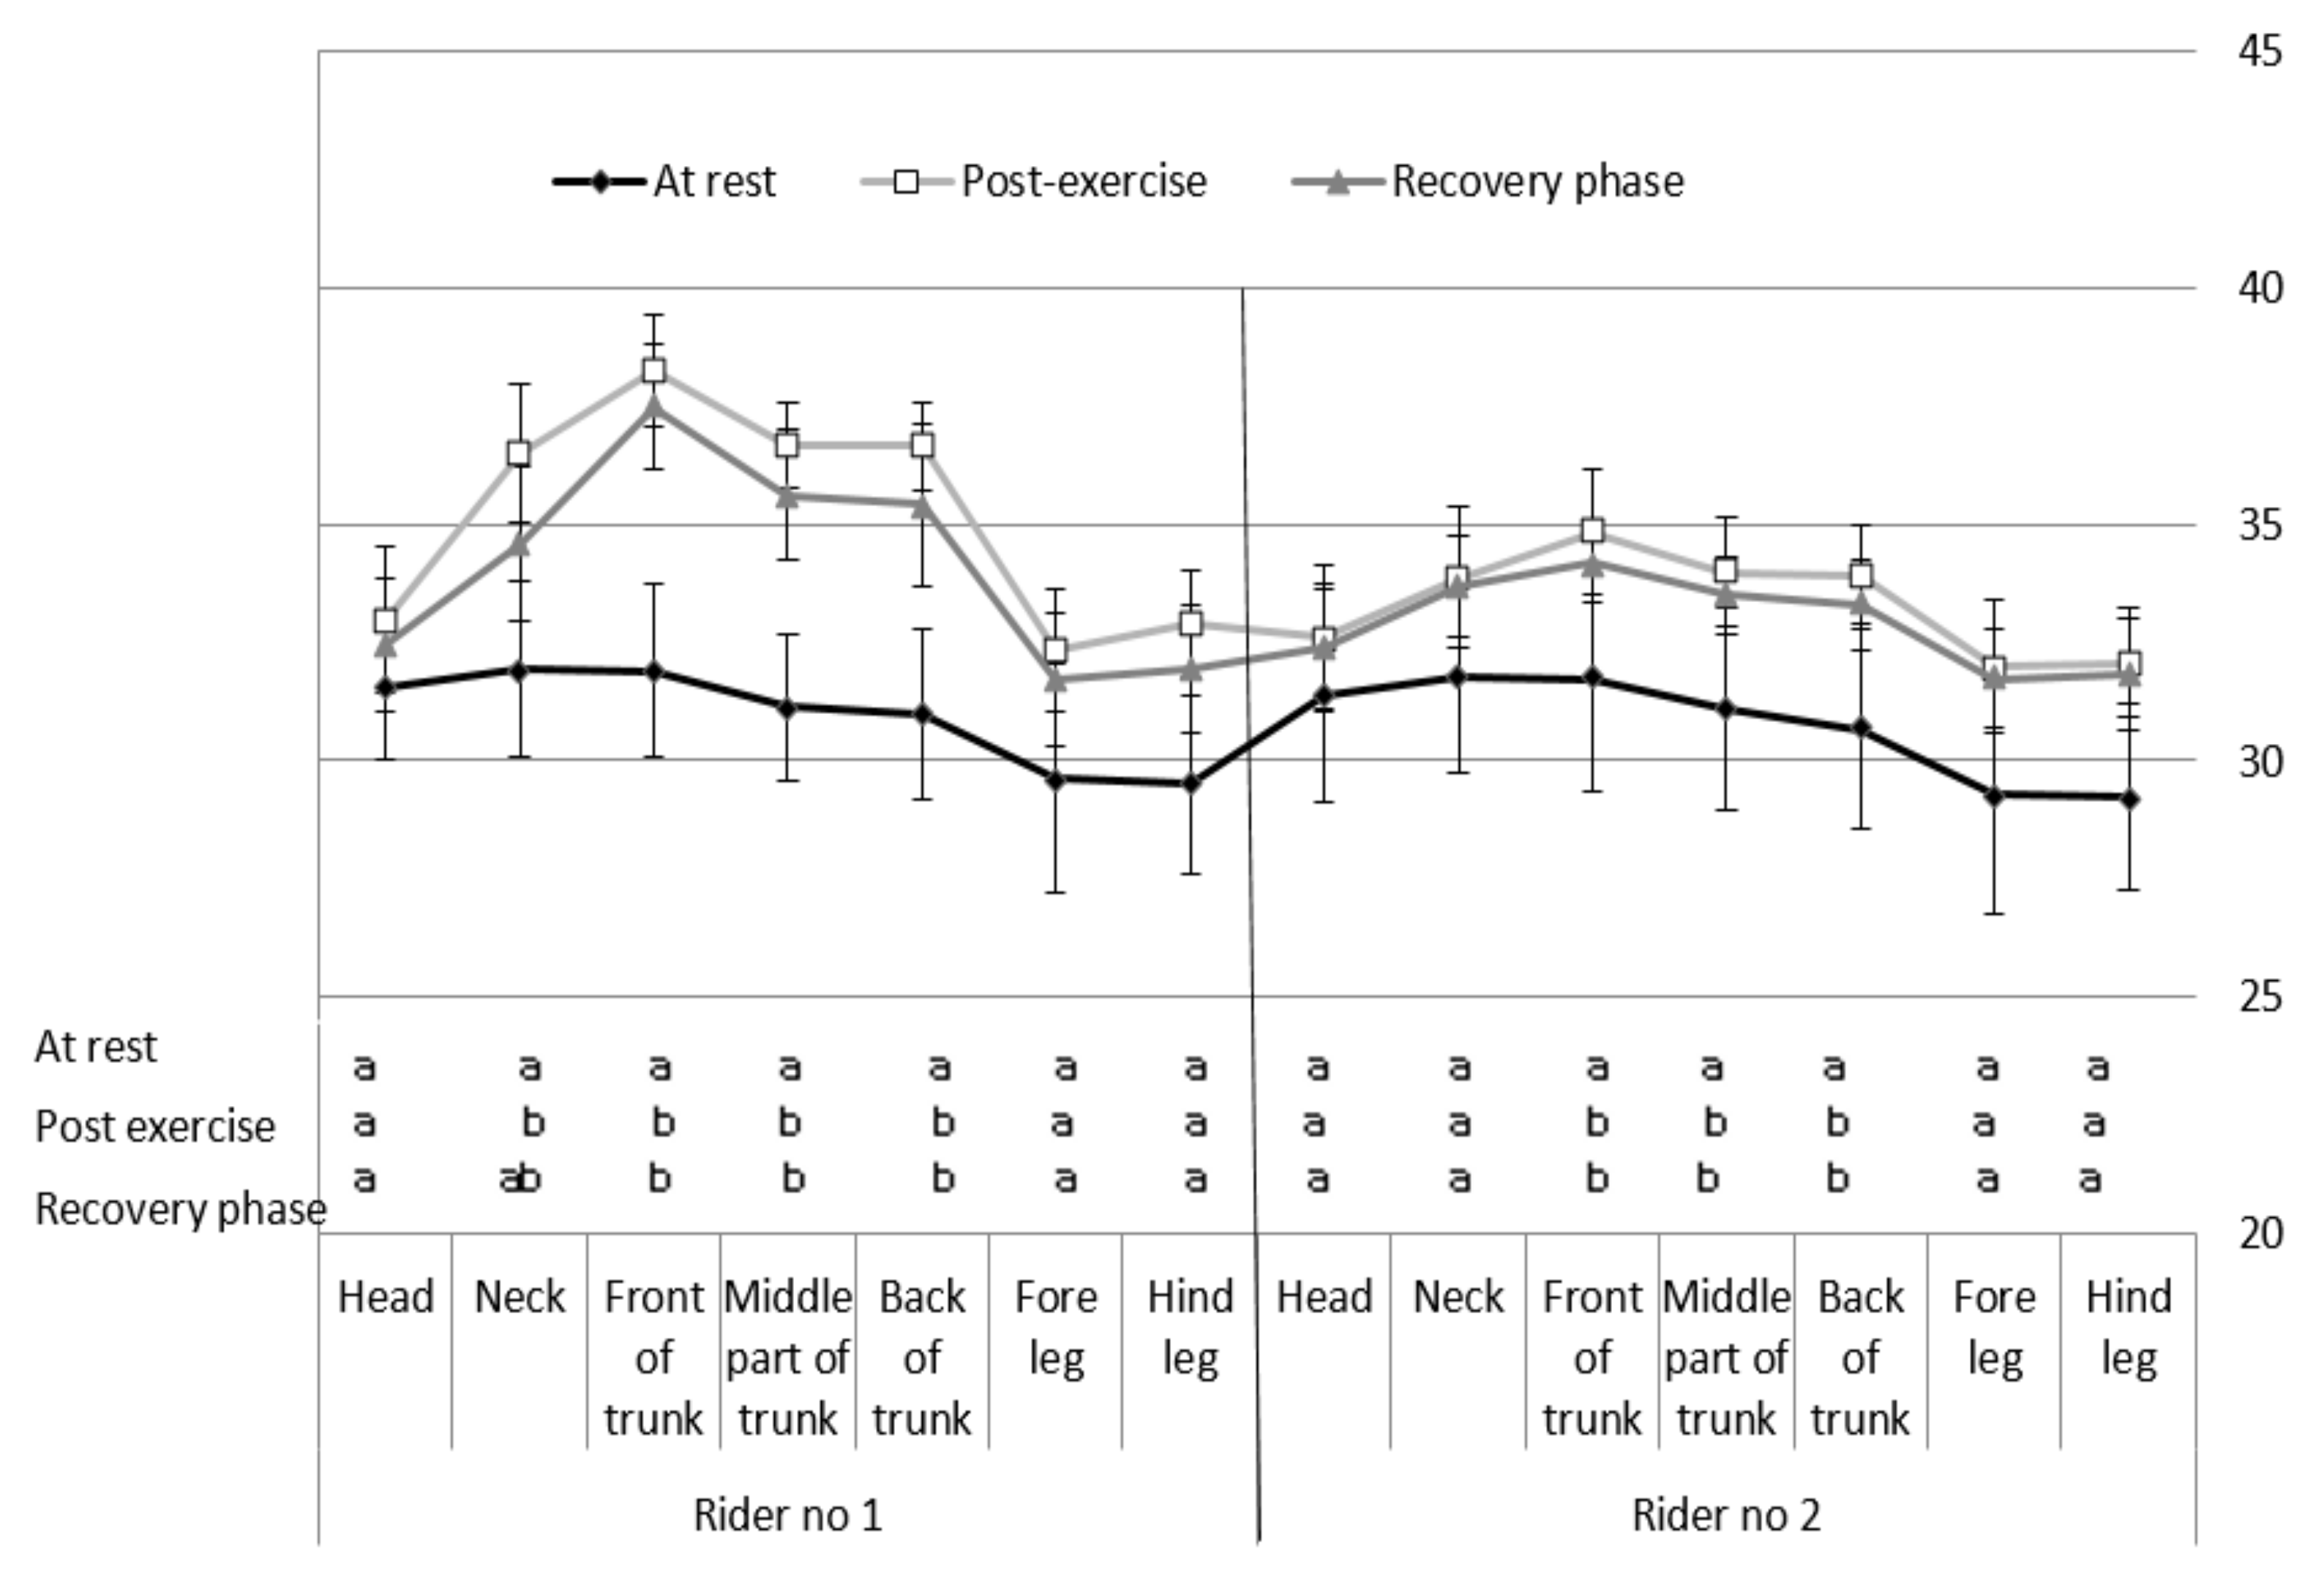
| Body Part | Head | Neck | Front of Trunk | Middle Part of Trunk | Back of Trunk | Foreleg | Hind Leg |
|---|---|---|---|---|---|---|---|
| Rider no 1 20% BW | 31.6 ± 1.55 a | 31.9 ± 1.86 a | 31.9 ± 1.83 a | 31.1 ± 1.54 ab | 31.0 ± 1.79 ab | 29.6 ± 2.44 b | 29.5 ± 1.91 b |
| Rider no 2 10% BW | 31.4 ± 2.06 a | 31.8 ± 2.03 a | 31.7 ± 2.37 a | 31.1 ± 2.15 ab | 30.7 ± 2.13 ab | 29.3 ± 2.03 b | 29.2 ± 1.98 b |
| Body Part | Head | Neck | Front of Trunk | Middle Part of Trunk | Back of Trunk | Foreleg | Hind Leg |
|---|---|---|---|---|---|---|---|
| Rider no 1 20% BW | 33.0 ± 1.43 ax | 36.5 ± 1.62 bx | 38.3 ± 1.30 cx | 36.7 ± 1.40 bx | 36.7 ± 1.71 bx | 32.4 ± 1.41 ax | 32.9 ± 1.37 ax |
| Rider no 2 10% BW | 32.6 ± 1.35 ax | 32.9 ± 1.05 ay | 34.8 ± 0.85 by | 34.0 ± 0.81 by | 33.9 ± 0.96 by | 32.0 ± 1.05 ax | 32.1 ± 1.19 ax |
| Body Part | Head | Neck | Front of Trunk | Middle Part of Trunk | Back of Trunk | Foreleg | Hind Leg |
|---|---|---|---|---|---|---|---|
| Rider no 1 20% BW | 32.5 ± 1.53 ax | 34.6 ± 1.46 bx | 37.5 ± 1.18 cx | 35.6 ± 0.88 bx | 35.4 ± 0.92 bx | 31.7 ± 1.29 ax | 31.9 ± 1.13 ax |
| Rider no 2 10% BW | 32.4 ± 1.52 ax | 33.7 ± 1.49 bx | 34.2 ± 1.33 by | 33.5 ± 1.14 aby | 32.4 ± 1.06 ay | 31.7 ± 1.41 ax | 31.8 ± 1.16 ax |
| Body Temperature (°C) | HR (bpm) | rMSSD (ms) | |||||||||
|---|---|---|---|---|---|---|---|---|---|---|---|
| At rest | Post-exercise | Recovery phase | p | At rest | Post-exercise | Recovery phase | p | At rest | Post-exercise | Recovery phase | |
| Rider no 1 20% BW | 37.2 ± 0.58 ax | 38.9 ± 0.61 bx | 38.7 ± 0.66 bx | 0.054 | 39.3 ± 4.97 ax | 117.4 ± 11.6 bx | 67.4 ± 8.63 cx | 0.009 | 105.0 ± 104.2 ax | 114.0 ± 83.9 ax | 107.2 ± 94.6 ax |
| Rider no 2 10% BW | 37.4 ± 0.71 ax | 38.6 ± 0.57 bx | 38.4 ± 0.64 bx | 0.057 | 41.8 ± 10.4 ax | 81.8 ± 11.6 by | 48.7 ± 7.39 ay | 0.062 | 104.0 ± 153.9 ax | 224.0 ± 106.9 by | 222.6 ± 101.9 by |
© 2020 by the authors. Licensee MDPI, Basel, Switzerland. This article is an open access article distributed under the terms and conditions of the Creative Commons Attribution (CC BY) license (http://creativecommons.org/licenses/by/4.0/).
Share and Cite
Wilk, I.; Wnuk-Pawlak, E.; Janczarek, I.; Kaczmarek, B.; Dybczyńska, M.; Przetacznik, M. Distribution of Superficial Body Temperature in Horses Ridden by Two Riders with Varied Body Weights. Animals 2020, 10, 340. https://doi.org/10.3390/ani10020340
Wilk I, Wnuk-Pawlak E, Janczarek I, Kaczmarek B, Dybczyńska M, Przetacznik M. Distribution of Superficial Body Temperature in Horses Ridden by Two Riders with Varied Body Weights. Animals. 2020; 10(2):340. https://doi.org/10.3390/ani10020340
Chicago/Turabian StyleWilk, Izabela, Elżbieta Wnuk-Pawlak, Iwona Janczarek, Beata Kaczmarek, Marta Dybczyńska, and Monika Przetacznik. 2020. "Distribution of Superficial Body Temperature in Horses Ridden by Two Riders with Varied Body Weights" Animals 10, no. 2: 340. https://doi.org/10.3390/ani10020340