To Provide a Double Feeder in Growing Pigs Housed under High Environmental Temperatures Reduces Social Interactions but Does Not Improve Weight Gains

 , , and
Abstract
:Simple Summary
Abstract
1. Introduction
2. Materials and Methods
2.1. Animals and Experiment Design
2.2. Body Weight
2.3. Blood samples
2.4. Hair Samples
2.5. Pig Behavior
2.6. Carcass and Meat Quality
2.7. Statistical Analysis
3. Results
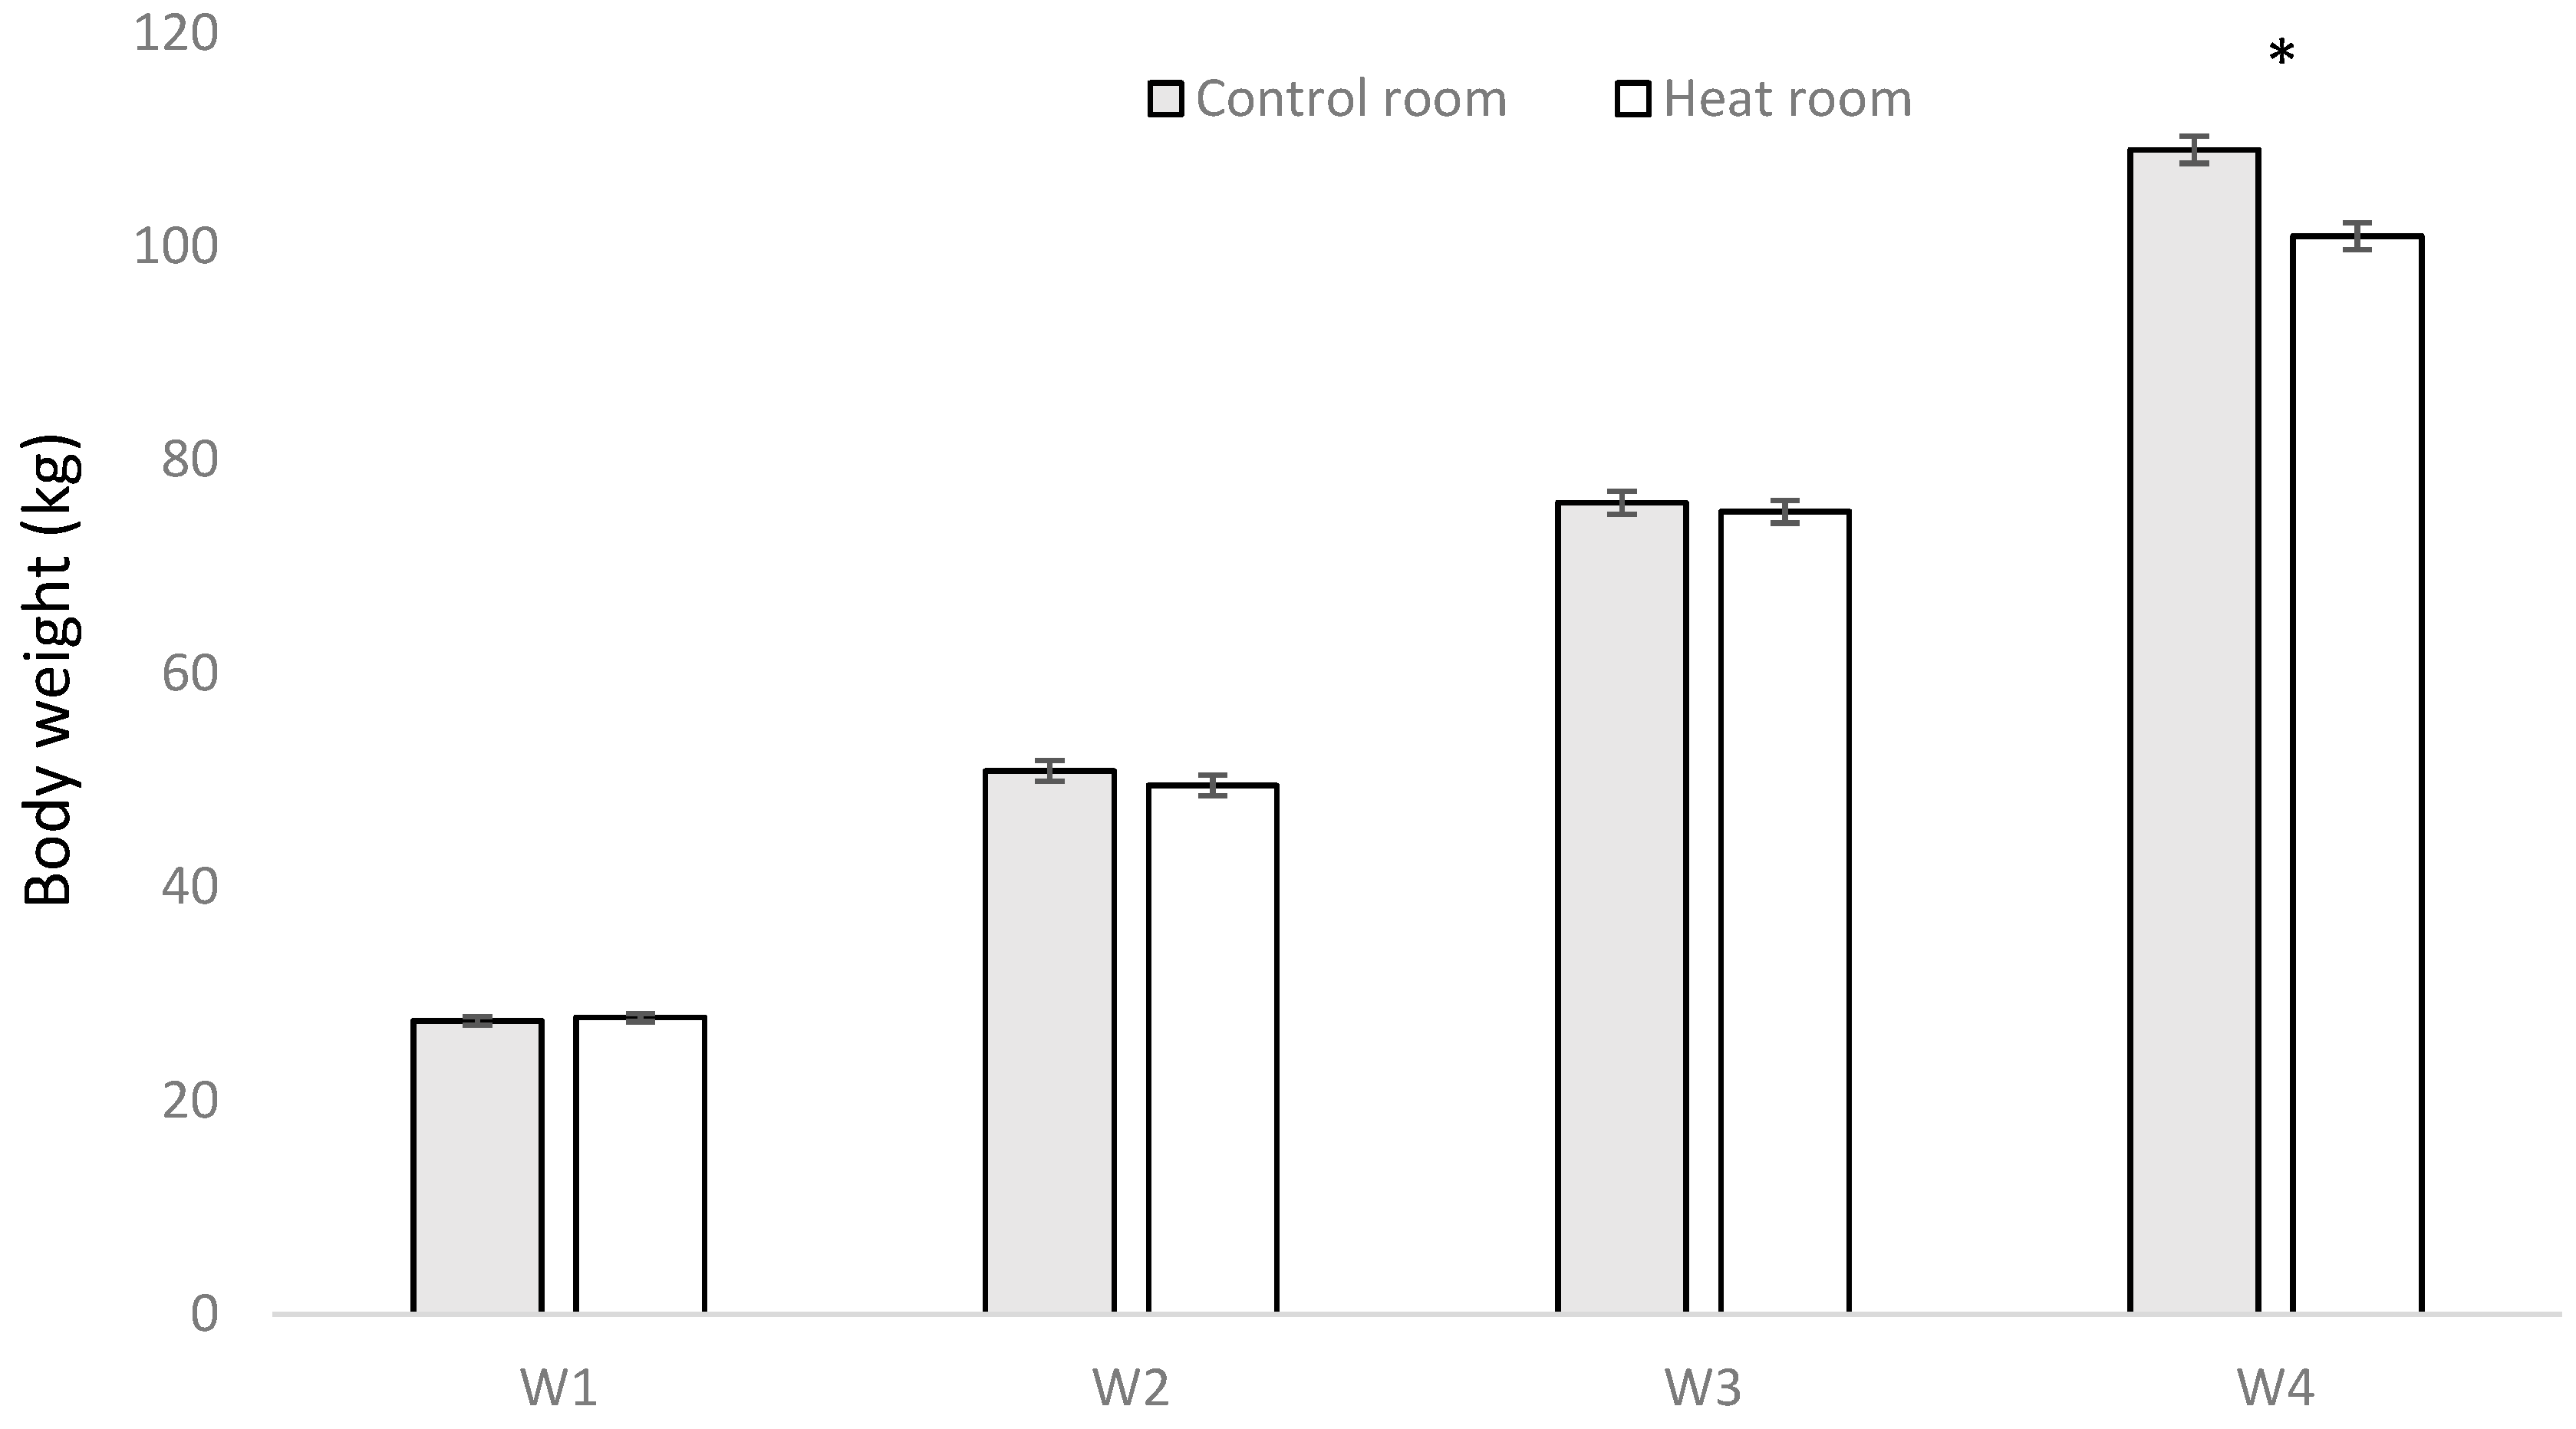
3.1. Body Weight
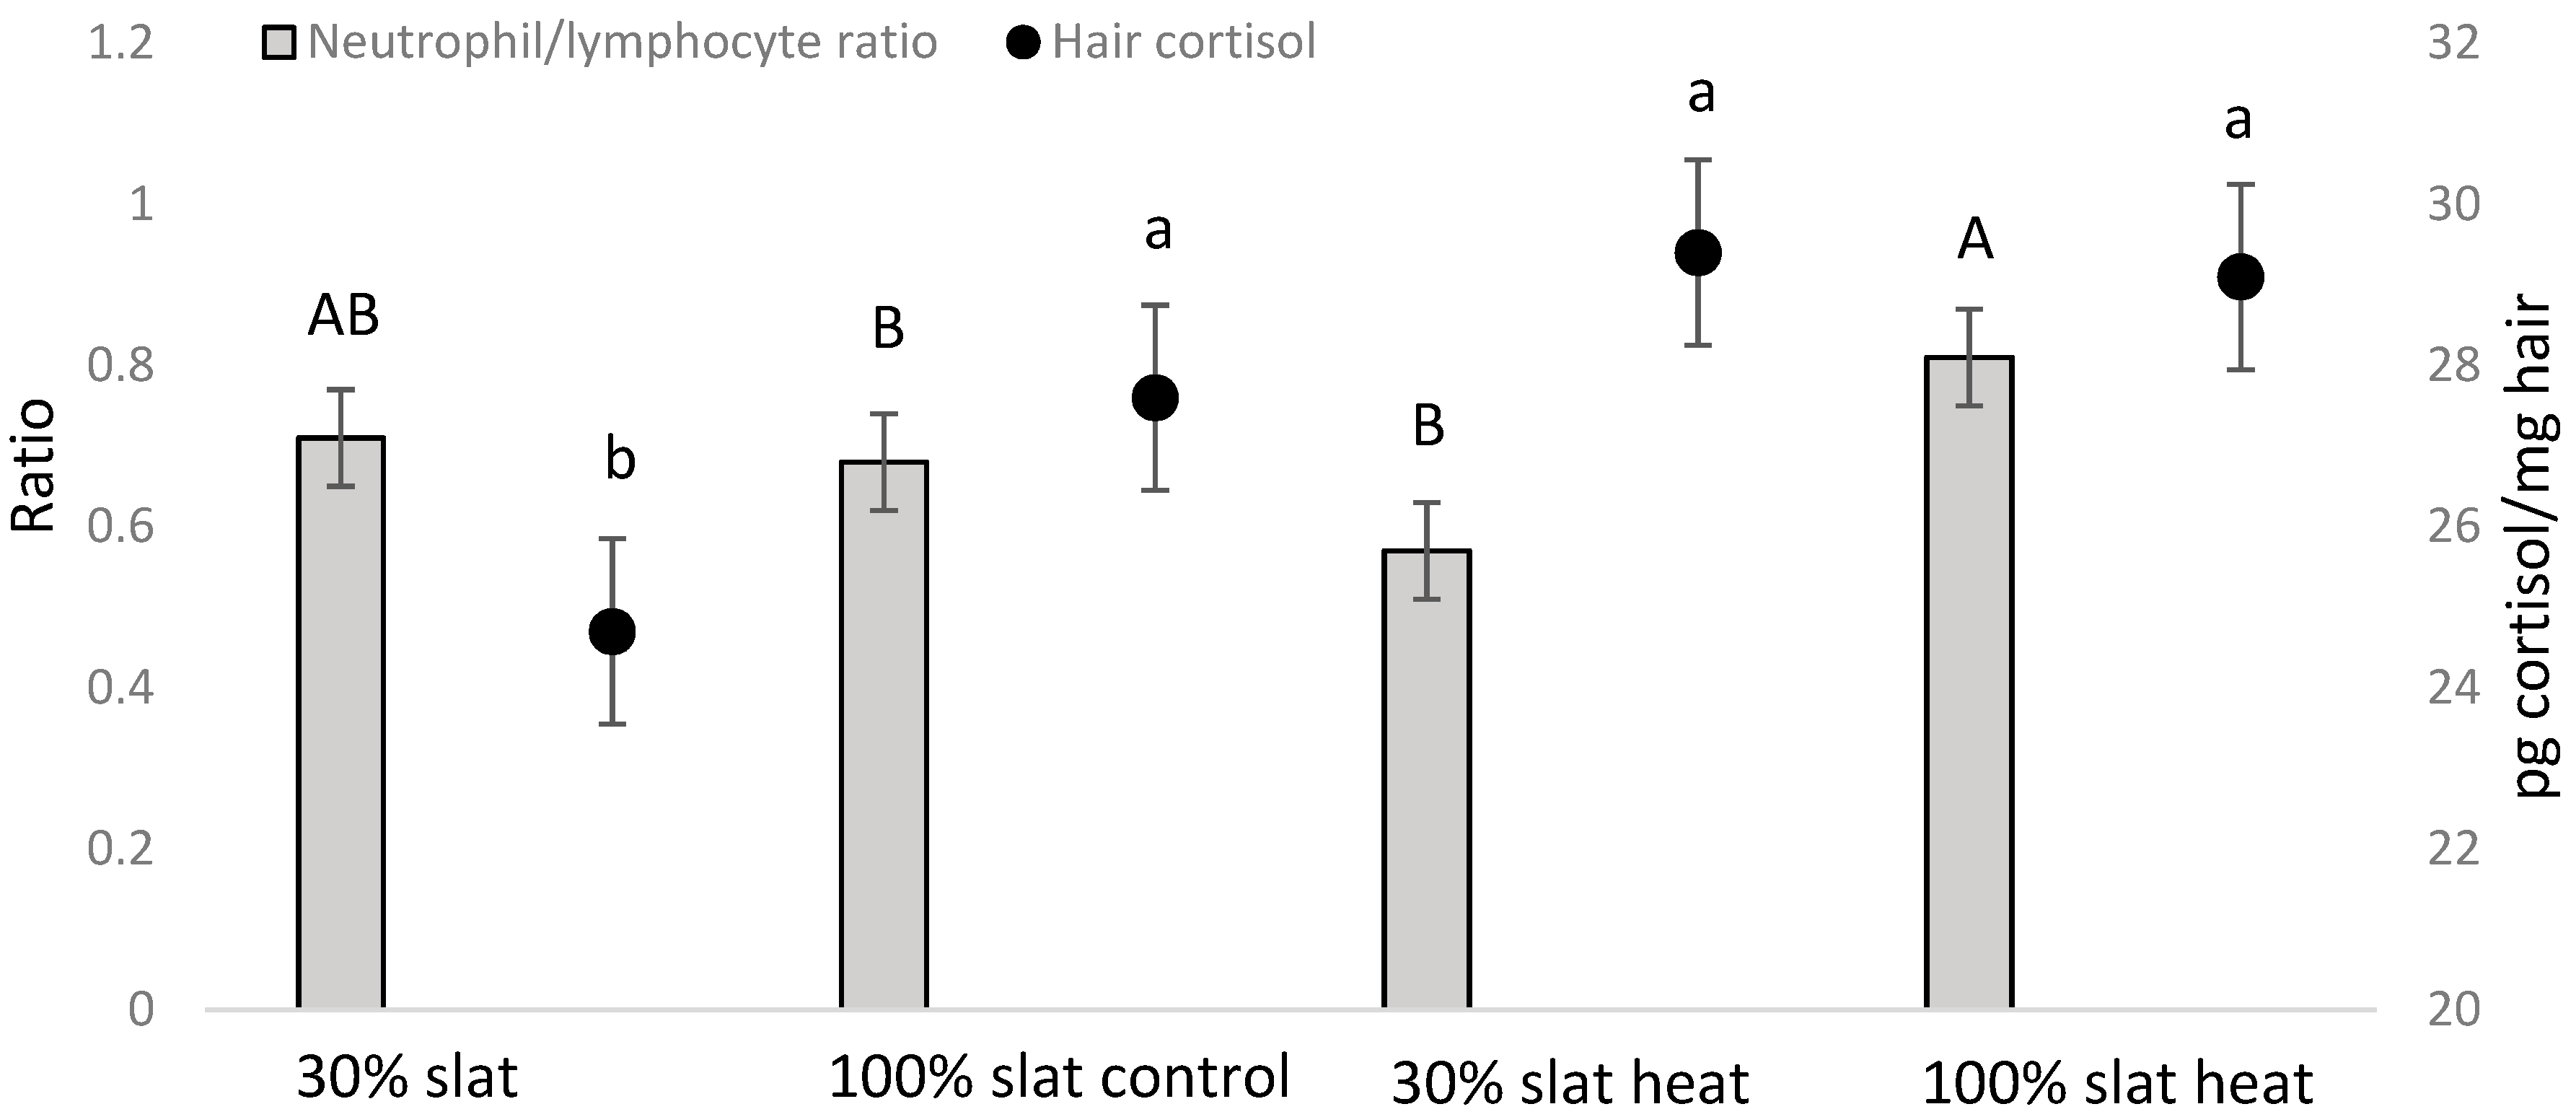
3.2. Hematological Parameters and Hair Cortisol
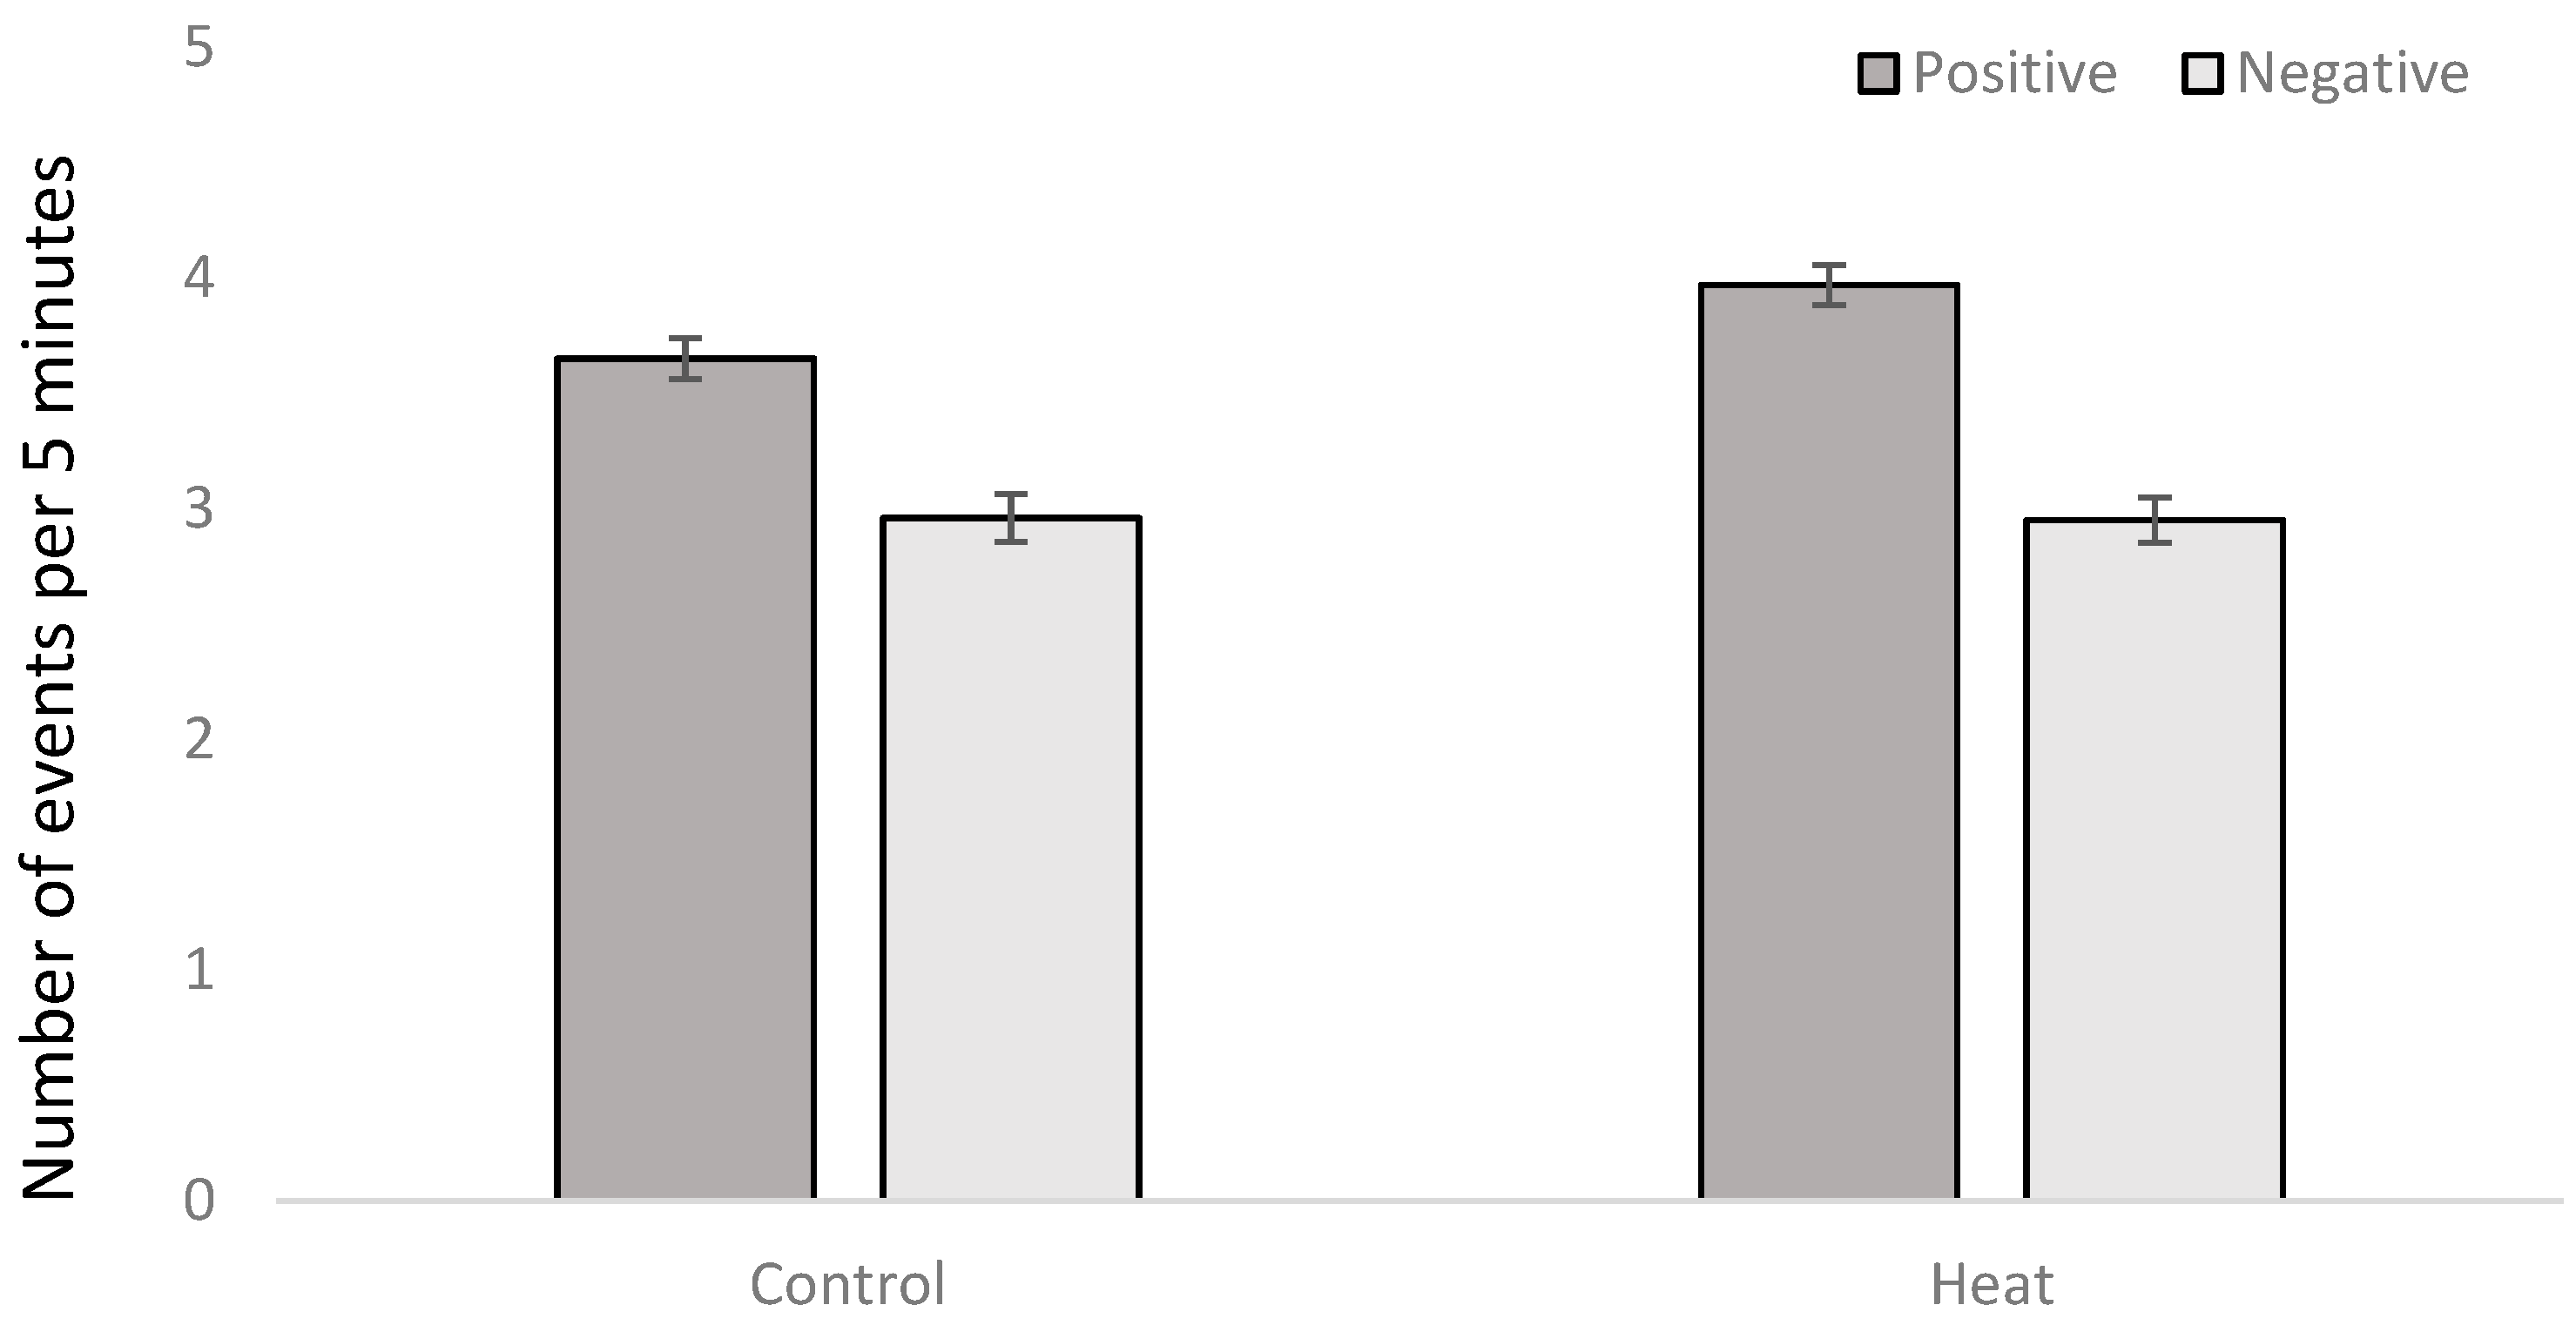
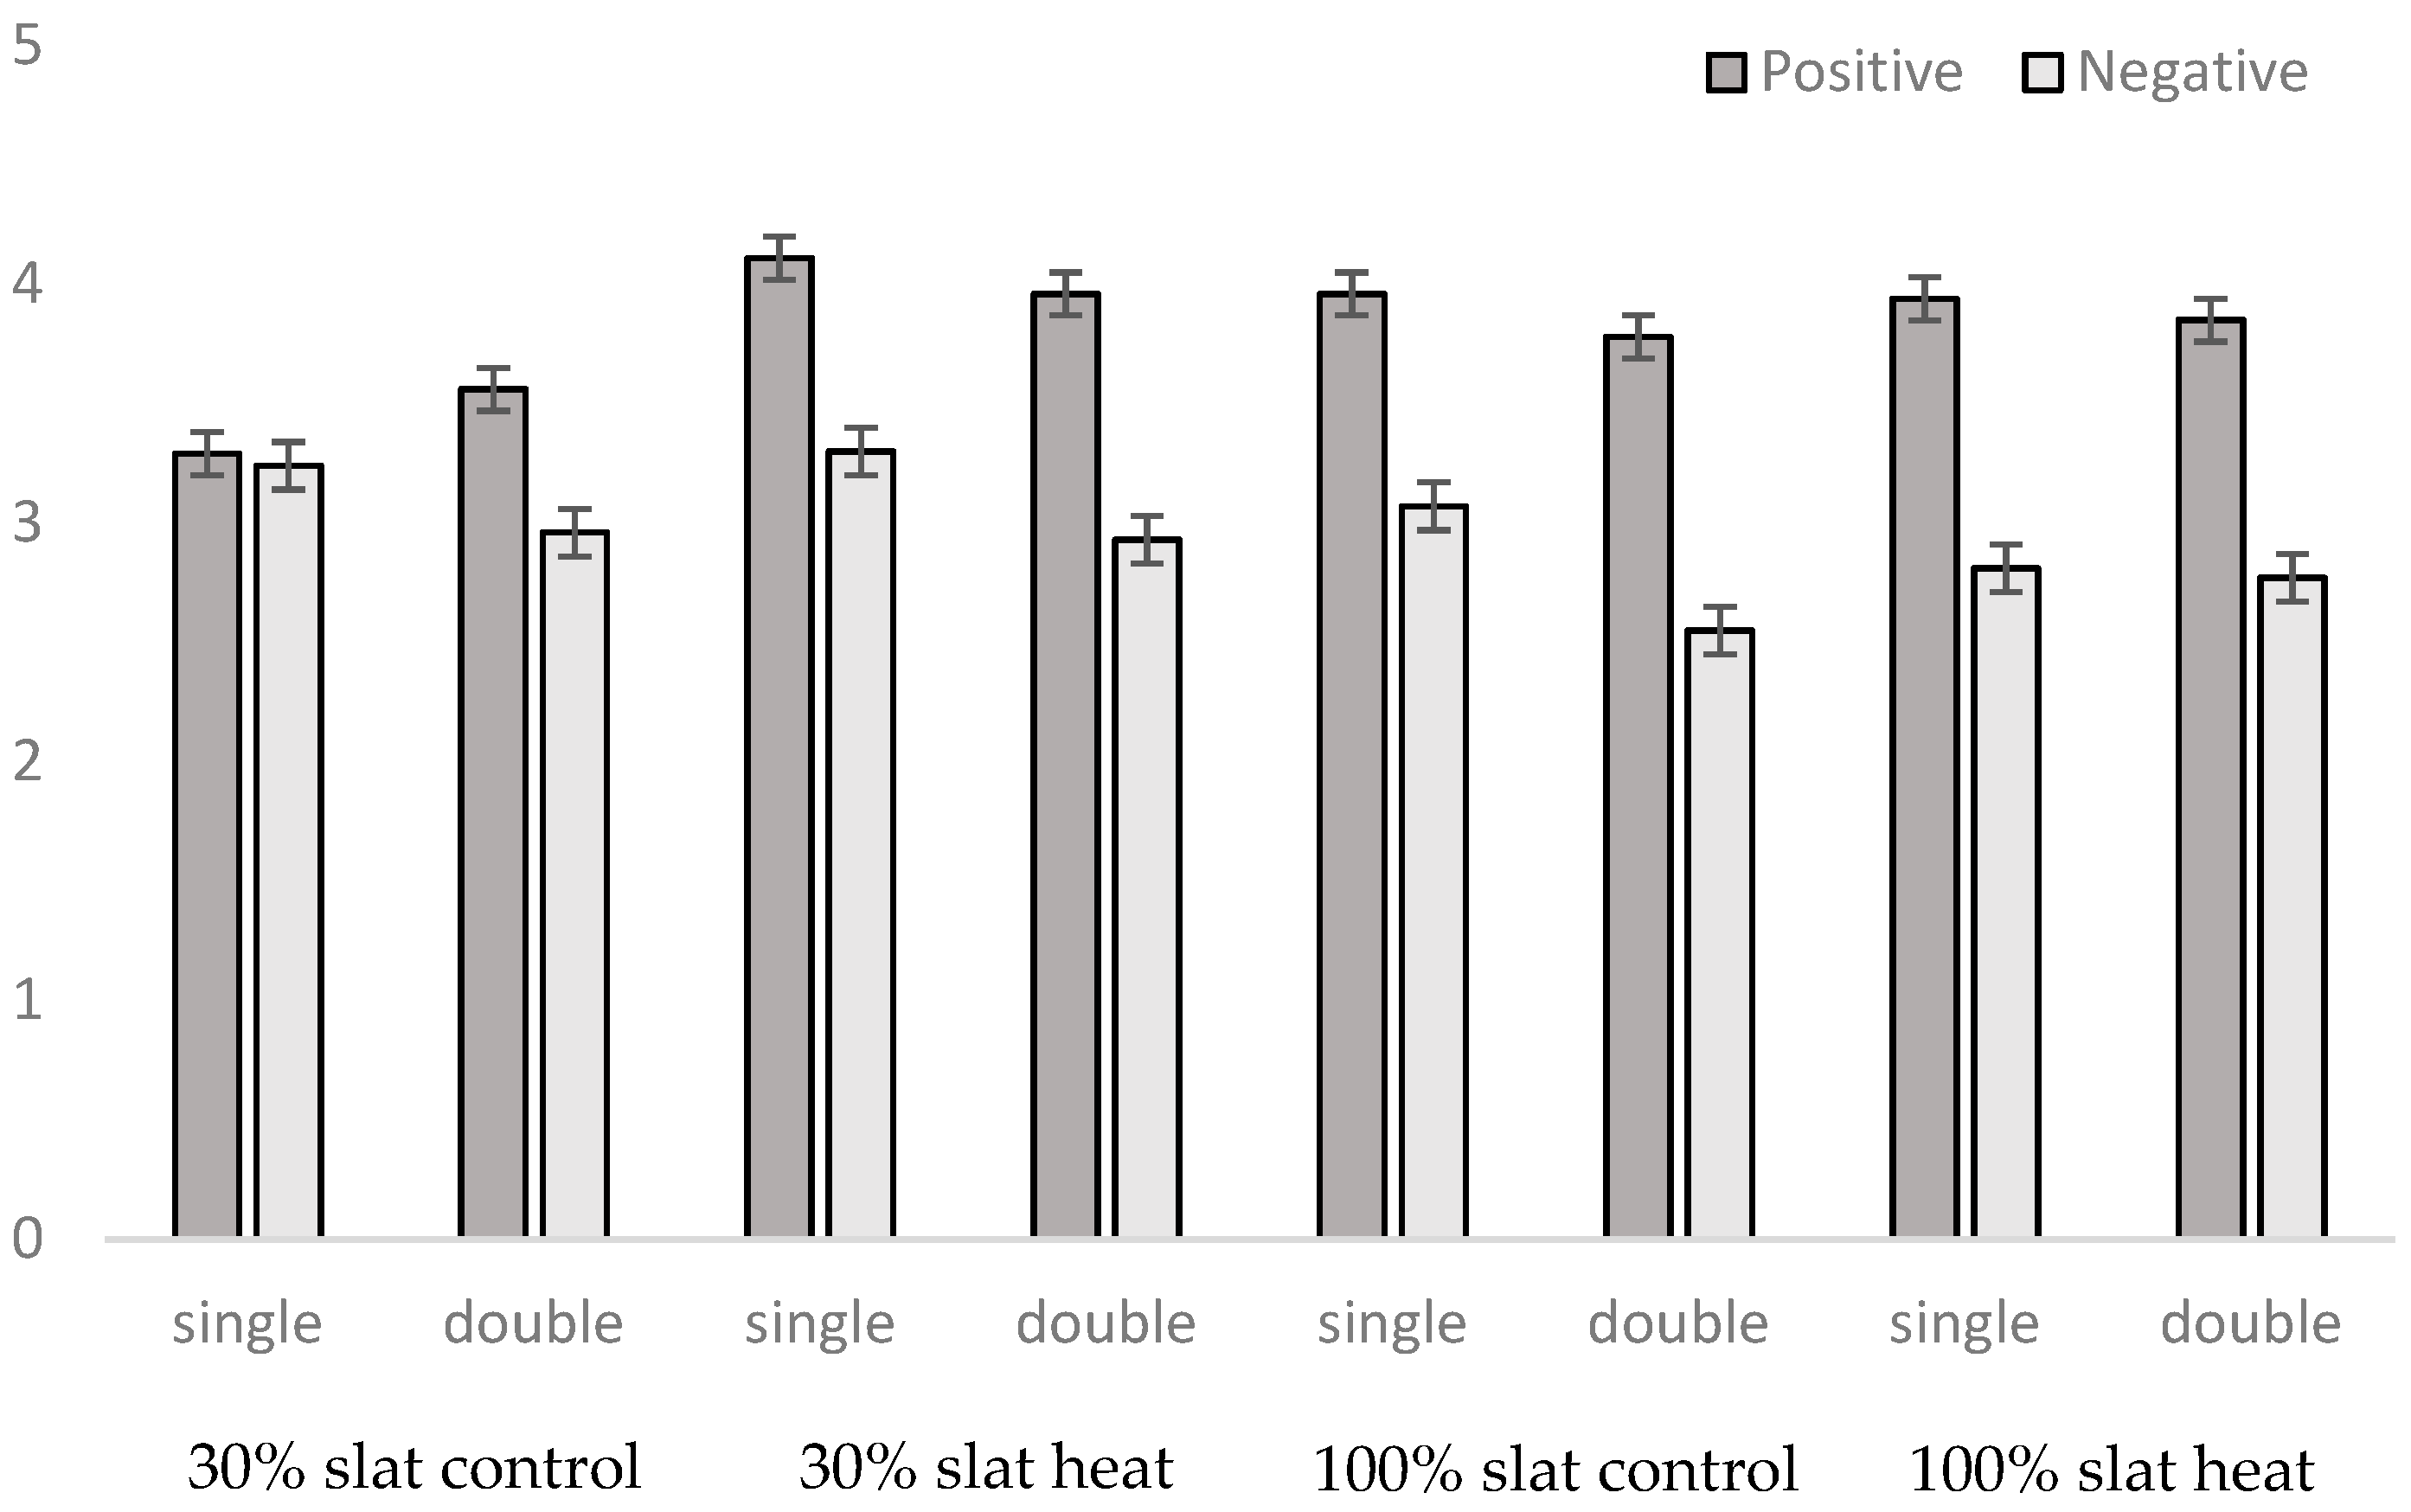
3.3. Behavioral Observations
3.4. Carcass and Meat Quality
4. Discussion
5. Conclusions
Author Contributions
Funding
Acknowledgments
Conflicts of Interest
References
- IPCC. Climate Change 2007: The Physical Science Basis. Contribution of Working Group I to the Fourth Assessment Report of the Intergovernmental Panel on Climate Change; Solomon, S., Qin, D., Manning, M., Chen, Z., Marquis, M., Tignor, K.B.M., Miller, H.L., Eds.; Cambridge University Press: Cambridge, UK, 2007. [Google Scholar]
- Cervantes, M.; Cota, M.; Arce, N.; Castillo, G.; Avelar, E.; Espinoza, S.; Morales, A. Effect of heat stress on performance and expression of selected amino acid and glucose transporters, HSP90, leptin and ghrelin in growing pigs. J. Therm. Biol. 2016, 59, 69–76. [Google Scholar] [CrossRef] [PubMed]
- Jócsák, I.; Tossenberger, J.; Végvari, G.; Sudár, G.; Varga-Visi, E.; Tóth, T. How is the effect of phytogenic feed supplementation tested in heat stressed pigs? Methodological and sampling considerations. Agriculture 2020, 10, 257. [Google Scholar] [CrossRef]
- Ciscar, J.C.; Iglesias, A.; Feyen, L.; Szabó, L.; Van Regemorter, D.; Amelung, B.; Nicholls, R.; Watkiss, P.; Christensen, O.B.; Dankers, R.; et al. Physical and economic consequences of climate change in Europe. Proc. Natl. Acad. Sci. USA 2010, 108, 2678–2683. [Google Scholar] [CrossRef] [PubMed] [Green Version]
- Bellego, L.; Van Milgen, J.; Noblet, J. Effect of high temperature and low-protein diets on the performance of growing-finishing pigs. J. Anim. Sci. 2002, 80, 691–701. [Google Scholar] [CrossRef]
- Wilson, T.E.; Crandell, C.G. Effect of Thermal Stress on Cardiac Function. Exerc. Sport Sci. Rev. 2011, 39, 12–17. [Google Scholar] [CrossRef] [Green Version]
- Huynh, T.T.T.; Aarnink, A.J.A.; Verstegen, M.W.A.; Gerrits, W.J.J.; Heetkamp, M.J.W.; Canh, T.T. Effects of increasing temperatures on physiological changes in pigs at different relative humidities. J. Anim. Sci. 2005, 83, 1385–1396. [Google Scholar] [CrossRef]
- Renaudeau, D.; Collin, A.; Yahav, S.; de Basilio, V.; Gourdine, J.L.; Collier, R. Adaptation to hot climate and strategies to alleviate heat stress in livestock production. Animal 2012, 6, 707–728. [Google Scholar] [CrossRef] [Green Version]
- Puppe, B.; Tuchscherer, M.; Tuchscherer, A. The effect of housing conditions and social environment immediately after weaning on the agonistic behaviour, neutrophil / lymphocyte ratio, and plasma glucose level in pigs. Livest. Prod. Sci. 1997, 48, 157–164. [Google Scholar] [CrossRef]
- Blecha, F. Immune System Responses to Stress. In The Biology of Animal Stress; Moberg, G.P., Mnch, J.A., Eds.; CABI International: Oxon, UK, 2000; pp. 111–121. [Google Scholar]
- Casal, N.; Manteca, X.; Peña, R.; Bassols, A.; Fàbrega, E. Analysis of cortisol in hair samples as an indicator of stress in pigs. J. Vet. Behav. 2017, 19, 1–6. [Google Scholar] [CrossRef]
- Aarnink, A.J.A.; Schrama, J.W.; Verheijen, R.J.E.; Stefanowska, J. Pen fouling in pig houses affected by temperature. In Proceedings of the 6th International Symposium on Livestock Environment VI, Louisville, KY, USA, 21–23 May 2001; Stowell, R.R., Bucklin, R., Bottcher, R.W., Eds.; [Google Scholar]
- Martinez-Macipe, M.; Mainau, E.; Manteca, X.; Dalmau, A. Environmental and management factors affecting the time budgets of free-ranging Iberian pigs reared in Spain. Animals 2020, 10, 798. [Google Scholar] [CrossRef]
- Dalmau, A.; Borges, T.D.; de Mercado, E.; González, J.; Mateos-San Juan, A.; Huerta-Jiménez, M.; Gómez-Izquierdo, E.; Lizardo, R.; Pallisera, J.; Borrisser-Pairó, F.; et al. Effect of environmental temperature, floor type and breed on skatole and indole concentrations in fat of females, immune-castrated and entire males. Livest. Sci. 2019, 220, 46–51. [Google Scholar] [CrossRef] [Green Version]
- Quiniou, N.; Dubois, S.; Noblet, J. Voluntary feed intake and feeding behavior of group-housed growing pigs are affected by ambient temperature and body weight. Livest. Prod. Sci. 2000, 63, 245–253. [Google Scholar] [CrossRef]
- Quiniou, N.; Noblet, J. Influence of high temperature of multiparous lactating sows. J. Anim. Sci. 1999, 77, 2124–2134. [Google Scholar] [CrossRef] [PubMed]
- Van Milgen, J.; Noblet, J. Partitioning of energy intake to heat, protein and fat in growing pigs. J. Anim. Sci. 2003, 81, E86–E93. [Google Scholar] [CrossRef]
- Kerr, B.J.; Yen, J.T.; Nienaber, J.A.; Easter, R.A. Influences of dietary protein level, amino acid supplementation and environment temperature on performance, body composition, organ weights and total heat production of growing pigs. J. Anim. Sci. 2003, 81, 1998–2007. [Google Scholar] [CrossRef] [Green Version]
- Manno, M.C.; Oliveira, R.F.M.; Donzele, J.L.; Ferreira, A.S.; Oliveira, W.P.; Lima, K.R.S.; Vaz, R.G.M.V. Efeito da temperatura ambiente sobre o desempenho de suínos dos 15 aos 30 Kg. Rev. Bras. Zootech. 2005, 34, 1963–1970. [Google Scholar] [CrossRef] [Green Version]
- Judge, M.D. Environmental stress and meat quality. J. Anim. Sci. 1969, 28, 6. [Google Scholar] [CrossRef]
- Davenport, M.D.; Tiefenbacher, S.; Lutz, C.K.; Novak, M.A.; Meyer, J.S. Analysis of endogenous cortisol concentration in the hair of rhesus macaques. Gen. Comp. Endocrinol. 2006, 147, 255–261. [Google Scholar] [CrossRef]
- Blokhuis, H.; Veissier, I.; Miele, M.; Jones, D.B. The Welfare Quality Project and Beyond: Safeguarding Farm Animal Well-Being. Acta Agric. Scand. Sect. A Anim. Sci. 2010, 60, 129–140. [Google Scholar] [CrossRef]
- Welfare Quality. Welfare Quality Assessment Protocol for Pigs (Sows and Piglets, Growing and Finishing Pigs); Welfare Quality Consortium: Lelystad, The Netherlands, 2009. [Google Scholar]
- CIE. Colorimetry, 2nd ed.; Commission International de I’Eclairage: Vienna, Austria, 1976. [Google Scholar]
- Rasmussen, A.J.; Andersson, M. New method for determination of drip loss in pork muscles. In Proceedings of the 42nd International Congress of Meat Science and Technology, Lilehammer, Norway, 1–6 September 1996; Hildrum, R., Ed.; [Google Scholar]
- Cameron, A.C.; Trivedi, P.K. Regression Analysis of Count Data; Cambridge University Press: Cambridge, UK, 1998. [Google Scholar]
- Mitruka, B.M.; Rawnsley, H.M. Clinical Biochemical and Haematological Reference Values in Normal Experimental Animals; Manson Publishing: London, UK, 1977. [Google Scholar]
- Berton, M.P.; Dourado, R.C.; Lima, F.B.F.; Rodrigues, A.B.R.; Ferrari, F.B.; Vieira, L.D.C.; Souza, P.A.; Borba, H. Growing-finishing performance and carcass yield of pigs reared in a climate controlled and uncontrolled environment. Int. J. Biometeorol. 2015, 59, 955–960. [Google Scholar] [CrossRef] [Green Version]
- Nienaber, J.A.; Hahn, G.L. Heat production and feed intake of ad-libitum-fed growing swine as affected by temperature. Am. Soc. Agric. Eng. Pap. 1982, 4065–4067. [Google Scholar]
- Quiniou, N.; Noblet, J.; Van Milgen, J.; Dubois, S. Modelling heat production and energy balance in group-housed growing pigs exposed to cold or hot ambient temperatures. Br. J. Nutr. 2001, 85, 97–106. [Google Scholar] [CrossRef] [PubMed] [Green Version]
- Nienaber, J.A.; Hahn, G.L.; Mcdonald, T.P.; Korthals, R.L. Feeding pattern and swine performance in hot environments. Trans. ASAE 1996, 39, 195–202. [Google Scholar] [CrossRef]
- Collin, A.; Van Milgen, J.; Dubois, S.; Noblet, J. Effect of high temperature on feeding behaviour and heat production in group-housed young pigs. Br. J. Nutr. 2001, 86, 63–70. [Google Scholar] [CrossRef] [Green Version]
- Christon, R. The effect of tropical ambient temperature on growth and metabolism in pigs. J. Anim. Sci. 1988, 66, 3112–3123. [Google Scholar] [CrossRef]
- Pedersen, S.; Ravn, P. Characteristics of floor for pig pens: Friction, shock absorption, ammonia emission and heat conduction. Agric. Eng. Int. CIGR J. 2008, 10, 1–17. [Google Scholar]
- Aarnink, A.J.A.; Swierstra, D.; Van Denberg, A.J.; Speelman, L. Effect of type of slatted floor and degree of fouling of solid floor on ammonia emission rates from fattening piggeries. J. Agric. Eng. Res. 1997, 66, 93–102. [Google Scholar] [CrossRef] [Green Version]
- Kilbride, A.L.; Gillman, C.E.; Green, L.E. A cross-section study of the prevalence of lameness in finishing pigs, gilts and pregnant sows and associations with limb lesions and floor types on commercial farms in England. Anim. Welf. 2009, 18, 215–224. [Google Scholar]
- McGlone, J.J.; Hicks, T.; Nicholson, R.; Fumuso, C. Feeder space requirement for split sex or mixed sex pens. Texas Tech. Univ. Agric. Sci. Tech. Rep. 1993, 5, 327. [Google Scholar]
- Bates, R.O.; Tilton, S.L.; Rea, J.C.; Woods, S. Performance of pigs stocked at either 5 or 10 per feeder space in grow-finish. In Swine Day Research Report; University of Missouri: Columbia, IN, USA, 1993. [Google Scholar]
- Baxter, M.R. The design of the feeding environment for pigs. In Manipulating Pig Production III: Proceedings of the Third Biennial Conference of the Australian Pig Science Association; Batterham, E.S., Ed.; Australian Pig Science Association: Attwood, Australia, 1991; p. 150. [Google Scholar]
- Gonyou, H.W.; Lou, Z. Grower/Finisher Feeders: Design, Behaviour and Performance; Prairie Swine Centre Monograph: Saskatoon, SK, Canada, 1998; pp. 1–77. [Google Scholar]
- Cross, A.J.; Brown-Brandl, T.M.; Keel, B.N.; Cassady, J.P.; Rohrer, G.A. Feeding behaviour of grow-finish swine and the impacts of heat stress. Transl. Anim. Sci. 2020, 4, txaa023. [Google Scholar] [CrossRef]
- Boumans, I.J.M.M.; de Boer, I.J.M.; Hofstede, G.J.; Bokkers, E.A.M. Unravelling variation in feeding, social interaction and growth patterns among pigs using an agent-based model. Physiol. Behav. 2018, 191, 101–115. [Google Scholar] [CrossRef] [PubMed]
- Temple, D.; Manteca, X.; Velarde, A.; Dalmau, A. Assessment of animal welfare through behavioural parameters in Iberian pigs in intensive and extensive conditions. Appl. Anim. Behav. Sci. 2011, 131, 29–39. [Google Scholar] [CrossRef]
- Hyun, Y.; Ellis, M. Effect of group size and feeder type on growth performance and feeding patterns in growing pigs. J. Anim. Sci. 2001, 79, 803–810. [Google Scholar] [CrossRef] [Green Version]
- Ewbank, R.; Bryant, M.J. Aggressive behavior amongst groups of domesticated pigs kept at various stocking rates. Anim. Behav. 1972, 20, 21–28. [Google Scholar] [CrossRef]
- Petherick, J.C. A biological basis for the design of space in livestock housing. In Farm Animal Housing and Welfare; Baxter, S.H., Baxter, M.R., MacCormack, J.A.C., Eds.; MacCormack: Billerica, MA, USA, 1983; p. 103. [Google Scholar]
- Hyun, Y.; Ellis, M. Effect of group size and feeder type on growth performance and feeding patterns in finishing pigs. J. Anim. Sci. 2002, 80, 568–574. [Google Scholar] [CrossRef] [Green Version]
- Nielsen, B.L.; Lawrence, A.B.; Whittemore, C.T. Effect of group size on feeding behaviour, social behaviour, and performance of growing pigs using single-space feeders. Livest. Prod. Sci. 1995, 44, 73–85. [Google Scholar] [CrossRef]
- Sreedhar, S.; Rao, K.S.; Suresh, J.; Moorthy, P.R.S.; Reddy, V.P. Changes in hematocrit and some serum biochemical profile of Sahiwal and Jersey x Sahiwal cows in tropical environments. Vet. Arhiv. 2013, 83, 171–187. [Google Scholar]
- St-Pierre, N.R.; Cobanov, B.; Schnitkey, G. Economic Losses from heat stress by US Livestock Industries. J. Dairy Sci. 2003, 86, E52–E77. [Google Scholar] [CrossRef] [Green Version]
- Kouba, M.; Bonneau, M.; Noblet, J. Relative development of subcutaneous, intermuscular, and kidney fat in growing pigs with different body compositions. J. Anim. Sci. 1999, 77, 622–629. [Google Scholar] [CrossRef]
- Kouba, M.; Hermier, D.; Le Dividich, J. Influence of a high ambient temperature on lipid metabolism in the growing pig. J. Anim. Sci. 2001, 79, 81–87. [Google Scholar] [CrossRef]
- Le Dividich, J.; Noblet, J.; Herpin, P.; Van Milgen, J.; Quiniou, N. Thermoregulation. In Progress in Pig Science; Wiseman, J.J., Varley, M.A., Chadwick, J.P., Eds.; Nottingham Universy Press: Nottingham, UK, 1998; pp. 229–264. [Google Scholar]
- Bruce, H.L.; Ball, R.O. Postmortem interactions of muscle temperature, pH and extension on beef quality. J. Anim. Sci. 1990, 68, 4167–4175. [Google Scholar] [CrossRef] [PubMed]
- Geesink, G.H.; Bekhit, A.D.; Bickerstaffe, R. Rigor temperature and meat quality characteristics of lamb longissimus muscle. J. Anim. Sci. 2000, 78, 2842–2848. [Google Scholar] [CrossRef] [PubMed]


| Variable | Floor | Heat | Feeder | Floor × Heat | Floor × Feeder | Heat × Feeder | Floor × Heat × Feeder | ||||||
|---|---|---|---|---|---|---|---|---|---|---|---|---|---|
| 30% Slat | 100% Slat | p | Control | Heat | p | One | Two | p | p | p | p | p | |
| Initial body weight (kg) | 27.5 | 27.7 | 0.6885 | 27.5 | 27.8 | 0.5265 | 27.9 | 27.4 | 0.1857 | 0.8911 | 0.8720 | 0.7915 | 0.9990 |
| Average daily gain (kg) from W1 to W2 | 0.79 | 0.76 | 0.1345 | 0.79 | 0.76 | 0.1877 | 0.80 | 0.75 | 0.0377 | 0.6301 | 0.5921 | 0.5313 | 0.6243 |
| Average daily gain (kg) from W2 to W3 | 0.82 | 0.82 | 0.3246 | 0.82 | 0.83 | 0.2391 | 0.84 | 0.80 | 0.0135 | 0.7872 | 0.7730 | 0.7115 | 0.6384 |
| Average daily gain (kg) from W3 to W4 | 1.01 | 0.95 | <0.001 | 1.01 | 0.96 | 0.0245 | 1.00 | 0.96 | 0.0443 | 0.9536 | 0.5276 | 0.7315 | <0.001 |
| Variable | Heat | Floor | Feeder | Heat × Floor | Heat × Feeder | Floor × Feeder | Heat × Floor × Feeder |
|---|---|---|---|---|---|---|---|
| Final body weight | <0.0001 | 0.0387 | 0.0234 | NS | NS | NS | <0.0001 |
| Packed cell volume | NS | NS | NS | NS | NS | NS | NS |
| Hemoglobin | NS | NS | NS | NS | NS | NS | NS |
| Total red blood cells | NS | NS | NS | NS | NS | NS | NS |
| Total white blood cells | NS | 0.0037 | NS | NS | NS | NS | NS |
| Neutrophils | NS | 0.0023 | NS | NS | NS | NS | NS |
| Lymphocytes | NS | 0.0008 | NS | NS | NS | NS | NS |
| Eosinophils | 0.0012 | NS | NS | NS | NS | NS | NS |
| Basophils | NS | NS | NS | NS | NS | NS | NS |
| Monocytes | 0.0006 | NS | NS | NS | NS | NS | NS |
| NLR | NS | NS | NS | 0.0007 | NS | NS | NS |
| Hair cortisol | NS | NS | NS | 0.0492 | NS | NS | NS |
| Positive social behavior | 0.0013 | NS | NS | 0.0030 | NS | NS | NS |
| Negative social behavior | NS | 0.0005 | 0.0008 | NS | NS | NS | NS |
| Carcass yield | NS | NS | NS | NS | NS | NS | NS |
| Lean meat percentage | 0.0434 | NS | NS | <0.0001 | NS | NS | NS |
| Intramuscular fat | NS | NS | NS | NS | NS | NS | NS |
| pH1 | NS | NS | NS | NS | NS | NS | NS |
| pHu | 0.0094 | NS | NS | NS | NS | NS | NS |
| EC1 | NS | NS | NS | NS | NS | NS | NS |
| ECu | NS | NS | NS | NS | NS | NS | NS |
| L* | NS | NS | NS | NS | NS | NS | NS |
| Drip Loss | NS | NS | NS | NS | NS | NS | NS |
| Shear force | NS | NS | NS | NS | NS | NS | NS |
| Reference Values * | Temperature | Floor | Feeder | ||||
|---|---|---|---|---|---|---|---|
| Variable | Heated | Control | 30% | 100% | Single | Double | |
| Packed cell volume (%) | 36–47 | 50.2 ± 0.29 | 50.6 ± 0.31 | 50.4 ± 0.29 | 50.4 ± 0.28 | 50.3 ± 0.29 | 50.5 ± 0.27 |
| Hemoglobin (g/dL) | 10–15 | 12.0 ± 0.08 | 12.1 ± 0.09 | 12.1 ± 0.07 | 12.1 ± 0.08 | 12.0 ± 0.07 | 12.1 ± 0.08 |
| Red blood cells (106/μL) | 5–10 | 7.3 ± 0.35 | 7.3 ± 0.39 | 7.3 ± 0.37 | 7.3 ± 0.37 | 7.3 ± 0.35 | 7.4 ± 0.36 |
| White blood cells (103/μL) | 6–25 | 22.8 ± 0.44 | 23.6 ± 0.44 | 22.0 ± 0.46 b | 24.5 ± 0.46 a | 23.4 ± 044 | 23.2 ± 0.49 |
| Neutrophils (103/μL) | 2–8.85 | 8.18 ± 0.215 | 8.02 ± 0.221 | 7.74 ± 0.207 b | 8.23 ± 0.219 a | 8.18 ± 0.213 | 8.08 ± 0.219 |
| Lymphocytes (103/μL) | 4–13.8 | 12.8 ± 0.567 | 13.5 ± 0.561 | 12.4 ± 0.557 b | 14.3 ± 0.573 a | 13.2 ± 0.572 | 13.2 ± 0.569 |
| Eosinophils (103/μL) | 0.18–1.32 | 0.49 ± 0.389 b | 0.69 ± 0.433 a | 0.60 ± 0.413 | 0.58 ± 0.379 | 0.58 ± 0.398 | 0.59 ± 0.376 |
| Basophils (103/μL) | 0–0.47 | 0.21 ± 0.170 | 0.19 ± 0.177 | 0.21 ± 0.175 | 0.20 ± 0.173 | 0.22 ± 0.176 | 0.21 ± 0.179 |
| Monocytes (103/μL) | 0.3–2.03 | 1.19 ± 0.428 a | 1.02 ± 0.425 b | 1.08 ± 0.424 | 1.18 ± 0.431 | 1.20 ± 0.428 | 1.14 ± 0.427 |
| Temperature | Floor | Feeder | ||||
|---|---|---|---|---|---|---|
| Variable | Heat Stress | Control | 30% | 100% | Single | Double |
| Carcass yield (%) | 75.1 ± 0.65 | 74.8 ± 1.02 | 75.6 ± 0.44 | 74.2 ± 1.24 | 75.1 ± 0.87 | 74.8 ± 0.81 |
| Lean meat percentage | 49.6 ± 0.86 b | 52.2 ± 1.35 a | 50.2 ± 0.58 | 51.6 ± 1.65 | 50.3 ± 1.13 | 51.5 ± 1.07 |
| Intramuscular fat (%) | 4.0 ± 0.11 | 3.9 ± 0.09 | 3.9 ± 0.09 | 4.0 ± 0.10 | 4.0 ± 0.11 | 4.0 ± 0.14 |
| pH1 | 6.5 ± 0.14 | 6.5 ± 0.22 | 6.5 ± 0.11 | 6.5 ± 0.26 | 6.5 ± 0.20 | 6.4 ± 0.18 |
| pHu | 5.5 ± 0.04 b | 5.7 ± 0.03 a | 5.6 ± 0.03 | 5.6 ± 0.04 | 5.7 ± 0.10 | 5.5 ± 0.09 |
| EC1 (mS) | 3.5 ± 0.19 | 3.6 ± 0.16 | 3.8 ± 0.16 | 3.3 ± 0.18 | 3.5 ± 0.20 | 3.6 ± 0.24 |
| ECu (mS) | 3.0 ± 0.13 | 3.2 ± 0.11 | 3.0 ± 0.11 | 3.1 ± 0.12 | 3.0 ± 0.13 | 3.2 ± 0.16 |
| L* | 46.4 ± 0.81 | 45.7 ± 0.72 | 46.3 ± 0.71 | 45.8 ± 0.78 | 45.6 ± 0.86 | 46.5 ± 1.06 |
| Drip Loss (%) | 0.9 ± 0.37 | 1.1 ± 0.31 | 1.0 ± 0.34 | 1.0 ± 0.37 | 0.7 ± 0.41 | 1.3 ± 0.50 |
| Shear force (kg) | 5.9 ± 0.62 | 5.2 ± 0.54 | 5.5 ± 0.47 | 5.6 ± 0.56 | 5.6 ± 0.61 | 5.6 ± 0.78 |
Publisher’s Note: MDPI stays neutral with regard to jurisdictional claims in published maps and institutional affiliations. |
© 2020 by the authors. Licensee MDPI, Basel, Switzerland. This article is an open access article distributed under the terms and conditions of the Creative Commons Attribution (CC BY) license (http://creativecommons.org/licenses/by/4.0/).
Share and Cite
Borges, T.D.; Huerta-Jimenez, M.; Casal, N.; Gonzalez, J.; Panella-Riera, N.; Dalmau, A. To Provide a Double Feeder in Growing Pigs Housed under High Environmental Temperatures Reduces Social Interactions but Does Not Improve Weight Gains. Animals 2020, 10, 2248. https://doi.org/10.3390/ani10122248
Borges TD, Huerta-Jimenez M, Casal N, Gonzalez J, Panella-Riera N, Dalmau A. To Provide a Double Feeder in Growing Pigs Housed under High Environmental Temperatures Reduces Social Interactions but Does Not Improve Weight Gains. Animals. 2020; 10(12):2248. https://doi.org/10.3390/ani10122248
Chicago/Turabian StyleBorges, Tâmara Duarte, Mariana Huerta-Jimenez, Nicolau Casal, Joel Gonzalez, Nuria Panella-Riera, and Antoni Dalmau. 2020. "To Provide a Double Feeder in Growing Pigs Housed under High Environmental Temperatures Reduces Social Interactions but Does Not Improve Weight Gains" Animals 10, no. 12: 2248. https://doi.org/10.3390/ani10122248