A Novel Corn-Expressed Phytase Improves Daily Weight Gain, Protein Efficiency Ratio and Nutrients Digestibility and Alters Fecal Microbiota in Pigs Fed with Very Low Protein Diets


Abstract
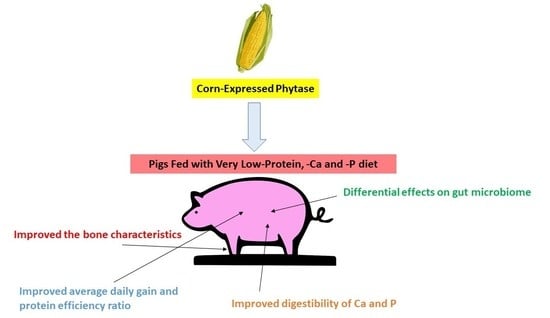
:Simple Summary
Abstract
1. Introduction
2. Materials and Methods
2.1. Animals, Housing, and Diets
2.2. Growth Performance Parameters
2.3. Feed, Fecal, and Blood Samples Collection
2.4. Bone Mineral Density and Bone Mineral Content Analysis
2.5. Proximate Analysis of Feed Samples
2.6. Nutrients Apparent Fecal Digestibility
2.7. Fecal DNA Isolation, Amplicon Sequencing, Sequence Data Analysis, and Taxonomic Classification
2.8. Serum Osteocalcin, Calcium, Phosphorus, and Alkaline Phosphatase
2.9. Statistical Analysis
3. Results
3.1. Body Weight, Feed Intake, and Feed Efficiency
3.2. Bone Mineral Content and Density
3.3. Apparent Fecal Digestibility of Calcium, Phosphorus, and Nitrogen
3.4. Serum Osteocalcin, Calcium, Phosphorus, and Alkaline Phosphatase
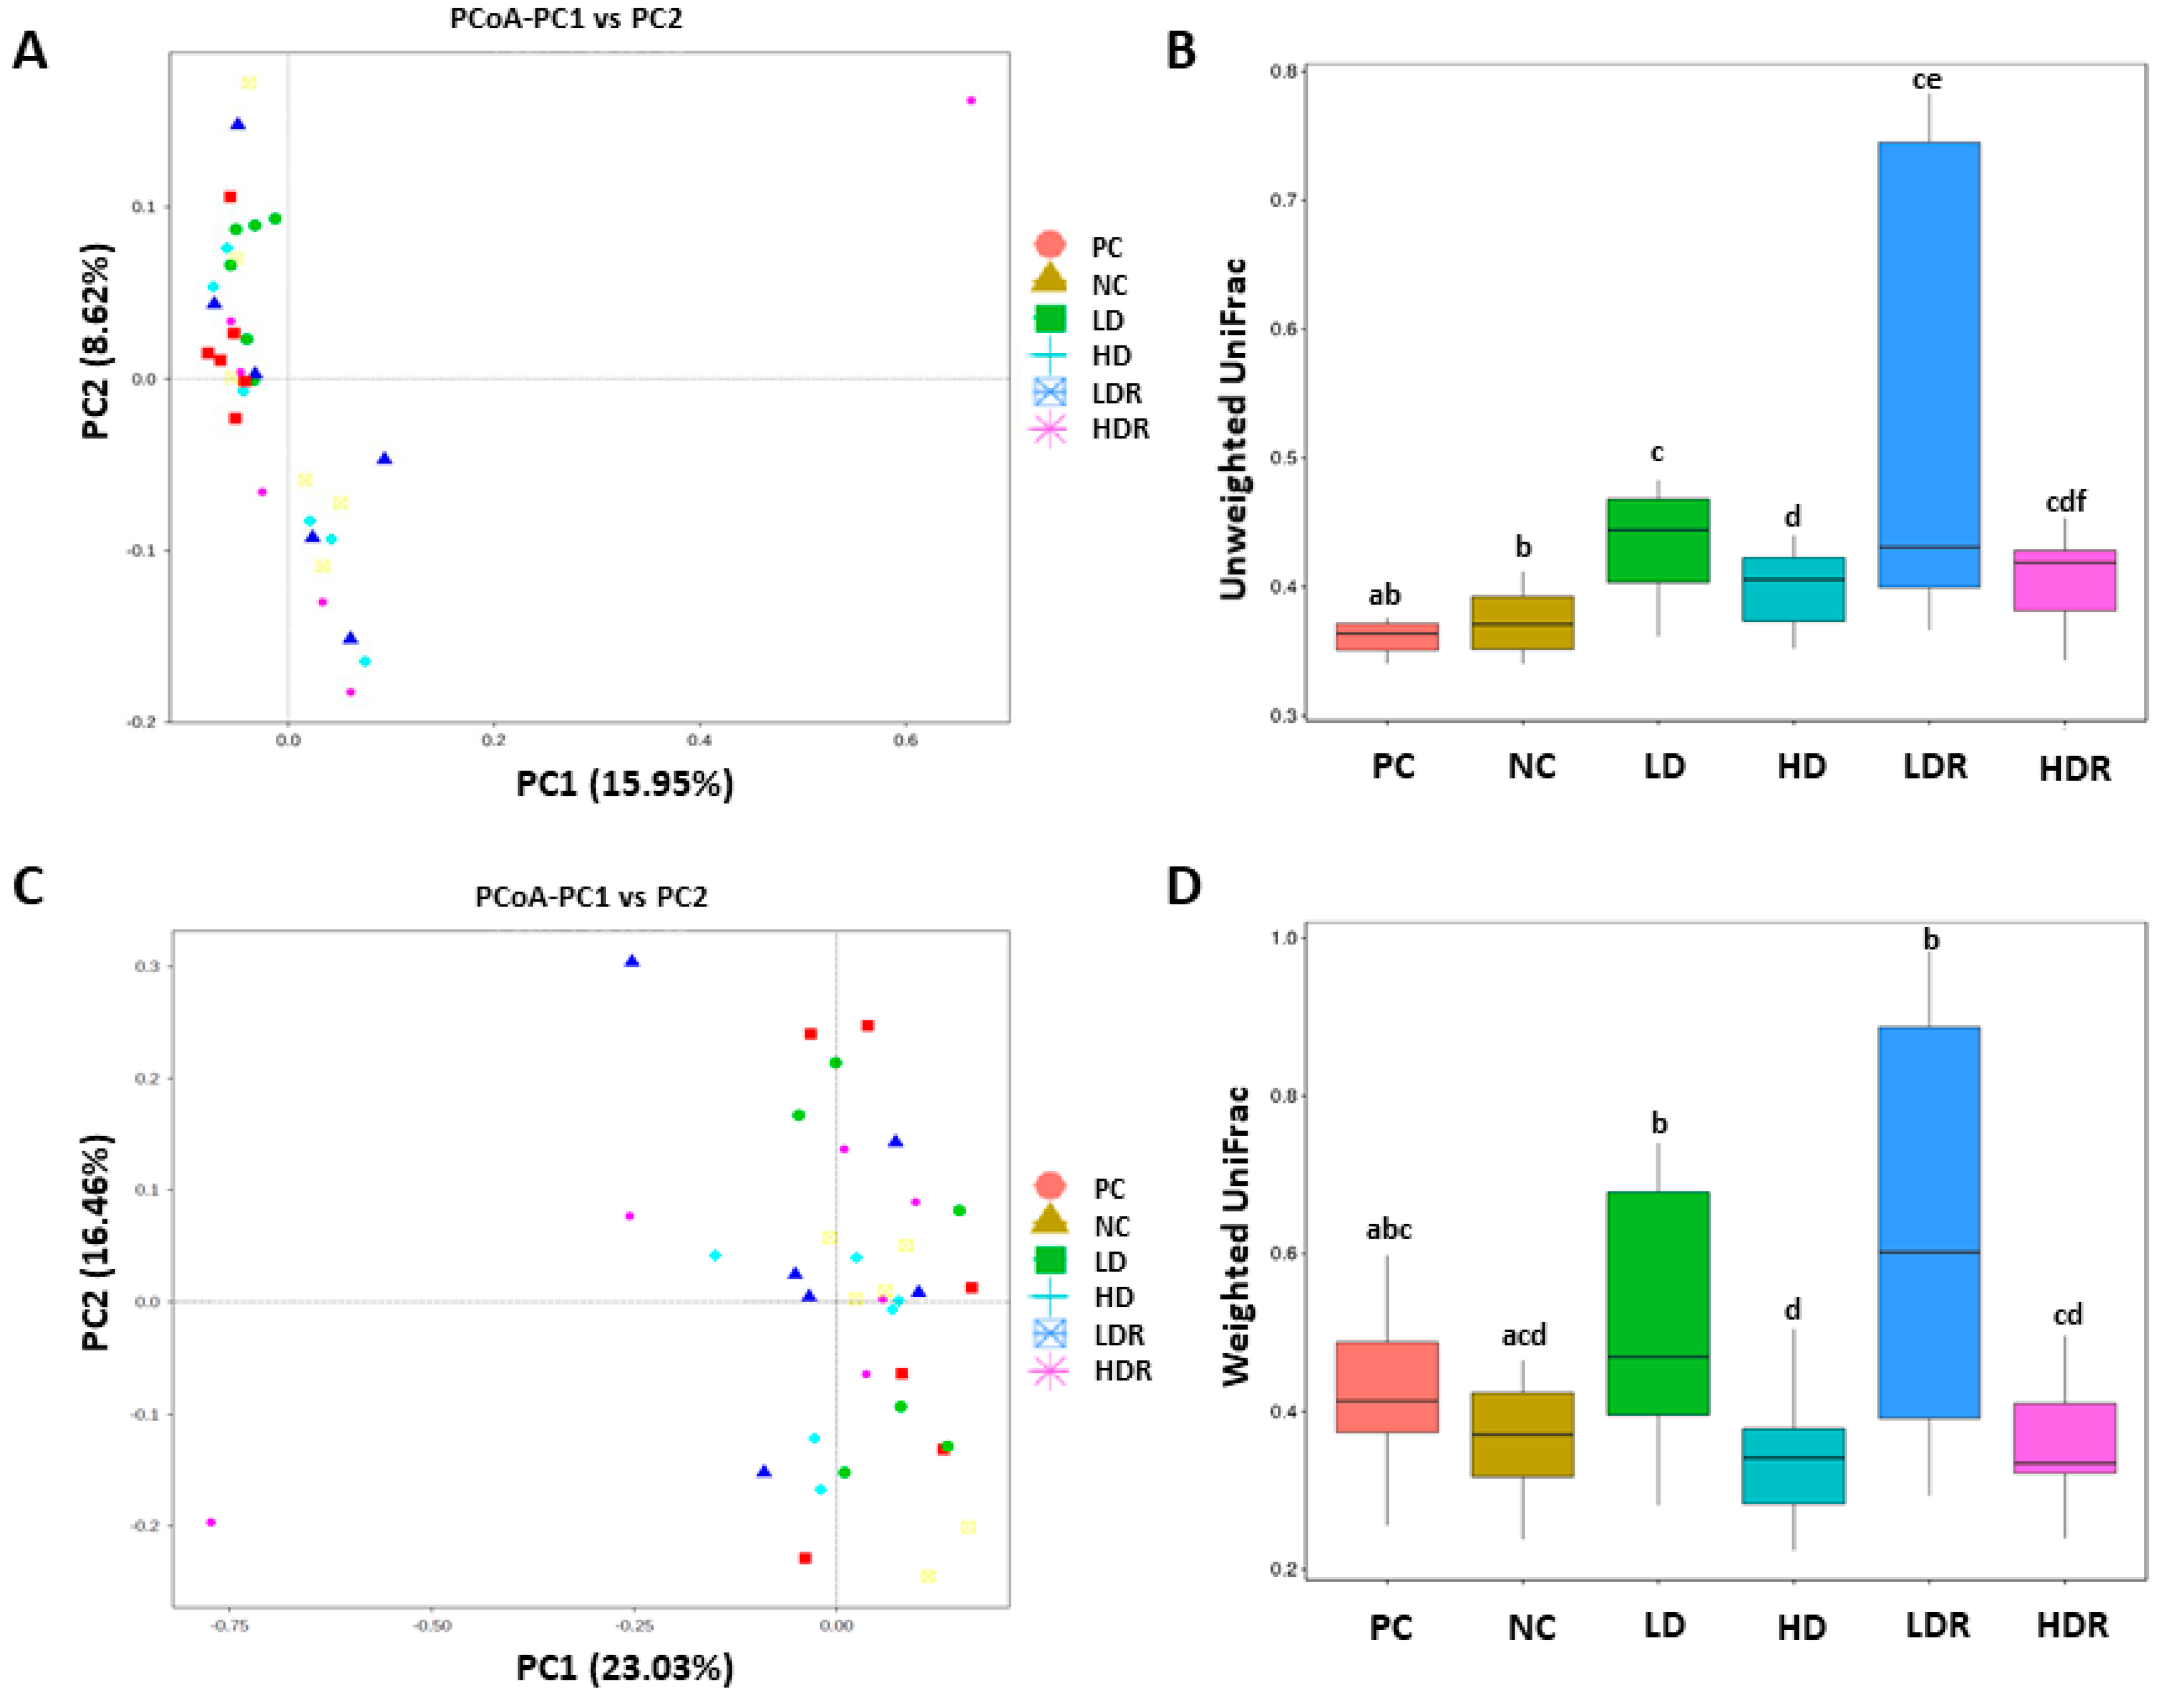
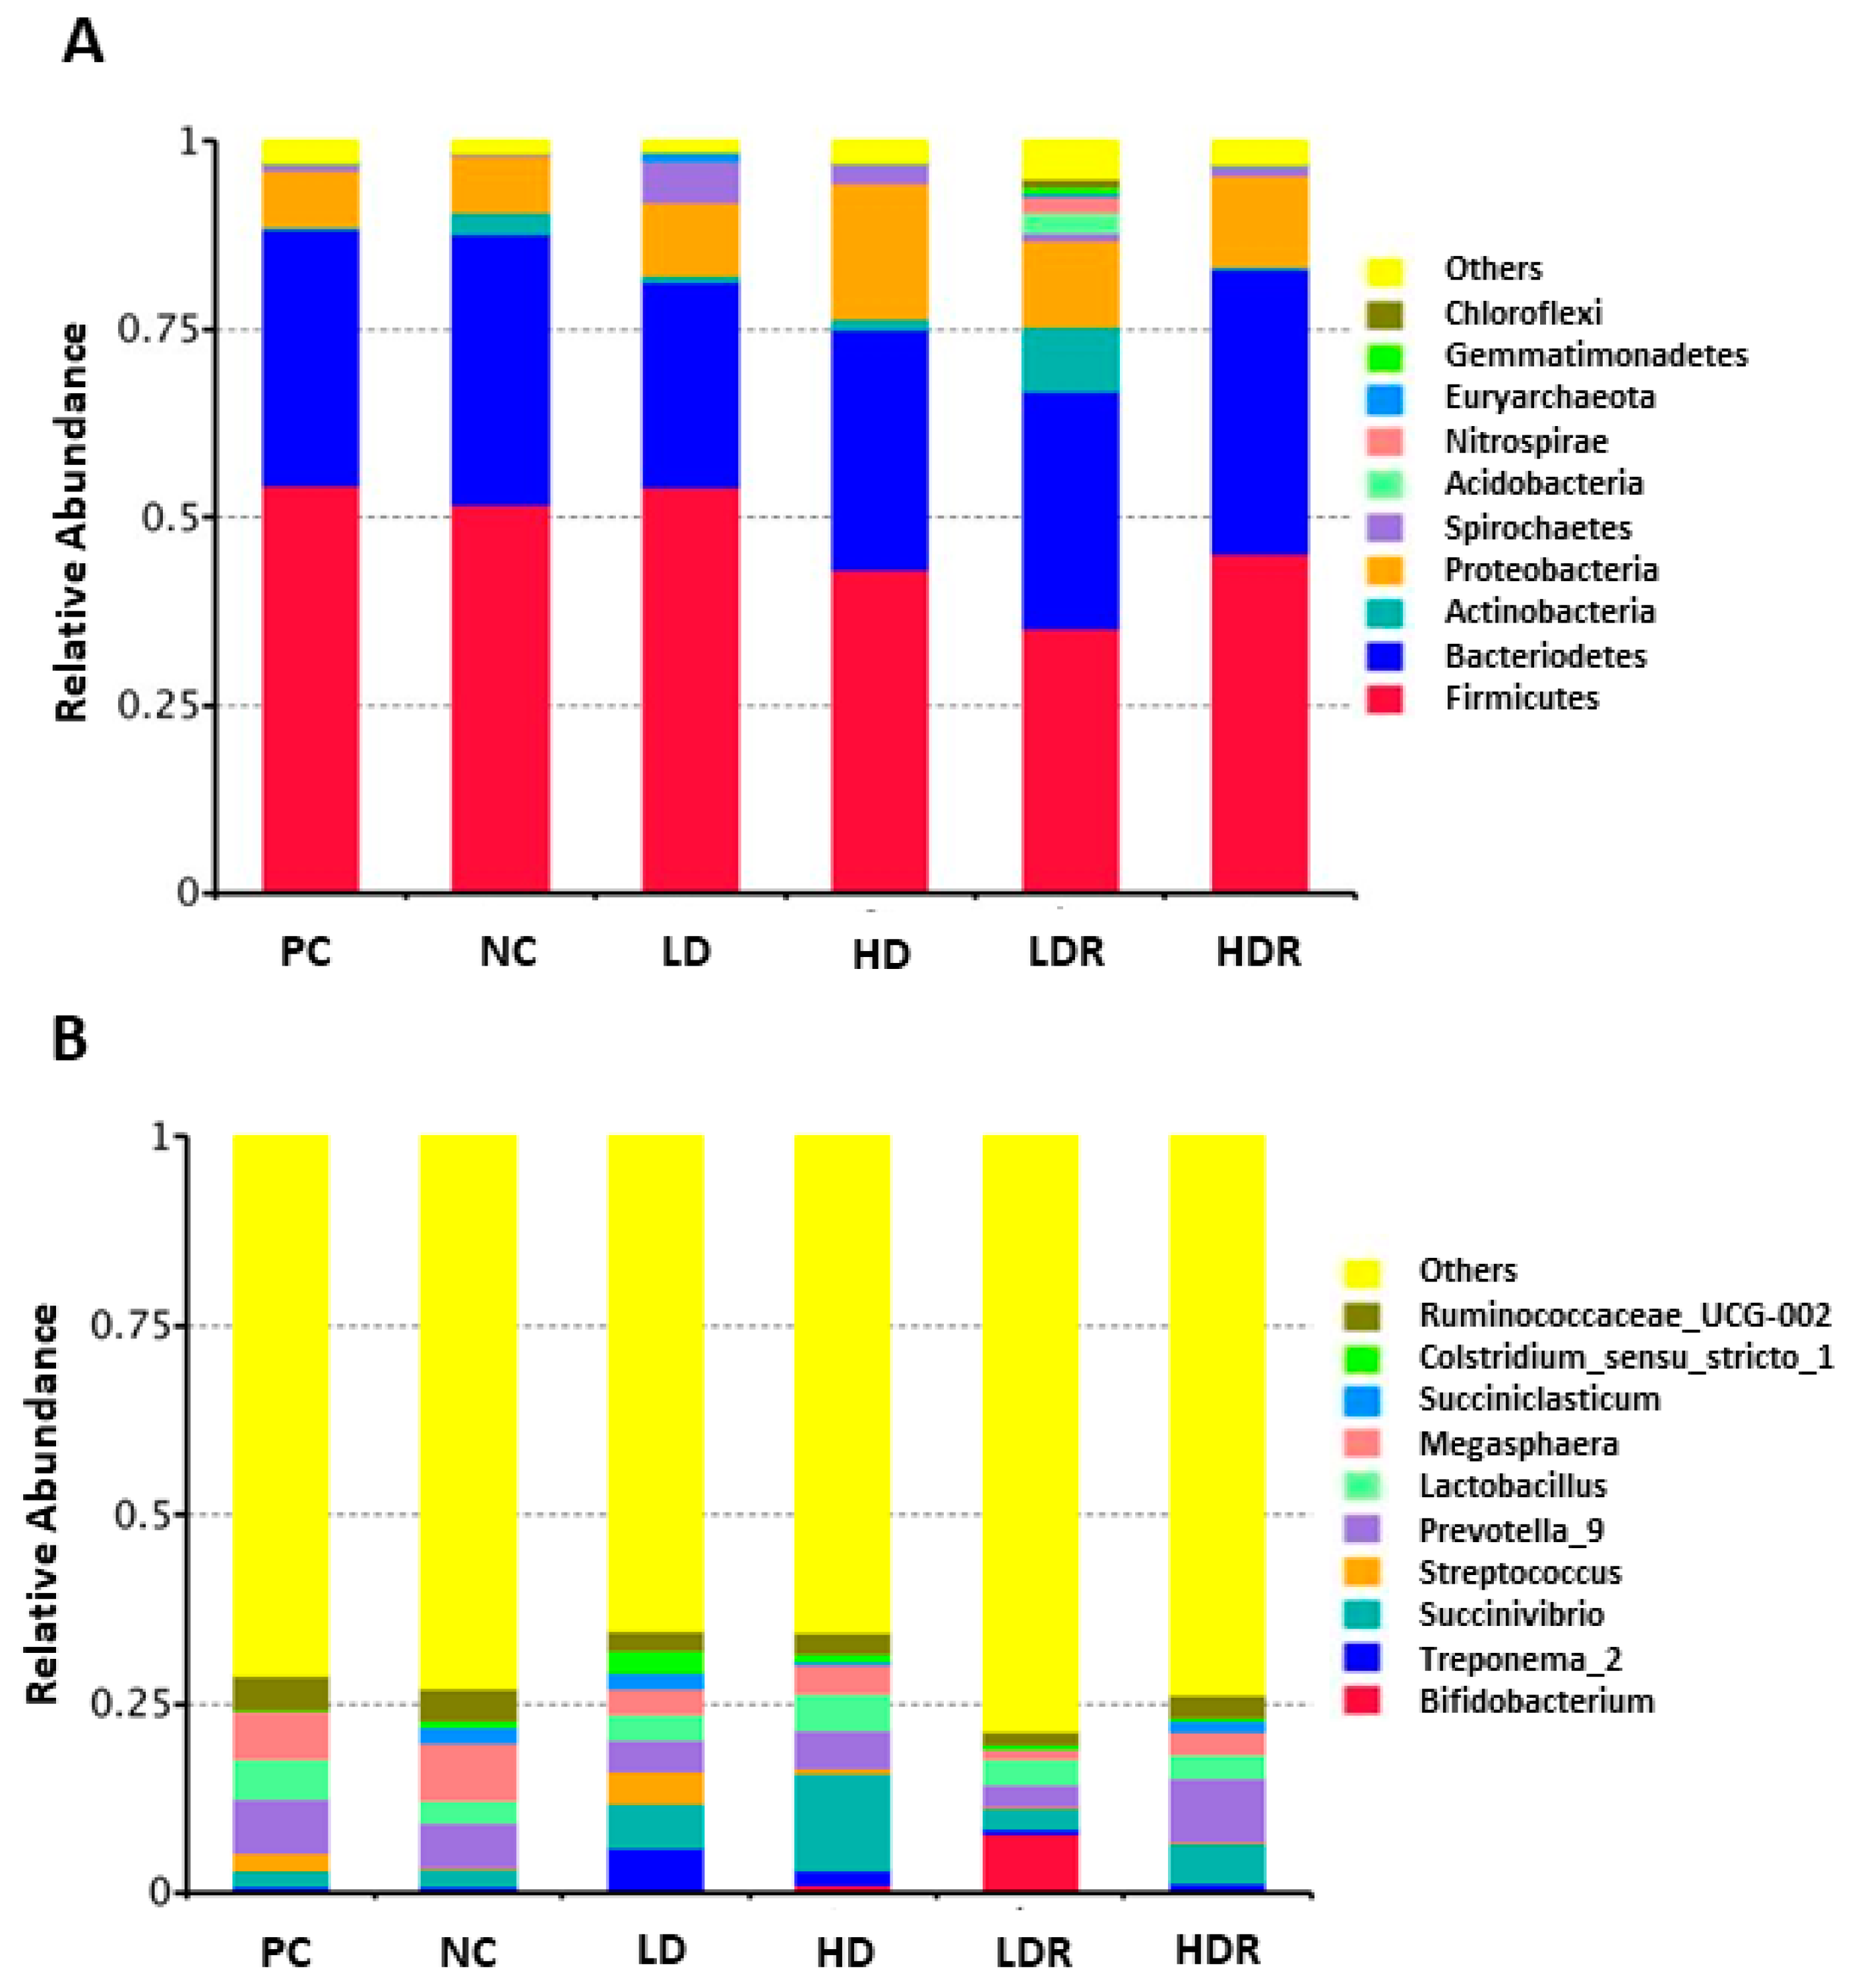
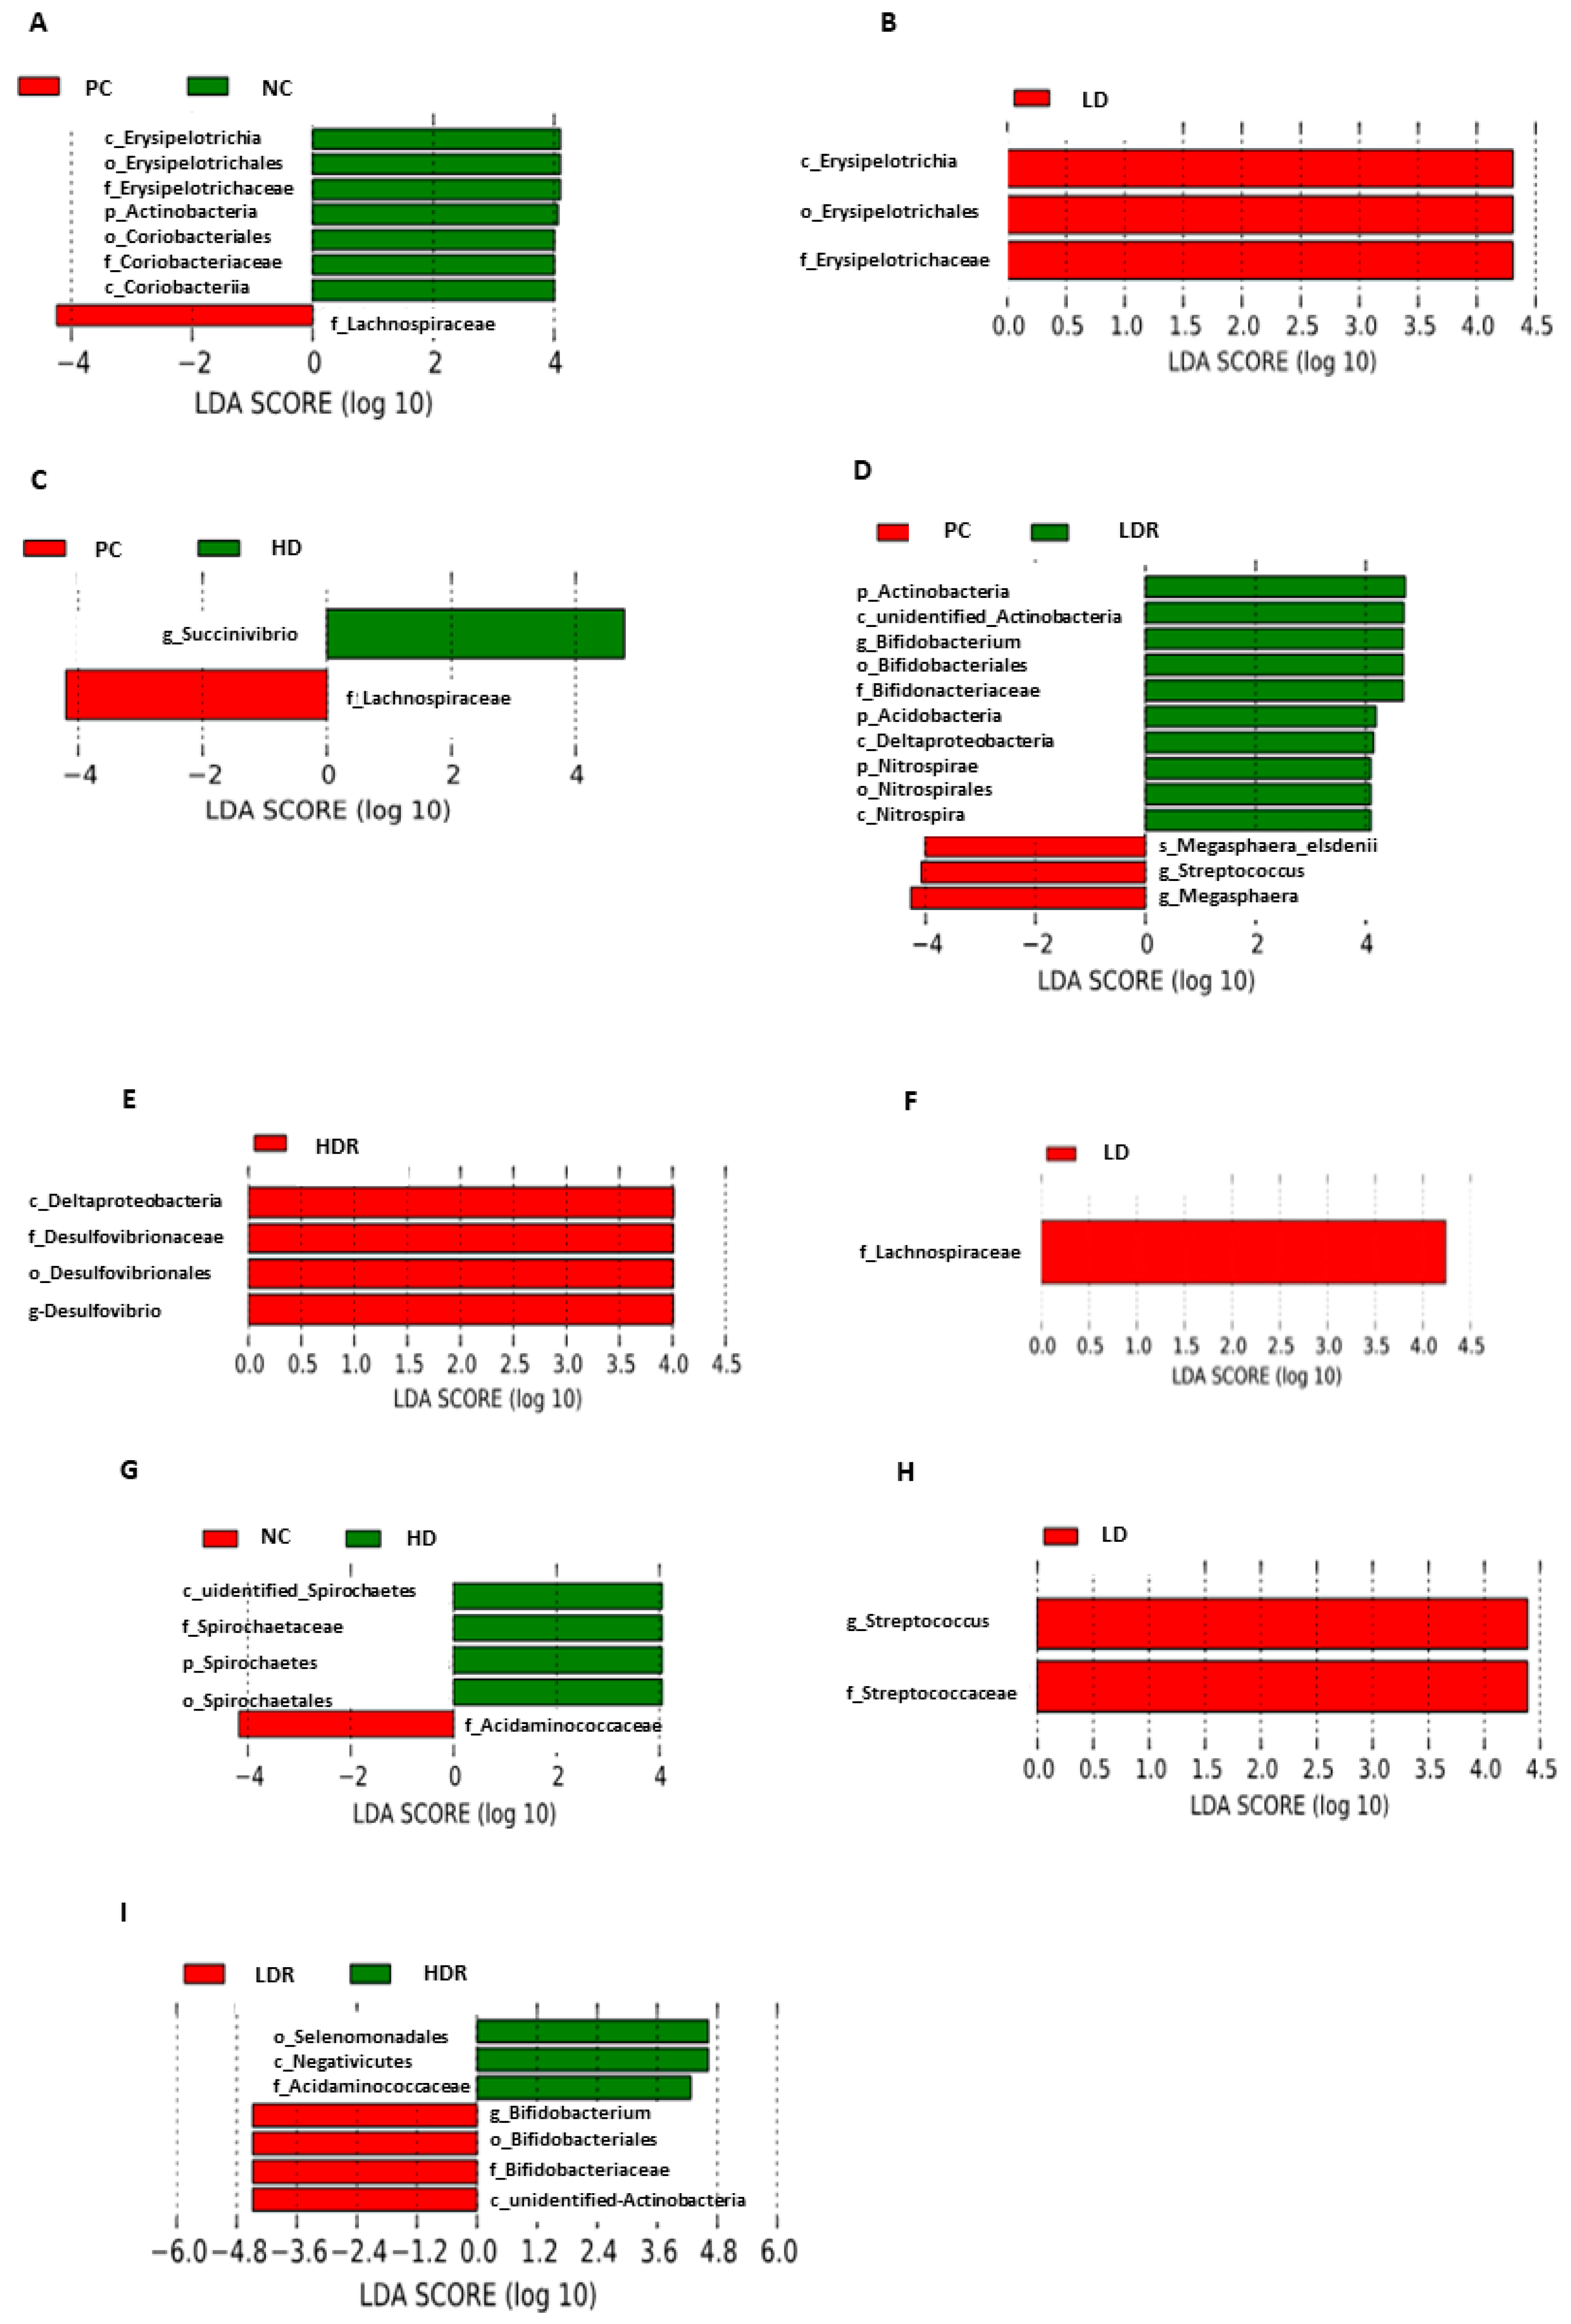
3.5. Fecal Microbiota
4. Discussion
5. Conclusions
Supplementary Materials
Author Contributions
Funding
Acknowledgments
Conflicts of Interest
References
- Jongbloed, A.W.; Lenis, N.P. Environmental Concerns about Animal Manure. J. Anim. Sci. 1998, 76, 2641. [Google Scholar] [CrossRef] [PubMed]
- Selle, P.H.; Cowieson, A.J.; Ravindran, V. Consequences of Calcium Interactions with Phytate and Phytase for Poultry and Pigs. Livest. Sci. 2009, 124, 126–141. [Google Scholar] [CrossRef]
- Nyachoti, C.M.; Omogbenigun, F.O.; Rademacher, M.; Blank, G. Performance Responses and Indicators of Gastrointestinal Health in Early-Weaned Pigs Fed Low-Protein Amino Acid-Supplemented Diets. J. Anim. Sci. 2006, 84, 125–134. [Google Scholar] [PubMed]
- Oster, M.; Gerlinger, C.; Heide, K.; Just, F.; Borgelt, L.; Wolf, P.; Polley, C.; Vollmar, B.; Muráni, E.; Ponsuksili, S.; et al. Lower Dietary Phosphorus Supply in Pigs Match Both Animal Welfare Aspects and Resource Efficiency. Ambio 2018, 47, 20–29. [Google Scholar] [CrossRef] [PubMed] [Green Version]
- Heo, J.-M.; Kim, J.-C.; Hansen, C.F.; Mullan, B.P.; Hampson, D.J.; Pluske, J.R. Effects of Feeding Low Protein Diets to Piglets on Plasma Urea Nitrogen, Faecal Ammonia Nitrogen, the Incidence of Diarrhoea and Performance after Weaning. Arch. Anim. Nutr. 2008, 62, 343–358. [Google Scholar] [CrossRef] [PubMed]
- Le Bellego, L.; Noblet, J. Performance and Utilization of Dietary Energy and Amino Acids in Piglets Fed Low Protein Diets. Livest. Prod. Sci. 2002, 76, 45–58. [Google Scholar] [CrossRef]
- Pluske, J.R.; Pethick, D.W.; Hopwood, D.E.; Hampson, D.J. Nutritional Influences on Some Major Enteric Bacterial Diseases of Pig. Nutr. Res. Rev. 2002, 15, 333–371. [Google Scholar] [CrossRef]
- Wellock, I.J.; Fortomaris, P.D.; Houdijk, J.G.M.; Kyriazakis, I. Effects of Dietary Protein Supply, Weaning Age and Experimental Enterotoxigenic Escherichia Coli Infection on Newly Weaned Pigs: Performance. Animal 2008, 2, 825–833. [Google Scholar] [CrossRef] [Green Version]
- Deng, D.; Huang, R.L.; Li, T.J.; Wu, G.Y.; Xie, M.Y.; Tang, Z.R.; Kang, P.; Zhang, Y.M.; Fan, M.Z.; Kong, X.F.; et al. Nitrogen Balance in Barrows Fed Low-Protein Diets Supplemented with Essential Amino Acids. Livest. Sci. 2007, 109, 220–223. [Google Scholar]
- Yue, L.Y.; Qiao, S.Y. Effects of Low-Protein Diets Supplemented with Crystalline Amino Acids on Performance and Intestinal Development in Piglets over the First 2 Weeks after Weaning. Livest. Sci. 2008, 115, 144–152. [Google Scholar] [CrossRef]
- Peng, X.; Hu, L.; Liu, Y.; Yan, C.; Fang, Z.F.; Lin, Y.; Xu, S.Y.; Li, J.; Wu, C.M.; Chen, D.W.; et al. Effects of Low-Protein Diets Supplemented with Indispensable Amino Acids on Growth Performance, Intestinal Morphology and Immunological Parameters in 13 to 35 Kg Pigs. Animal 2016, 10, 1812–1820. [Google Scholar] [CrossRef] [PubMed] [Green Version]
- Reinhart, G.A.; Mahan, D.C. Effect of Various Calcium: Phosphorus Ratios at Low and High Dietary Phosphorus for Starter, Grower and Finishing Swine. J. Anim. Sci. 1986, 63, 457–466. [Google Scholar] [CrossRef]
- Rutherfurd, S.M.; Chung, T.K.; Moughan, P.J. Effect of Microbial Phytase on Phytate P Degradation and Apparent Digestibility of Total P and Ca throughout the Gastrointestinal Tract of the Growing Pig. J. Anim. Sci. 2014, 92, 189–197. [Google Scholar] [CrossRef] [PubMed]
- Cheryan, M. Phytic Acid Interactions in Food Systems. Crit. Rev. Food Sci. Nutr. 1980, 13, 297–335. [Google Scholar] [CrossRef]
- Serraino, M.R.; Thompson, L.U.; Savoie, L.; Parent, G. Effect of Phytic Acid on the In-Vitro Rate of Digestibility of Rapeseed Protein and Amino Acids. J. Food Sci. 1985, 50, 1689–1692. [Google Scholar] [CrossRef]
- Pallauf, J.; Rimbach, G.; Pippig, S.; Schindler, B.; Hohler, D.; Most, L. Dietary Effect of Phytogenic Phytase and an Addition of Microbial Phytase to a Diet Based on Field Beans, Wheat, Peas and Barley on the Utilization of Phosphorus, Calcium, Magnesium, Zinc and Protein in Piglets. Z. Ernfihrungswiss 1994, 33, 128–135. [Google Scholar] [CrossRef]
- Mroz, Z.; Jongbloed, A.W.; Kemme, P.A. Apparent Digestibility and Retention of Nutrients Bound to Phytate Complexes as Influenced by Microbial Phytase and Feeding Regimen in Pigs. J. Anim. Sci. 1994, 72, 126–132. [Google Scholar] [CrossRef] [Green Version]
- Jongbloed, A.W.; Van Diepen, J.T.M.; Kemme, P.A.; Broz, J. Efficacy of Microbial Phytase on Mineral Digestibility in Diets for Gestating and Lactating Sows. Livest. Prod. Sci. 2004, 91, 143–155. [Google Scholar] [CrossRef]
- Adeola, O. Digestive Utilization of Minerals by Weanling Pigs Fed Copper- and Phytase-Supplemented Diets. Can. J. Anim. Sci. 1995, 75, 603–610. [Google Scholar] [CrossRef]
- Hong, J.W.; Kim, I.H.; Kwon, O.S.; Lee, S.H.; Bae, H.D.; Kang, S.J.; Yang, U.M. Effects of Phytezyme Supplementation on the Growth Performance and Nutrient Digestibility in Growing Pigs. Asian-Australas. J. Anim. Sci. 2001, 14, 1440–1443. [Google Scholar] [CrossRef]
- Zeng, Z.K.; Wang, D.; Piao, X.S.; Li, P.F.; Zhang, H.Y.; Shi, C.X.; Yu, S.K. Effects of Adding Super Dose Phytase to the Phosphorus-Deficient Diets of Young Pigs on Growth Performance, Bone Quality, Minerals and Amino Acids Digestibilities. Asian-Australas. J. Anim. Sci. 2014, 27, 237–246. [Google Scholar] [CrossRef] [PubMed] [Green Version]
- Zeng, Z.; Li, Q.; Tian, Q.; Zhao, P.; Xu, X.; Yu, S.; Piao, X. Super High Dosing with a Novel Buttiauxella Phytase Continuously Improves Growth Performance, Nutrient Digestibility, and Mineral Status of Weaned Pigs. Biol. Trace Elem. Res. 2015, 168, 103–109. [Google Scholar] [CrossRef] [PubMed]
- Skiba, G.; Weremko, D.; Sobol, M.; Raj, S. Bone Mineralisation of Weaned Piglets Fed a Diet Free of Inorganic Phosphorus and Supplemented with Phytase, as Assessed by Dual-Energy X-ray Absorptiometry. Arch. Anim. Nutr. 2015, 69, 267–275. [Google Scholar] [CrossRef] [PubMed]
- Sélos, A.N.; Donzele, J.L.; Donzele, R.F.M.O.; Castro, T.R.; Cardoso, E.F.; Rennó, L.N.; Braga, D.A.M. Effect of Reduced Dietary Non-Phytate Phosphorus Concentration, with or without Calcium Reduction, in Diets Supplemented with Phytase for Weaned Piglets from 28 to 63 Days of Age. Anim. Prod. Sci. 2019, 59, 2236–2244. [Google Scholar] [CrossRef]
- Gourley, K.M.; Woodworth, J.C.; DeRouchey, J.M.; Dritz, S.S.; Tokach, M.D.; Goodband, R.D. Determining the Available Phosphorus Release of Natuphos E 5,000 G Phytase for Nursery Pigs. J. Anim. Sci. 2018, 96, 1101–1107. [Google Scholar] [CrossRef]
- Adeola, O.; Sands, J. Does Supplemental Dietary Microbial Phytase Improve Amino Acid Utilization? A Perspective That It Does Not. J. Anim. Sci. 2003, 81, 78–85. [Google Scholar]
- Zouaoui, M.; Létourneau-Montminy, M.P.; Guay, F. Effect of Phytase on Amino Acid Digestibility in Pig: A Meta-Analysis. Anim. Feed Sci. Technol. 2018, 238, 18–28. [Google Scholar] [CrossRef]
- Biehl, R.R.; Baker, D.H. Efficacy of Supplemental 1 Alpha-Hydroxycholecalciferol and Microbial Phytase for Young Pigs Fed Phosphorus- or Amino Acid-Deficient Corn-Soybean Meal Diets. J. Anim. Sci. 1996, 74, 2960–2966. [Google Scholar] [CrossRef]
- Holloway, C.L.; Boyd, R.D.; Koehler, D.; Gould, S.A.; Li, Q.; Patience, J.F. The Impact of “Super-Dosing” Phytase in Pig Diets on Growth Performance during the Nursery and Grow-out Periods. Transl. Anim. Sci. 2019, 3, 419–428. [Google Scholar] [CrossRef]
- Traylor, S.L.; Cromwell, G.L.; Lindemann, M.D.; Knabe, D.A. Effects of Level of Supplemental Phytase on Ileal Digestibility of Amino Acids, Calcium, and Phosphorus in Dehulled Soybean Meal for Growing Pigs. J. Anim. Sci. 2001, 79, 2634–2642. [Google Scholar] [CrossRef]
- Sands, J.S.; Ragland, D.; Dilger, R.N.; Adeola, O. Responses of Pigs to Aspergillus Niger Phytase Supplementation of Low-Protein or High-Phytin Diets. J. Anim. Sci. 2009, 87, 2581–2589. [Google Scholar] [CrossRef] [PubMed] [Green Version]
- Pandey, A.; Szakacs, G.; Soccol, C.R.; Rodriguez-Leon, J.A.; Soccol, V.T. Production, Purification and Properties of Microbial Phytases. Bioresour. Technol. 2001, 77, 203–214. [Google Scholar] [CrossRef]
- Greiner, R.; Konietzny, U. Phytase for Food Application. Food Technol. Biotechnol. 2006, 44, 2. [Google Scholar]
- Blavi, L.; Muñoz, C.J.; Broomhead, J.N.; Stein, H.H. Effects of a Novel Corn-Expressed E. Coli Phytase on Digestibility of Calcium and Phosphorous, Growth Performance, and Bone Ash in Young Growing Pigs. J. Anim. Sci. 2019, 97, 3390–3398. [Google Scholar] [CrossRef] [PubMed]
- Broomhead, J.N.; Lessard, P.A.; Raab, R.M.; Lanahan, M.B. Effects of Feeding Corn-Expressed Phytase on the Live Performance, Bone Characteristics, and Phosphorus Digestibility of Nursery Pigs. J. Anim. Sci. 2019, 97, 1254–1261. [Google Scholar] [CrossRef]
- Hooda, S.; Metzler-Zebeli, B.U.; Vasanthan, T.; Zijlstra, R.T. Effects of Viscosity and Fermentability of Purified Non-Starch Polysaccharides on Ileal and Total Tract Nutrient Digestibility in Ileal-Cannulated Grower Pigs. Livest. Sci. 2010, 134, 79–81. [Google Scholar] [CrossRef]
- Klinsoda, J.; Vötterl, J.; Zebeli, Q.; Metzler-Zebeli, B.U. Lactic Acid Treatment of Cereals and Dietary Phytase Modified Fecal Microbiome Composition Without Affecting Expression of Virulence Factor Genes in Growing Pigs. Front. Microbiol. 2019, 10, 2345. [Google Scholar] [CrossRef] [PubMed]
- Spring, S.; Premathilake, H.; DeSilva, U.; Shili, C.; Carter, S.; Pezeshki, A. Low Protein-High Carbohydrate Diets Alter Energy Balance, Gut Microbiota Composition and Blood Metabolomics Profile in Young Pigs. Sci. Rep. 2020, 10, 3318. [Google Scholar] [CrossRef] [PubMed]
- Spring, S.; Premathilake, H.; Bradway, C.; Shili, C.; DeSilva, U.; Carter, C.; Pezeshki, A. Effect of Very Low-Protein Diets Supplemented with Branched-Chain Amino Acids on Energy Balance, Plasma Metabolomics and Fecal Microbiome of Pigs. Sci. Rep. 2020, 10, 15859. [Google Scholar] [CrossRef] [PubMed]
- National Research Council. Nutrient Requirements of Swine: Eleventh Revised Edition; The National Academies Press: Washington, DC, USA, 2012. [Google Scholar]
- Mitchell, A.D.; Scholz, A.M.; Pursel, V.G. Total Body and Regional Measurements of Bone Mineral Content and Bone Mineral Density in Pigs by Dual Energy X-ray Absorptiometry. J. Anim. Sci. 2001, 79, 2594. [Google Scholar] [CrossRef] [PubMed]
- Horwitz, W. Official Methods of Analysis of AOAC International. Volume I, Agricultural Chemicals, Contaminants, Drugs/Edited by William Horwitz; AOAC International: Gaithersburg, MD, USA, 2010. [Google Scholar]
- Fan, M.Z.; Sauer, W.C.; McBurney, M.I. Estimation by Regression Analysis of Endogenous Amino Acid Levels in Digesta Collected from the Distal Ileum of Pigs. J. Anim. Sci. 1995, 73, 2319–2328. [Google Scholar] [CrossRef] [PubMed]
- Zhang, J.; Kobert, K.; Flouri, T.; Stamatakis, A. Genome Analysis PEAR: A Fast and Accurate Illumina Paired-End ReAd MergeR. Bioinformatics 2014, 30, 614–620. [Google Scholar] [CrossRef] [PubMed] [Green Version]
- Caporaso, J.G.; Kuczynski, J.; Stombaugh, J.; Bittinger, K.; Bushman, F.D.; Costello, E.K.; Fierer, N.; Pẽa, A.G.; Goodrich, J.K.; Gordon, J.I.; et al. QIIME Allows Analysis of High-Throughput Community Sequencing Data. Nat. Methods 2010, 7, 335–336. [Google Scholar] [CrossRef] [PubMed] [Green Version]
- Haas, B.J.; Gevers, D.; Earl, A.M.; Feldgarden, M.; Ward, D.V.; Giannoukos, G.; Ciulla, D.; Tabbaa, D.; Highlander, S.K.; Sodergren, E.; et al. Chimeric 16S RRNA Sequence Formation and Detection in Sanger and 454-Pyrosequenced PCR Amplicons. Genome Res. 2011, 21, 494–504. [Google Scholar] [CrossRef] [PubMed] [Green Version]
- Edgar, R.C.; Haas, B.J.; Clemente, J.C.; Quince, C.; Knight, R. UCHIME Improves Sensitivity and Speed of Chimera Detection. Bioinformatics 2011, 27, 2194–2200. [Google Scholar] [CrossRef] [PubMed] [Green Version]
- Edgar, R.C. UPARSE: Highly Accurate OTU Sequences from Microbial Amplicon Reads. Nat. Methods 2013, 10, 996–998. [Google Scholar] [CrossRef]
- Wang, Q.; Garrity, G.M.; Tiedje, J.M.; Cole, J.R. Naïve Bayesian Classifier for Rapid Assignment of RRNA Sequences into the New Bacterial Taxonomy. Appl. Environ. Microbiol. 2007, 73, 5261–5267. [Google Scholar] [CrossRef] [Green Version]
- DeSantis, T.Z.; Hugenholtz, P.; Larsen, N.; Rojas, M.; Brodie, E.L.; Keller, K.; Huber, T.; Dalevi, D.; Hu, P.; Andersen, G.L. Greengenes, a Chimera-Checked 16S RRNA Gene Database and Workbench Compatible with ARB. Appl. Environ. Microbiol. 2006, 72, 5069–5072. [Google Scholar] [CrossRef] [Green Version]
- Lozupone, C.; Lladser, M.E.; Knights, D.; Stombaugh, J.; Knight, R. UniFrac: An Effective Distance Metric for Microbial Community Comparison. ISME J. 2011, 5, 169–172. [Google Scholar] [CrossRef] [Green Version]
- Kerstetter, J.E.; O’brien, K.O.; Insogna, K.L. New Perspectives on Dietary Protein and Bone Health Low Protein Intake: The Impact on Calcium and Bone Homeostasis in Humans. J. Nutr. 2003, 33, 855S–861S. [Google Scholar] [CrossRef] [Green Version]
- Beresford, J.N.; Gallagher, J.A.; Poser, J.W.; Russell, R.G.G. Production of Osteocalcin by Human Bone Cells in Vitro. Effects of 1,25(OH)2D3, 24,25(OH)2D3, Parathyroid Hormone, and Glucocorticoids. Metab. Bone Dis. Relat. Res. 1984, 5, 229–234. [Google Scholar] [CrossRef]
- Bronckers, A.L.J.J.; Gay, S.; Dimuzio, M.T.; Butler, W.T. Immunolocalization of γ-Carboxyglutamic Acid Containing Proteins in Developing Rat Bones. Collagen Relat. Res. 1985, 5, 273–281. [Google Scholar] [CrossRef]
- Zoch, M.L.; Clemens, T.L.; Riddle, R.C. New Insights into the Biology of Osteocalcin. Bone 2016, 82, 42–49. [Google Scholar] [CrossRef] [PubMed] [Green Version]
- Carter, S.D.; Cromwell, G.L.; Combs, T.R.; Colombo, G.; Fanti, P. The Determination of Serum Concentrations of Osteocalcin in Growing Pigs and Its Relationship to End-Measures of Bone Mineralization. J. Anim. Sci. 1996, 74, 2719. [Google Scholar] [CrossRef] [Green Version]
- Duffy, S.K.; Kelly, A.K.; Rajauria, G.; Clarke, L.C.; Gath, V.; Monahan, F.J.; O’Doherty, J.V. The Effect of 25-Hydroxyvitamin D3 and Phytase Inclusion on Pig Performance, Bone Parameters and Pork Quality in Finisher Pigs. J. Anim. Physiol. Anim. Nutr. 2018, 102, 1296–1305. [Google Scholar] [CrossRef]
- Branña, D.V.; Ellis, M.; Castanñeda, E.O.; Sands, J.S.; Baker, D.H. Effect of a Novel Phytase on Growth Performance, Bone Ash, and Mineral Digestibility in Nursery and Grower-Finisher Pigs. J. Anim. Sci. 2006, 84, 1839–1849. [Google Scholar] [CrossRef]
- O’Doherty, J.V.; Gahan, D.A.; O’Shea, C.J.; Callan, J.J.; Pierce, K.M. Effects of Phytase and 25-Hydroxyvitamin D3 Inclusions on the Performance, Mineral Balance and Bone Parameters of Grower-Finisher Pigs Fed Low-Phosphorus Diets. Animal 2010, 4, 1634–1640. [Google Scholar] [CrossRef] [PubMed]
- Bühler, K.; Liesegang, A.; Bucher, B.; Wenk, C.; Broz, J. Influence of Benzoic Acid and Phytase in Low-Phosphorus Diets on Bone Characteristics in Growing-Finishing Pigs. J. Anim. Sci. 2010, 88, 3363–3371. [Google Scholar] [CrossRef] [Green Version]
- Moran, K.; Wilcock, P.; Elsbernd, A.; Zier-Rush, C.; Boyd, R.D.; van Heugten, E. Effects of Super-Dosing Phytase and Inositol on Growth Performance and Blood Metabolites of Weaned Pigs Housed under Commercial Conditions. J. Anim. Sci. 2019, 97, 3007–3015. [Google Scholar] [CrossRef]
- Walk, C.L.; Srinongkote, S.; Wilcock, P. Influence of a Microbial Phytase and Zinc Oxide on Young Pig Growth Performance and Serum Minerals. J. Anim. Sci. 2013, 91, 286–291. [Google Scholar] [CrossRef] [Green Version]
- Gebert, S.; Bee, G.; Pfirter, H.P.; Wenk, C. Phytase and Vitamin E in the Feed of Growing Pigs: 2. Influence on Carcass Characteristics, Meat and Fat Quality. J. Anim. Physiol. Anim. Nutr. 1999, 81, 20–30. [Google Scholar] [CrossRef]
- Matsui, T.; Nakagawa, Y.; Tamura, A.; Watanabe, C.; Fujita, K.; Nakajima, T.; Yano, H. Efficacy of Yeast Phytase in Improving Phosphorus Bioavailability in a Corn-Soybean Meal-Based Diet for Growing Pigs. J. Anim. Sci. 2000, 78, 94. [Google Scholar] [CrossRef] [PubMed]
- McCormack, U.M.; Curião, T.; Buzoianu, S.G.; Prieto, M.L.; Ryan, T.; Varley, P.; Crispie, F.; Magowan, E.; Metzler-Zebeli, B.U.; Berry, D.; et al. Exploring a Possible Link between the Intestinal Microbiota and Feed Efficiency in Pigs. Appl. Environ. Microbiol. 2017, 83, e00380-17. [Google Scholar] [CrossRef] [PubMed] [Green Version]
- Ramayo-Caldas, Y.; Mach, N.; Lepage, P.; Levenez, F.; Denis, C.; Lemonnier, G.; Leplat, J.J.; Billon, Y.; Berri, M.; Doré, J.; et al. Phylogenetic Network Analysis Applied to Pig Gut Microbiota Identifies an Ecosystem Structure Linked with Growth Traits. ISME J. 2016, 10, 2973–2977. [Google Scholar] [CrossRef] [Green Version]
- Xiao, L.; Estellé, J.; Kiilerich, P.; Ramayo-Caldas, Y.; Xia, Z.; Feng, Q.; Liang, S.; Pedersen, A.Ø.; Kjeldsen, N.J.; Liu, C.; et al. Reference Gene Catalogue of the Pig Gut Microbiome. Nat. Microbiol. 2016, 1, 1–6. [Google Scholar] [CrossRef]
- Kim, H.B.; Isaacson, R.E. The Pig Gut Microbial Diversity: Understanding the Pig Gut Microbial Ecology through the next Generation High Throughput Sequencing. Vet. Microbiol. 2015, 177, 242–251. [Google Scholar] [CrossRef]
- Zhao, W.; Wang, Y.; Liu, S.; Huang, J.; Zhai, Z.; He, C.; Ding, J.; Wang, J.; Wang, H.; Fan, W.; et al. The Dynamic Distribution of Porcine Microbiota across Different Ages and Gastrointestinal Tract Segments. PLoS ONE. 2015, 10, e0117441. [Google Scholar] [CrossRef] [Green Version]
- Flint, H.J.; Duncan, S.H.; Scott, K.P.; Louis, P. Links between Diet, Gut Microbiota Composition and Gut Metabolism. Proc. Nutr. Soc. 2014, 74, 13–22. [Google Scholar] [CrossRef] [Green Version]
- Meehan, C.J.; Beiko, R.G.A. Phylogenomic View of Ecological Specialization in the Lachnospiraceae, a Family of Digestive Tract-Associated Bacteria. Genome Biol. Evol. 2014, 6, 703–713. [Google Scholar] [CrossRef] [Green Version]
- Quan, J.; Cai, G.; Ye, J.; Yang, M.; Ding, R.; Wang, X.; Zheng, E.; Fu, D.; Li, S.; Zhou, S.; et al. A Global Comparison of the Microbiome Compositions of Three Gut Locations in Commercial Pigs with Extreme Feed Conversion Ratios. Sci. Rep. 2018, 8, 1–10. [Google Scholar] [CrossRef] [Green Version]
- Dou, S.; Gadonna-Widehem, P.; Rome, V.; Hamoudi, D.; Rhazi, L.; Lakhal, L.; Larcher, T.; Bahi-Jaber, N.; Pinon-Quintana, A.; Guyonvarch, A.; et al. Characterisation of Early-Life Fecal Microbiota in Susceptible and Healthy Pigs to Post-Weaning Diarrhoea. PLoS ONE 2017, 12, e0169851. [Google Scholar] [CrossRef] [PubMed]
- Li, R.W.; Wu, S.; Li, W.; Navarro, K.; Couch, R.D.; Hill, D.; Urban, J.F., Jr. Alterations in the Porcine Colon Microbiota Induced by the Gastrointestinal Nematode Trichuris Suis. Infect. Immun. 2012, 80, 2150–2157. [Google Scholar] [CrossRef] [PubMed] [Green Version]
- Buzoianu, S.G.; Walsh, M.C.; Rea, M.C.; O’Sullivan, O.; Cotter, P.D.; Ross, R.P.; Gardiner, G.E.; Lawlor, P.G. High-Throughput Sequence-Based Analysis of the Intestinal Microbiota of Weanling Pigs Fed Genetically Modified MON810 Maize Expressing Bacillus Thuringiensis Cry1Ab (Bt Maize) for 31 Days. Appl. Environ. Microbiol. 2012, 78, 4217–4224. [Google Scholar] [CrossRef] [PubMed] [Green Version]
- Isabel Ordiz, M.; Stephenson, K.; Agapova, S.; Wylie, K.M.; Maleta, K.; Martin, J.; Trehan, I.; Tarr, P.I.; Manary, M.J. Environmental Enteric Dysfunction and the Fecal Microbiota in Malawian Children. Am. J. Trop. Med. Hyg. 2017, 96, 473–476. [Google Scholar] [CrossRef] [PubMed] [Green Version]
- Russell, J.B.; Hespell, R.B. Microbial rumen fermentation. J. Dairy Sci. 1981, 64, 1153–1169. [Google Scholar] [CrossRef]
- Hernandez-Sanabria, E.; Goonewardene, L.A.; Wang, Z.; Durunna, O.N.; Moore, S.S.; Guan, L.L. Impact of Feed Efficiency and Diet on Adaptive Variations in the Bacterial Community in the Rumen Fluid of Cattle. Appl. Environ. Microbiol. 2012, 78, 1203–1214. [Google Scholar] [CrossRef] [Green Version]
- Zhang, Z.; Tun, H.M.; Li, R.; Gonzalez, B.J.; Keenes, H.C.; Nyachoti, C.M.; Kiarie, E.; Khafipour, E. Impact of Xylanases on Gut Microbiota of Growing Pigs Fed Corn- or Wheat-Based Diets. Anim. Nutr. 2018, 4, 339–350. [Google Scholar] [CrossRef]
- Bergamaschi, M.; Maltecca, C.; Schillebeeckx, C.; McNulty, N.P.; Schwab, C.; Shull, C.; Fix, J.; Tiezzi, F. Heritability and Genome-Wide Association of Swine Gut Microbiome Features with Growth and Fatness Parameters. Sci. Rep. 2020, 10, 10134. [Google Scholar] [CrossRef]
- Mach, N.; Berri, M.; Estellé, J.; Levenez, F.; Lemonnier, G.; Denis, C.; Leplat, J.-J.; Chevaleyre, C.; Billon, Y.; Doré, J.; et al. Early-Life Establishment of the Swine Gut Microbiome and Impact on Host Phenotypes. Environ. Microbiol. Rep. 2015, 7, 554–569. [Google Scholar] [CrossRef]
- Courtin, C.M.; Broekaert, W.F.; Swennen, K.; Lescroart, O.; Onagbesan, O.; Buyse, J.; Decuypere, E.; Van de Wiele, T.; Marzorati, M.; Verstraete, W.; et al. Dietary Inclusion of Wheat Bran Arabinoxylooligosaccharides Induces Beneficial Nutritional Effects in Chickens. Cereal Chem. J. 2008, 85, 607–613. [Google Scholar] [CrossRef]
- Damen, B.; Verspreet, J.; Pollet, A.; Broekaert, W.F.; Delcour, J.A.; Courtin, C.M. Prebiotic Effects and Intestinal Fermentation of Cereal Arabinoxylans and Arabinoxylan Oligosaccharides in Rats Depend Strongly on Their Structural Properties and Joint Presence. Mol. Nutr. Food Res. 2011, 55, 1862–1874. [Google Scholar] [CrossRef] [PubMed]
- Khan, M.S.; Zaidi, A.; Ahmad, E. Mechanism of Phosphate Solubilization and Physiological Functions of Phosphate-Solubilizing Microorganisms. In Phosphate Solubilizing Microorganisms: Principles and Application of Microphos Technology; Springer: Cham, Switzerland, 2014; pp. 31–62. [Google Scholar]
- Latha, S.; Dhanasekaran, D. Antibacterial and Extracellular Enzyme Activities of Gut Actinobacteria Isolated from Gallus Gallus Domesticus and Capra Hircus. J. Chem. Pharm. Res. 2013, 5, 379–385. [Google Scholar]


| Ingredients % | Phase 2 2 | Phase 3 3 | ||||||||||
|---|---|---|---|---|---|---|---|---|---|---|---|---|
| PC | NC | LD | HD | LDR | HDR | PC | NC | LD | HD | LDR | HDR | |
| Corn, yellow dent 4 | 48.49 | 73.77 | 73.71 | 73.67 | 74.23 | 74.2 | 56.8 | 87.1 | 86.95 | 86.89 | 87.57 | 87.52 |
| Fish meal, menhaden 4 | 5.44 | 5.3 | 5.27 | 5.27 | 5.31 | 5.3 | 2.06 | 2.49 | 2.49 | 2.48 | 2.5 | 2.5 |
| Soybean meal, 47.5% CP 4 | 35.13 | 3.17 | 3.16 | 3.16 | 3.18 | 3.18 | 38.22 | 4.97 | 4.97 | 4.97 | 5 | 5 |
| Whey, dried 4 | 5.44 | 6.32 | 6.32 | 6.31 | 6.36 | 6.36 | - | - | - | - | - | - |
| Corn starch 4 | 2.97 | 6.32 | 6.32 | 6.31 | 6.36 | 6.36 | - | - | - | - | - | - |
| Dicalcium phosphate, 18.5% 4 | 0.7 | 0.95 | 0.95 | 0.95 | 0.13 | 0.13 | 0.98 | 1.18 | 1.18 | 1.17 | 0.38 | 0.38 |
| Limestone 4 | 0.5 | 0.64 | 0.63 | 0.63 | 0.77 | 0.77 | 0.62 | 0.72 | 0.72 | 0.72 | 0.85 | 0.85 |
| Vitamin premix 5 | 0.19 | 0.18 | 0.18 | 0.18 | 0.18 | 0.18 | 0.18 | 0.15 | 0.15 | 0.15 | 0.15 | 0.15 |
| Trace mineral premix 6 | 0.05 | 0.07 | 0.08 | 0.07 | 0.07 | 0.07 | 0.07 | 0.1 | 0.1 | 0.1 | 0.1 | 0.1 |
| Lysine, sulfate 4 | - | 1.6 | 1.6 | 1.6 | 1.6 | 1.6 | - | 1.58 | 1.57 | 1.57 | 1.57 | 1.57 |
| DL-methionine 4 | - | 0.16 | 0.16 | 0.16 | 0.16 | 0.16 | - | 0.16 | 0.16 | 0.16 | 0.15 | 0.15 |
| L-threonine 4 | - | 0.41 | 0.41 | 0.41 | 0.41 | 0.41 | - | 0.4 | 0.4 | 0.4 | 0.4 | 0.4 |
| L-tryptophan 4 | - | 0.13 | 0.13 | 0.13 | 0.13 | 0.13 | - | 0.12 | 0.12 | 0.12 | 0.13 | 0.13 |
| Salt 4 | 0.6 | 0.53 | 0.53 | 0.53 | 0.53 | 0.53 | 0.57 | 0.62 | 0.62 | 0.62 | 0.63 | 0.63 |
| Chromium oxide 4 | 0.5 | 0.5 | 0.5 | 0.5 | 0.5 | 0.5 | 0.5 | 0.5 | 0.5 | 0.5 | 0.5 | 0.5 |
| Grainzyme (phytase) 4 | - | - | 0.06 | 0.12 | 0.06 | 0.12 | - | - | 0.06 | 0.12 | 0.06 | 0.12 |
| Calculated Chemical Composition 7 | ||||||||||||
| Dry matter, % | 90.4 | 90.7 | 90.7 | 90.7 | 90.65 | 90.65 | 89.66 | 89.54 | 89.54 | 89.54 | 89.48 | 89.48 |
| Crude protein, % | 24.87 | 13.41 | 13.41 | 13.41 | 13.5 | 13.49 | 24.26 | 12.85 | 12.84 | 12.83 | 12.91 | 12.91 |
| Crude fat, % | 3.52 | 3.54 | 3.54 | 3.53 | 3.56 | 3.56 | 3.57 | 3.79 | 3.79 | 3.79 | 3.82 | 3.82 |
| Calcium, % | 0.8 | 0.8 | 0.8 | 0.8 | 0.68 | 0.68 | 0.7 | 0.7 | 0.7 | 0.7 | 0.58 | 0.58 |
| Phosphorus, % | 0.71 | 0.61 | 0.61 | 0.61 | 0.46 | 0.46 | 0.67 | 0.57 | 0.57 | 0.57 | 0.43 | 0.43 |
| aP, % | 0.4 | 0.4 | 0.4 | 0.4 | 0.25 | 0.25 | 0.33 | 0.33 | 0.33 | 0.33 | 0.18 | 0.18 |
| Nitrogen, % | 3.98 | 2.15 | 2.15 | 2.15 | 2.16 | 2.16 | 3.88 | 2.05 | 2.05 | 2.05 | 2.06 | 2.06 |
| SID Lysine | 1.35 | 1.34 | 1.35 | 1.35 | 1.35 | 1.35 | 1.24 | 1.23 | 1.23 | 1.23 | 1.23 | 1.23 |
| SID Methionine | 0.39 | 0.39 | 0.39 | 0.39 | 0.39 | 0.39 | 0.36 | 0.37 | 0.37 | 0.37 | 0.36 | 0.36 |
| SID Threonine | 0.84 | 0.79 | 0.79 | 0.79 | 0.8 | 0.8 | 0.8 | 0.74 | 0.74 | 0.74 | 0.74 | 0.74 |
| SID Tryptophan | 0.27 | 0.22 | 0.22 | 0.22 | 0.22 | 0.22 | 0.27 | 0.21 | 0.21 | 0.21 | 0.21 | 0.21 |
| Grainzyme, FTU/kg | - | - | 2000 | 4000 | 2000 | 4000 | - | - | 2000 | 4000 | 2000 | 4000 |
| ME, Mcal/kg | 3.45 | 3.4 | 3.39 | 3.39 | 3.39 | 3.42 | 3.34 | 3.34 | 3.34 | 3.34 | 3.36 | 3.36 |
| Analyzed Chemical Composition 8 | ||||||||||||
| Dry matter, % | 87.8 | 87.8 | 88.2 | 87.6 | 88.2 | 86.9 | 87.3 | 87 | 87.4 | 87.2 | 87.7 | 86.5 |
| Crude protein, % | 24.2 | 13.6 | 13.5 | 13.7 | 13.4 | 14 | 23.1 | 12 | 11.9 | 12.2 | 13.2 | 11.6 |
| Crude fat, % | 2.2 | 2.9 | 2.6 | 3 | 3 | 3 | 2.4 | 2.7 | 2.8 | 2.5 | 2.8 | 3.1 |
| Chromium, % | 0.21 | 0.23 | 0.22 | 0.2 | 0.27 | 0.26 | 0.23 | 0.2 | 0.2 | 0.2 | 0.24 | 0.21 |
| Calcium, % | 0.86 | 0.63 | 0.79 | 0.75 | 0.56 | 0.63 | 0.69 | 0.77 | 0.6 | 0.69 | 0.63 | 0.59 |
| Phosphorus, % | 0.74 | 0.6 | 0.61 | 0.58 | 0.42 | 0.43 | 0.63 | 0.58 | 0.52 | 0.58 | 0.46 | 0.43 |
| Nitrogen, % | 3.9 | 2.2 | 2.2 | 2.2 | 2.2 | 2.2 | 3.7 | 1.9 | 1.9 | 2 | 2.1 | 1.9 |
| Item | Diets 1 | SEM 2 | p-Value | |||||
|---|---|---|---|---|---|---|---|---|
| PC | NC | LD | HD | LDR | HDR | |||
| Initial BW, kg | 9.85 ± 2.02 | 10.21 ± 1.39 | 10.15 ± 1.66 | 10.32 ± 0.99 | 10.10 ± 0.58 | 10.44 ± 2.23 | 0.21 | 0.56 |
| Final BW, kg | 28.60 ± 2.40 a | 14.87 ± 2.68 b*# | 18.73 ± 3.82 b* | 17.53 ± 1.13 b | 17.82 ± 2.02 b | 18.80 ± 3.76 b# | 0.73 | <0.01 |
| ADG 3, g/d | 669 ± 81 a | 166 ± 80 c* | 306 ± 101 b | 257 ± 53 bc | 276 ± 78 bc* | 299 ± 80 b | 26 | <0.01 |
| ADFI 3, g/d | 953 ± 64 a | 602 ± 174 b | 714 ± 20 b | 654 ± 141 b | 617 ± 118 b | 633 ± 48 b | 23 | <0.01 |
| G:F 3, g/g | 0.70 ± 0.13 a | 0.28 ± 0.11 b*#$ | 0.43 ± 0.14 b* | 0.39 ± 0.09 b | 0.45 ± 0.12 b# | 0.47 ± 0.08 b$ | 0.02 | <0.01 |
| G:P 3, g/g | 3.05 ± 0.42 ab | 2.25 ± 0.67 a* | 3.50 ± 1.12 ab* | 3.31 ± 1.09 ab | 3.31 ± 1.21 ab | 3.91 ± 0.79 b | 0.15 | 0.03 |
| BMD 4, g/cm 2 | 0.64 ± 0.06 ac# | 0.53 ± 0.03 b* | 0.61 ± 0.04 bc* | 0.62 ± 0.04 cd | 0.56 ± 0.04 bcd# | 0.63 ± 0.09 cd | 0.01 | 0.01 |
| BMC 5, g | 378.92 ± 64 ac | 287.33 ± 36 b | 371.67 ± 63 cd | 344.14 ± 57 bc | 292.02 ± 19 b | 326.84 ± 22 bc | 9.21 | <0.01 |
| Item | Diets 1 | SEM 2 | p-Value | |||||
|---|---|---|---|---|---|---|---|---|
| PC | NC | LD | HD | LDR | HDR | |||
| BWG 3, g | ||||||||
| Wk 1 | 3242 ± 1515 a | 851 ± 511 b | 2157 ± 1157 ab | 1192 ± 872 b | 1475 ± 1022 b | 1232 ± 934 b | 185 | <0.001 |
| Wk 2 | 4994 ± 741 a | 1021 ± 630 b | 1589 ± 594 bc | 1702 ± 321 bc | 1702 ± 1131 bc | 2334 ± 1241 c | 220 | <0.001 |
| Wk 3 | 4994 ± 945 a | 1646 ± 415 a | 2724 ± 1372 b | 1816 ± 908 b | 1645 ± 1110 b | 1816 ± 1112 b | 224 | <0.001 |
| Wk 4 | 5513 ± 714 a | 1135 ± 1864 b | 2100 ± 1349 b | 2497 ± 1329 b | 2894 ± 1371 b | 2983 ± 1591 b | 278 | <0.001 |
| CFI 3, g | ||||||||
| Wk1 | 5714 ± 80 a | 3746 ± 1063b# | 4665 ± 158 b#$ | 3950 ± 799 b | 3768 ± 688 b$ | 4190 ± 375 b | 135 | <0.001 |
| Wk 2 | 6557 ± 458 a | 3995 ± 1183 b | 4937 ± 169 b | 4461 ± 928 b | 4256 ± 785 b | 4404 ± 376 b | 161 | <0.001 |
| Wk 3 | 6726 ± 550 a | 4222 ± 1317 b | 4880 ± 105 b | 4574 ± 1014 b | 4381 ± 956 b | 4248 ± 324 b | 171 | <0.001 |
| Wk 4 | 7686 ± 897 a | 4903 ± 1363 b | 5522 ± 417 b | 5335 ± 1481 b | 4881 ± 942 b | 4884 ± 631 b | 203 | <0.001 |
| CPI 3, g | ||||||||
| Wk 1 | 1378 ± 18 a | 509 ± 144 b | 630 ± 21 b | 541 ± 109 b | 516 ± 94 b | 587 ± 52 b | 44 | <0.001 |
| Wk 2 | 1491 ± 93 a | 479 ± 142 b | 588 ± 20 b | 544 ± 113 b | 562 ± 103 b | 511 ± 43 b | 51 | <0.001 |
| Wk 3 | 1526 ± 113 a | 507 ± 158 b | 581 ± 12 b | 558 ± 123 b | 578 ± 126 b | 493 ± 37 b | 53 | <0.001 |
| Wk 4 | 1716 ± 149 a | 588 ± 163 b | 657 ± 49 b | 651 ± 180 b | 644 ± 124 b | 567 ± 73 b | 59 | <0.001 |
| G:F 3, g/g | ||||||||
| Wk 1 | 0.56 ± 0.26 * | 0.23 ± 0.16 * | 0.46 ± 0.25 | 0.30 ± 0.24 | 0.39 ± 0.23 | 0.29 ± 0.21 | 0.36 | 0.10 |
| Wk 2 | 0.76 ± 0.15 a | 0.26 ± 0.15 b | 0.32 ± 0.12 b | 0.38 ± 0.14 b | 0.40 ± 0.23 b | 0.53 ± 0.25 ab | 0.35 | <0.001 |
| Wk 3 | 0.74 ± 0.14 a | 0.40 ± 0.09 b | 0.56 ± 0.27 ab | 0.40 ± 0.27 ab | 0.38 ± 0.21 b | 0.43 ± 0.26 ab | 0.36 | 0.02 |
| Wk 4 | 0.72 ± 0.13 a | 0.23 ± 0.25 bc | 0.38 ± 0.23 acd | 0.47 ± 0.23 ac | 0.59 ± 0.35 ad | 0.62 ± 0.24 ad | 0.42 | <0.001 |
| G:P 3, g/g | ||||||||
| Wk 1 | 2.36 ± 1.08 | 1.67 ± 1.23 | 3.42 ± 1.90 | 2.20 ± 1.76 | 2.86 ± 1.97 | 2.10 ± 1.52 | 0.24 | 0.36 |
| Wk 2 | 3.35 ± 0.67 ab | 2.13 ± 1.25 a | 2.70 ± 1.03 ab | 3.13 ± 1.19 ab | 3.03 ± 1.96 ab | 4.58 ± 2.21 b | 0.23 | 0.11 |
| Wk 3 | 3.27 ± 0.64 | 3.25 ± 0.82 | 4.69 ± 0.2.27 | 3.25 ± 2.27 | 2.85 ± 1.65 | 3.68 ± 2.26 | 0.26 | 0.43 |
| Wk 4 | 3.21 ± 0.58 ab | 1.93 ± 3.13 a | 3.20 ± 1.95 ab | 3.84 ± 1.89 ab | 4.49 ± 2.69 b | 5.26 ± 2.14 b | 0.36 | 0.03 |
Publisher’s Note: MDPI stays neutral with regard to jurisdictional claims in published maps and institutional affiliations. |
© 2020 by the authors. Licensee MDPI, Basel, Switzerland. This article is an open access article distributed under the terms and conditions of the Creative Commons Attribution (CC BY) license (http://creativecommons.org/licenses/by/4.0/).
Share and Cite
Shili, C.N.; Broomhead, J.N.; Spring, S.C.; Lanahan, M.B.; Pezeshki, A. A Novel Corn-Expressed Phytase Improves Daily Weight Gain, Protein Efficiency Ratio and Nutrients Digestibility and Alters Fecal Microbiota in Pigs Fed with Very Low Protein Diets. Animals 2020, 10, 1926. https://doi.org/10.3390/ani10101926
Shili CN, Broomhead JN, Spring SC, Lanahan MB, Pezeshki A. A Novel Corn-Expressed Phytase Improves Daily Weight Gain, Protein Efficiency Ratio and Nutrients Digestibility and Alters Fecal Microbiota in Pigs Fed with Very Low Protein Diets. Animals. 2020; 10(10):1926. https://doi.org/10.3390/ani10101926
Chicago/Turabian StyleShili, Cedrick N., Jonathan N. Broomhead, Shelby C. Spring, Mike B. Lanahan, and Adel Pezeshki. 2020. "A Novel Corn-Expressed Phytase Improves Daily Weight Gain, Protein Efficiency Ratio and Nutrients Digestibility and Alters Fecal Microbiota in Pigs Fed with Very Low Protein Diets" Animals 10, no. 10: 1926. https://doi.org/10.3390/ani10101926