Article

Temperature Sensitivity and Composition of Nitrate-Reducing Microbiomes from a Full-Scale Woodchip Bioreactor Treating Agricultural Drainage Water

by
Arnaud Jéglot
1,2,*,
Sebastian Reinhold Sørensen
3,
Kirk M. Schnorr
3,
Finn Plauborg
1,2 and
Lars Elsgaard
1
1
Department of Agroecology, Aarhus University, Blichers Allé 20, 8830 Tjele, Denmark
2
WATEC Centre for Water Technology, Department of Agroecology, Aarhus University, Blichers Allé 20, 8830 Tjele, Denmark
3
Novozymes A/S, Biologiens Vej 2, 2800 Kongens Lyngby, Denmark
*
Author to whom correspondence should be addressed.
Microorganisms 2021, 9(6), 1331; https://doi.org/10.3390/microorganisms9061331
Submission received: 27 May 2021 / Revised: 15 June 2021 / Accepted: 17 June 2021 / Published: 18 June 2021
(This article belongs to the Section Environmental Microbiology)

Abstract

:
Denitrifying woodchip bioreactors (WBR), which aim to reduce nitrate (NO3) pollution from agricultural drainage water, are less efficient when cold temperatures slow down the microbial transformation processes. Conducting bioaugmentation could potentially increase the NO3 removal efficiency during these specific periods. First, it is necessary to investigate denitrifying microbial populations in these facilities and understand their temperature responses. We hypothesized that seasonal changes and subsequent adaptations of microbial populations would allow for enrichment of cold-adapted denitrifying bacterial populations with potential use for bioaugmentation. Woodchip material was sampled from an operating WBR during spring, fall, and winter and used for enrichments of denitrifiers that were characterized by studies of metagenomics and temperature dependence of NO3 depletion. The successful enrichment of psychrotolerant denitrifiers was supported by the differences in temperature response, with the apparent domination of the phylum Proteobacteria and the genus Pseudomonas. The enrichments were found to have different microbiomes’ composition and they mainly differed with native woodchip microbiomes by a lower abundance of the genus Flavobacterium. Overall, the performance and composition of the enriched denitrifying population from the WBR microbiome indicated a potential for efficient NO3 removal at cold temperatures that could be stimulated by the addition of selected cold-adapted denitrifying bacteria.

1. Introduction

Agriculture is the major source of nitrate (NO3) losses to natural water bodies, due to the extensive and increasing global use of nitrogen (N) fertilizers in crop production [1,2]. Leaching of NO3 from the upper soil horizon to artificial drains facilitates the losses of N to streams, lakes, and estuaries, where the N loading may cause eutrophication and hypoxia [3]. In Denmark, approximately 50% of the agricultural area is artificially drained [4], and localized water and nutrient management strategies are essential to comply with EU directives on the protection of the aquatic environment [5]. Therefore, denitrifying woodchip bioreactors (WBRs) have been introduced as an on-site technology to mitigate agricultural NO3 losses [6]. These bioreactors are based on microbial conversion of NO3 to atmospheric N gases and are well suited to treat the polluted water coming directly from subsurface drains [7,8]. Nitrate removal may be virtually complete under conditions with high hydraulic residence time and temperature [9], but WBRs typically show annual mean efficiencies of about 50% [10,11,12]. This reflects that the NO3 removal efficiency may drop to 10–20% at low water temperatures (~5 °C), due to the temperature response of the woodchip microbiome [11,12,13]. This drop in NO3 removal efficiency is a notable drawback in climate zones where the temperature is low during the main agricultural drainage season [14].
Nitrate removal in WBRs is primarily based on heterotrophic bacterial denitrification [8], which is an anaerobic respiration with sequential reduction of NO3 and nitrite (NO2) to the gaseous N forms of nitric oxide (NO), nitrous oxide (N2O), and dinitrogen (N2). Each step in denitrification is catalyzed by independent enzymes in a modular process and the energy metabolism, using NOx as the electron acceptor, is coupled to the oxidation of labile carbon (C) compounds [15,16,17]. In WBRs, the labile C compounds are derived from complex woodchip polymers that are degraded by lignocellulolytic microorganisms [18]. The genus Cellulomonas was recently found to harbor bacteria with lignocellulolytic and denitrifying properties [19], but generally different microbial groups are involved in fermentative woodchip decomposition and subsequent complete oxidation by denitrification [9]. Hence, the efficiency of NO3 removal at cold temperatures could be limited by the supply of labile C by fermentation and/or the kinetics of denitrification [20]. Psychrophilic denitrifying bacteria, with optimal activity and growth at <15 °C, have been isolated from permanently cold environments [21], but the occurrence and role of cold-adapted bacteria in full-scale WBRs is poorly known [19,22]. It is not clear, for example, if the microbial community of WBRs changes in response to seasonal temperatures [9], as seen in natural ecosystems [23,24], and whether this would allow for the enrichment of cold-adapted denitrifiers, which could be cultivated and used for bioaugmentation to increase the NO3 removal efficiency [12,25]. Improved understanding of the temperature response of WBR microbiomes is therefore an important next step towards the development of strategies to improve the NO3 removal from agricultural drainage water at cold temperatures.
Here, we study the microbial composition and temperature response of denitrifying enrichments from a full-scale WBR sampled at three different seasons (spring, fall, winter). We used an enrichment approach in order to obtain the response of cultivable bacteria that could play a role in potential bioaugmentation strategies. The performance of the enrichments was characterized in terms of NO3 depletion, denitrification, and growth at 5, 10, 20, and 30 °C. Further, the enrichments, as well as the native microbiome of the woodchips, were characterized by shotgun metagenomic sequencing to document the taxonomic and functional characteristics of NO3 removal.

2. Materials and Methods

2.1. Woodchip Bioreactor Facility and Sampling

The study was performed with woodchips from an operating WBR at Serupgård in Jutland, Denmark (N 56.376441, E 9.599318). The WBR consists of a 1.4-m deep basin (L × W, 41.2 × 13.2 m) with willow woodchips (2–32 mm diameter; Ny Vraa Bioenergi I/S, Tylstrup, Denmark) and has a sedimentation pond in front of the water inlet. The WBR receives drainage water from a 128-ha catchment area with arable fields grown in a traditional crop rotation with small grain, pea, and oil seed rape with regular input of mineral and organic fertilizer. The drainage season lasts from early fall to late spring with a break in summer, as typical for Danish hydrological conditions [26]. Drain water temperatures follow a seasonal pattern, typically ranging from a minimum of 2 °C in winter to 11 °C in fall. The outlet of the bioreactor drains into a small stream, eventually merging with the river Gudenå.
Woodchips were sampled from the WBR in spring (8 April 2019), fall (16 September 2019) and winter (27 January 2020) at drain water temperatures of 7.3, 10.7, and 5.9 °C, respectively. Three samples were retrieved from 1-m depth at the center of the WBR using a handheld auger (diameter, 10 cm). The woodchips were pooled in sterile plastic bags, mixed, and used for enrichments upon arrival at the laboratory.

2.2. Enrichment Cultures

After each sampling, an inoculum was prepared from representative 50-g woodchip samples by shaking in 120 mL of autoclaved pH-neutral M9 buffer overnight at 20 °C (M9 buffer; 8.8 g of Na2HPO4, 3.0 g of KH2PO4, 4.0 g of NaCl, and 0.2 g of MgSO4 in 1000 mL of deionized water) to extractmicrobes from the woodchips. Enrichment cultures were prepared by inoculating the microbial extractin M9 buffer (12 mL) into anoxic minimal denitrifying medium (MD medium) composed of M9 buffer supplemented with 300 mg L−1 of NO3 (KNO3), 10 mM of acetate (NaCH3COO), and traces of yeast extract (50 µg L−1) to ensure vitamins and co-factors for microbial growth. The medium was distributed in 200-mL serum bottles with butyl stoppers (and crimp seals), where oxygen (O2) was stripped by flushing the medium with helium (He) gas [27]. After autoclaving (121 °C, 15 min), the cooled medium was inoculated (10%, v/v) and incubated anoxically in the dark at 10 °C. General anoxic procedures were performed using Hungate techniques [28]. The enrichment lines were transferred to fresh medium 7–10 times when the increase in turbidity indicated microbial growth and/or NO3 removal was verified using Spectroquant analytical test kits (Merck Millipore, Darmstadt, Germany) based on ISO standards [29].

2.3. Temperature Dependence of NO3 Depletion, Denitrification and Growth

The temperature response of the final enrichment cultures was tested at 5, 10, 20, and 30 °C. Batch cultures were incubated in MD medium with four biological replicates per temperature. Indices of (i) nitrate reduction, (ii) denitrification, and (iii) bacterial growth were quantified as: (i) depletion of NO3, (ii) production of N2O in cultures amended with acetylene (C2H2) to inhibit nitrous oxide reductase [30], and (iii) increase in optical density (OD) measured at 600 nm (OD600) [31].
As a general procedure, 10% inoculum with OD600 of 0.16–0.17 was transferred to 200-mL serum bottles with 120 mL of anoxic MD medium. The bottles were injected with C2H2 (10% of the headspace volume) through a butyl stopper and incubated at 5, 10, 20, and 30 °C with hourly temperature logging. Samples of headspace gas (0.2 mL) were withdrawn at daily intervals and transferred to He-filled 6-mL Exetainer vials for measurement of N2O by gas chromatography as previously described [32]. Liquid samples (1 mL) were withdrawn for analysis of NO3 and ammonium (NH4+) using Spectroquant test kits and for spectrophotometric OD600 measurement (Ultrospec 3300, Amersham Biosciences, Little Chalfont, UK).

2.4. Metagenomic Analyses

Two of the four replicate enrichments at 10 °C from each season were prepared for shotgun metagenomic sequencing. To compare the microbiomes in enrichments and environmental samples, extracts of fresh woodchip microbiomes were included in the analyses in fall (20-g woodchip samples shaken overnight in 50 mL of sterile M9 buffer). All enrichments and extracts were centrifuged to harvest microbial cells (14,000× g, 10 min), and the pellets were treated with an enzyme mix to enhance cells lysis (Lysozyme, Sigma Aldrich, St. Louis, MO, USA). DNA was extracted using a QIAGEN DNA kit (Cat No. 51126, QIAGEN, Hilden, Germany) following the instructions of the manufacturer, and a DNA library was prepared with a Hamilton NGS STAR system and KapaHyper Plus kit (ROCHE Diagnostics A/S, Hvidovre, Denmark) using 100 ng DNA diluted in 12.5 µL of 10 mM Tris (pH, 7.5–8.5). Fragmentation time was 5 min and ligation was followed by 0.8× double size selection with NucleoMag beads (Macherey Nagel, Dueren, Germany). Seven PCR cycles were run and a single bead cleanup was used post amplification. The library was quantified on a plate reader using Quantit dsDNA reagent (Thermo Fisher Scientific, Roskilde, Denmark). Metagenomes were sequenced using an Illumina MiSeq system with 600 cycles sequencing kit (v3), and 2 × 300 base pairs (bp) paired end reads with dual TruSeq 8 bp indexes. The sequencing depth was 1.4–1.9 Mbp. The fastq sequences of the metagenomes were uploaded on the server MG-RAST [33]. MG-RAST uses SEED-subsystem database and KEGG database [34] to assign taxonomy and functional attributes to the microbial communities. Taxonomic diversity of sequences reads were interpreted using M5RNA (multi-source non-redundant ribosomal RNA) database with a threshold of >15 bp per contig, an E-value cut-off = 1 × 10⁻⁵, and a sequence identity of 60% [35] (Appendix A Table A1). Finally, the sequences were annotated using the database RefSeq [36] for taxonomical identification and the Kyoto Encyclopedia of Genes and Genomes (KEGG) Orthology for functional characterization. Data obtained from MG-RAST were normalized to prevent bias due to sequences length difference. The functional analysis aimed at genes associated with the pathway of denitrification (Appendix A Table A2) including nitrate reductases (nar, nap), nitrite reductases (nir), nitric oxide reductases (nor), and nitrous oxide reductases (nosZ) as well as genes (nrfA) associated with dissimilatory nitrate reduction to ammonia (DNRA).

2.5. Calculations and Statistical Analyses

The rate of NO3 depletion at each temperature was calculated from linear regression of initial time course data, representing up to 95% NO3 depletion. The temperature dependence of NO3 depletion rates was analyzed by fitting the log transformed Arrhenius equation (Equation (1)) to the data using ordinary least squares linear regression:
ln R a t e = ln A E a R T
where A is the frequency factor, Ea is the activation energy (J mol−1), R is the gas constant (8.31 J K−1 mol−1), and T is the temperature in Kelvin [37]. The temperature coefficient, Q10, defined as the factor by which the rate increases with a 10 degrees rise in temperature (i.e., from T to T + 10), was calculated from Ea as:
Q 10 = e x p ( 10 E a R T ( T + 10 ) )
Accumulation of N2O in the batch cultures was calculated as the sum of gaseous and dissolved N2O according to:
N 2 O   ( m a s s ) = C g ( V g + V l × α ) × M V t e m p , g a s
where Cg is the headspace N2O concentration, Vg is the headspace volume, Vl is the liquid volume, α is the temperature-specific Bunsen solubility coefficient for N2O, M is the mole mass of N2O, and Vtemp,gas is the temperature-specific molar gas volume [38].
Statistical analyses were performed with the software R 3.6.1 [39] to compare the NO3 depletion rates at different seasons and incubation temperatures. Mixed linear models were used to describe NO3 depletion rates in subsets of the different temperatures as function of the fixed parameter ‘sampling season’ and the random parameter ‘individual sample’, using the R package nlme [40]. Post-hoc pairwise comparisons of rates (n = 4) at the same incubation temperature, but representing different seasons, were made at a significance level of p < 0.05 using the method Tukey.
K-means clustering (k neighbors = 4, repeat = 100) was performed with the package ComplexHeatmap [41] to cluster the genomic samples based on the taxonomic abundance of the 45 most abundant species.

3. Results

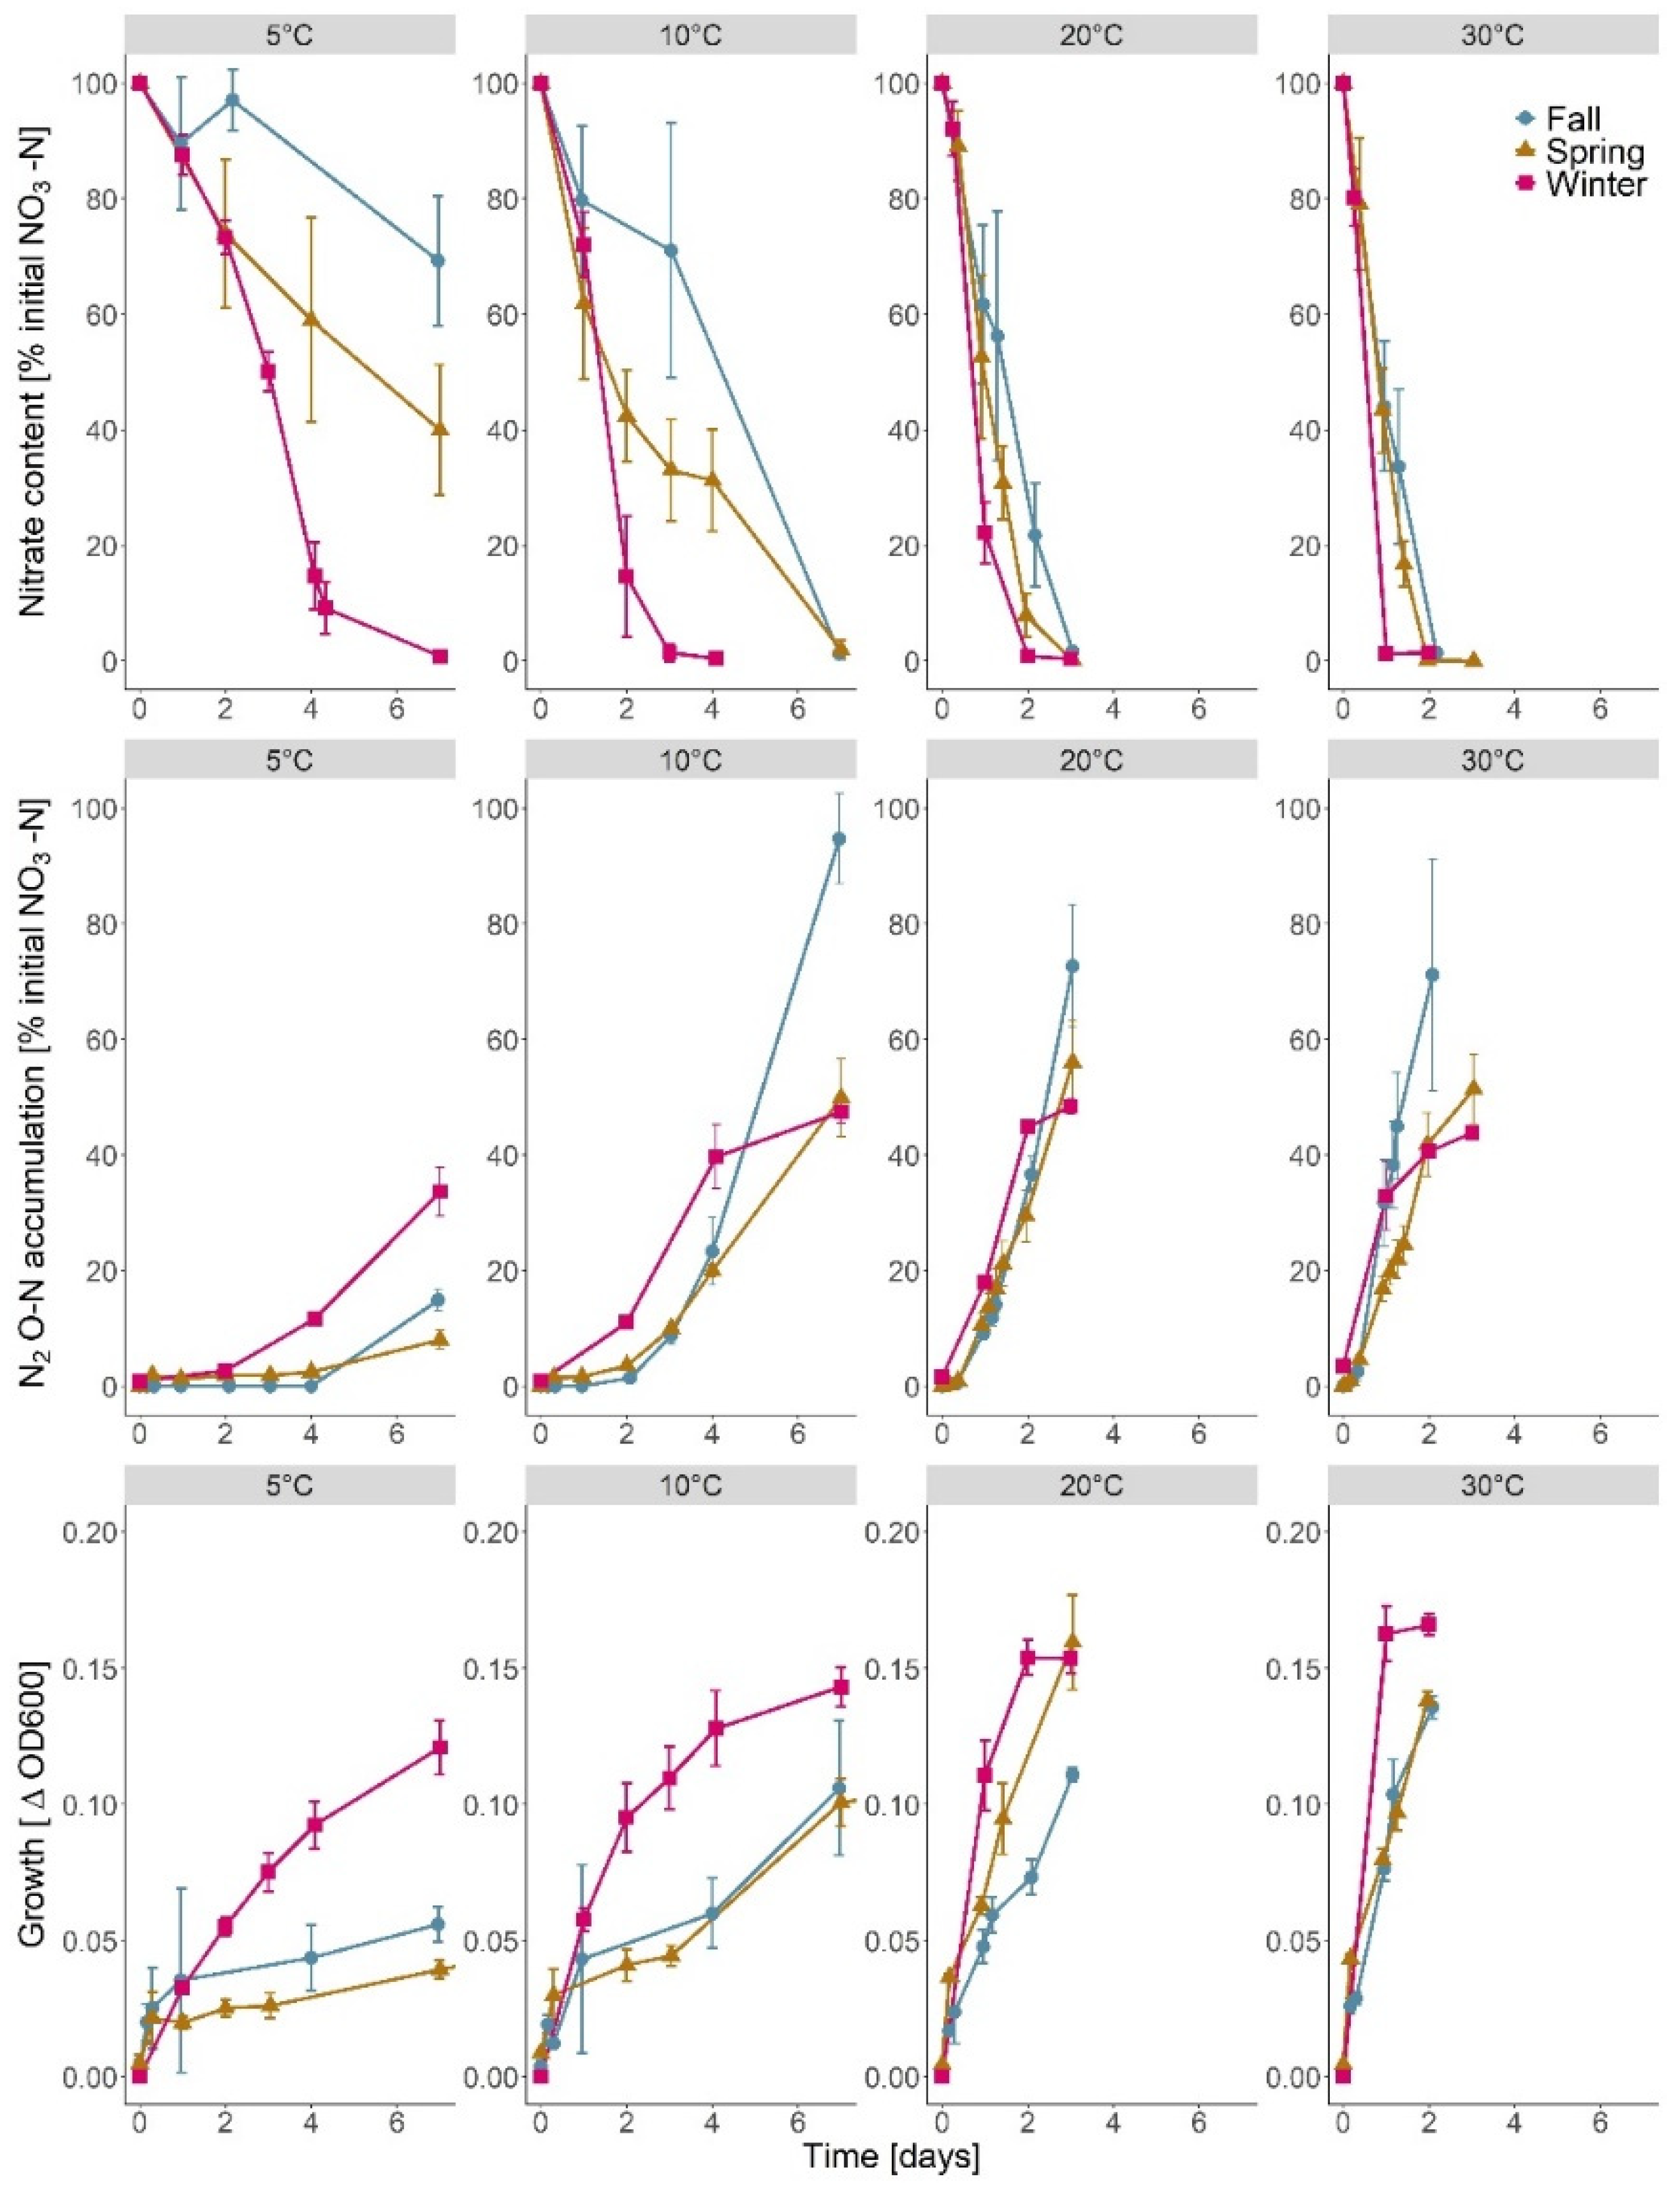
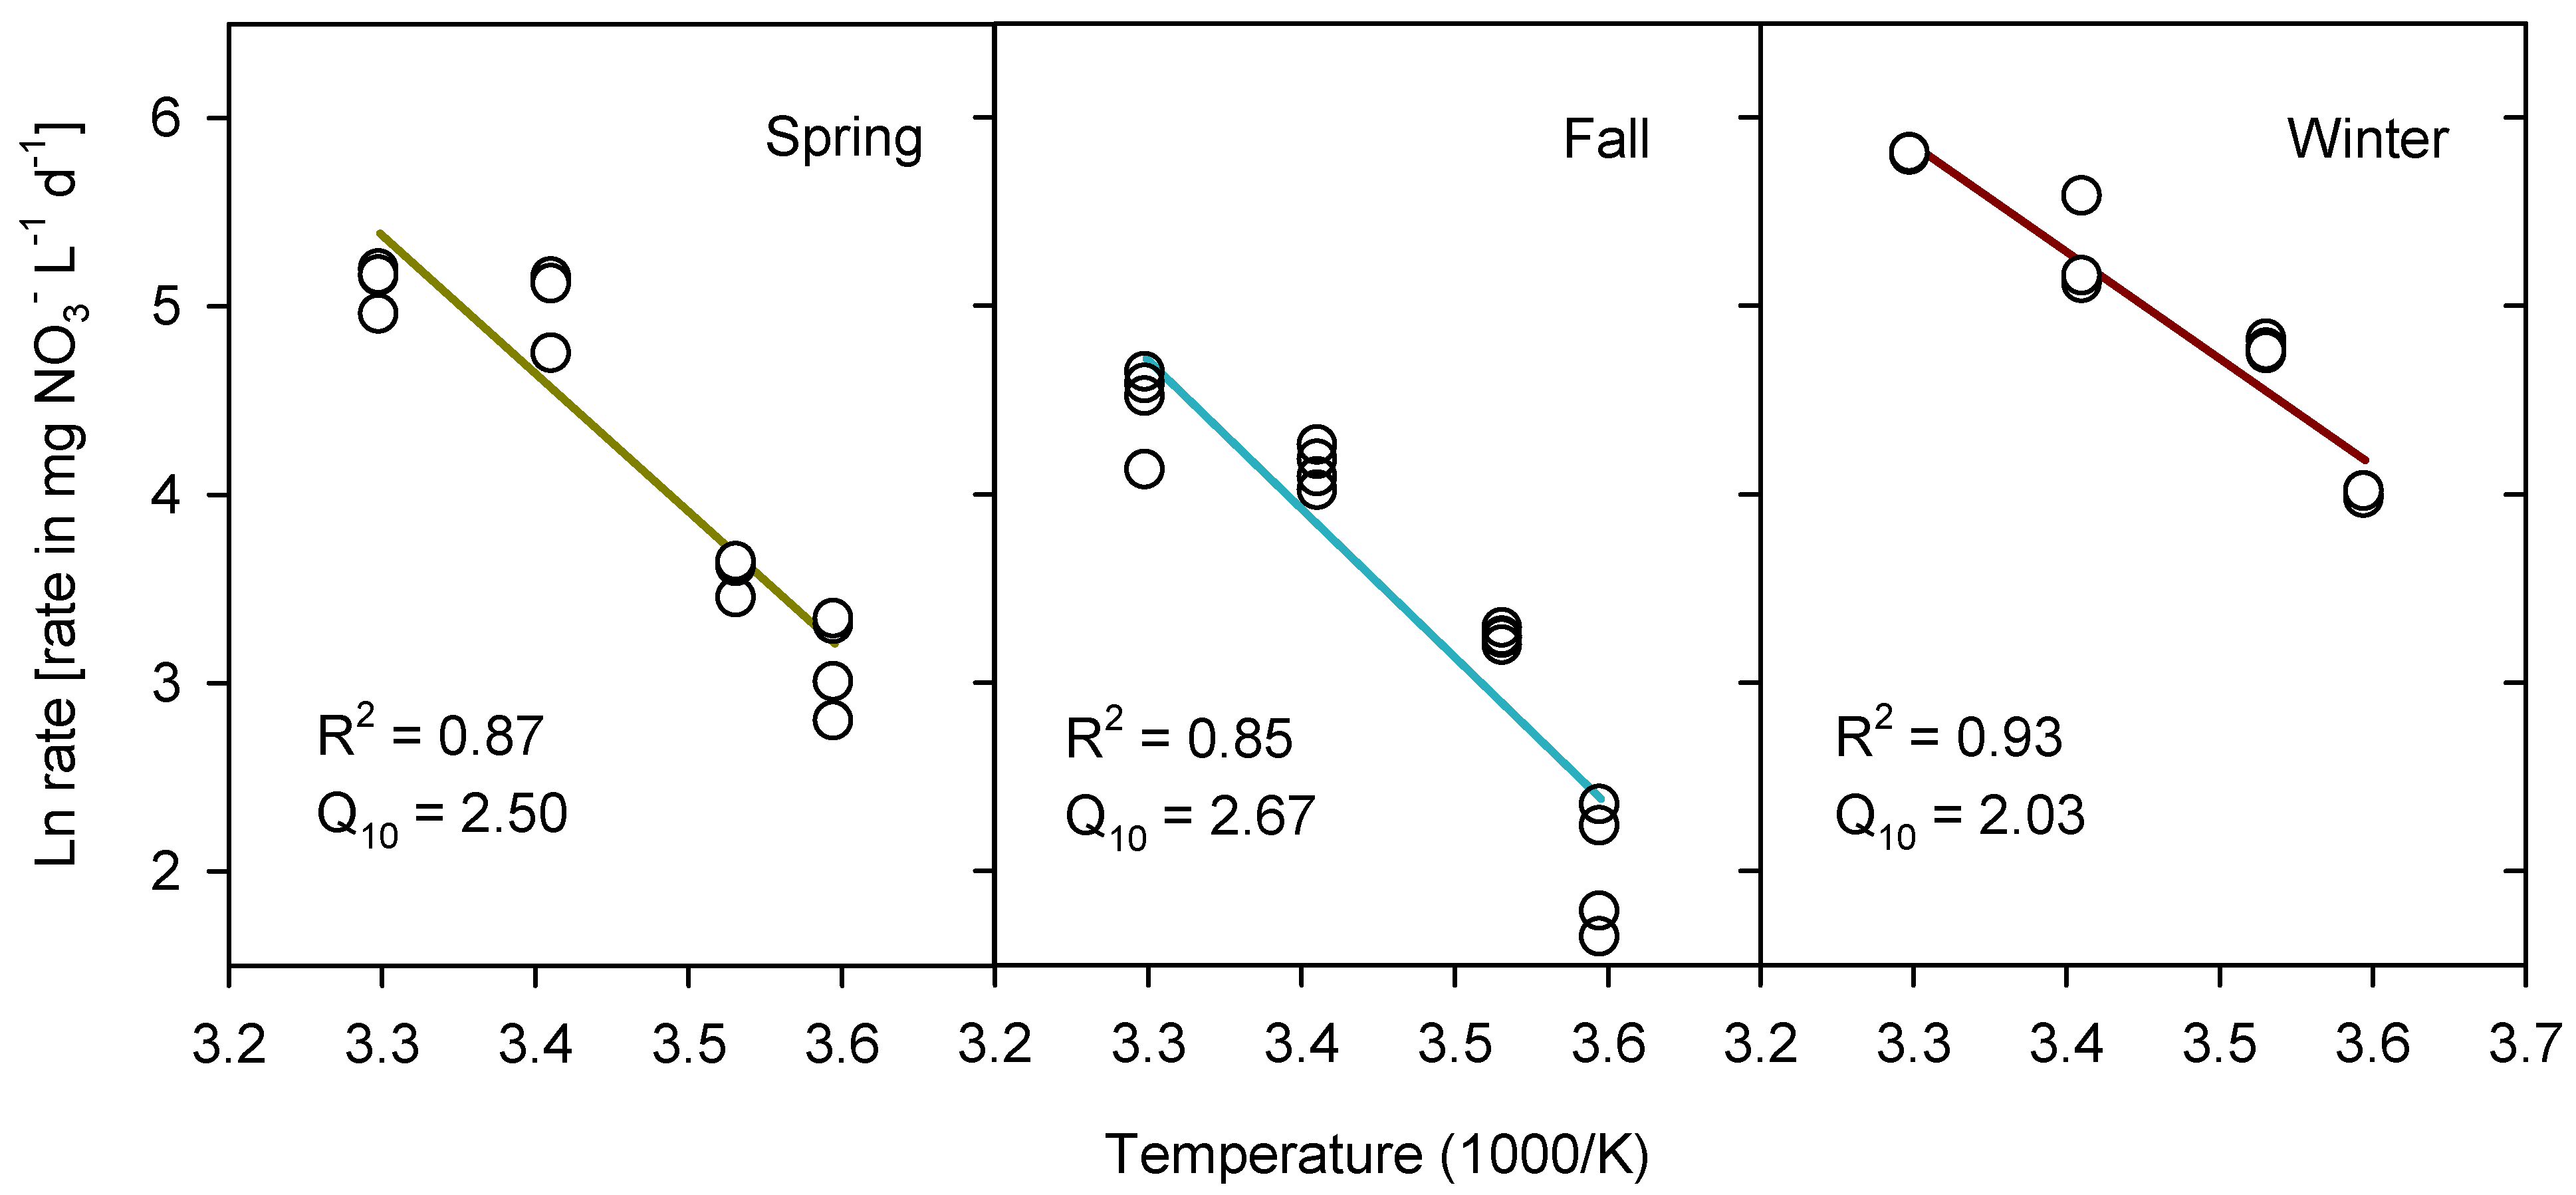
3.1. Nitrate Depletion, Denitrification and Growth

Enrichments from all seasons showed full NO3 depletion (>95%) within 2–3 d at 20 and 30 °C (Figure 1). However, at 10 °C, only winter enrichments showed full NO3 depletion within 2–3 d, as compared with 7 d for spring and fall enrichments. Winter enrichments also showed complete NO3 depletion at 5 °C, whereas spring and fall enrichments showed only 30–60% NO3 removal within 7 d (Figure 1). Rates of NO3 depletion accordingly were highest for winter enrichments at all individual temperatures (Appendix A Table A3).
Concurrent N2O accumulation confirmed that denitrification occurred and that the process at 5–10 °C was faster in the winter enrichment as compared with spring and fall enrichments (Figure 1). However, the final N2O accumulation at 10 °C was highest in the enrichment spring. The apparent ratio of NO3-N depletion to N2O-N accumulation indicated >40% conversion at 10–30 °C and <40% conversion at 5 °C. However, at 5 °C, there was an apparent time lag between NO3 depletion and N2O formation, likely due to the transformation rate of intermediates.
Nitrate depletion and N2O accumulation were accompanied by microbial growth at all temperatures (Figure 1). At 5 and 10 °C, growth was faster and reached a higher biomass for enrichment cultures from winter than from spring and fall.
The temperature dependence of NO3 removal rates was fitted well by the Arrhenius equation for the enrichment from winter (R2 = 0.93), with slightly weaker fits for spring (R2 = 0.87) and fall (R2 = 0.85), mostly due to over-prediction at 30 °C (Figure 2). Activation energies (Ea) ranged from 47–65 kJ mol−1 across the enrichments, with resulting Q10 of 2.0 for the winter enrichment and 2.5–2.7 for the spring and fall enrichments, as determined for the temperature interval from 5–15 °C (Figure 2). These temperature coefficients indicated that the denitrifying activity in the winter enrichment was less sensitive to temperature decreases than the spring and fall enrichments.
Collectively, the results of the temperature assays of NO3 depletion, denitrification and growth indicated that the microbial enrichments from the winter season had more efficient NO3 removal at 5–10 °C than the enrichments from spring and fall.

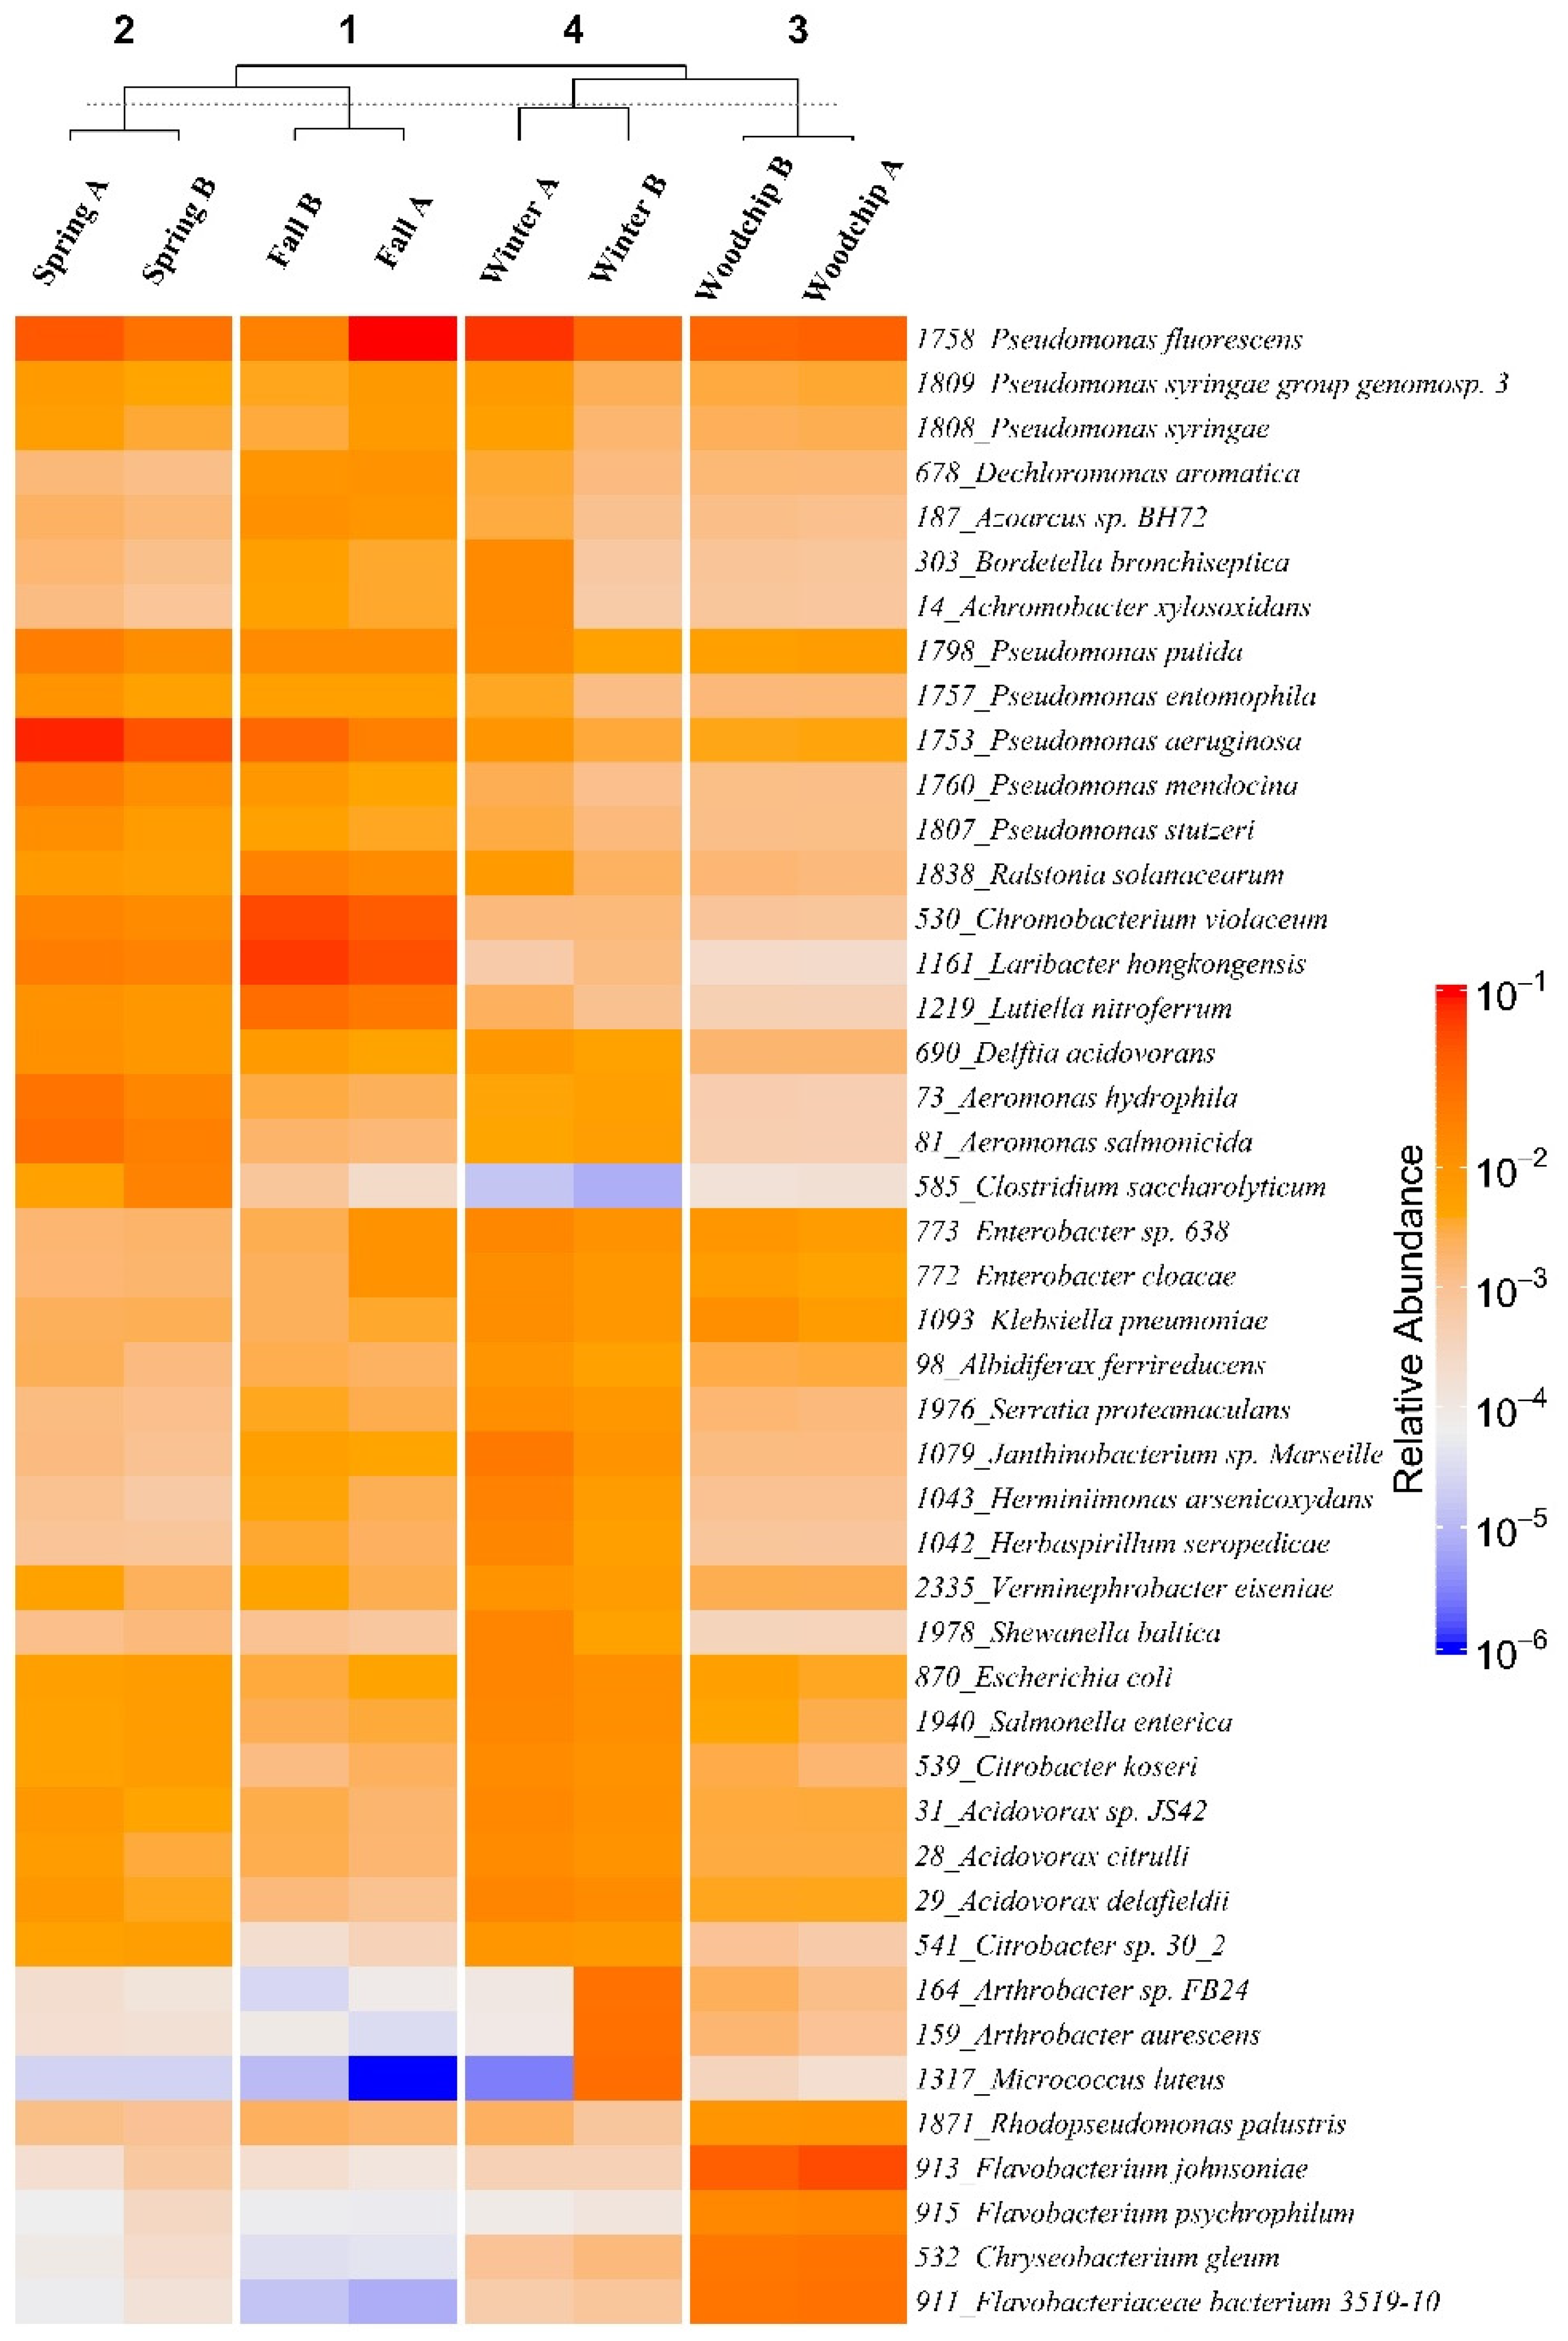
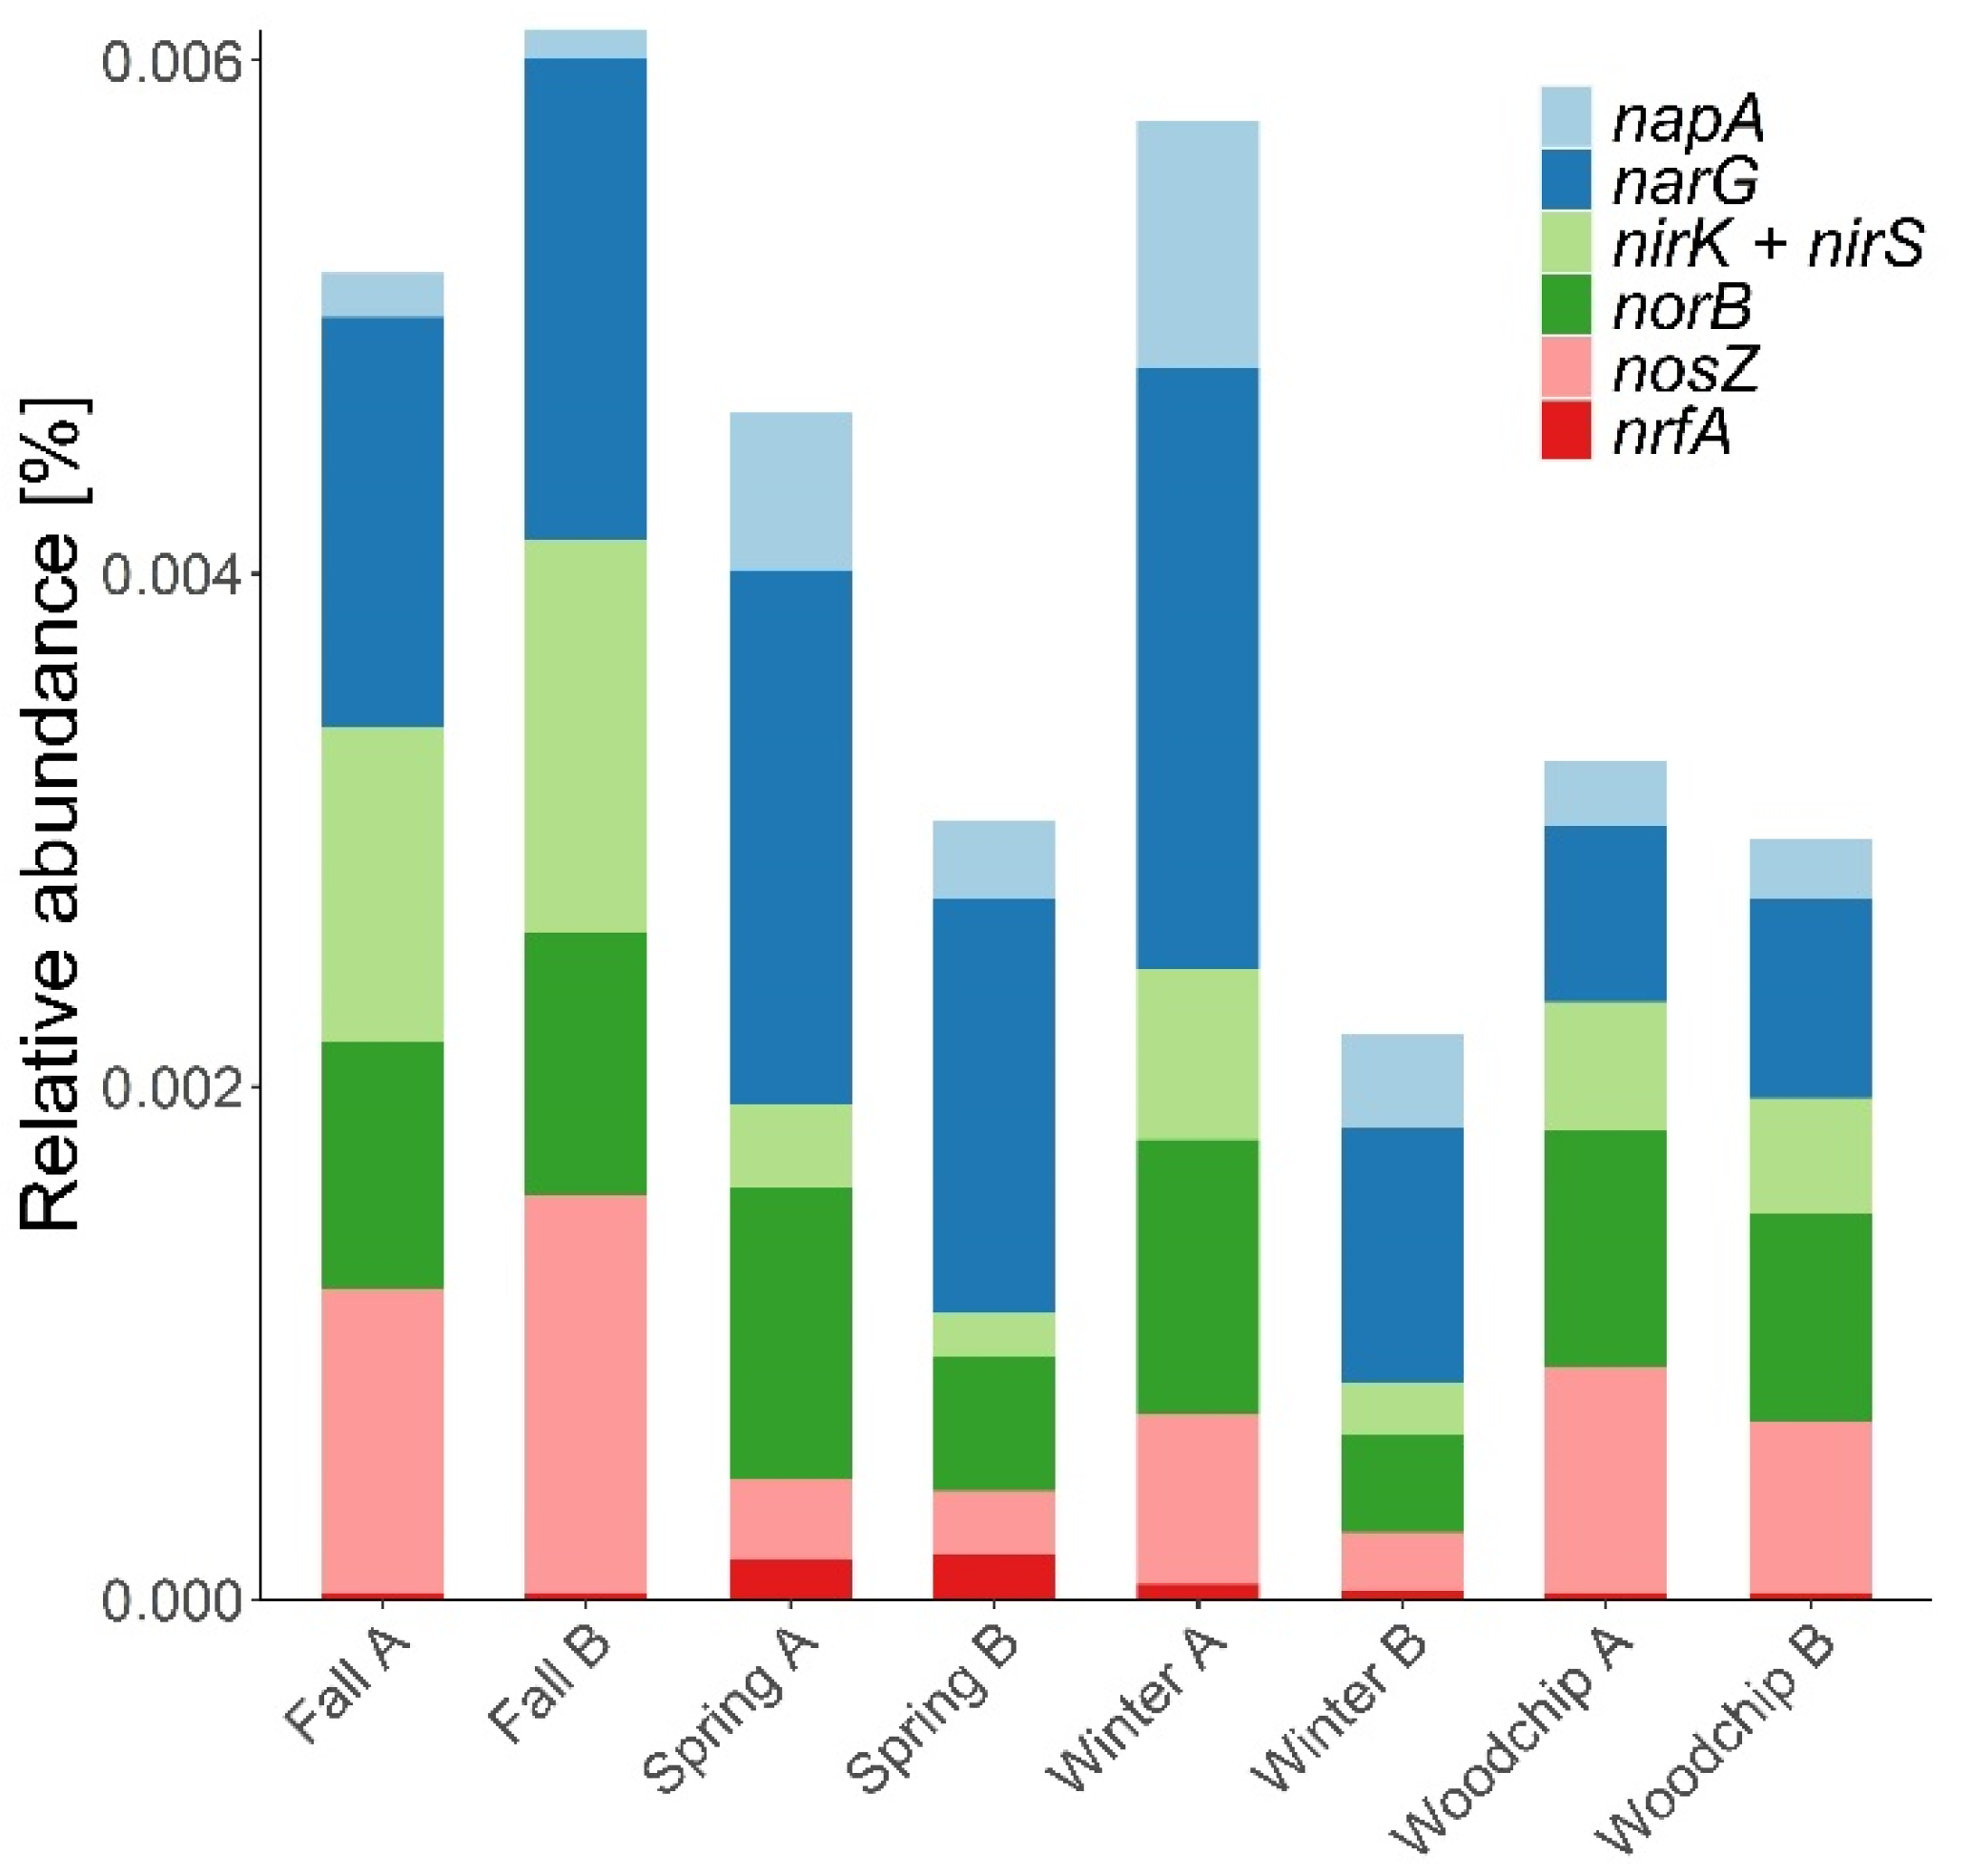
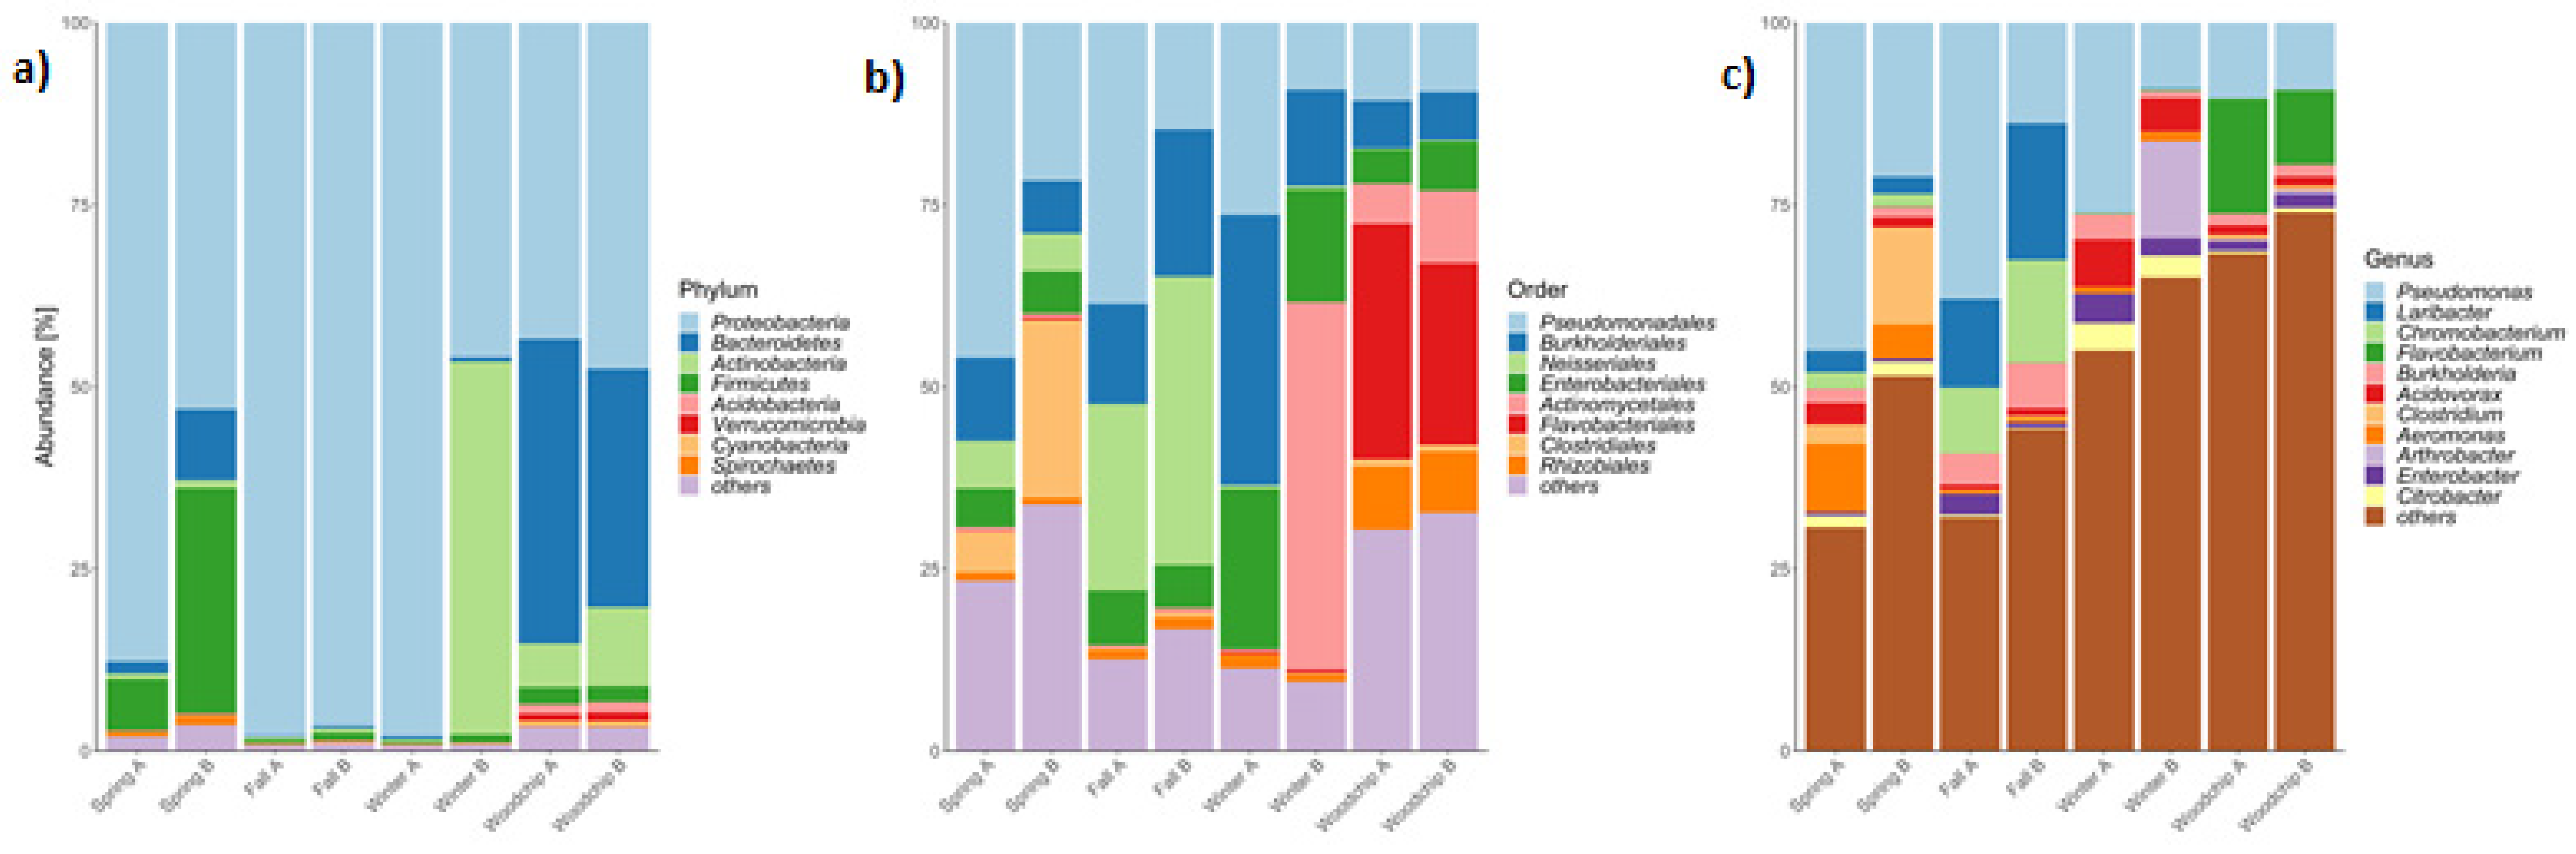
3.2. Microbiome Composition and Functional Genes

The microbial communities of the enrichments were dominated by the phylum Proteobacteria with high representation of the orders Pseudomonadales, Burkholderiales, Neisseriales, and Enterobacteriales (Appendix A Figure A1). Heatmaps and clustering showed a consistent microbiome similarity between enrichments from each sampling season as compared with the enrichments from other seasons and native woodchip microbiomes (Figure 3). The genus Pseudomonas had the highest relative abundance (9–45%) in most enrichments (Figure 3), thus showing a competitive ability to proliferate at the enrichment temperature of 10 °C. As an exception, one replicate of winter enrichments was characterized by the notable abundance of the genus Arthrobacter (Figure 3). The metagenomes obtained from woodchip samples showed a high abundance of the order Flavobacteriales and genus Flavobacterium, which was not found in the enrichment cultures (Figure 3).
The full suite of denitrification genes was found in all enrichments and native woodchip microbiomes generally with the predominance of the NO3 reductases narG and napA (Figure 4). Ratios of nitrate reductases to nitrite reductases, (nar + nap)/nir, were in the range 6–12 for the enrichments from spring and winter, and around 1.5–2 for native microbiomes and the enrichments from fall. The ratio of nir/nosZ was 0.6–0.7 in native WBR microbiomes and close to 1.0 in the enrichments. The nrfA genes associated with DNRA were found in minor proportions but seemed relatively more abundant in the enrichments from spring (Figure 4).

4. Discussion

4.1. Temperature Dependence of Nitrate Removal

Enrichment cultures from spring, fall, and winter showed a psychrotolerant temperature response with NO3 consumption and growth at 5 °C but optimum between 20 and 30 °C [42,43]. Nitrate depletion and growth proceeded without lag phases in the temperature assays (with inoculum from exponential growth at 10 °C), showing that the bacteria enriched at 10 °C were active at the alternate temperatures. Substantial production of N2O documented denitrification as a major pathway of NO3 depletion, but an exact mass balance could not be established, as N uptake in biomass was not measured and also it was uncertain if the acetylene assay was completely efficient in blocking N2O reduction to N2 [44]. Furthermore, lag phases were observed for N2O accumulation, notably at 5–10 °C for the spring and fall enrichments, indicating the slow transformation of denitrification intermediates, such as NO2 and NO (or potentially intracellular NO3), although these pools were not quantified in this study.
The temperature dependence of NO3 depletion was characterized by Ea of 47–65 kJ mol−1 (Q10 of 2.0–2.7), which corresponded to temperature coefficients of denitrification found in other ecosystems [45] and meta-anlyses of denitrifying bioreactors [46]. Winter enrichments had the lowest Q10, indicating the most robust response to temperature decreases. This is consistent with an adaptation of the WBR microbiome to environmental temperature changes throughout the year, although the present results from enrichment cultures may not quantitatively describe such effects. Seasonal changes in the denitrifying community of a saltmarsh sediment were demonstrated by King and Nedwell [23], who found that a distinct psychrotrophic population developed to a maximum size at the end of the winter but disappeared during summer. This was attributed to the seasonal selection of different denitrifiers, and enrichment studies suggested that the psychrotrophs, which became apparent during winter, belonged to the genus Pseudomonas [23].
The efficient NO3 removal by winter enrichments at low temperature could be considered surprising, since low NO3 removal efficiencies (~20%) may be observed at operating Danish WBR facilities during winter [11]. However, this contrast between enrichment and field observations essentially illustrates that the WBR microbiome holds a potential for efficient NO3 removal at cold temperatures, but this potential may need to be stimulated under field conditions for better WBR performance [14]. Since C limitation was alleviated by acetate in the present study, we measured a direct temperature response of the denitrifying population, which was more robust for the winter enrichment. Under field conditions, however, the temperature response of NO3 removal may be controlled also by the temperature response of lignocellulolytic woodchip degraders, which provide the simpler organic substrates that are completely oxidized by denitrifiers [47]. Bioaugmentation to optimize the NO3 removal efficiency of WBRs may therefore have to concurrently exploit cold-adapted denitrifiers and lignocellulolytic microorganisms, but so far further studies are needed to clarify the interaction between fermenters and denitrifiers controlling the NO3 removal rates in WBRs [9,20,48].

4.2. Taxonomic and Functional Composition

Bacterial species from the most abundant orders in the enrichments have previously been identified as dissimilatory NO3 reducers [49,50,51,52]. Notably, the high relative abundance of Pseudomonadales aligned with the ecology of pseudomonads as opportunistic heterotrophs in nutrient-rich environments [53], often being numerically dominant denitrifiers in soil ecosystems and WBRs [19,22,54,55]. Indeed, since operating WBRs may experience periods of shifting NO3 availability and redox conditions (e.g., due to breaks in drainage water flow), these ecosystems may favor versatile microbial ecophysiologies like pseudomonads, which are able to switch between anaerobic and aerobic respiration, due to O2-controlled expression of denitrification genes [56,57].
Winter enrichments, which showed efficient NO3 removal at cold temperatures, also had Burkholderiales as a dominant order with Acidovorax (Figure 3) and Polaromonas (data not shown) as abundant genera. Bacteria from the order Burkholderiales have previously been identified as key denitrifiers in WBRs [9,52] and, e.g., Acidovorax has also been found as active denitrifiers in activated sludge [58] and wetland ecosystems [59]. Moreover, Polaromonas harbors several psychrotolerant denitrifying species [60,61] and was also identified as abundant denitrifiers in WBR facilities in Minnesota (USA) operated at a water temperature of 15 °C [19]. Burkholderiales therefore appears to be an important component of cold-adapted microbiomes in WBRs.
The native microbial populations in the woodchips resembled the enrichments in terms of high relative abundance of the genus Pseudomonas. The main difference was related to the abundance of the genus Flavobacterium, which was not obtained in the enrichment cultures. Species of Flavobacterium are generally aerobic heterotrophs, many of which are psychrotolerant [62], but the genus also harbors aerobic and facultative anaerobic denitrifiers, thus demonstrating metabolic versatility [63,64,65]. The genus was also found in relatively high abundance in previous studies of denitrifiers from wastewater treatment facilities [66] and bioreactors [19,47]. The absence of Flavobacterium in our denitrifying enrichment cultures indicated the limitations of the enrichment approach, which was performed under anoxic conditions but apparently introduced selective pressures hampering competitive proliferation of Flavobacterium.
Nitrate reductases showed the highest relative abundance among the denitrification genes, notably for the enrichment cultures from spring and winter. One reason could be that nar genes are present in many microorganisms that can reduce NO3 to NO2, but lack further denitrification genes [67,68]. Nar genes are present also in DNRA bacteria [69], but the low relative abundance of nrfA genes showed that the DNRA pathway of NO3 conversion was minor in both enrichments and native WBR microbiomes. Furthermore, despite the slighlty increased nrfA abundance in some enrichments (spring), this did not result in increased NH4+ concentrations, which always remained below 5 mg N L−1 (data not shown). Ratios of nir/nosZ indicated similar genetic potential for production and consumption of N2O in the enrichment cultures and even an overcapacity of N2O consumption in the native woodchip microbiome, which could be related to the presence of non-denitrifying N2O reducers, found to play an important ecological role in many terrestrial ecosystems [70]. However, although gene numbers reflect a genetic potential, it is not a direct measure of realized metabolic activity [71]. Thus, under environmental conditions, the N2O/N2 product ratio in bacteria with genetic capacity for full denitrification is controlled by factors such as pH and availability C and N, which may fluctuate over time in WBRs [20]. Resulting differences in N2O emissions within and between different full-scale WBRs were empirically documented in a recent Danish study, but the differences were not clearly reflected by the gene distributions (J. Audet, personal communication).
The observations at 5 °C of NO3 removal with a lag phase for N2O production (Figure 1) might indicate a temperature dependent expression of denitrification genes or a different temperature sensitivity of different denitrification steps, where uptake and reduction of NO3 to NO2 could be favored at cold temperatures. During a study on denitrification genes abundance in a constructed wetland, Chon et al. [72] also observed higher nar abundance in winter (~2 °C) than in spring, which they attributed to seasonal shift in microbial populations or at least in metabolic activity. Similarly, Liao et al. [73] observed a high relative abundance of nar at low water temperature (10 °C), which concurred with incomplete denitrification and NO2 accumulation in the effluent of a lab-scale expanded granular sludge bed reactor. In environmental settings, however, NO2 is rapidly turned over by abiotic and biotic processes [74] and the ecological consequence of possible intermediate NO2 accumulation at cold temperatures in WBRs remains to be documented. In relation aquatic recipients, annual studies of N oxyanions in different Danish WBRs showed NO2 concentrations consistently below detection limit in the outlet water (<0.001 mg N L−1) thus suggesting negligible environmental impact (J. Audet, personal communication).

4.3. Conclusions and Perspectives

Bacterial NO3 reducing enrichments from an operating full-scale WBR were obtained, which showed a psychrotolerant temperature response, with growth and activity at 5 °C, notably for cultures started with samples collected in winter. These cultures also showed the most robust response to temperature decreases with a Q10 of 2.0. Pseudomonas was generally the dominating bacterial genus in enrichments and native woodchip microbiomes, and denitrification was the dominating pathway of dissimilatory NO3 reduction as indicated by functional gene analyses. In their entirety, the results indicated that even though low NO3 removal efficiencies may occur in field-scale WBRs during winter [11], the microbiomes harbor denitrifying bacteria adapted to cold temperatures, which are cultivable and show efficient NO3 reduction, e.g., at 5 °C. This conclusion corroborates results from laboratory denitrifying bioreactors [14] and other denitrification beds [75,76]. Enumeration of denitrifying bacteria was not performed in the present study, but results from wetland ecosystems have shown a dynamic fluctuation of different temperature groups of denitrifies in response to seasonal temperature changes [23]. Strategies to improve the NO3 removal from agricultural drainage water at cold temperatures, may comprise the cultivation of psychrotolerant denitrifiers, as shown in the present study, and using these microorganisms for bioaugmentation in WBRs to establish higher population densities than naturally arise by seasonal dynamics, thereby further increasing the enzymatic potential for NO3 transformation. This will necessitate the selection of strains with competitive ability to establish over time in the WRBs [12]. At the same time, however, it should be established to what extent denitrification at cold temperatures in full-scale WBRs is co-limited by the temperature response of lignocellulolytic woodchip degraders, which provide the electron and C sources for heterotrophic denitrification.

Author Contributions

Conceptualization, A.J., L.E. and S.R.S.; methodology, A.J., L.E. and S.R.S.; validation, L.E., K.M.S. and F.P.; formal analysis, A.J. and L.E.; investigation, A.J. and L.E.; resources, K.M.S. and F.P.; data curation, A.J. and L.E.; writing—original draft preparation, A.J. and L.E.; writing—review and editing, S.R.S. and K.M.S.; visualization, A.J. and L.E.; project administration, F.P. and K.M.S.; funding acquisition, F.P. All authors have read and agreed to the published version of the manuscript.

Funding

This research was funded by Aarhus University; WATEC; Novozymes A/S and The Ministry of Environment and Food of Denmark under the project “Minivådområder med matrice”, J. nr. 33010-NIFA-16-649.

Institutional Review Board Statement

Not applicable.

Informed Consent Statement

Not applicable.

Data Availability Statement

The datasets presented in this study can be found in online repositories. The names of the repository/repositories and accession number(s) can be found below: ENA/PRJRB45276. Additional information is available in Table A1.

Acknowledgments

The technicians operating the GC at the Department of Agroecology (Aarhus University) are greatly thanked for their dedicated work. And the technicians working in the section Enzyme Discovery R&D at Novozymes are thanked for their support.

Conflicts of Interest

The authors declare no conflict of interest.

Appendix A

Table A1. DNA sequences lengths and IDs at the European Nucleotide Archive (ENA) for the metagenomic samples obtained from enrichments started with woodchips from a denitrifying woodchip bioreactor located in Denmark and environmental samples (fresh woodchips from the bioreactors). Samples for enrichments were collected in different seasons (spring, fall, and winter) and the woodchip samples were gathered in winter.
SampleMG-RAST IDENA Project IDENA Sample IDBase Pairs Count
Spring Amgm4922152.3PRJRB45276ERS64951961,531,600,118
Spring Bmgm4922153.3PRJRB45276ERS64951971,514,469,895
Fall Amgm4922158.3PRJRB45276ERS64951941,173,823,046
Fall Bmgm4922157.3PRJRB45276ERS64951951,655,202,384
Winter Amgm4922159.3PRJRB45276ERS64951981,347,767,217
Winter Bmgm4922154.3PRJRB45276ERS6495199849,914,651
Woodchip Amgm4922155.3PRJRB45276ERS64952001,930,225,161
Woodchip Bmgm4922160.3PRJRB45276ERS64952011,417,188,496
Table A2. Functional genes associated with dissimilatory nitrate reduction, as retrieved from the KO database (Kanehisa et al., 2004). narG was chosen as the marker for the gene cluster narGHI and napA as the marker for the gene cluster napABCDE.
GeneKOName
narK00370narG: nitrate reductase 1, alpha subunit [EC:1.7.99.4];
K02567napA: periplasmic nitrate reductase [EC:1.7.99.4]
nirK00368nir (nirS and nirK): nitrite reductase (NO-forming) [EC:1.7.2.1]
norK04561norB: nitric oxide reductase subunit B [EC:1.7.2.5]
nosZK00376nosZ: nitrous-oxide reductase [EC:1.7.2.4]
nrfAK03385nrfA: nitrite reductase by formate, cytochrome c-552 [EC:1.7.2.2]
Table A3. Rates of nitrate (NO3) removal (mg L−1 d−1) in enrichments cultures from bioreactor woodchips sampled in three different seasons (spring, fall, winter). Data are means ± standard errors of four biological replicates, where different letters indicate differences at p < 0.05 among enrichments at the same temperature, as tested by a mixed linear model (on subsets of data by temperature). a stands for the highest depletion rate at a given temperature, b for the second highest significantly different from a, and c stands for the lowest depletion rate significantly different to a and b.
EnrichmentNO3 Depletion Rate (mg NO3 L−1 d−1)
5 °C10 °C20 °C30 °C
Spring22.9 b
(±2.8)
35.8 b
(±1.5)
155.8 a
(±13.8)
166.5 b
(±8.6)
Fall7.7 c
(±1.3)
25.4 c
(±0.5)
62.5 b
(±3.3)
88.4 c
(±9.3)
Winter54.2 a
(±0.5)
117.6 a
(±2.0)
193.6 a
(±23.4)
329.7 a
(±1.0)
Figure A1. Relative microbial abundance in different samples: spring, fall and winter enrichments cultures and woodchips. Data are shown at (a) phylum level, (b) order level of the phylum Proteobacteria, and (c) genus level of the phylum Proteobacteria.
Microorganisms 09 01331 g0a1

References

  1. Lu, C.; Tian, H. Global nitrogen and phosphorus fertilizer use for agriculture production in the past half century: Shifted hot spots and nutrient imbalance. Earth Syst. Sci. Data 2017, 9, 181–192. [Google Scholar] [CrossRef] [Green Version]
  2. Di, H.J.; Cameron, K.C. Nitrate leaching in temperate agroecosystems: Sources, factors and mitigating strategies. Nutr. Cycl. Agroecosyst. 2002, 64, 237–256. [Google Scholar] [CrossRef]
  3. Howarth, R.; Chan, F.; Conley, D.J.; Garnier, J.; Doney, S.C.; Marino, R.; Billen, G. Coupled biogeochemical cycles: Eutrophication and hypoxia in temperate estuaries and coastal marine ecosystems. Front. Ecol. Environ. 2011, 9, 18–26. [Google Scholar] [CrossRef] [Green Version]
  4. Møller, A.B.; Beucher, A.; Iversen, B.V.; Greve, M.H. Predicting artificially drained areas by means of a selective model ensemble. Geoderma 2018, 320, 30–42. [Google Scholar] [CrossRef]
  5. Kronvang, B.; Andersen, H.E.; Børgesen, C.; Dalgaard, T.; Larsen, S.E.; Bøgestrand, J.; Blicher-Mathiasen, G. Effects of policy measures implemented in Denmark on nitrogen pollution of the aquatic environment. Environ. Sci. Policy 2008, 11, 144–152. [Google Scholar] [CrossRef]
  6. Hoffmann, C.C.; Zak, D.; Kronvang, B.; Kjaergaard, C.; Carstensen, M.V.; Audet, J. An overview of nutrient transport mitigation measures for improvement of water quality in Denmark. Ecol. Eng. 2020, 155, 105863. [Google Scholar] [CrossRef]
  7. Christianson, L.; Helmers, M.; Bhandari, A.A. Practice-oriented review of woodchip bioreactors for subsurface agricultural drainage. Appl. Eng. Agric. 2012, 28, 861–874. [Google Scholar] [CrossRef]
  8. Schipper, L.A.; Robertson, W.D.; Gold, A.J.; Jaynes, D.B.; Cameron, S.C. Denitrifying bioreactors: An approach for reducing nitrate loads to receiving waters. Ecol. Eng. 2010, 36, 1532–1543. [Google Scholar] [CrossRef]
  9. Grießmeier, V.; Wienhöfer, J.; Horn, H.; Gescher, J. Assessing and modeling biocatalysis in field denitrification beds reveals key influencing factors for future constructions. Water Res. 2021, 188, 116467. [Google Scholar] [CrossRef]
  10. Christianson, L.; Bhandari, A.; Helmers, M.; Kult, K.; Sutphin, T.; Wolf, R. Performance evaluation of four field-scale agricultural drain-age denitrification bioreactors in Iowa. Trans. ASABE 2012, 55, 2163–2174. [Google Scholar] [CrossRef] [Green Version]
  11. Hoffmann, C.C.; Larsen, S.E.; Kjaergaard, C. Nitrogen removal in woodchip-based biofilters of variable designs treating agricultural drainage discharges. J. Environ. Qual. 2019, 48, 1881–1889. [Google Scholar] [CrossRef] [Green Version]
  12. Feyereisen, G.; Rosen, C.; Ishii, S.; Wang, P.; Ghane, E.; Sadowsky, M. Optimizing Woodchip Bioreactors to Treat Nitrogen and Phosphorus in Subsurface Drainage Water. Final Report for Minnesota Department of Agriculture, USA, Project #108837. 2018, pp. 1–46. Available online: https://wrl.mnpals.net/islandora/object/WRLrepository:3447 (accessed on 10 October 2020).
  13. Maxwell, B.M.; Díaz-García, C.; Martínez-Sánchez, J.J.; Birgand, F.; Álvarez-Rogel, J. Temperature sensitivity of nitrate removal in woodchip bioreactors increases with woodchip age and following drying–rewetting cycles. Environ. Sci. Water Res. Technol. 2020, 6, 2752. [Google Scholar] [CrossRef]
  14. Roser, M.B.; Feyereisen, G.W.; Spokas, K.A.; Mulla, D.J.; Strock, J.S.; Gutknecht, J. Carbon dosing increases nitrate removal rates in denitrifying bioreactors at low-temperature high-flow conditions. J. Environ. Qual. 2018, 47, 856–864. [Google Scholar] [CrossRef] [PubMed] [Green Version]
  15. Zumft, W.G. Cell biology and molecular basis of denitrification. Microbiol. Mol. Biol. Rev. 1997, 61, 533–616. [Google Scholar] [CrossRef]
  16. Shapleigh, J.P. Denitrifying prokaryotes. In The Prokaryotes: Prokaryotic Physiology and Biochemistry; Rosenberg, E., DeLong, E.F., Lory, S., Stackebrandt, E., Thompson, F., Eds.; Springer: Berlin/Heidelberg, Germany, 2013; pp. 405–425. [Google Scholar]
  17. Lazcano, C.; Zhu-Barker, X.; Decock, C. Effects of organic fertilizers on the soil microorganisms responsible for N2O emissions: A review. Microorganisms 2021, 9, 983. [Google Scholar] [CrossRef]
  18. Schipper, L.A.; Vojvodić-Vuković, M. Five years of nitrate removal, denitrification and carbon dynamics in a denitrification wall. Water Res. 2001, 35, 3473–3477. [Google Scholar] [CrossRef]
  19. Jang, J.; Anderson, E.L.; Venterea, R.T.; Sadowsky, M.J.; Rosen, C.J.; Feyereisen, G.W.; Ishii, S. Denitrifying bacteria active in woodchip bioreactors at low-temperature conditions. Front. Microbiol. 2019, 10, 635. [Google Scholar] [CrossRef]
  20. Nordström, A.; Hellman, M.; Hallin, S.; Herbert, R.B. Microbial controls on net production of nitrous oxide in a denitrifying woodchip bioreactor. J. Environ. Qual. 2021, 50, 228–240. [Google Scholar] [CrossRef]
  21. Canion, A.; Prakash, O.; Green, S.J.; Jahnke, L.; Kuypers, M.M.; Kostka, J.E. Isolation and physiological characterization of psychrophilic denitrifying bacteria from permanently cold Arctic fjord sediments (Svalbard, Norway). Environ. Microbiol. 2013, 15, 1606–1618. [Google Scholar] [CrossRef]
  22. Anderson, E.L.; Jang, J.; Venterea, R.T.; Feyereisen, G.W.; Ishii, S. Isolation and characterization of denitrifiers from woodchip bioreactors for bioaugmentation application. J. Appl. Microbiol. 2020, 129, 590–600. [Google Scholar] [CrossRef]
  23. King, D.; Nedwell, D. Changes in the nitrate-reducing community of an anaerobic saltmarsh sediment in response to seasonal selection by temperature. Microbiology 1984, 130, 2935–2941. [Google Scholar] [CrossRef] [Green Version]
  24. Smith, C.; Dong, L.; Wilson, J.; Stott, A.; Osborn, A.; Nedwell, D. Seasonal variation in denitrification and dissimilatory nitrate reduction to ammonia process rates and corresponding key functional genes along an estuarine nitrate gradient. Front. Microbiol. 2015, 6, 542. [Google Scholar] [CrossRef]
  25. El Fantroussi, S.; Agathos, S.N. Is bioaugmentation a feasible strategy for pollutant removal and site remediation? Curr. Opin. Microbiol. 2005, 8, 268–275. [Google Scholar] [CrossRef]
  26. Andersen, H.E.; Kronvang, B.; Larsen, S.E.; Hoffmann, C.C.; Jensen, T.S.; Rasmussen, E.K. Climate-change impacts on hydrology and nutrients in a Danish lowland river basin. Sci. Total Environ. 2006, 365, 223–237. [Google Scholar] [CrossRef] [PubMed]
  27. Butler, I.B.; Schoonen, M.A.A.; Rickard, D.T. Removal of dissolved oxygen from water: A comparison of four common techniques. Talanta 1994, 41, 211–215. [Google Scholar] [CrossRef]
  28. Wolfe, R.S. Microbial formation of methane. Adv. Microb. Physiol. 1971, 6, 107–146. [Google Scholar]
  29. ISO7890-1:1986. Water Quality—Determination of Nitrate—Part 1: 2,6-Dimethylphenol Spectrometric Method; ISO: Geneva, Switzerland, 1986; p. 5. [Google Scholar]
  30. Yoshinari, T.; Knowles, R. Acetylene inhibition of nitrous oxide reduction by denitrifying bacteria. Biochem. Biophys. Res. Commun. 1976, 69, 705–710. [Google Scholar] [CrossRef]
  31. Widdel, F. Theory and measurement of bacterial growth. In Grundpraktikum Mikrobiologie; Universität Bremen: Bremen, Germany, 2010; p. 11. [Google Scholar]
  32. Petersen, S.O.; Hoffmann, C.; Schäfer, C.-M.; Blicher-Mathiesen, G.; Elsgaard, L.; Kristensen, K.; Larsen, S.E.; Torp, S.B.; Greve, M.H. Annual emissions of CH4 and N2O, and ecosystem respiration, from eight organic soils in Western Denmark managed by agriculture. Biogeosciences 2012, 9, 403–422. [Google Scholar] [CrossRef] [Green Version]
  33. Meyer, F.; Paarmann, D.; D’Souza, M.; Olson, R.; Glass, E.M.; Kubal, M.; Paczian, T.; Rodriguez, A.; Stevens, R.; Wilke, A.; et al. The metagenomics RAST server—A public resource for the automatic phylogenetic and functional analysis of metagenomes. BMC Bioinform. 2018, 9, 386. [Google Scholar] [CrossRef] [PubMed] [Green Version]
  34. Kanehisa, M.; Goto, S.; Kawashima, S.; Okuno, Y.; Hattori, M. The KEGG resource for deciphering the genome. Nucleic Acids Res. 2004, 32, D277–D280. [Google Scholar] [CrossRef] [Green Version]
  35. Randle-Boggis, R.J.; Helgason, T.; Sapp, M.; Ashton, P.D. Evaluating techniques for metagenome annotation using simulated sequence data. FEMS Microbiol. Ecol. 2016, 92, 7. [Google Scholar] [CrossRef] [PubMed] [Green Version]
  36. O’Leary, N.A.; Wright, M.W.; Brister, J.R.; Ciufo, S.; Haddad, D.; McVeigh, R.; Rajput, B.; Robbertse, B.; Smith-White, B.; Ako-Adjei, D.; et al. Reference sequence (RefSeq) database at NCBI: Current status, taxonomic expansion, and functional annotation. Nucleic Acids Res. 2016, 44, D733–D745. [Google Scholar] [CrossRef] [PubMed] [Green Version]
  37. Pilling, M.J. Reaction Kinetics; Clarendon Press: Oxford, UK, 1975. [Google Scholar]
  38. Myrold, D.D. Quantification of nitrogen transformations. In Manual of Environmental Microbiology; Hurst, C.J., Knudsen, G.R., McInernay, M.J., Stetzenbach, L.D., Walter, M.V., Eds.; American Society for Microbiology Press: Washington, DC, USA, 1997; pp. 445–452. [Google Scholar]
  39. R Core Team. R: A language and environment for statistical computing. In R Foundation for Statistical Computing; Vienna, Austria, 2020; Available online: https://www.R-project.org/ (accessed on 12 November 2020).
  40. Pinheiro, J.; Bates, D.; DebRoy, S.; Sarkar, D.; R Core Team. nlme: Linear and Nonlinear Mixed Effects Models. R package Version 3.1-152. 2021. Available online: https://cran.R-project.org/package=nlme (accessed on 12 November 2020).
  41. Gu, Z.; Eils, R.; Schlesner, M. Complex heatmaps reveal patterns and correlations in multidimensional genomic data. Bioinformatics 2016, 32, 2847–2849. [Google Scholar] [CrossRef] [PubMed] [Green Version]
  42. Helmke, E.; Weyland, H. Psychrophilic versus psychrotolerant bacteria—Occurrence and significance in polar and temperate marine habitats. Cell. Mol. Biol. 2004, 50, 553–561. [Google Scholar] [PubMed]
  43. Moyer, C.L.; Eric Collins, R.; Morita, R.Y. Psychrophiles and Psychrotrophs. In Reference Module in Life Sciences; Elsevier: Amsterdam, The Netherlands, 2017. [Google Scholar] [CrossRef]
  44. Yu, K.; Struwe, S.; Kjøller, A.; Chen, G. Denitrification rate determined by nitrate disappearance is higher than determined by nitrous oxide production with acetylene blockage. Ecol. Eng. 2008, 32, 90–96. [Google Scholar] [CrossRef]
  45. Holtan-Hartwig, L.; Dörsch, P.; Bakken, L.R. Low temperature control of soil denitrifying communities: Kinetics of N2O production and reduction. Soil Biol. Biochem. 2002, 34, 1797–1806. [Google Scholar] [CrossRef]
  46. Addy, K.; Gold, A.J.; Christianson, L.E.; David, M.B.; Schipper, L.A.; Ratigan, N.A. Denitrifying bioreactors for nitrate removal: A meta-analysis. J. Environ. Qual. 2016, 45, 873–881. [Google Scholar] [CrossRef]
  47. Hellman, M.; Hubalek, V.; Juhanson, J.; Almstrand, R.; Peura, S.; Hallin, S. Substrate type determines microbial activity and community composition in bioreactors for nitrate removal by denitrification at low temperature. Sci. Total Environ. 2021, 755, 143023. [Google Scholar] [CrossRef]
  48. Kouanda, A.; Hua, G. Determination of nitrate removal kinetics model parameters in woodchip bioreactors. Water Res. 2021, 195, 116974. [Google Scholar] [CrossRef]
  49. Bellini, M.I.; Kumaresan, D.; Tarlera, S.; Murrell, J.C.; Fernandez-Scavino, A. Identification of active denitrifiers by DNA-stable isotope probing and amplicon sequencing reveals Betaproteobacteria as responsible for attenuation of nitrate contamination in a low impacted aquifer. FEMS Microbiol. Ecol. 2018, 94, fix181. [Google Scholar] [CrossRef]
  50. Grießmeier, V.; Gescher, J. Influence of the potential carbon sources for field denitrification beds on their microbial diversity and the fate of carbon and nitrate. Front. Microbiol. 2018, 9, 1313. [Google Scholar] [CrossRef]
  51. Woodard, L.M.; Bielkie, A.R.; Eisses, J.F.; Ketchum, P.A. Occurrence of nitrate reductase and molybdopterin in Xanthomonas maltophilia. Appl. Environ. Microbiol. 1990, 56, 3766–3771. [Google Scholar] [CrossRef] [Green Version]
  52. Zhang, Y.; Wang, L.; Han, W.; Wang, X.; Guo, Z.; Peng, F.; Yang, F.; Kong, M.; Gao, Y.; Chao, J.; et al. Nitrate removal, spatiotemporal communities of denitrifiers and the importance of their genetic potential for denitrification in novel denitrifying bioreactors. Bioresour. Technol. 2017, 241, 552–562. [Google Scholar] [CrossRef] [PubMed]
  53. Moore, E.; Tindall, B.; Santos, V.; Pieper, D.; Ramos, J.-L.; Palleroni, N. The Prokaryotes. In Nonmedical: Pseudomonas; Dworkin, M., Falkow, S., Rosenberg, E., Schleifer, K.H., Stackebrandt, E., Eds.; Springer: New York, NY, USA, 2005. [Google Scholar]
  54. Gamble, T.N.; Betlach, M.R.; Tiedje, J.M. Numerically dominant denitrifying bacteria from world soils. Appl. Environ. Microbiol. 1977, 33, 926–939. [Google Scholar] [CrossRef] [PubMed] [Green Version]
  55. Grießmeier, V.; Bremges, A.; McHardy, A.C.; Gescher, J. Investigation of different nitrogen reduction routes and their key microbial players in wood chip-driven denitrification beds. Sci. Rep. 2017, 7, 17028. [Google Scholar] [CrossRef] [PubMed]
  56. Shannon, K.E.M.; Saleh-Lakha, S.; Burton, D.L.; Zebarth, B.J.; Goyer, C.; Trevors, J.T. Effect of nitrate and glucose addition on denitrification and nitric oxide reductase (cnorB) gene abundance and mRNA levels in Pseudomonas mandelii inoculated into anoxic soil. Antonie Leeuwenhoek 2011, 100, 183–195. [Google Scholar] [CrossRef] [PubMed]
  57. Schreiber, K.; Krieger, R.; Benkert, B.; Eschbach, M.; Arai, H.; Schobert, M.; Jahn, D. The anaerobic regulatory network required for Pseudomonas aeruginosa nitrate respiration. J. Bacteriol. 2007, 189, 4310–4314. [Google Scholar] [CrossRef] [Green Version]
  58. Heylen, K.; Lebbe, L.; De Vos, P. Acidovorax caeni sp. nov.; a denitrifying species with genetically diverse isolates from activated sludge. Int. J. Syst. Evol. Microbiol. 2008, 58, 73–77. [Google Scholar] [CrossRef] [PubMed]
  59. Petersen, R.J.; Liang, Z.; Prinds, C.; Jéglot, A.; Thamdrup, B.; Kjaergaard, C.; Elsgaard, L. Nitrate reduction pathways and interactions with iron in the drainage water infiltration zone of a riparian wetland soil. Biogeochemistry 2020, 150, 235–255. [Google Scholar] [CrossRef]
  60. Ciok, A.; Budzik, K.; Zdanowski, M.K.; Gawor, J.; Grzesiak, J.; Decewicz, P.; Gromadka, R.; Bartosik, D.; Dziewit, L. Plasmids of psychrotolerant Polaromonas spp. isolated from Arctic and Antarctic glaciers—Diversity and role in adaptation to polar environments. Front. Microbiol. 2018, 9, 1285. [Google Scholar] [CrossRef]
  61. Irgens, R.; Gosink, J.; Staley, J. Polaromonas vacuolata gen. nov.; sp. nov.; a psychrophilic, marine, gas vacuolate bacterium from Antarctica. Int. J. Syst. Bacteriol. 1996, 46, 822–826. [Google Scholar] [CrossRef] [Green Version]
  62. Bernardet, J.-F.; Bowman, J.P. The Genus Flavobacterium. In The Prokaryotes; Dworkin, M., Falkow, S., Rosenberg, E., Schleifer, K.-H., Stackebrandt, E., Eds.; Springer: New York, NY, USA, 2006; Volume 7, pp. 481–531. [Google Scholar]
  63. Pishgar, R.; Dominic, J.A.; Sheng, Z.; Tay, J.H. Denitrification performance and microbial versatility in response to different selection pressures. Bioresour. Technol. 2019, 281, 72–83. [Google Scholar] [CrossRef]
  64. Abdelhamed, H.; Nho, S.W.; Karsi, A.; Lawrence, M.L. The role of denitrification genes in anaerobic growth and virulence of Flavobacterium columnare. J. Appl. Microbiol. 2021, 130, 1062–1074. [Google Scholar] [CrossRef] [PubMed]
  65. Deng, M.; Li, L.; Dai, Z.; Senbati, Y.; Song, K.; He, X. Aerobic denitrification affects gaseous nitrogen loss in biofloc-based recirculating aquaculture system. Aquaculture 2020, 529, 735686. [Google Scholar] [CrossRef]
  66. Yao, R.; Yuan, Q.; Wang, K. Enrichment of denitrifying bacterial community using nitrite as an electron acceptor for nitrogen removal from wastewater. Water 2020, 12, 48. [Google Scholar] [CrossRef] [Green Version]
  67. Lycus, P.; Lovise Bothun, K.; Bergaust, L.; Peele Shapleigh, J.; Bakken, L.R.; Frostegård, Å. Phenotypic and genotypic richness of denitrifiers revealed by a novel isolation strategy. ISME J. 2017, 11, 2219–2232. [Google Scholar] [CrossRef] [Green Version]
  68. Rocco, C.A.; Bergaust, L.L.; Bakken, L.R.; Yavitt, J.B.; Shapleigh, J.P. Modularity of nitrogen-oxide reducing soil bacteria: Linking phenotype to genotype. Environ. Microbiol. 2017, 19, 2507–2519. [Google Scholar] [CrossRef] [PubMed]
  69. Kraft, B.; Strous, M.; Tegetmeyer, H.E. Microbial nitrate respiration--genes, enzymes and environmental distribution. J. Biotechnol. 2011, 155, 104–117. [Google Scholar] [CrossRef] [PubMed]
  70. Hallin, S.; Philippot, L.; Löffler, F.E.; Sanford, R.A.; Jones, C.M. Genomics and ecology of novel N2O-reducing microorganisms. Trends Microbiol. 2018, 26, 43–55. [Google Scholar] [CrossRef]
  71. Frostegård, Å.; Vick, S.H.W.; Lim, N.Y.M.; Bakken, L.R.; Shapleigh, J.P. Linking meta-omics to the kinetics of denitrification intermediates reveals pH-dependent causes of N2O emissions and nitrite accumulation in soil. bioRxiv 2020. [Google Scholar] [CrossRef]
  72. Chon, K.; Chang, J.-S.; Lee, E.; Lee, J.; Ryu, J.; Cho, J. Abundance of denitrifying genes coding for nitrate (narG), nitrite (nirS), and nitrous oxide (nosZ) reductases in estuarine versus wastewater effluent-fed constructed wetlands. Ecol. Eng. 2011, 37, 64–69. [Google Scholar] [CrossRef]
  73. Liao, R.; Miao, Y.; Li, J.; Li, Y.; Wang, Z.; Du, J.; Li, Y.; Li, A.; Shen, H. Temperature dependence of denitrification microbial communities and functional genes in an expanded granular sludge bed reactor treating nitrate-rich wastewater. RSC Adv. 2018, 8, 42087–42094. [Google Scholar] [CrossRef] [Green Version]
  74. Venterea, R.T. Nitrite-driven nitrous oxide production under aerobic soil conditions: Kinetics and biochemical controls. Glob. Chang. Biol. 2007, 13, 1798–1809. [Google Scholar] [CrossRef]
  75. Warneke, S.; Schipper, L.A.; Bruesewitz, D.A.; Baisden, W.T. A comparison of different approaches for measuring denitrification rates in a nitrate removing bioreactor. Water Res. 2011, 45, 4141–4151. [Google Scholar] [CrossRef] [PubMed]
  76. Warneke, S.; Schipper, L.A.; Bruesewitz, D.A.; McDonald, I.; Cameron, S. Rates, controls and potential adverse effects of nitrate removal in a denitrification bed. Ecol. Eng. 2011, 37, 511–522. [Google Scholar] [CrossRef]
Figure 1. Time course of nitrate (NO3) depletion (first row), denitrification (second row), and growth (third row) of NO3 reducing enrichments from a woodchip bioreactor sampled in spring fall, and winter. Enrichments were assayed at 5, 10, 20, and 30 °C. Denitrification was assayed as N2O production in cultures amended with acetylene, and growth was measured as the increase in optical density at 600 nm (∆OD600).
Microorganisms 09 01331 g001
Figure 2. Arrhenius plots of the temperature effect on nitrate (NO3) removal rates in enrichments from woodchip bioreactor samples from three different seasons (spring, fall and winter). Lines show linear regression between data points (circles). Coefficients of determination (R2) and temperature coefficients (Q10), calculated from Arrhenius activation energies, are shown.
Microorganisms 09 01331 g002
Figure 3. Heatmap and cluster analysis of enrichments (spring, fall, and winter) and native woodchip samples (fall) based on the 45 relatively most abundant bacterial species. The A and B notations refer to biological replicates. Each row of the heatmap displays the abundance of an Operational Taxonomic Unit (OTU) for which the corresponding number and the identified species are displayed on the right-hand side. The number on top of the figures represents the different clusters identified with k-means clustering (k = 4).
Microorganisms 09 01331 g003
Figure 4. Relative abundance of genes related to denitrification and dissimilatory nitrate reduction to ammonia (nrfA) in enrichments (spring, fall and winter) and native woodchip samples (fall). Denitrification genes included nitrate reductases (nar, nap), nitrite reductases (nir), nitric oxide reductases (nor) and nitrous oxide reductases (nosZ). The results are presented as the number of hits attributed to each gene in percent of the total number of hits obtained from the samples with the KO database [35]. The A and B notations refer to biological replicates.
Microorganisms 09 01331 g004
Publisher’s Note: MDPI stays neutral with regard to jurisdictional claims in published maps and institutional affiliations.

