
The Gut Microbiome Alterations in Pediatric Patients with Functional Abdominal Pain Disorders

 , ,
, ,  ,
,  and
and 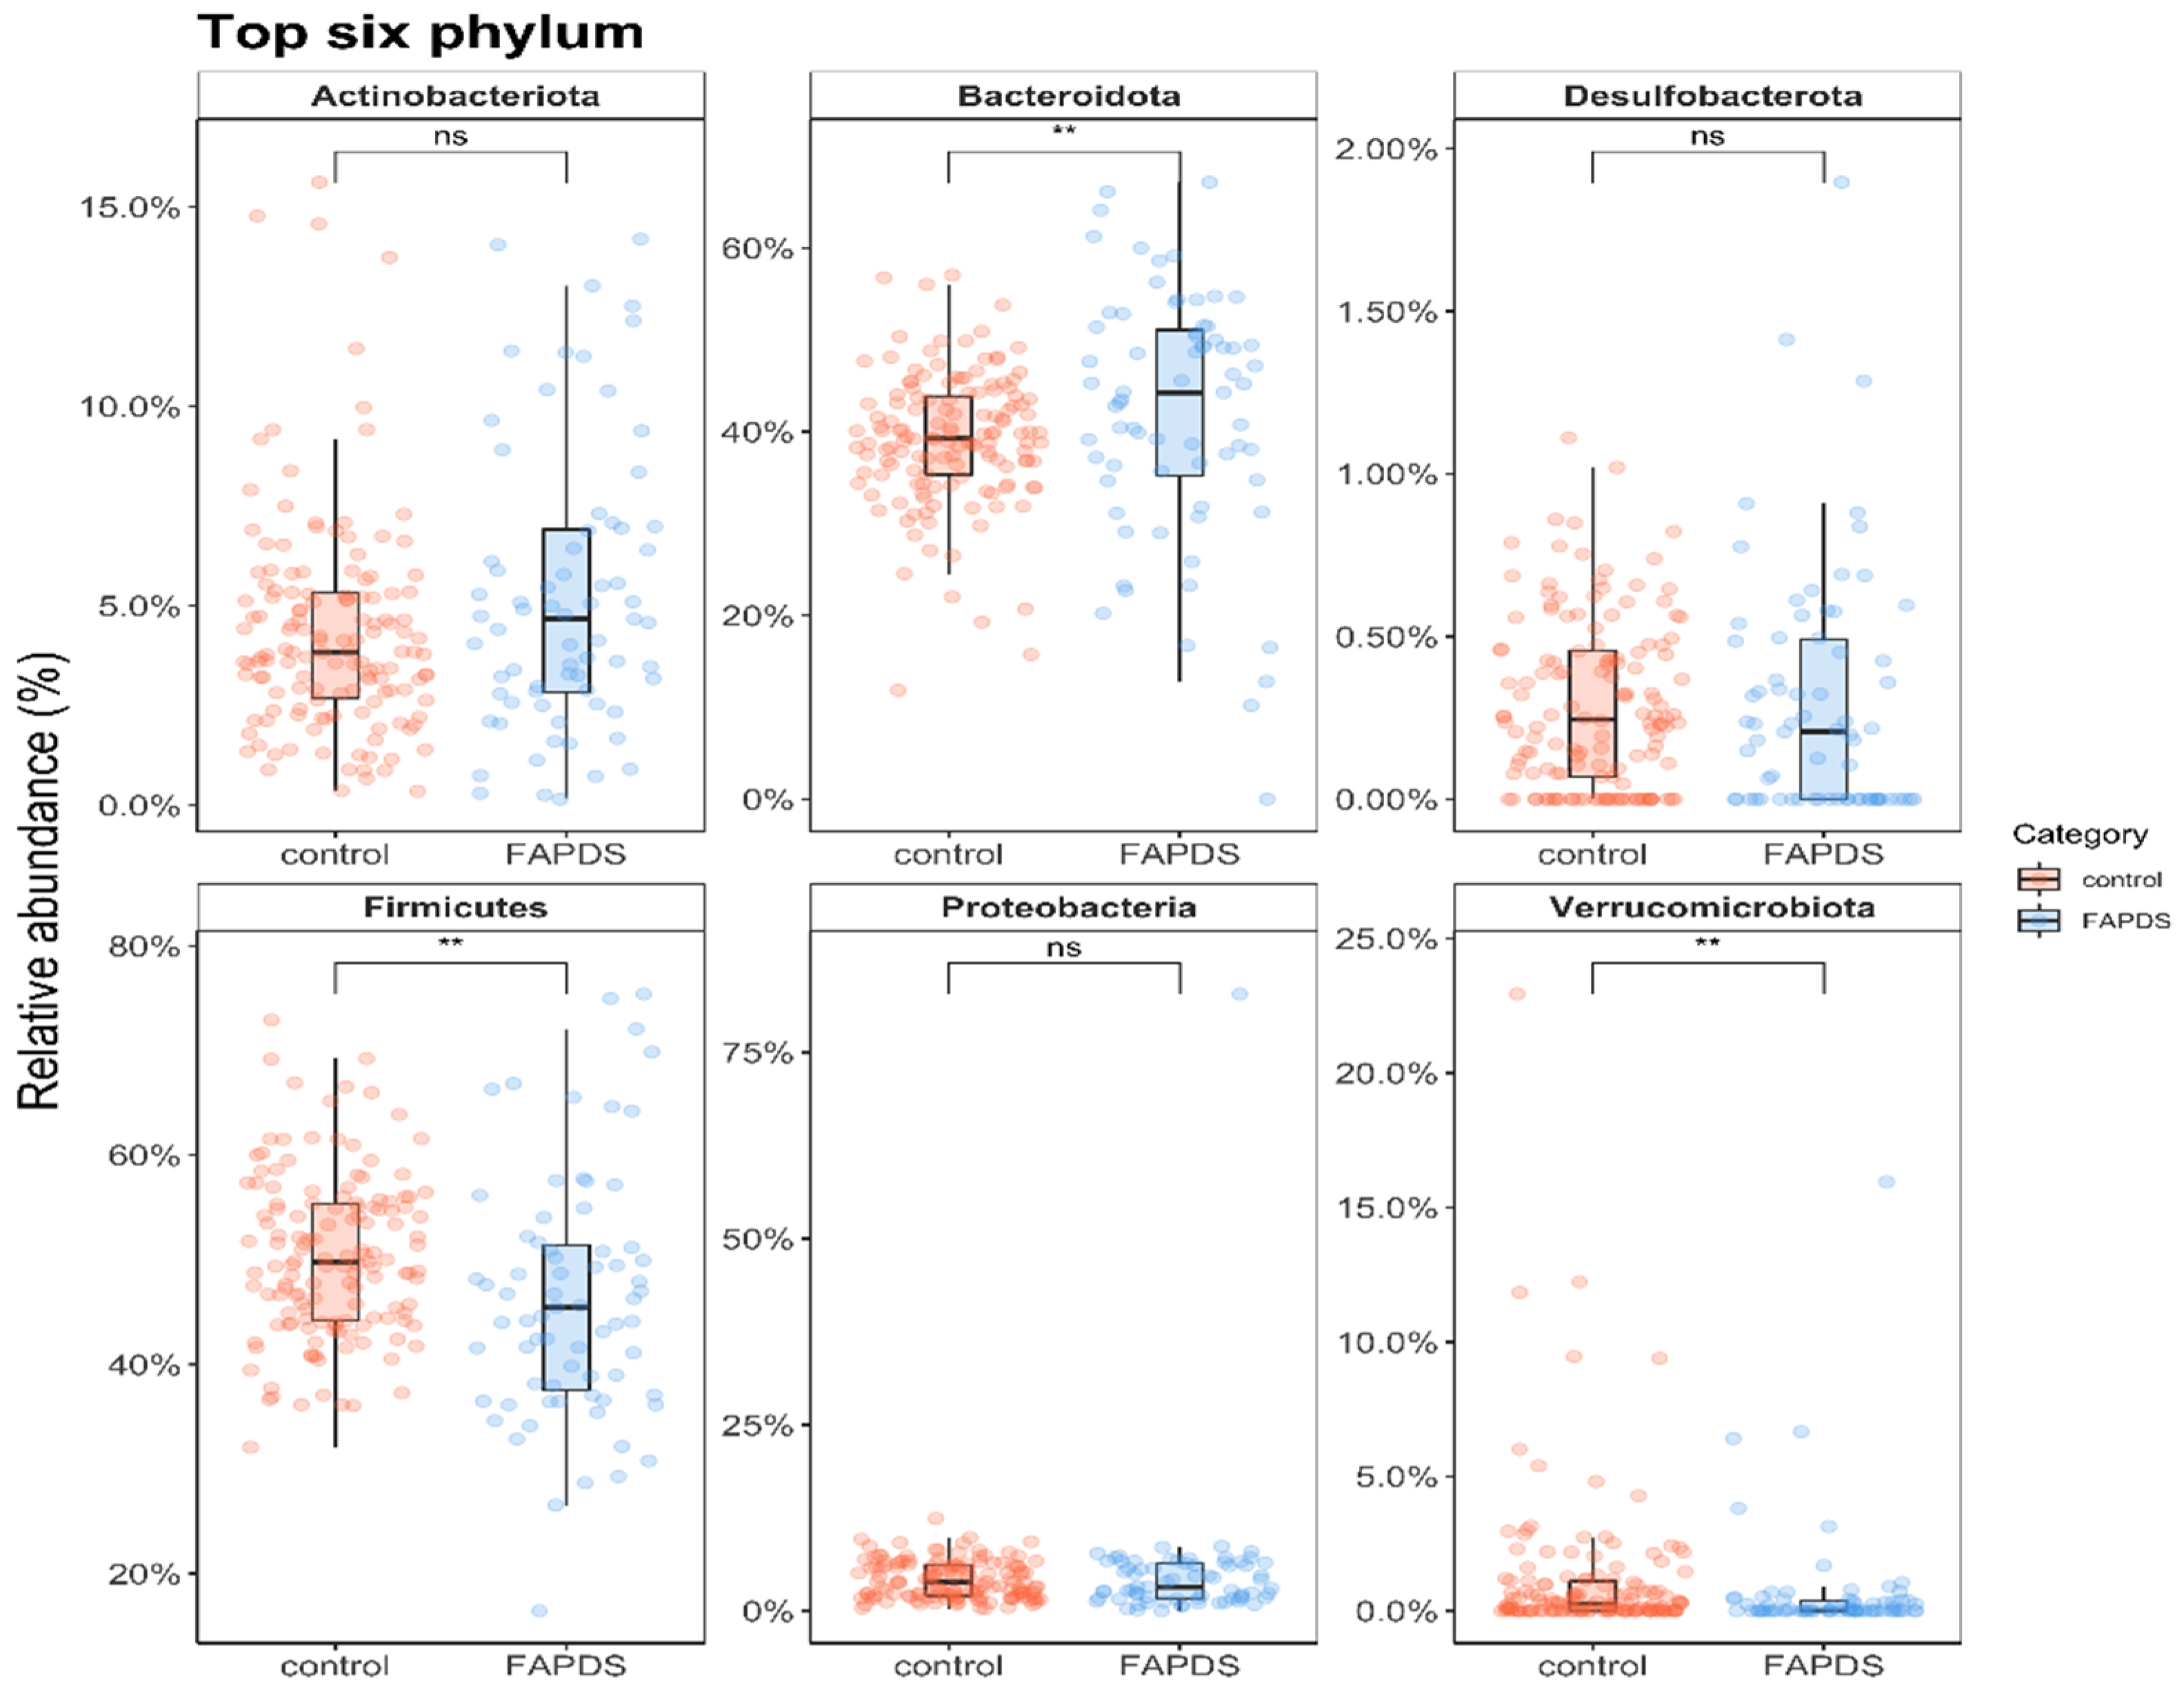
Abstract
:1. Introduction
2. Materials and Methods
2.1. Participants and Study Design
2.2. Inclusion and Exclusion Criteria
2.3. Data Collection
2.4. Stool Samples Collection
2.5. Data Management
2.6. Statistical Analyses
2.7. DNA Extraction, Next Generation of Sequencing, and Bioinformatics Analysis
3. Results
3.1. Patient Characteristics
3.2. Bacterial Relative Abundances between the Control and the FAPDs Groups
3.3. Microbial Diversity between the Control and the FAPDs Groups
3.4. Correlation of Bacterial Relative Abundances and the Severity of the Stress in FAPDs Group
3.5. Faecalibacterium Versus Bacteroides (F/B) Ratio as a Potential Diagnosis for FAPDs
4. Discussion
5. Conclusions and Future Directions
Supplementary Materials
Author Contributions
Funding
Institutional Review Board Statement
Informed Consent Statement
Data Availability Statement
Acknowledgments
Conflicts of Interest
References
- Saps, M.; Seshadri, R.; Sztainberg, M.; Schaffer, G.; Marshall, B.M.; Di Lorenzo, C. A Prospective School-based Study of Abdominal Pain and Other Common Somatic Complaints in Children. J. Pediatr. 2009, 154, 322–326. [Google Scholar] [CrossRef]
- Apley, J.; Naish, N. Recurrent Abdominal Pains: A Field Survey of 1,000 School Children. Arch. Dis. Child. 1958, 33, 165–170. [Google Scholar] [CrossRef] [Green Version]
- Rasquin-Weber, A.; Hyman, P.E.; Cucchiara, S.; Fleisher, D.R.; Hyams, J.S.; Milla, P.J.; Staiano, A. Childhood functional gastrointestinal disorders. Gut 1999, 45 (Suppl. S2), ii60–ii68. [Google Scholar] [CrossRef] [PubMed] [Green Version]
- Rasquin, A.; Di Lorenzo, C.; Forbes, D.; Guiraldes, E.; Hyams, J.S.; Staiano, A.; Walker, L.S. Childhood Functional Gastrointestinal Disorders: Child/Adolescent. Gastroenterology 2006, 130, 1527–1537. [Google Scholar] [CrossRef]
- Choung, R.S.; Locke, G.R. 3rd Epidemiology of IBS. Gastroenterol. Clin. N. Am. 2011, 40, 1–10. [Google Scholar] [CrossRef]
- Saps, M.; Blank, C.; Khan, S.; Seshadri, R.; Marshall, B.; Bass, L.; Di Lorenzo, C. Seasonal Variation in the Presentation of Abdominal Pain. J. Pediatr. Gastroenterol. Nutr. 2008, 46, 279–284. [Google Scholar] [CrossRef]
- Saps, M.; Hudgens, S.; Mody, R.; Lasch, K.; Harikrishnan, V.; Baum, C. Seasonal Patterns of Abdominal Pain Consultations Among Adults and Children. J. Pediatr. Gastroenterol. Nutr. 2013, 56, 290–296. [Google Scholar] [CrossRef]
- Saps, M.; Adams, P.; Bonilla, S.; Chogle, A.; Nichols-Vinueza, D. Parental Report of Abdominal Pain and Abdominal Pain–related Functional Gastrointestinal Disorders from a Community Survey. J. Pediatr. Gastroenterol. Nutr. 2012, 55, 707–710. [Google Scholar] [CrossRef] [PubMed]
- Maslowski, K.M.; Vieira, A.T.; Ng, A.; Kranich, J.; Sierro, F.; Yu, D.; Schilter, H.C.; Rolph, M.S.; Mackay, F.; Artis, D.; et al. Regulation of inflammatory responses by gut microbiota and chemoattractant receptor GPR43. Nature 2009, 461, 1282–1286. [Google Scholar] [CrossRef] [PubMed]
- Lathrop, S.K.; Bloom, S.; Rao, S.M.; Nutsch, K.; Lio, J.; Santacruz, N.; Peterson, D.A.; Stappenbeck, T.S.; Hsieh, C.-S. Peripheral education of the immune system by colonic commensal microbiota. Nat. Cell Biol. 2011, 478, 250–254. [Google Scholar] [CrossRef]
- Turnbaugh, P.J.; Ley, R.E.; Mahowald, M.A.; Magrini, V.; Mardis, E.R.; Gordon, J.I. An obesity-associated gut microbiome with increased capacity for energy harvest. Nat. Cell Biol. 2006, 444, 1027–1031. [Google Scholar] [CrossRef]
- Maharshak, N.; Ringel, Y.; Katibian, D.; Lundqvist, A.; Sartor, R.B.; Carroll, I.M.; Ringel-Kulka, T. Fecal and Mucosa-Associated Intestinal Microbiota in Patients with Diarrhea-Predominant Irritable Bowel Syndrome. Dig. Dis. Sci. 2018, 63, 1890–1899. [Google Scholar] [CrossRef]
- Tap, J.; Derrien, M.; Törnblom, H.; Brazeilles, R.; Cools-Portier, S.; Doré, J.; Störsrud, S.; Le Nevé, B.; Öhman, L.; Simrén, M. Identification of an Intestinal Microbiota Signature Associated With Severity of Irritable Bowel Syndrome. Gastroenterology 2017, 152, 111–123.e8. [Google Scholar] [CrossRef] [Green Version]
- Zhou, Y.; Zhi, F. Lower Level of Bacteroides in the Gut Microbiota Is Associated with Inflammatory Bowel Disease: A Meta-Analysis. BioMed Res. Int. 2016, 2016, 1–9. [Google Scholar] [CrossRef] [Green Version]
- Srinivasan, R.; Akobeng, A.K. Thalidomide and thalidomide analogues for induction of remission in Crohn’s disease. Cochrane Database Syst. Rev. 2009, CD007350. [Google Scholar] [CrossRef] [PubMed]
- Chakraborti, C.K. New-found link between microbiota and obesity. World J. Gastrointest. Pathophysiol. 2015, 6, 110–119. [Google Scholar] [CrossRef] [PubMed]
- Jeffery, I.; O’Toole, P.; Öhman, L.; Claesson, M.; Deane, J.; Quigley, E.M.M.; Simrén, M. An irritable bowel syndrome subtype defined by species-specific alterations in faecal microbiota. Gut 2011, 61, 997–1006. [Google Scholar] [CrossRef]
- Bauer, P.V.; Hamr, S.C.; Duca, F.A. Regulation of energy balance by a gut–brain axis and involvement of the gut microbiota. Cell. Mol. Life Sci. 2016, 73, 737–755. [Google Scholar] [CrossRef]
- Harris, P.A.; Taylor, R.; Thielke, R.; Payne, J.; Gonzalez, N.; Conde, J.G. Research electronic data capture (REDCap)—A metadata-driven methodology and workflow process for providing translational research informatics support. J. Biomed. Inform. 2009, 42, 377–381. [Google Scholar] [CrossRef] [PubMed] [Green Version]
- Bevans, K.B.; Gardner, W.; Pajer, K.; Riley, A.W.; Forrest, C.B. Qualitative Development of the PROMIS(R) Pediatric Stress Response Item Banks. J. Pediatr. Psychol. 2012, 38, 173–191. [Google Scholar] [CrossRef] [Green Version]
- Dominianni, C.; Wu, J.; Hayes, R.B.; Ahn, J. Comparison of methods for fecal microbiome biospecimen collection. BMC Microbiol. 2014, 14, 103. [Google Scholar] [CrossRef] [Green Version]
- Bevans, K.B.; Gardner, W.; Pajer, K.A.; Becker, B.; Carle, A.; Tucker, C.A.; Forrest, C.B. Psychometric Evaluation of the PROMIS(R) Pediatric Psychological and Physical Stress Experiences Measures. J. Pediatr. Psychol. 2018, 43, 678–692. [Google Scholar] [CrossRef] [Green Version]
- Bolyen, E.; Rideout, J.R.; Dillon, M.R.; Bokulich, N.A.; Abnet, C.C.; Al-Ghalith, G.A.; Alexander, H.; Alm, E.J.; Arumugam, M.; Asnicar, F.; et al. Reproducible, interactive, scalable and extensible microbiome data science using QIIME 2. Nat. Biotechnol. 2019, 37, 852–857. [Google Scholar] [CrossRef]
- Pittayanon, R.; Lau, J.T.; Yuan, Y.; Leontiadis, G.I.; Tse, F.; Surette, M.; Moayyedi, P. Gut Microbiota in Patients with Irritable Bowel Syndrome—A Systematic Review. Gastroenterology 2019, 157, 97–108. [Google Scholar] [CrossRef] [Green Version]
- Benítez-Páez, A.; del Pugar, E.M.G.; López-Almela, I.; Moya-Pérez, Á.; Codoñer-Franch, P.; Sanz, Y. Depletion of Blautia Species in the Microbiota of Obese Children Relates to Intestinal Inflammation and Metabolic Phenotype Worsening. mSystems 2020, 5, e00857-19. [Google Scholar] [CrossRef] [PubMed] [Green Version]
- Shin, N.R.; Lee, J.C.; Lee, H.Y.; Kim, M.S.; Whon, T.W.; Lee, M.S.; Bae, J.W. An increase in the Akkermansia spp. population induced by metformin treatment improves glucose ho-meostasis in diet-induced obese mice. Gut 2014, 63, 727–735. [Google Scholar] [CrossRef] [Green Version]
- Chelakkot, C.; Choi, Y.; Kim, D.K.; Park, H.T.; Ghim, J.; Kwon, Y.; Jeon, J.; Kim, M.S.; Jee, Y.K.; Gho, Y.S.; et al. Akkermansia muciniphila-derived extracellular vesicles influence gut permeability through the regu-lation of tight junctions. Exp. Mol. Med. 2018, 50, e450. [Google Scholar] [CrossRef]
- Naito, Y.; Uchiyama, K.; Takagi, T. A next-generation beneficial microbe: Akkermansia muciniphila. J. Clin. Biochem. Nutr. 2018, 63, 33–35. [Google Scholar] [CrossRef] [PubMed] [Green Version]
- Tana, C.; Umesaki, Y.; Imaoka, A.; Handa, T.; Kanazawa, M.; Fukudo, S. Altered profiles of intestinal microbiota and organic acids may be the origin of symptoms in irritable bowel syndrome. Neurogastroenterol. Motil. 2009, 22, 512–519. [Google Scholar] [CrossRef]
- Wang, H.; Gong, J.; Wang, W.; Long, Y.; Fu, X.; Fu, Y.; Qian, W.; Hou, X. Are There Any Different Effects of Bifidobacterium, Lactobacillus and Streptococcus on Intestinal Sensation, Barrier Function and Intestinal Immunity in PI-IBS Mouse Model? PLoS ONE 2014, 9, e90153. [Google Scholar] [CrossRef] [PubMed] [Green Version]
- Rivière, A.; Selak, M.; Lantin, D.; Leroy, F.; De Vuyst, L. Bifidobacteria and Butyrate-Producing Colon Bacteria: Importance and Strategies for Their Stimulation in the Human Gut. Front. Microbiol. 2016, 7, 979. [Google Scholar] [CrossRef] [PubMed] [Green Version]
- Pinto-Sanchez, M.I.; Hall, G.B.; Ghajar, K.; Nardelli, A.; Bolino, C.; Lau, J.T.; Martin, F.-P.; Cominetti, O.; Welsh, C.; Rieder, A.; et al. Probiotic Bifidobacterium longum NCC3001 Reduces Depression Scores and Alters Brain Activity: A Pilot Study in Patients With Irritable Bowel Syndrome. Gastroenterology 2017, 153, 448–459. [Google Scholar] [CrossRef]
- De la Fuente, M.; MacDonald, T.T.; Hermoso, M.A. Editorial: Intestinal Homeostasis and Disease: A Complex Partnership Between Immune Cells, Non-Immune Cells, and the Microbiome. Front. Immunol. 2019, 10, 2775. [Google Scholar] [CrossRef] [PubMed] [Green Version]
- Liu, H.-N.; Wu, H.; Chen, Y.-Z.; Chen, Y.-J.; Shen, X.-Z.; Liu, T.-T. Altered molecular signature of intestinal microbiota in irritable bowel syndrome patients compared with healthy controls: A systematic review and meta-analysis. Dig. Liver Dis. 2017, 49, 331–337. [Google Scholar] [CrossRef] [PubMed]
- Chong, P.P.; Chin, V.K.; Looi, C.Y.; Wong, W.F.; Madhavan, P.; Yong, V.C. The Microbiome and Irritable Bowel Syndrome—A Review on the Pathophysiology, Current Research and Future Therapy. Front. Microbiol. 2019, 2019. 10, 1136. [Google Scholar] [CrossRef] [Green Version]


Publisher’s Note: MDPI stays neutral with regard to jurisdictional claims in published maps and institutional affiliations. |
© 2021 by the authors. Licensee MDPI, Basel, Switzerland. This article is an open access article distributed under the terms and conditions of the Creative Commons Attribution (CC BY) license (https://creativecommons.org/licenses/by/4.0/).
Share and Cite
Abomoelak, B.; Pemberton, V.; Deb, C.; Campion, S.; Vinson, M.; Mauck, J.; Manipadam, J.; Sudakaran, S.; Patel, S.; Saps, M.; et al. The Gut Microbiome Alterations in Pediatric Patients with Functional Abdominal Pain Disorders. Microorganisms 2021, 9, 2354. https://doi.org/10.3390/microorganisms9112354
Abomoelak B, Pemberton V, Deb C, Campion S, Vinson M, Mauck J, Manipadam J, Sudakaran S, Patel S, Saps M, et al. The Gut Microbiome Alterations in Pediatric Patients with Functional Abdominal Pain Disorders. Microorganisms. 2021; 9(11):2354. https://doi.org/10.3390/microorganisms9112354
Chicago/Turabian StyleAbomoelak, Bassam, Veronica Pemberton, Chirajyoti Deb, Stephani Campion, Michelle Vinson, Jennifer Mauck, Joseph Manipadam, Sailendharan Sudakaran, Samit Patel, Miguel Saps, and et al. 2021. "The Gut Microbiome Alterations in Pediatric Patients with Functional Abdominal Pain Disorders" Microorganisms 9, no. 11: 2354. https://doi.org/10.3390/microorganisms9112354