Dietary Organic Acids Modulate Gut Microbiota and Improve Growth Performance of Nursery Pigs

 , and
, and
Abstract
:1. Introduction
2. Materials and Methods
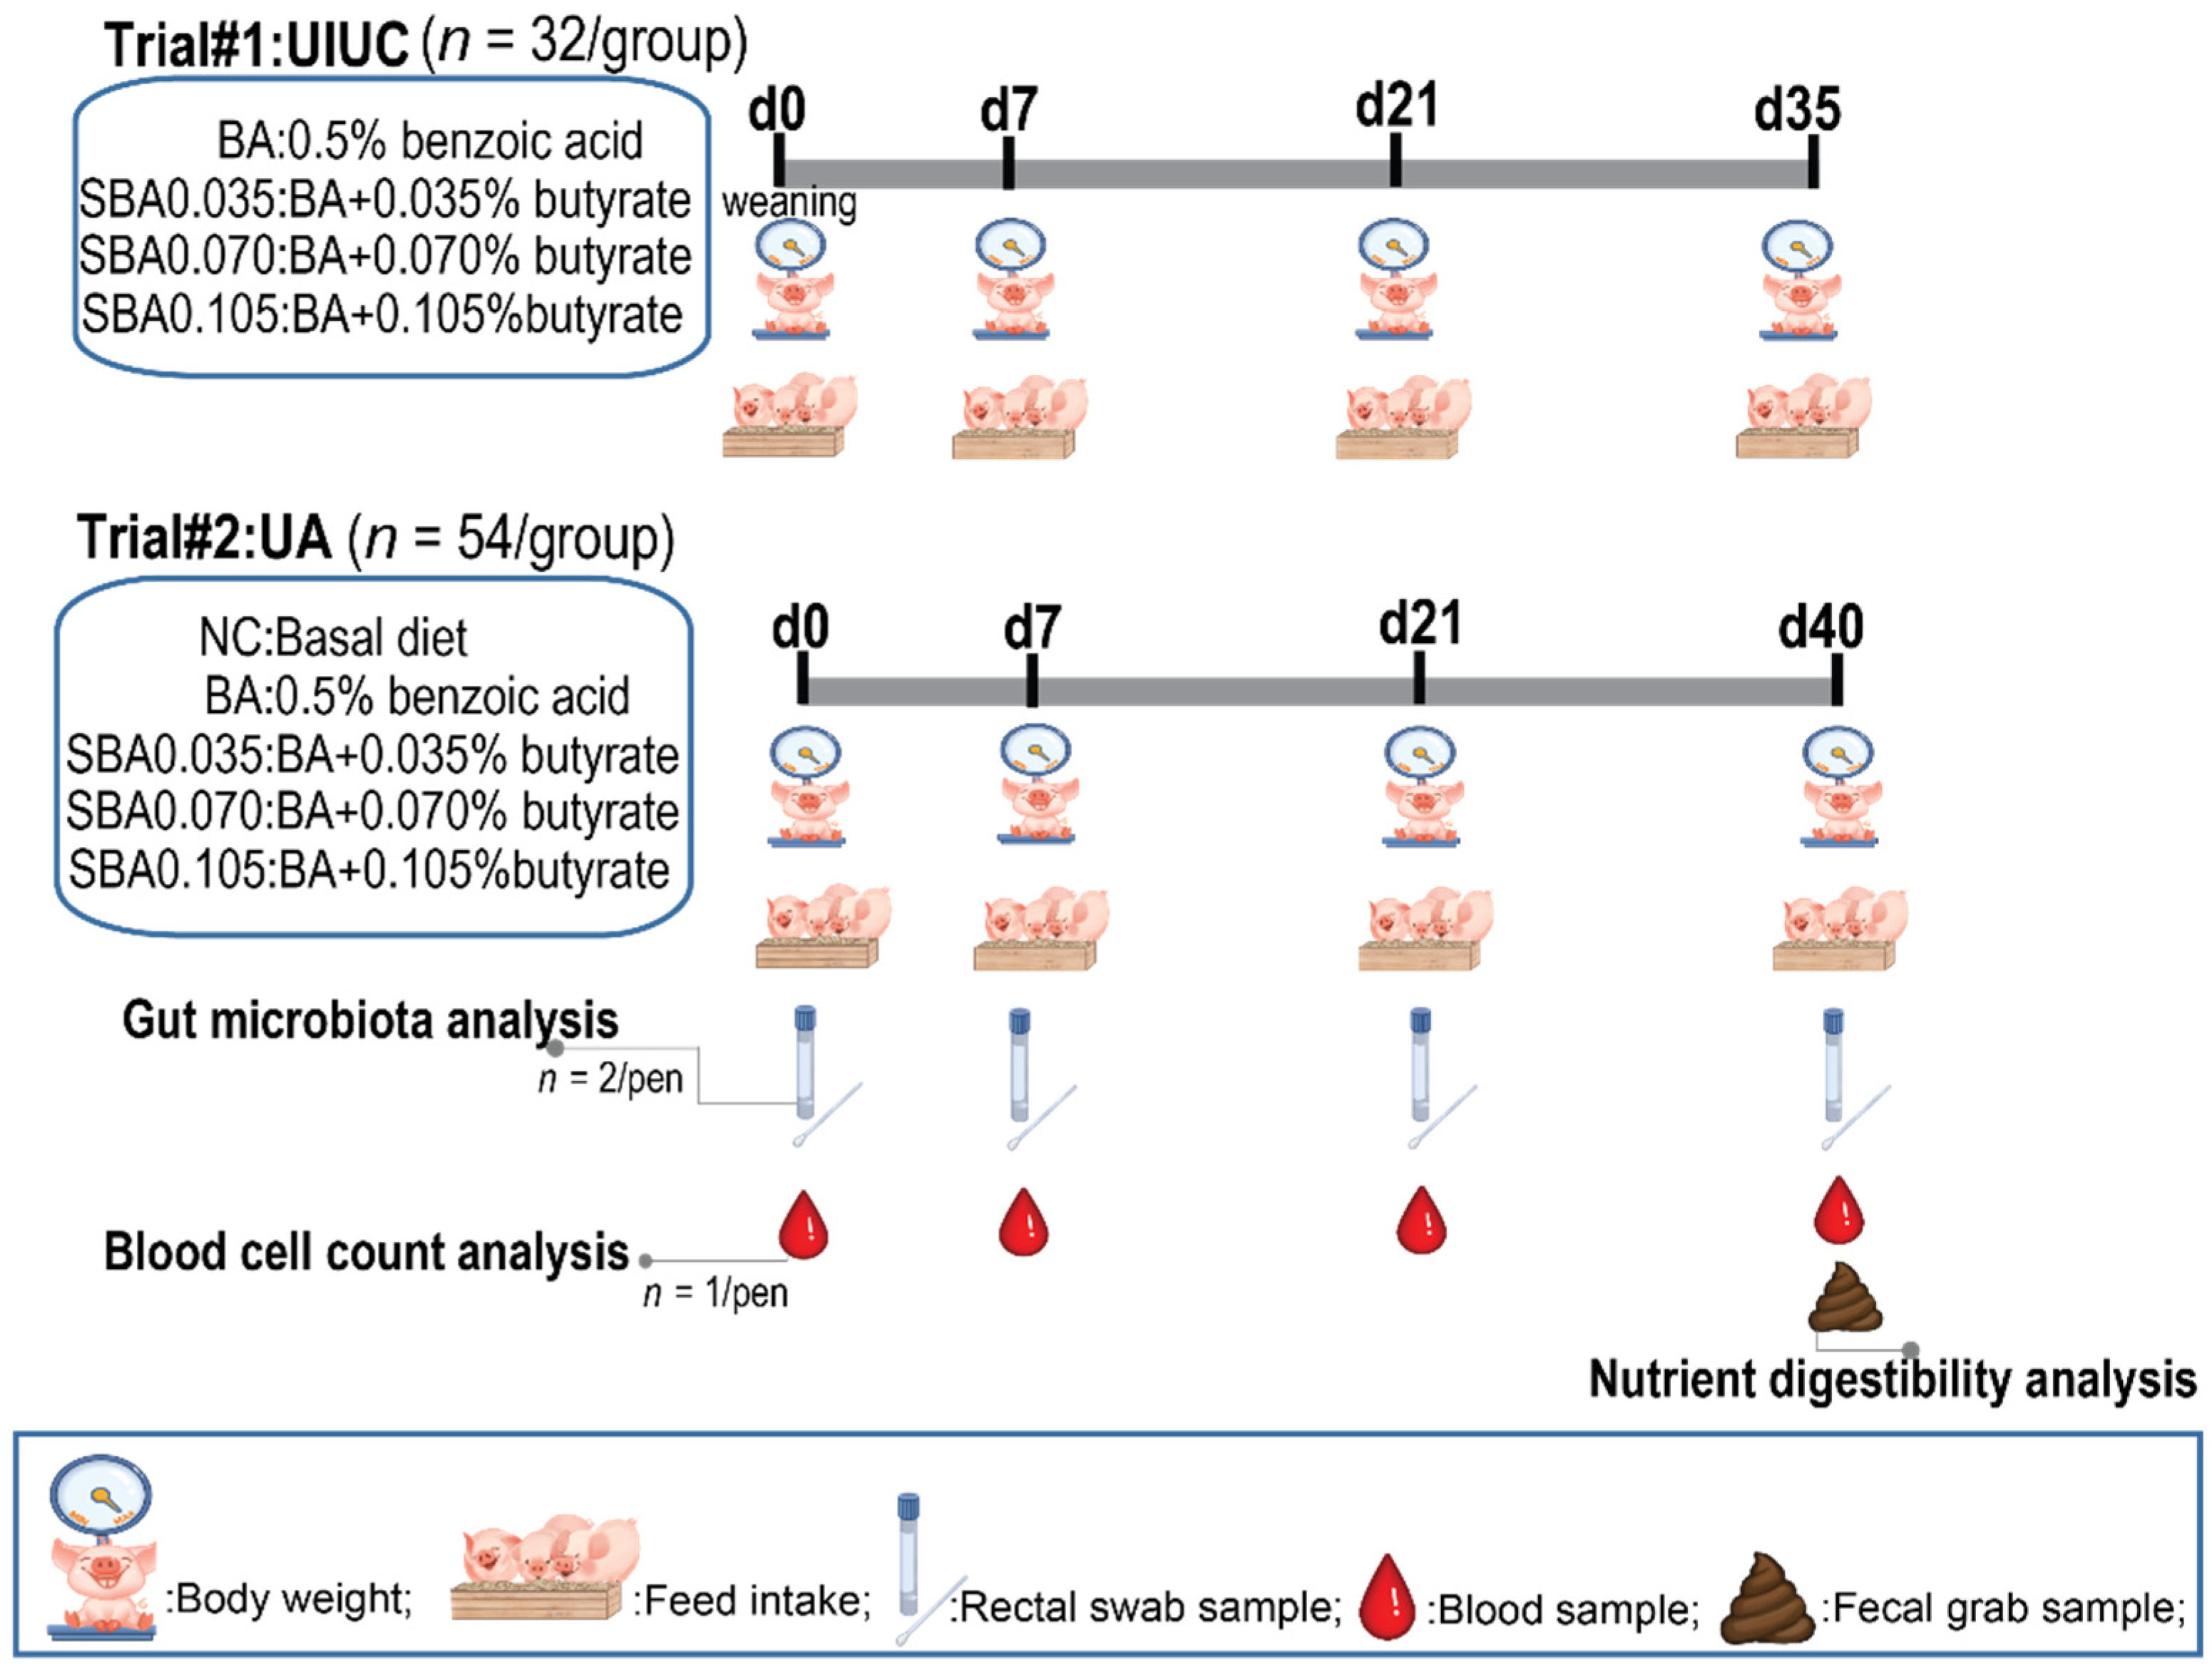
2.1. Animal Management and Experimental Design
2.1.1. Trial #1: University of Illinois at Urbana-Champaign (UIUC)
2.1.2. Trial #2: University of Arkansas (UA)
2.2. Diets and Feeding
2.3. Data Recording and Sample Collection
2.4. Chemical and Statistical Analysis
2.4.1. Trial #1: University of Illinois
Chemical Analysis
Statistical Analysis
2.4.2. Trial #2: University of Arkansas
Chemical Analysis
Statistical Analysis
DNA Extraction, Sequencing, and Microbiome Data Analysis
3. Results
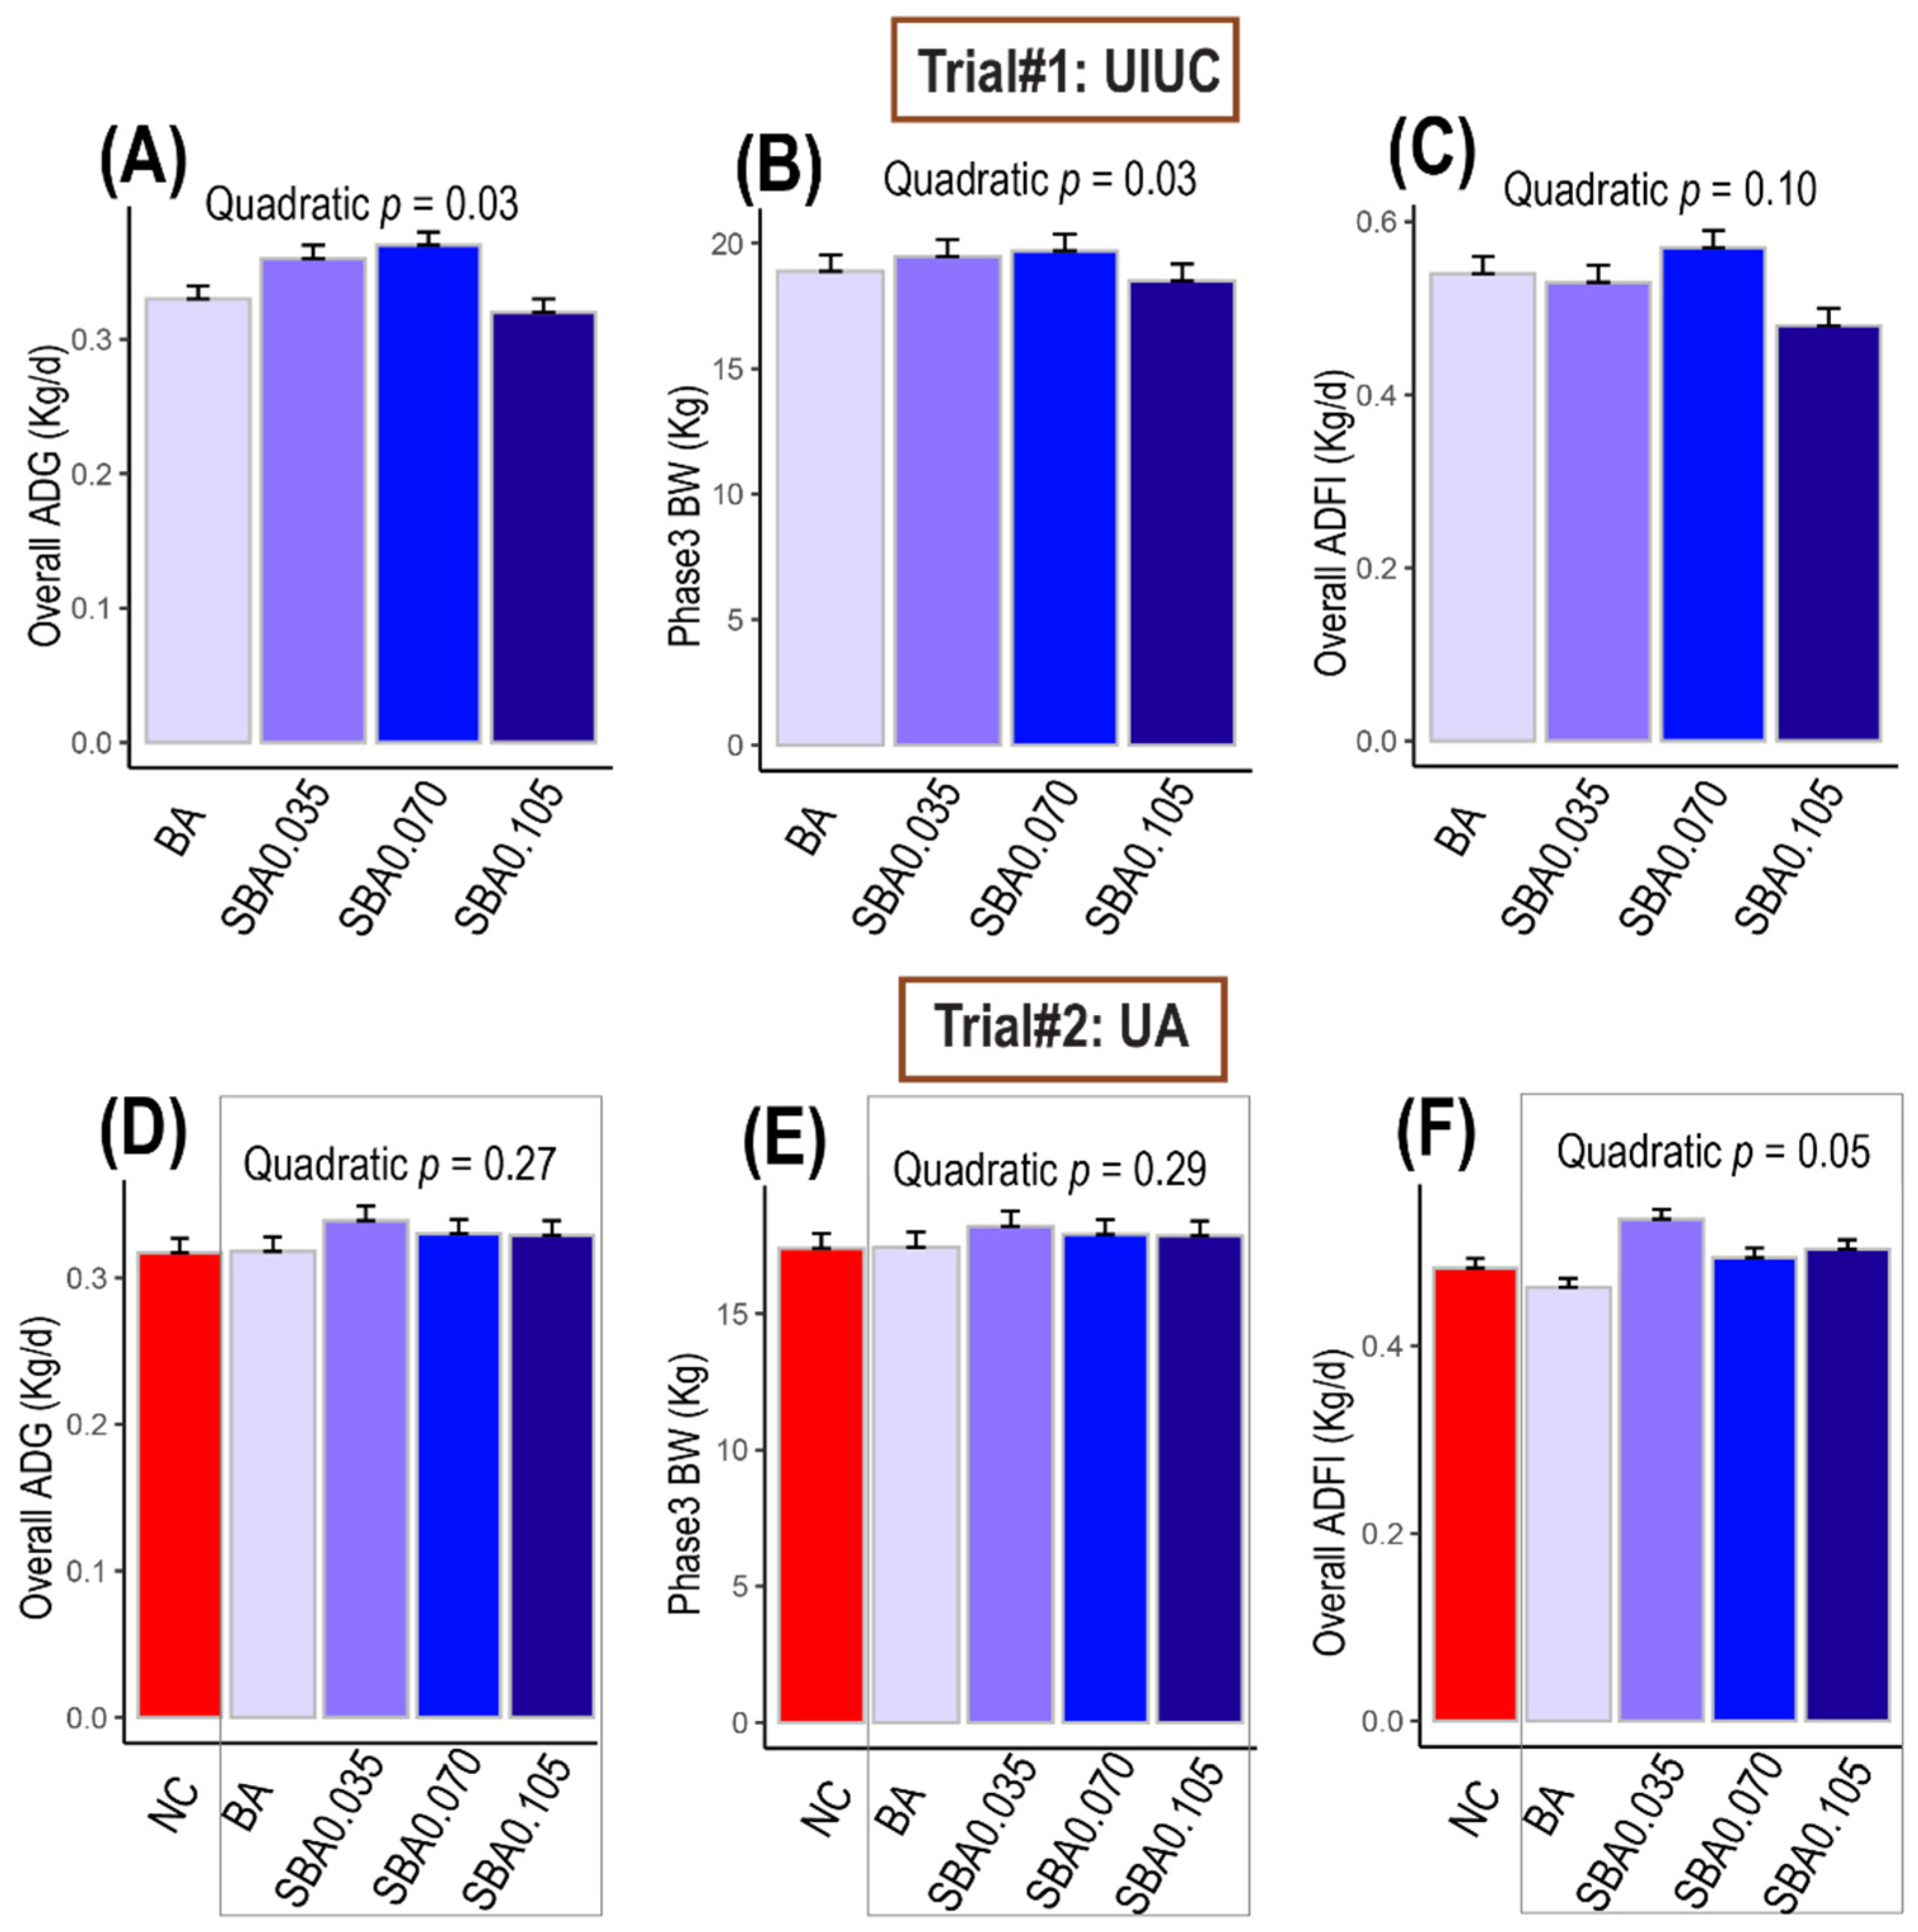
3.1. The Effects of Organic Acids on Swine Growth Performance
3.1.1. Trial #1: University of Illinois
3.1.2. Trial #2: University of Arkansas
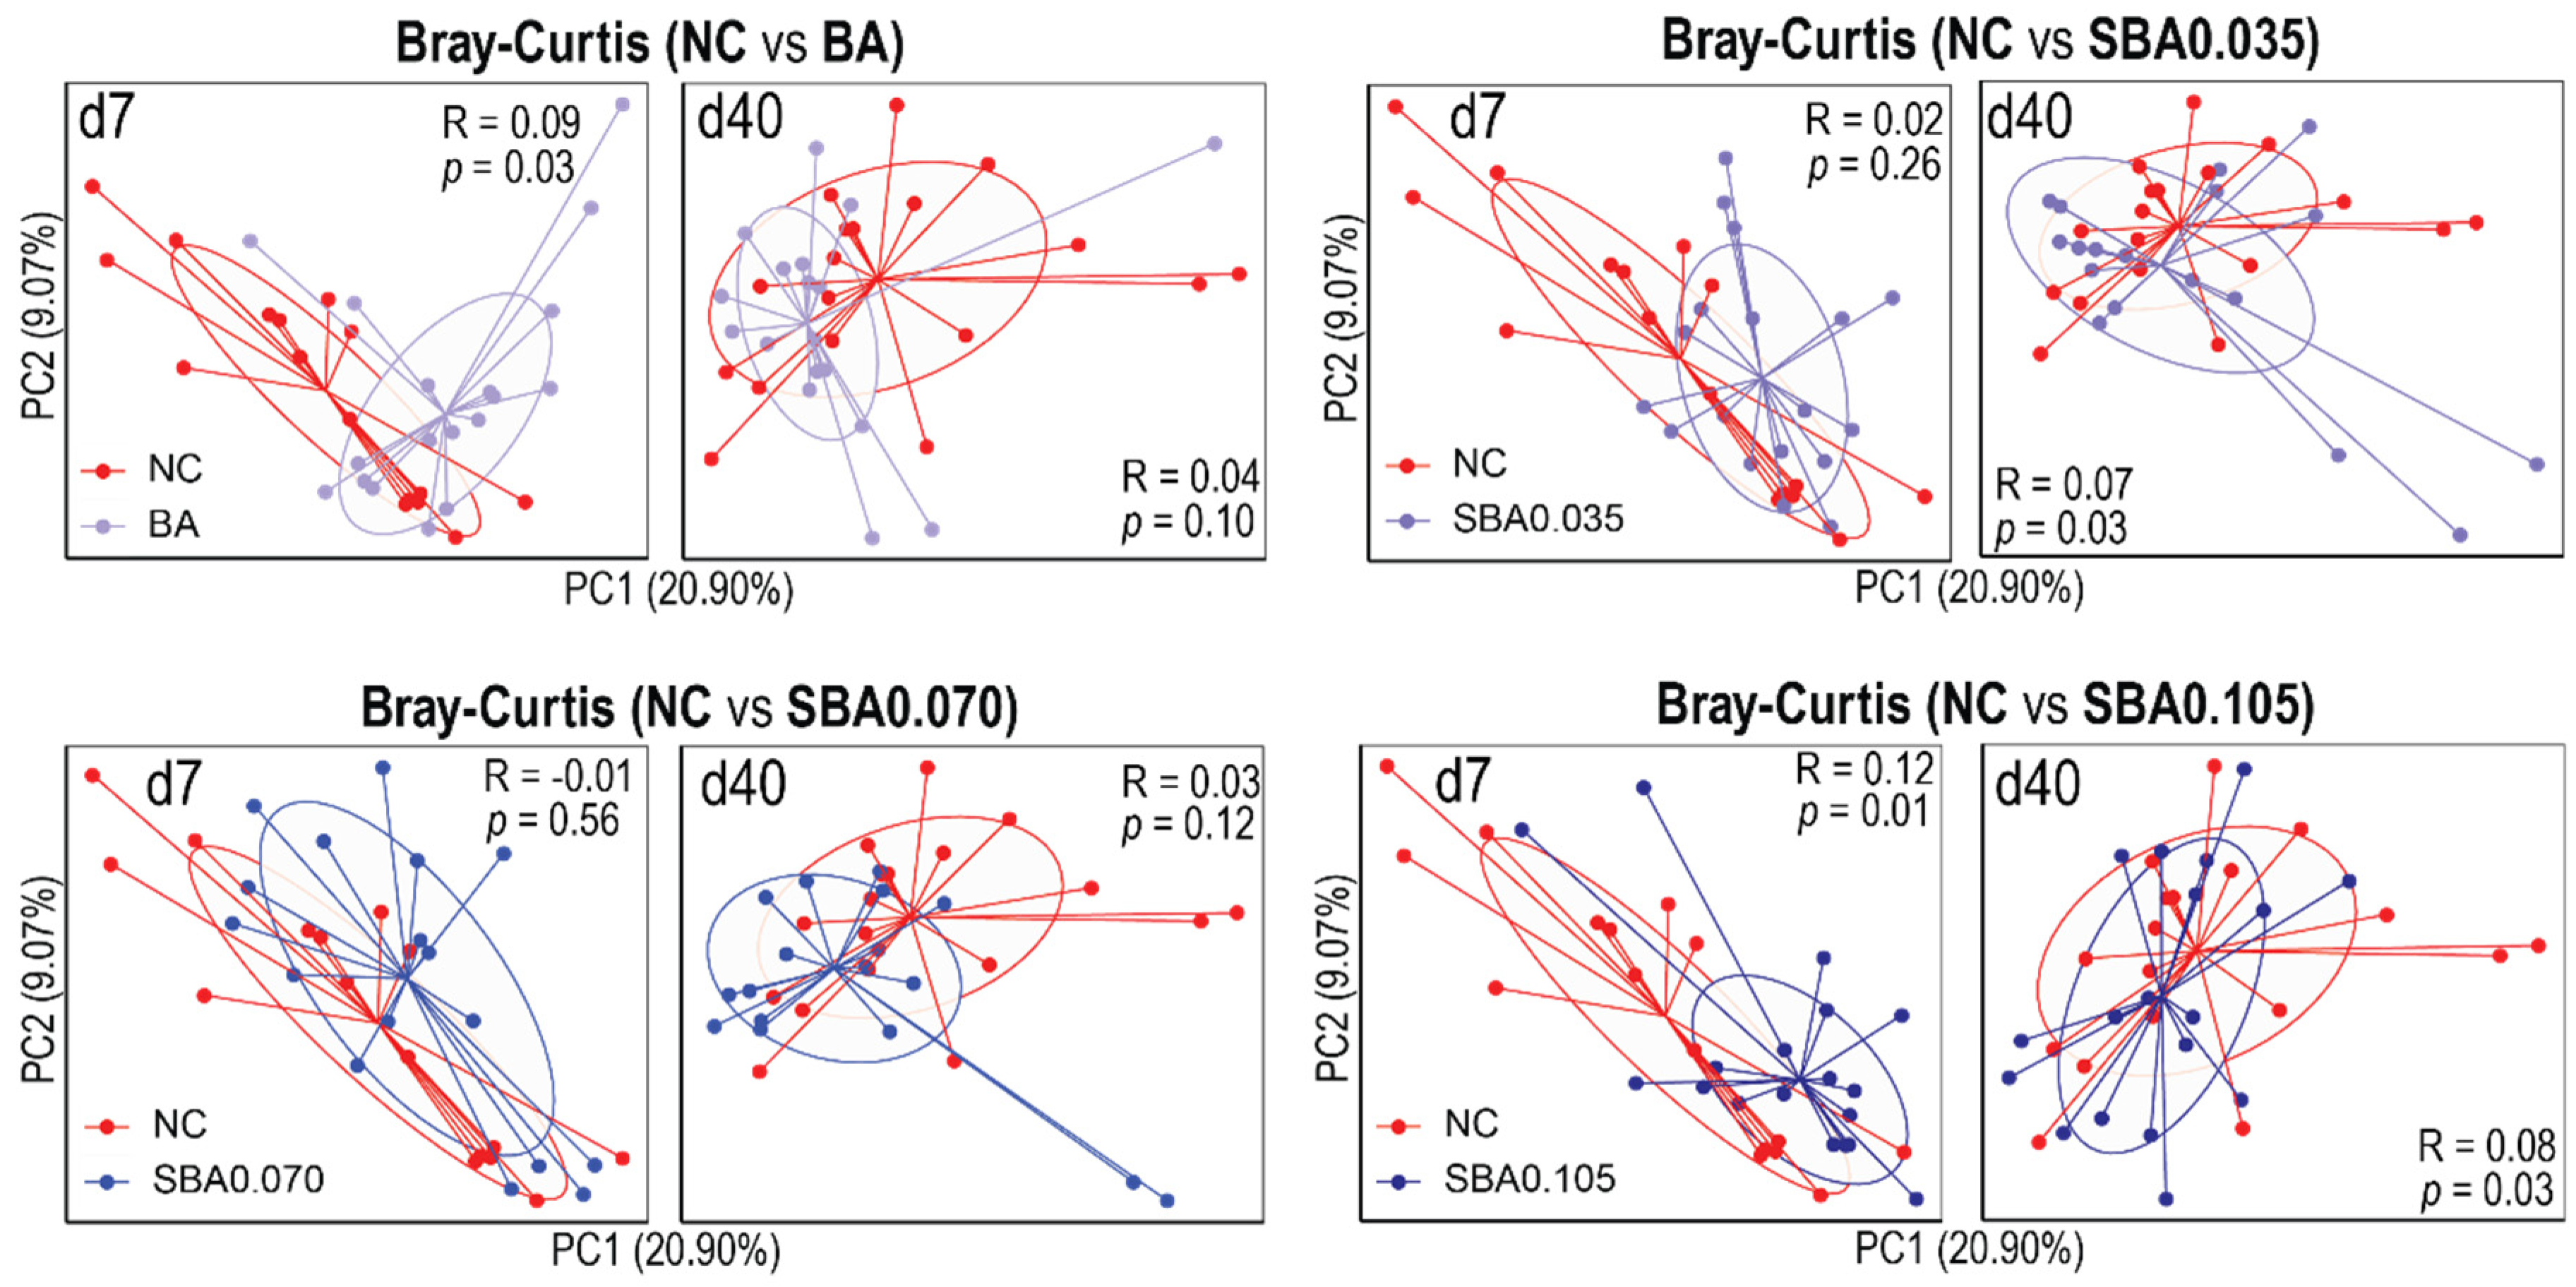
3.2. Effects of Organic Acids on Swine Gut Microbiota
3.2.1. DNA Sequence Data and Quality Control
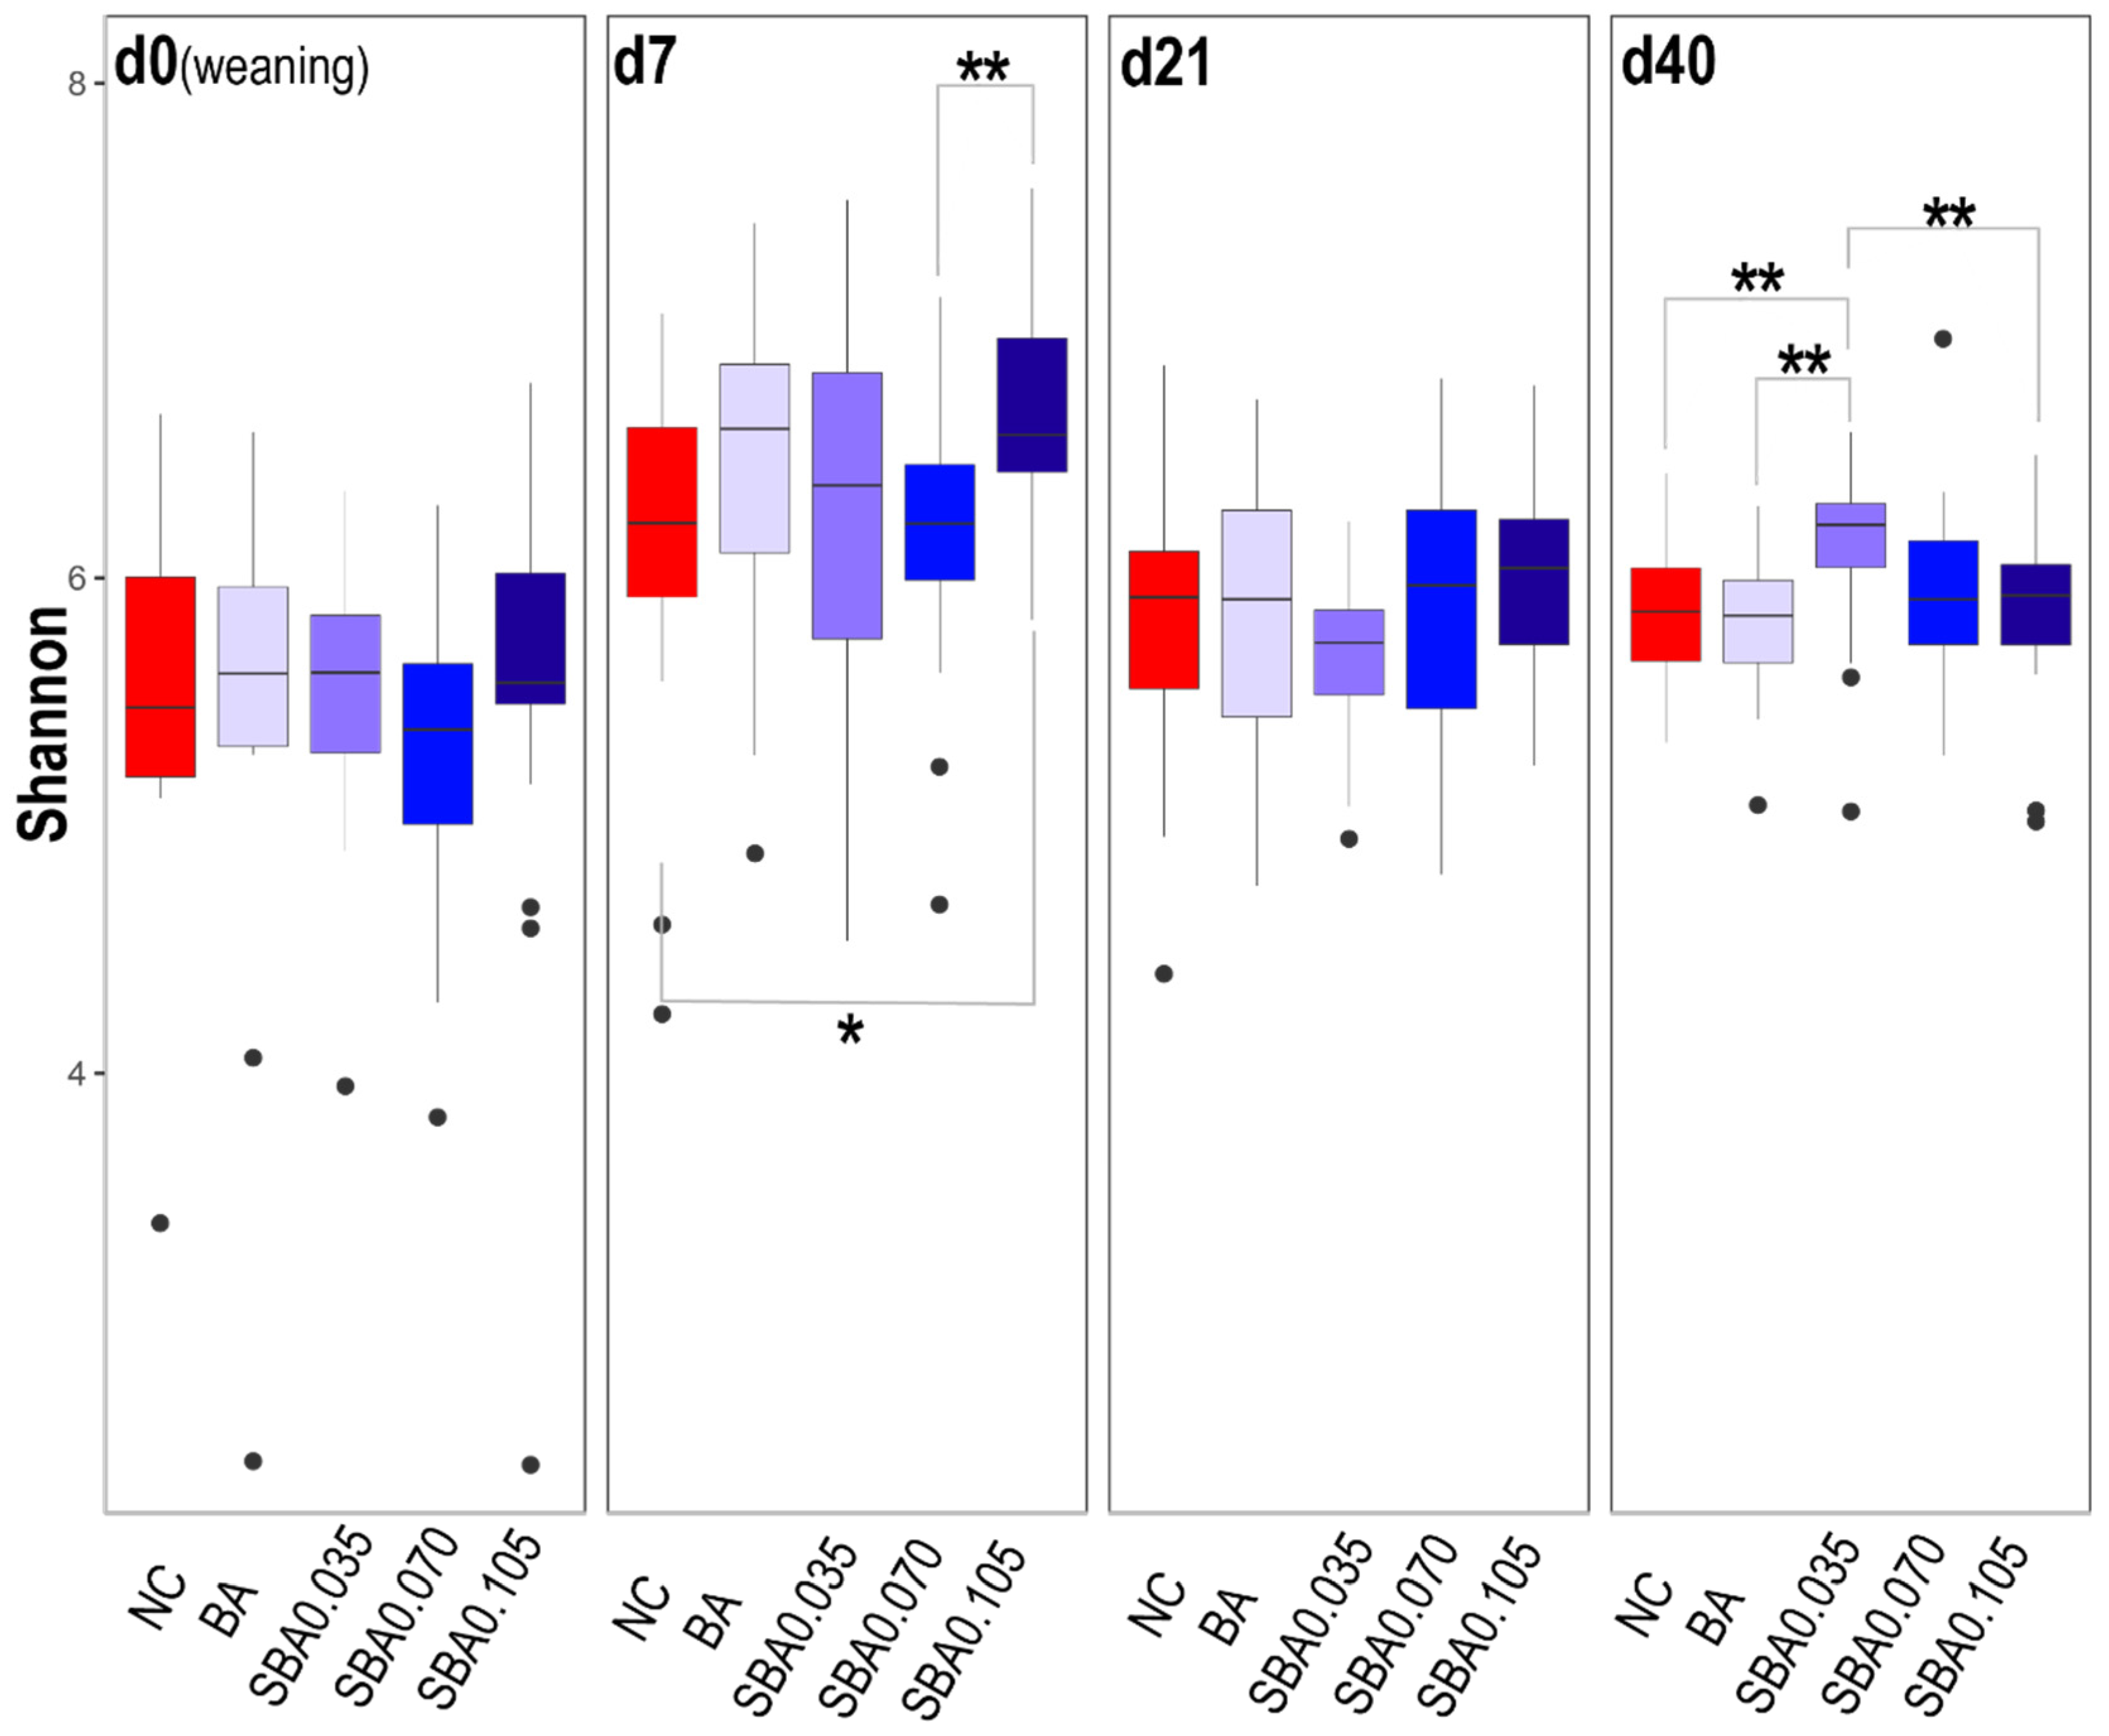
3.2.2. The Influence of Organic Acid Treatments on Gut Microbial Diversity
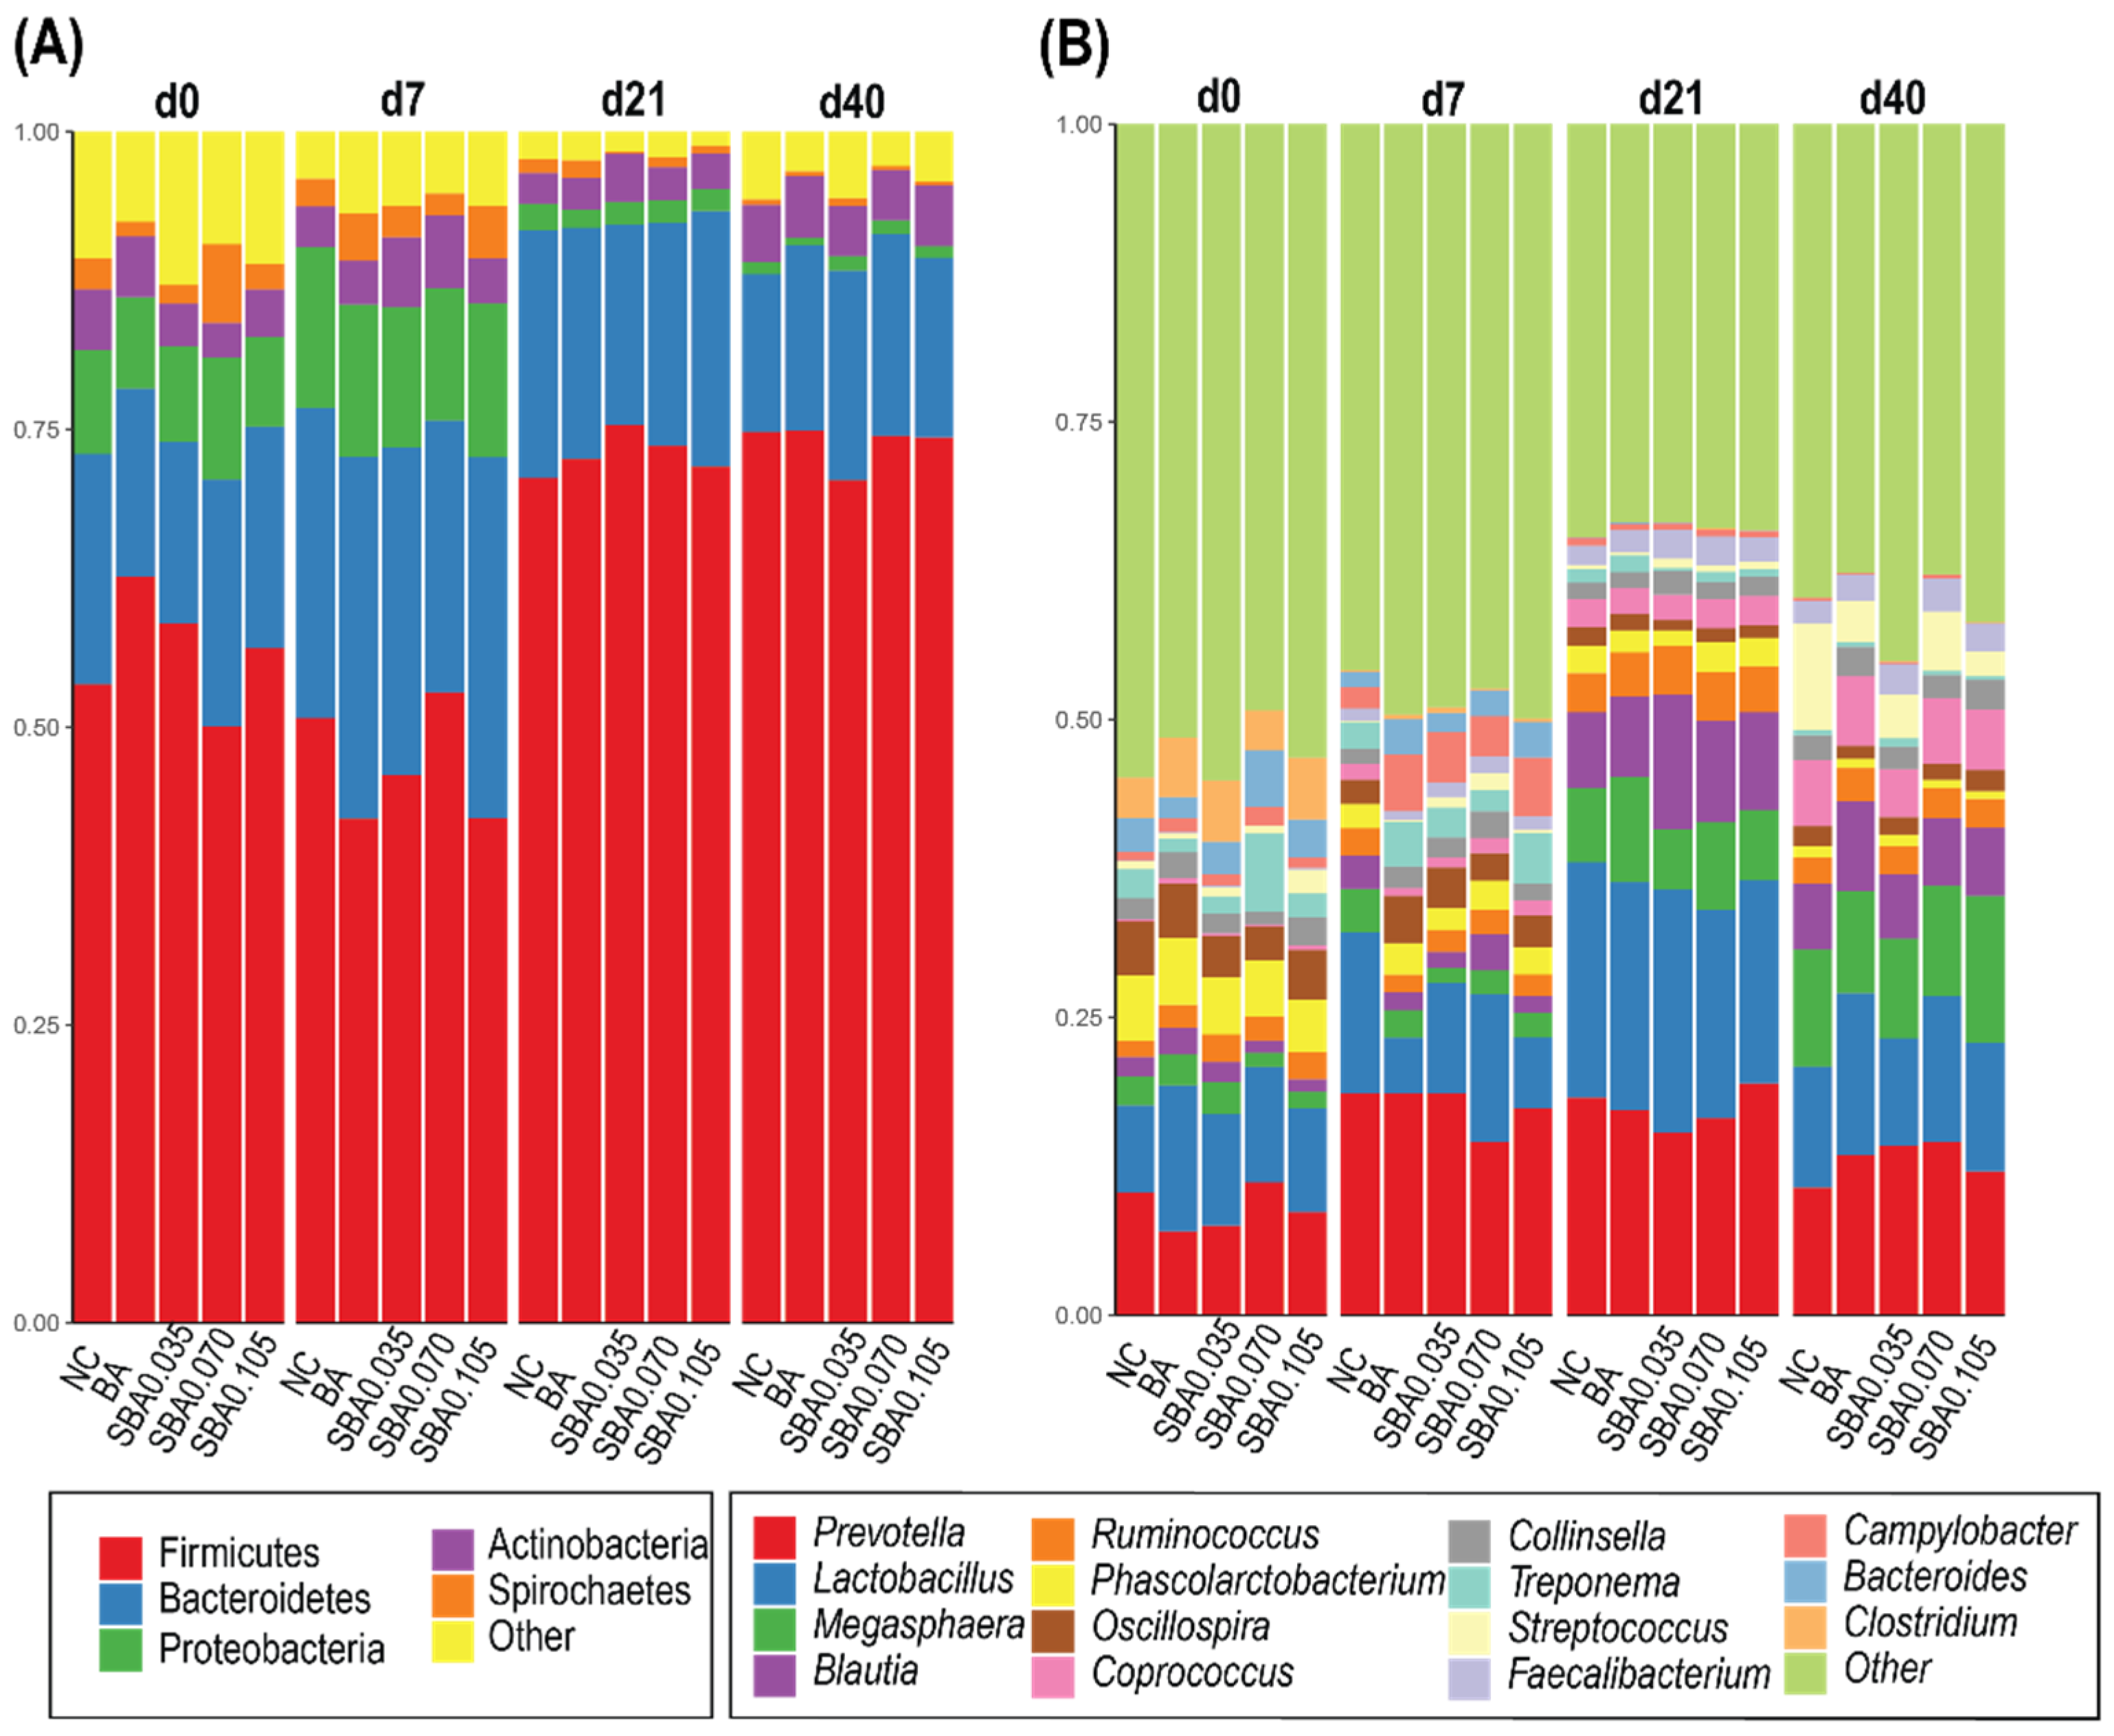
3.2.3. Gut Microbiota Composition in Response to the Use of Organic Acids
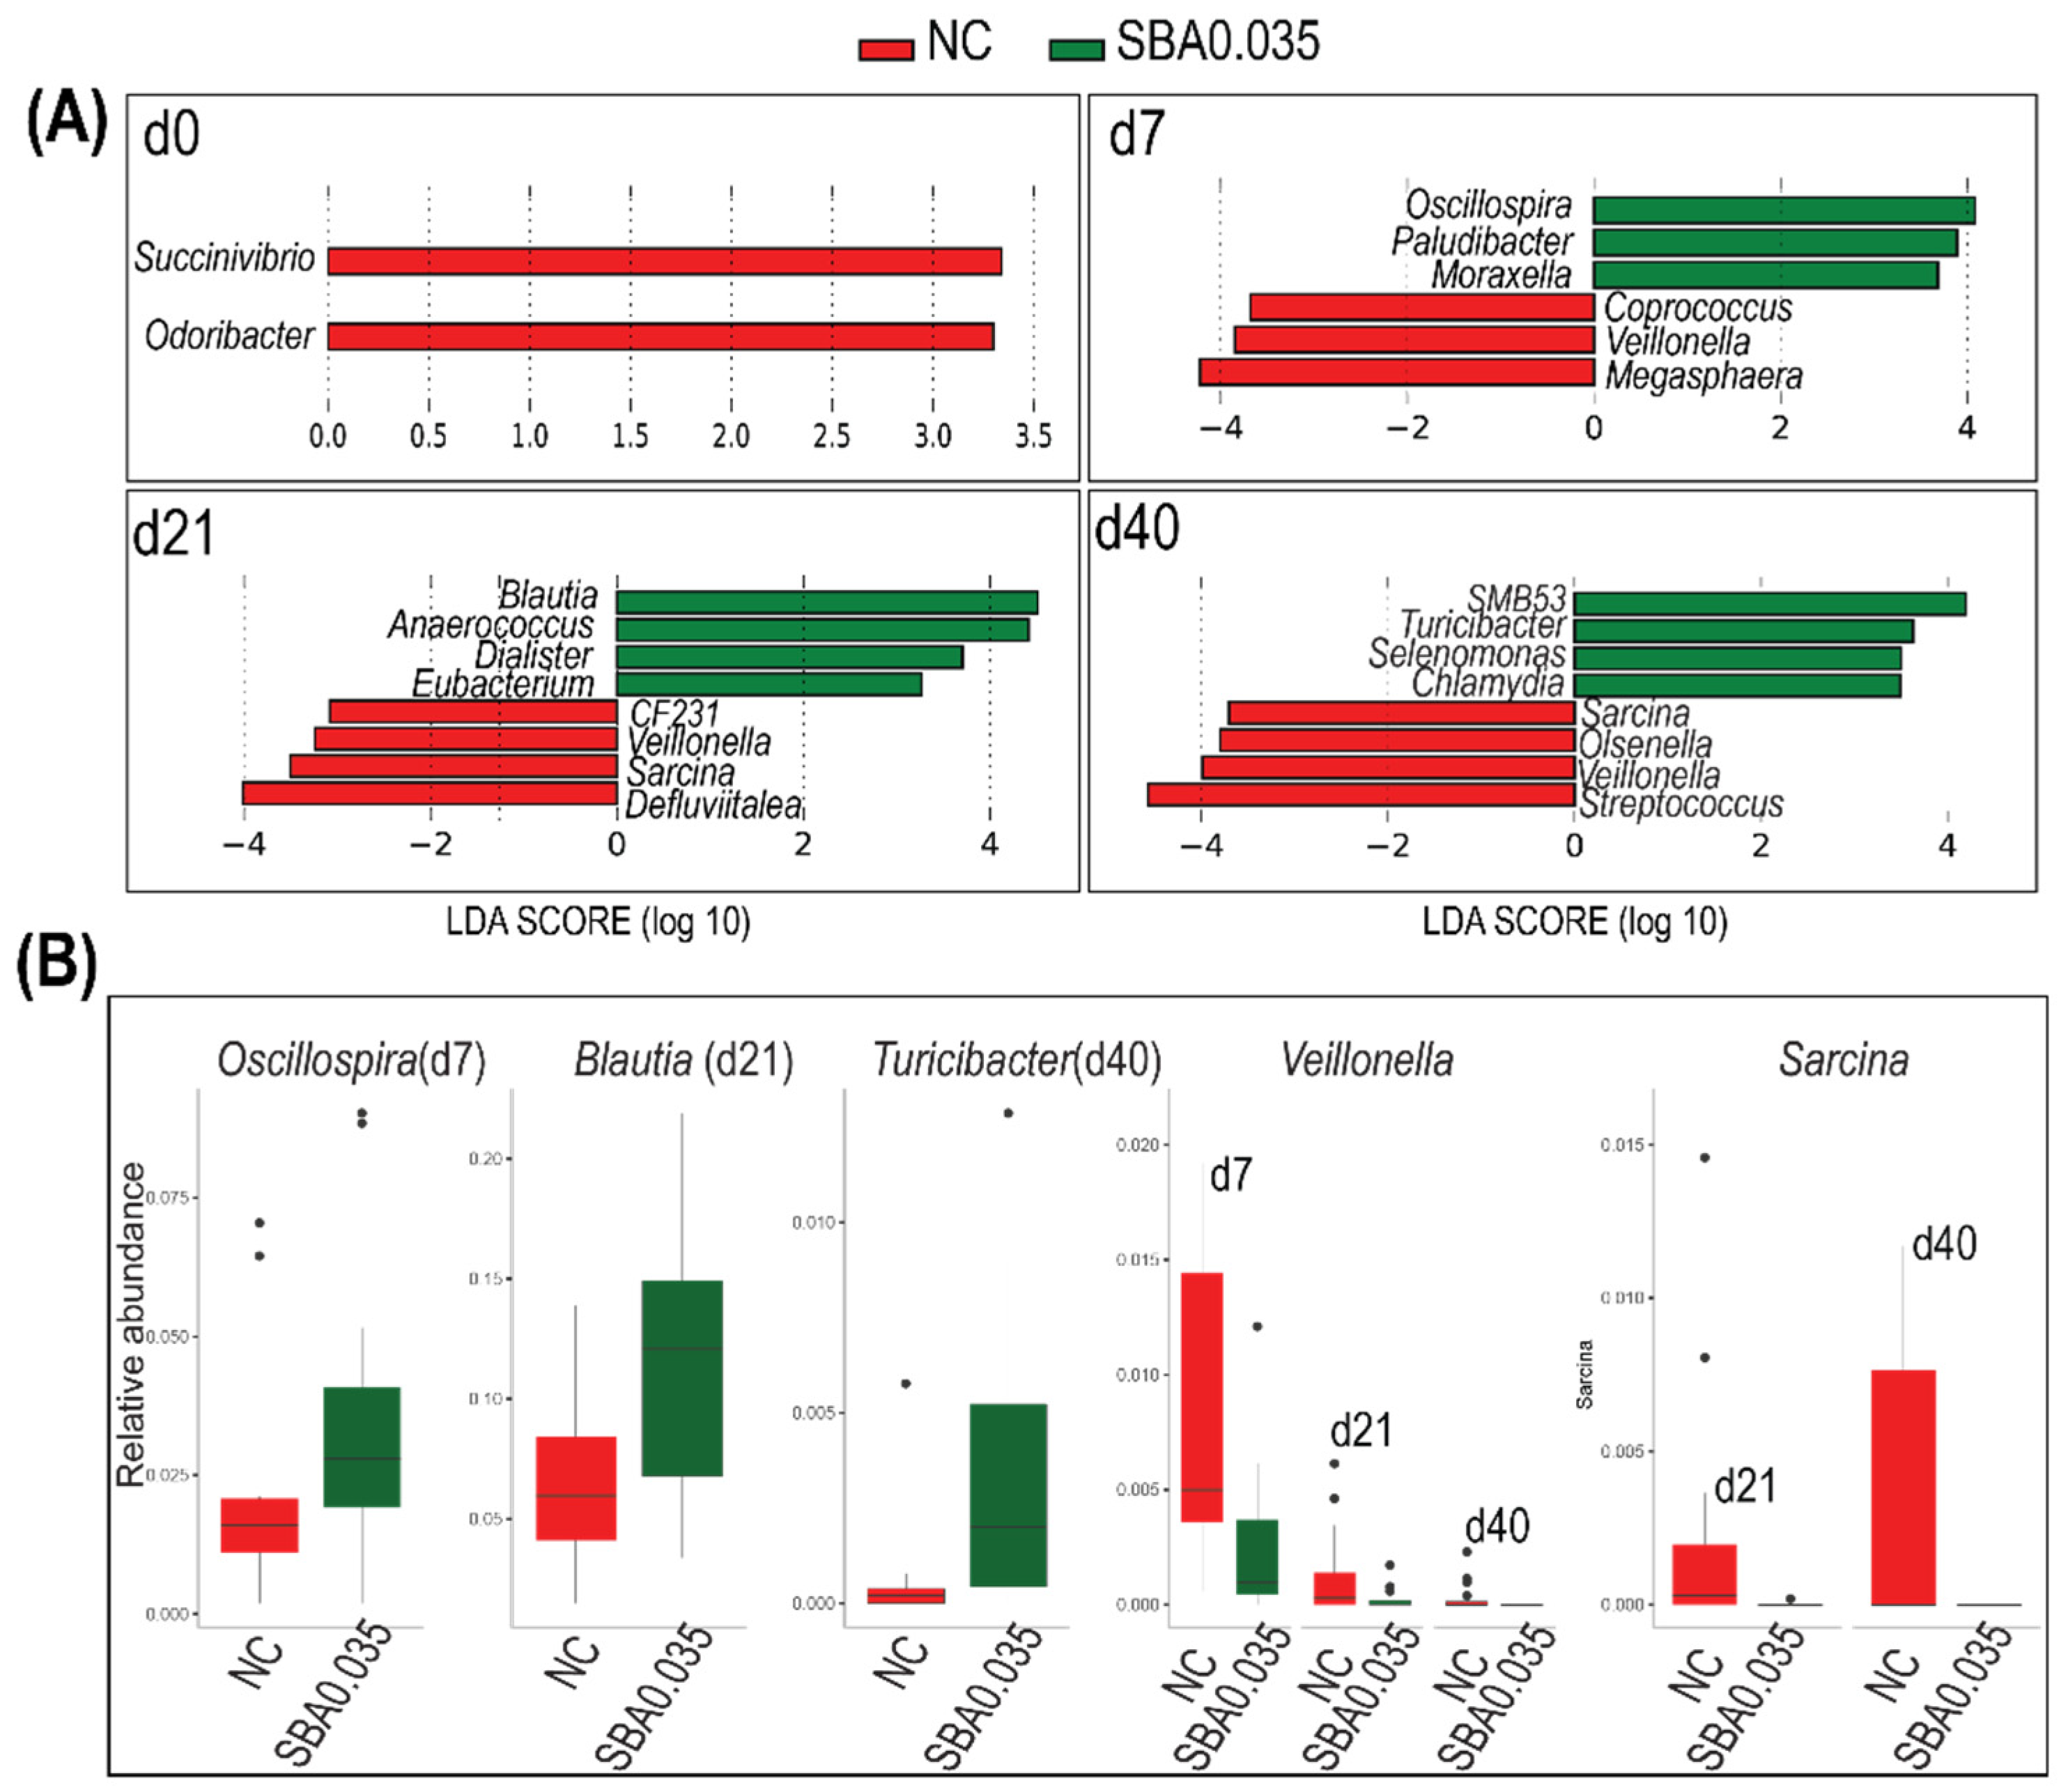
3.2.4. Linear Discriminant Analysis of Gut Microbiota
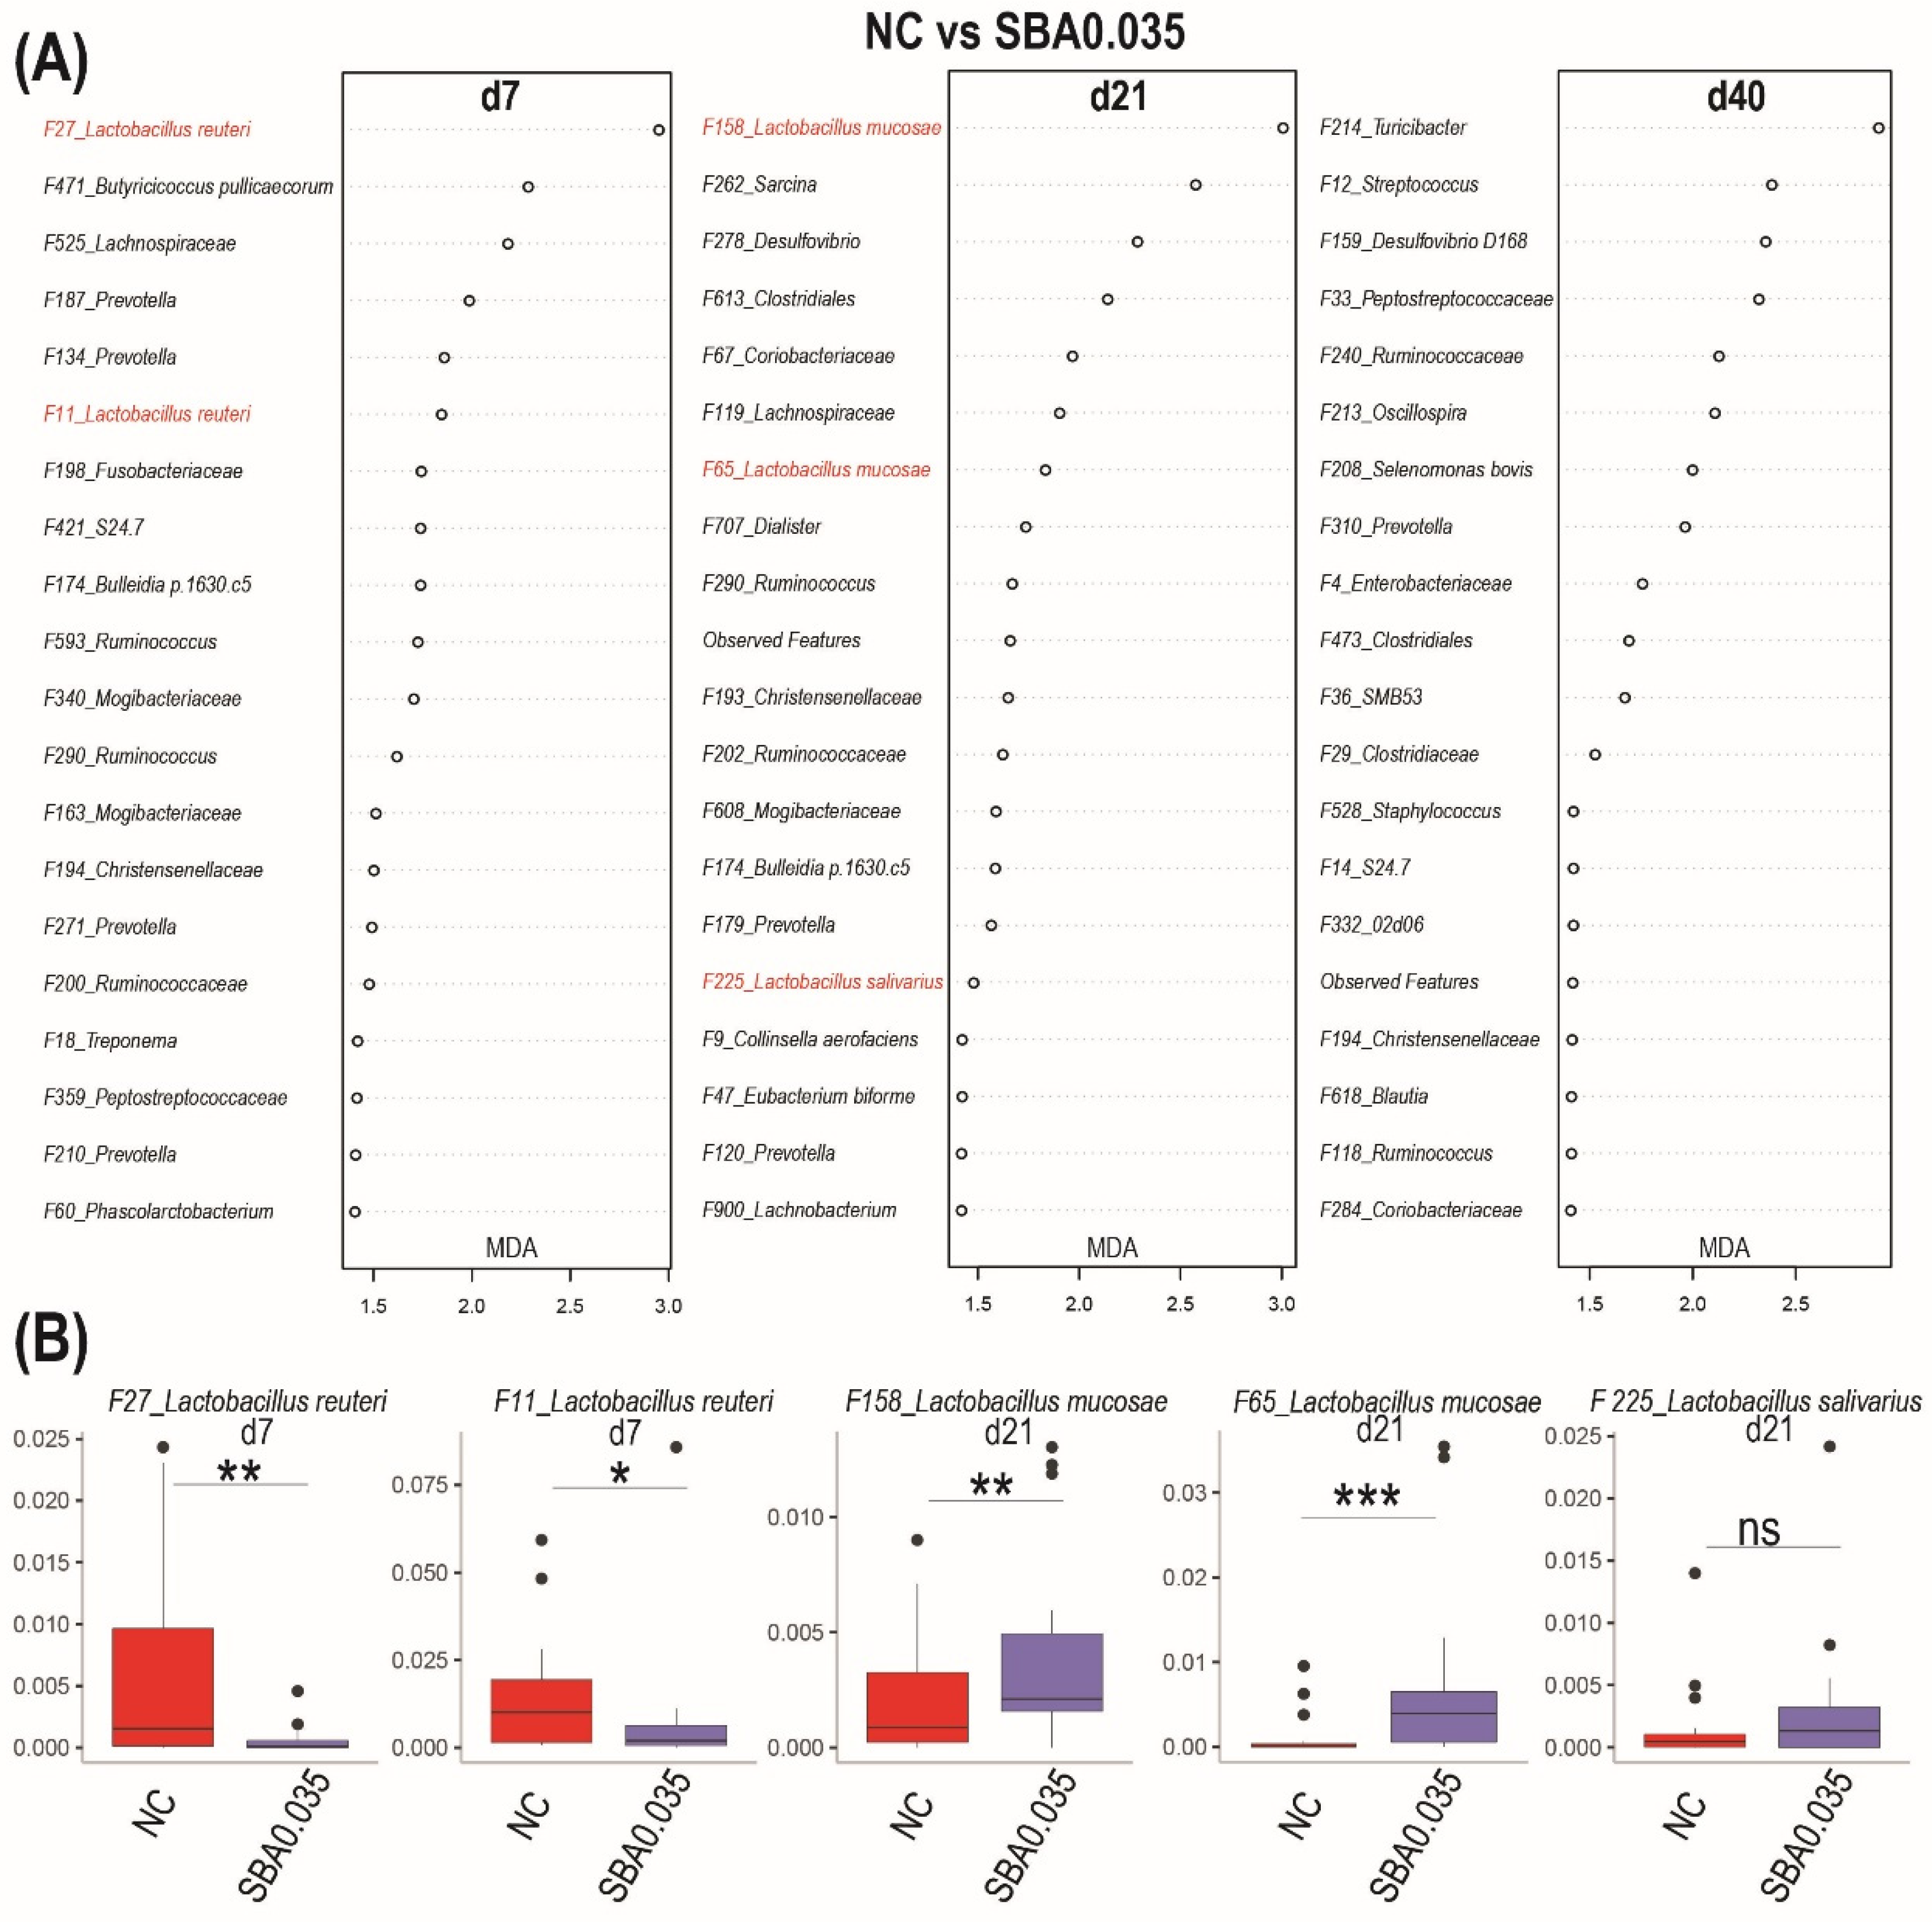
3.2.5. The Signature Microbiome-Differentiating Organic Acid Supplementary
4. Discussion
5. Conclusions
Supplementary Materials
Author Contributions
Funding
Institutional Review Board Statement
Data Availability Statement
Acknowledgments
Conflicts of Interest
References
- Kil, D.Y.; Kwon, W.B.; Kim, B.G. Dietary acidifiers in weanling pig diets: A review. Rev. Colomb. Cienc. Pecu. 2011, 24, 231–247. [Google Scholar]
- Gabert, V.; Sauer, W. The effects of supplementing diets for weanling pigs with organic acids. A review. J. Anim. Feed Sci. 1994, 3, 73–87. [Google Scholar]
- Pearlin, B.V.; Muthuvel, S.; Govidasamy, P.; Villavan, M.; Alagawany, M.; Ragab Farag, M.; Dhama, K.; Gopi, M. Role of acidifiers in livestock nutrition and health: A review. J. Anim. Physiol. Anim. Nutr. 2020, 104, 558–569. [Google Scholar]
- Falkowski, J.; Aherne, F. Fumaric and citric acid as feed additives in starter pig nutrition. J. Anim. Sci. 1984, 58, 935–938. [Google Scholar]
- Bolduan, V.G.; Jung, H.; Schneider, R.; Block, J.; Klenke, B. Influence of propionic-acid and formic-acid on piglets. J. Anim. Physiol. Anim. Nutr. Z. Tierphysiol. Tierernahr. Futterm. 1988, 59, 72–78. [Google Scholar]
- Cole, D.; Beal, R.; Luscombe, J. The effect on performance and bacterial flora of lactic acid, propionic acid, calcium propionate and calcium acrylate in the drinking water of weaned pigs. Vet. Rec. 1968, 83, 459–464. [Google Scholar]
- Panda, A.; Rao, S.; Raju, M.; Sunder, G.S. Effect of butyric acid on performance, gastrointestinal tract health and carcass characteristics in broiler chickens. Asian Australas. J. Anim. Sci. 2009, 22, 1026–1031. [Google Scholar]
- Van Immerseel, F.; Russell, J.; Flythe, M.; Gantois, I.; Timbermont, L.; Pasmans, F.; Haesebrouck, F.; Ducatelle, R. The use of organic acids to combat Salmonella in poultry: A mechanistic explanation of the efficacy. Avian Pathol. 2006, 35, 182–188. [Google Scholar]
- Gharib, N.K.; Rahimi, S.; Khaki, P. Comparison of the Effects of Probiotic, Organic Acid and Medicinal Plant on Campylobacter Jejuni Challenged Broiler Chickens. JAST 2012, 14, 1485–1496. [Google Scholar]
- Schulthess, J.; Pandey, S.; Capitani, M.; Rue-Albrecht, K.C.; Arnold, I.; Franchini, F.; Chomka, A.; Ilott, N.E.; Johnston, D.G.; Pires, E. The short chain fatty acid butyrate imprints an antimicrobial program in macrophages. Immunity 2019, 50, 432–445.e437. [Google Scholar]
- Paul, S.K.; Halder, G.; Mondal, M.K.; Samanta, G. Effect of organic acid salt on the performance and gut health of broiler chicken. J. Poult. Sci. 2007, 44, 389–395. [Google Scholar]
- Mathew, A.; Sutton, A.; Scheidt, A.; Forsyth, D.; Patterson, J.; Kelly, D. Effects of a Propionic Acid Containing Feed Additive on Performance and Intestinal Microbial Fermentation of the Weanling Pig; EAAP Publication: Roman, Italy, 1991. [Google Scholar]
- Tugnoli, B.; Giovagnoni, G.; Piva, A.; Grilli, E. From Acidifiers to Intestinal Health Enhancers: How Organic Acids Can Improve Growth Efficiency of Pigs. Animals 2020, 10, 134. [Google Scholar]
- Kotunia, A.; Wolinski, J.; Laubitz, D.; Jurkowska, M.; Rome, V.; Guilloteau, P.; Zabielski, R. Effect of sodium butyrate on the small intestine. J. Physiol. Pharmacol. 2004, 55, 59–68. [Google Scholar]
- Hague, A.; Singh, B.; Paraskeva, C. Butyrate acts as a survival factor for colonic epithelial cells: Further fuel for the in vivo versus in vitro debate. Gastroenterology 1997, 112, 1036–1040. [Google Scholar]
- Furusawa, Y.; Obata, Y.; Fukuda, S.; Endo, T.A.; Nakato, G.; Takahashi, D.; Nakanishi, Y.; Uetake, C.; Kato, K.; Kato, T. Commensal microbe-derived butyrate induces the differentiation of colonic regulatory T cells. Nature 2013, 504, 446–450. [Google Scholar]
- Kluge, H.; Broz, J.; Eder, K. Effect of benzoic acid on growth performance, nutrient digestibility, nitrogen balance, gastrointestinal microflora and parameters of microbial metabolism in piglets. J. Anim. Physiol. Anim. Nutr. 2006, 90, 316–324. [Google Scholar]
- Guggenbuhl, P.; Séon, A.; Quintana, A.P.; Nunes, C.S. Effects of dietary supplementation with benzoic acid (VevoVitall®) on the zootechnical performance, the gastrointestinal microflora and the ileal digestibility of the young pig. Livest. Sci. 2007, 108, 218–221. [Google Scholar]
- Torrallardona, D.; Badiola, I.; Broz, J. Effects of benzoic acid on performance and ecology of gastrointestinal microbiota in weanling piglets. Livest. Sci. 2007, 108, 210–213. [Google Scholar]
- NRC. Nutrient Requirements of Swine, 11th ed.; National Academy Press: Washington, DC, USA, 2012. [Google Scholar]
- Jones, J.B., Jr.; Case, V.W. Sampling, handling, and analyzing plant tissue samples. Soil Test. Plant Anal. 1990, 3, 389–427. [Google Scholar]
- Short, F.; Gorton, P.; Wiseman, J.; Boorman, K. Determination of titanium dioxide added as an inert marker in chicken digestibility studies. Anim. Feed Sci. Technol. 1996, 59, 215–221. [Google Scholar]
- Kozich, J.J.; Westcott, S.L.; Baxter, N.T.; Highlander, S.K.; Schloss, P.D. Development of a dual-index sequencing strategy and curation pipeline for analyzing amplicon sequence data on the MiSeq Illumina sequencing platform. Appl. Environ. Microbiol. 2013, 79, 5112–5120. [Google Scholar] [CrossRef] [PubMed] [Green Version]
- Bolyen, E.; Rideout, J.R.; Dillon, M.R.; Bokulich, N.A.; Abnet, C.C.; Al-Ghalith, G.A.; Alexander, H.; Alm, E.J.; Arumugam, M.; Asnicar, F. Reproducible, interactive, scalable and extensible microbiome data science using QIIME 2. Nat. Biotechnol. 2019, 37, 852–857. [Google Scholar] [CrossRef] [PubMed]
- Amir, A.; McDonald, D.; Navas-Molina, J.A.; Kopylova, E.; Morton, J.T.; Xu, Z.Z.; Kightley, E.P.; Thompson, L.R.; Hyde, E.R.; Gonzalez, A. Deblur rapidly resolves single-nucleotide community sequence patterns. MSystems 2017, 2, e00191-16. [Google Scholar] [CrossRef] [PubMed] [Green Version]
- Pedregosa, F.; Varoquaux, G.; Gramfort, A.; Michel, V.; Thirion, B.; Grisel, O.; Blondel, M.; Prettenhofer, P.; Weiss, R.; Dubourg, V. Scikit-learn: Machine learning in Python. J. Mach. Learn. Res. 2011, 12, 2825–2830. [Google Scholar]
- McDonald, D.; Price, M.N.; Goodrich, J.; Nawrocki, E.P.; DeSantis, T.Z.; Probst, A.; Andersen, G.L.; Knight, R.; Hugenholtz, P. An improved Greengenes taxonomy with explicit ranks for ecological and evolutionary analyses of bacteria and archaea. ISME J. 2012, 6, 610. [Google Scholar] [CrossRef]
- Corrêa-Oliveira, R.; Fachi, J.L.; Vieira, A.; Sato, F.T.; Vinolo, M.A.R. Regulation of immune cell function by short-chain fatty acids. Clin. Transl. Immunol. 2016, 5, e73. [Google Scholar] [CrossRef]
- Segain, J.; De La Blétiere, D.R.; Bourreille, A.; Leray, V.; Gervois, N.; Rosales, C.; Ferrier, L.; Bonnet, C.; Blottiere, H.; Galmiche, J. Butyrate inhibits inflammatory responses through NFκB inhibition: Implications for Crohn’s disease. Gut 2000, 47, 397–403. [Google Scholar] [CrossRef] [Green Version]
- Lewis, G.; Wang, B.; Shafiei Jahani, P.; Hurrell, B.P.; Banie, H.; Aleman Muench, G.R.; Maazi, H.; Helou, D.G.; Howard, E.; Galle-Treger, L. Dietary fiber-induced microbial short chain fatty acids suppress ilc2-dependent airway inflammation. Front. Immunol. 2019, 10, 2051. [Google Scholar] [CrossRef] [Green Version]
- Xiao, T.; Wu, S.; Yan, C.; Zhao, C.; Jin, H.; Yan, N.; Xu, J.; Wu, Y.; Li, C.; Shao, Q. Butyrate upregulates the TLR4 expression and the phosphorylation of MAPKs and NK-κB in colon cancer cell in vitro. Oncol. Lett. 2018, 16, 4439–4447. [Google Scholar] [CrossRef] [Green Version]
- Wilson, A.J.; Gibson, P.R. Short-chain fatty acids promote the migration of colonic epithelial cells in vitro. Gastroenterology 1997, 113, 487–496. [Google Scholar] [CrossRef]
- Piva, A.; Morlacchini, M.; Casadei, G.; Gatta, P.P.; Biagi, G.; Prandini, A. Sodium butyrate improves growth performance of weaned piglets during the first period after weaning. Ital. J. Anim. Sci. 2002, 1, 35–41. [Google Scholar] [CrossRef]
- Krátký, M.; Vinšová, J.; Buchta, V. In vitro antibacterial and antifungal activity of salicylanilide benzoates. Sci. World J. 2012, 2012, 290628. [Google Scholar] [CrossRef] [PubMed] [Green Version]
- Kalpana, V.; Rajeswari, V.D. Preservatives in Beverages: Perception and Needs. In Preservatives and Preservation Approaches in Beverages; Elsevier: Amsterdam, The Netherlands, 2019; pp. 1–30. [Google Scholar]
- Hazan, R.; Levine, A.; Abeliovich, H. Benzoic acid, a weak organic acid food preservative, exerts specific effects on intracellular membrane trafficking pathways in Saccharomyces cerevisiae. Appl. Environ. Microbiol. 2004, 70, 4449–4457. [Google Scholar] [CrossRef] [PubMed] [Green Version]
- Diao, H.; Gao, Z.; Yu, B.; Zheng, P.; He, J.; Yu, J.; Huang, Z.; Chen, D.; Mao, X. Effects of benzoic acid (VevoVitall®) on the performance and jejunal digestive physiology in young pigs. J. Anim. Sci. Biotechnol. 2016, 7, 32. [Google Scholar] [CrossRef] [Green Version]
- Olukosi, O.; Dono, N. Modification of digesta pH and intestinal morphology with the use of benzoic acid or phytobiotics and the effects on broiler chicken growth performance and energy and nutrient utilization. J. Anim. Sci. 2014, 92, 3945–3953. [Google Scholar] [CrossRef] [Green Version]
- Silveira, H.; Amaral, L.G.d.M.; Garbossa, C.A.P.; Rodrigues, L.M.; Silva, C.C.d.; Cantarelli, V.d.S. Benzoic acid in nursery diets increases the performance from weaning to finishing by reducing diarrhoea and improving the intestinal morphology of piglets inoculated with Escherichia coli K88+. J. Anim. Physiol. Anim. Nutr. 2018, 102, 1675–1685. [Google Scholar] [CrossRef] [PubMed]
- Mao, X.; Yang, Q.; Chen, D.; Yu, B.; He, J. Benzoic acid used as food and feed additives can regulate gut functions. BioMed. Res. Int. 2019, 2019, 1–6. [Google Scholar] [CrossRef] [Green Version]
- Zoetendal, E.G.; Cheng, B.; Koike, S.; Mackie, R.I. Molecular microbial ecology of the gastrointestinal tract: From phylogeny to function. Curr. Issues Intest. Microbiol. 2004, 5, 31–48. [Google Scholar]
- Bik, E.M. Composition and function of the human-associated microbiota. Nutr. Rev. 2009, 67, S164–S171. [Google Scholar] [CrossRef]
- Wang, X.; Tsai, T.; Deng, F.; Wei, X.; Chai, J.; Knapp, J.; Apple, J.; Maxwell, C.V.; Lee, J.A.; Li, Y. Longitudinal investigation of the swine gut microbiome from birth to market reveals stage and growth performance associated bacteria. Microbiome 2019, 7, 109. [Google Scholar] [CrossRef] [Green Version]
- Wei, X.; Tsai, T.; Knapp, J.; Bottoms, K.; Deng, F.; Story, R.; Maxwell, C.; Zhao, J. ZnO Modulates Swine Gut Microbiota and Improves Growth Performance of Nursery Pigs When Combined with Peptide Cocktail. Microorganisms 2020, 8, 146. [Google Scholar] [CrossRef] [Green Version]
- Tsai, T.; Sales, M.A.; Kim, H.; Erf, G.F.; Vo, N.; Carbonero, F.; Van Der Merwe, M.; Kegley, E.B.; Buddington, R.; Wang, X. Isolated rearing at lactation increases gut microbial diversity and post-weaning performance in pigs. Front. Microbiol. 2018, 9, 2889. [Google Scholar] [CrossRef]
- Li, Y.; Wang, X.; Wang, X.-Q.; Wang, J.; Zhao, J. Life-long dynamics of the swine gut microbiome and their implications in probiotics development and food safety. Gut Microbes 2020, 11, 1824–1832. [Google Scholar] [CrossRef]
- De Filippo, C.; Cavalieri, D.; Di Paola, M.; Ramazzotti, M.; Poullet, J.B.; Massart, S.; Collini, S.; Pieraccini, G.; Lionetti, P. Impact of diet in shaping gut microbiota revealed by a comparative study in children from Europe and rural Africa. Proc. Natl. Acad. Sci. USA 2010, 107, 14691–14696. [Google Scholar] [CrossRef] [Green Version]
- Shetty, S.A.; Marathe, N.P.; Lanjekar, V.; Ranade, D.; Shouche, Y.S. Comparative genome analysis of Megasphaera sp. reveals niche specialization and its potential role in the human gut. PLoS ONE 2013, 8, e79353. [Google Scholar] [CrossRef] [Green Version]
- El Kaoutari, A.; Armougom, F.; Gordon, J.I.; Raoult, D.; Henrissat, B. The abundance and variety of carbohydrate-active enzymes in the human gut microbiota. Nat. Rev. Microbiol. 2013, 11, 497–504. [Google Scholar] [CrossRef]
- Chen, T.; Long, W.; Zhang, C.; Liu, S.; Zhao, L.; Hamaker, B.R. Fiber-utilizing capacity varies in Prevotella-versus Bacteroides-dominated gut microbiota. Sci. Rep. 2017, 7, 1–7. [Google Scholar] [CrossRef]
- Sokol, H.; Pigneur, B.; Watterlot, L.; Lakhdari, O.; Bermúdez-Humarán, L.G.; Gratadoux, J.-J.; Blugeon, S.; Bridonneau, C.; Furet, J.-P.; Corthier, G. Faecalibacterium prausnitzii is an anti-inflammatory commensal bacterium identified by gut microbiota analysis of Crohn disease patients. Proc. Natl. Acad. Sci. USA 2008, 105, 16731–16736. [Google Scholar] [CrossRef] [Green Version]
- Delday, M.; Mulder, I.; Logan, E.T.; Grant, G. Bacteroides thetaiotaomicron ameliorates colon inflammation in preclinical models of Crohn’s disease. Inflamm. Bowel Dis. 2019, 25, 85–96. [Google Scholar] [CrossRef] [Green Version]
- Le Chatelier, E.; Nielsen, T.; Qin, J.; Prifti, E.; Hildebrand, F.; Falony, G.; Almeida, M.; Arumugam, M.; Batto, J.-M.; Kennedy, S. Richness of human gut microbiome correlates with metabolic markers. Nature 2013, 500, 541–546. [Google Scholar] [CrossRef]
- Kong, F.; Hua, Y.; Zeng, B.; Ning, R.; Li, Y.; Zhao, J. Gut microbiota signatures of longevity. Curr. Biol. 2016, 26, R832–R833. [Google Scholar] [CrossRef] [PubMed] [Green Version]
- Shetty, S.A.; Hugenholtz, F.; Lahti, L.; Smidt, H.; de Vos, W.M. Intestinal microbiome landscaping: Insight in community assemblage and implications for microbial modulation strategies. FEMS Microbiol. Rev. 2017, 41, 182–199. [Google Scholar] [CrossRef] [PubMed]
- Konikoff, T.; Gophna, U. Oscillospira: A central, enigmatic component of the human gut microbiota. Trends Microbiol. 2016, 24, 523–524. [Google Scholar] [CrossRef]
- Lee, G.-H.; Rhee, M.-S.; Chang, D.-H.; Lee, J.; Kim, S.; Yoon, M.H.; Kim, B.-C. Oscillibacterruminantium sp. nov., isolated from the rumen of Korean native cattle. Int. J. Syst. Evol. Microbiol. 2013, 63, 1942–1946. [Google Scholar] [CrossRef] [Green Version]
- Gophna, U.; Konikoff, T.; Nielsen, H.B. Oscillospira and related bacteria–From metagenomic species to metabolic features. Environ. Microbiol. 2017, 19, 835–841. [Google Scholar] [CrossRef] [Green Version]
- Walters, W.A.; Xu, Z.; Knight, R. Meta-analyses of human gut microbes associated with obesity and IBD. FEBS Lett. 2014, 588, 4223–4233. [Google Scholar] [CrossRef] [Green Version]
- Zhu, L.; Baker, S.S.; Gill, C.; Liu, W.; Alkhouri, R.; Baker, R.D.; Gill, S.R. Characterization of gut microbiomes in nonalcoholic steatohepatitis (NASH) patients: A connection between endogenous alcohol and NASH. Hepatology 2013, 57, 601–609. [Google Scholar] [CrossRef]
- David, L.A.; Maurice, C.F.; Carmody, R.N.; Gootenberg, D.B.; Button, J.E.; Wolfe, B.E.; Ling, A.V.; Devlin, A.S.; Varma, Y.; Fischbach, M.A. Diet rapidly and reproducibly alters the human gut microbiome. Nature 2014, 505, 559–563. [Google Scholar] [CrossRef] [Green Version]
- Louis, P.; Flint, H.J. Formation of propionate and butyrate by the human colonic microbiota. Environ. Microbiol. 2017, 19, 29–41. [Google Scholar] [CrossRef] [Green Version]
- Venegas, D.P.; Marjorie, K.; Landskron, G.; González, M.J.; Quera, R.; Dijkstra, G.; Harmsen, H.J.; Faber, K.N.; Hermoso, M.A. Short chain fatty acids (SCFAs)-mediated gut epithelial and immune regulation and its relevance for inflammatory bowel diseases. Front. Immunol. 2019, 10, 277. [Google Scholar] [CrossRef] [Green Version]
- Dimitriu, P.A.; Boyce, G.; Samarakoon, A.; Hartmann, M.; Johnson, P.; Mohn, W.W. Temporal stability of the mouse gut microbiota in relation to innate and adaptive immunity. Environ. Microbiol. Rep. 2013, 5, 200–210. [Google Scholar] [CrossRef] [PubMed]
- Rausch, P.; Steck, N.; Suwandi, A.; Seidel, J.A.; Künzel, S.; Bhullar, K.; Basic, M.; Bleich, A.; Johnsen, J.M.; Vallance, B.A. Expression of the blood-group-related gene B4galnt2 alters susceptibility to Salmonella infection. PLoS Pathog. 2015, 11, e1005008. [Google Scholar] [CrossRef] [PubMed] [Green Version]
- Bajer, L.; Kverka, M.; Kostovcik, M.; Macinga, P.; Dvorak, J.; Stehlikova, Z.; Brezina, J.; Wohl, P.; Spicak, J.; Drastich, P. Distinct gut microbiota profiles in patients with primary sclerosing cholangitis and ulcerative colitis. World J. Gastroenterol. 2017, 23, 4548. [Google Scholar] [CrossRef] [PubMed]
- Santoru, M.L.; Piras, C.; Murgia, A.; Palmas, V.; Camboni, T.; Liggi, S.; Ibba, I.; Lai, M.A.; Orrù, S.; Blois, S. Cross sectional evaluation of the gut-microbiome metabolome axis in an Italian cohort of IBD patients. Sci. Rep. 2017, 7, 1–14. [Google Scholar] [CrossRef] [PubMed]
- Lam-Himlin, D.; Tsiatis, A.C.; Montgomery, E.; Pai, R.K.; Brown, J.A.; Razavi, M.; Lamps, L.; Eshleman, J.R.; Bhagavan, B.; Anders, R.A. Sarcina organisms in the gastrointestinal tract: A clinicopathologic and molecular study. Am. J. Surg. Pathol. 2011, 35, 1700. [Google Scholar] [CrossRef] [Green Version]
- Ratuapli, S.K.; Lam-Himlin, D.M.; Heigh, R.I. Sarcina ventriculi of the stomach: A case report. World J. Gastroenterol. WJG 2013, 19, 2282. [Google Scholar] [CrossRef]
- Xiao, Y.; Kong, F.; Xiang, Y.; Zhou, W.; Wang, J.; Yang, H.; Zhang, G.; Zhao, J. Comparative biogeography of the gut microbiome between Jinhua and Landrace pigs. Sci. Rep. 2018, 8, 1–10. [Google Scholar] [CrossRef]
- Bottoms, K.A. Establishing an Ideal Inclusion Rate of Fermented Soybean Meal and Sodium Butyrate on Growth Performance, Complete Blood Cell Count, and Nutrient Utilization in Nursery Pigs. Ph.D. Thesis, University of Arkansas, Fayetteville, NC, USA, December 2019. [Google Scholar]


| Trial #1 | Trial #2 | |||||
|---|---|---|---|---|---|---|
| Ingredients, % | Phase 1 | Phase 2 | Phase 3 | Phase 1 | Phase 2 | Phase 3 |
| Corn, yellow dense 1 | 29.02 | 31.42 | 49.53 | 29.90 | 32.18 | 49.88 |
| Dried distillers grain with solubles (6–10% fat) | 5.00 | 15.00 | 15.00 | 5.00 | 15.00 | 15.00 |
| Dried whey | 8.00 | 4.00 | 0.00 | 8.00 | 4.00 | 0.00 |
| Soybean meal, 48% CP | 22.65 | 28.05 | 29.30 | 22.65 | 28.05 | 29.30 |
| Oats | 15.00 | 12.50 | 0.00 | 15.00 | 12.50 | 0.00 |
| Fish meal | 5.00 | 3.15 | 0.00 | 5.00 | 3.15 | 0.00 |
| Lactose | 0.25 | 0.00 | 0.00 | 0.25 | 0.00 | 0.00 |
| Enzymatic SBM | 9.50 | 0.00 | 0.00 | 9.50 | 0.00 | 0.00 |
| Soybean oil | 2.50 | 2.50 | 2.50 | 2.50 | 2.50 | 2.50 |
| Benzoic acid 2 | 0.50 | 0.50 | 0.50 | 0.50 | 0.50 | 0.50 |
| Other 3 | 2.58 | 2.95 | 3.24 | 2.58 | 2.95 | 3.24 |
| Calculated | ||||||
| Metabolizable energy (kcal/kg) | 3274 | 3233 | 3451 | 3455 | 3429 | 3402 |
| Crude protein (%) | 25.62 | 23.94 | 22.17 | 26.50 | 25.03 | 22.84 |
| SID lysine (%) | 1.50 | 1.35 | 1.23 | 1.46 | 1.42 | 1.28 |
| Available P (%) | 0.45 | 0.40 | 0.33 | 0.41 | 0.30 | 0.22 |
| Ca (%) | 0.85 | 0.80 | 0.70 | 0.76 | 0.66 | 0.56 |
| Analyzed | ||||||
| Gross energy (kcal/kg) | 4145 | 4094 | 4086 | 4529 | 4584 | 4558 |
| Crude protein, % | 26.97 | 23.03 | 21.90 | 26.40 | 24.10 | 23.20 |
| Treatment 1 | p-Value | ||||||||
|---|---|---|---|---|---|---|---|---|---|
| BA | SBA0.035 | SBA0.070 | SBA0.105 | NC | SEM | Linear | Quadratic | BA vs. NC | |
| DM 2 | 0.94 | 0.93 | 0.92 | 0.92 | 0.92 | 0.00 | 0.11 | 0.71 | <0.01 |
| Energy | 0.84 | 0.79 | 0.78 | 0.78 | 0.78 | 0.01 | 0.17 | 0.51 | <0.01 |
| Nitrogen | 0.81 | 0.76 | 0.72 | 0.70 | 0.72 | 0.02 | <0.01 | 0.73 | <0.01 |
| Ash | 0.65 | 0.55 | 0.46 | 0.50 | 0.52 | 0.02 | 0.08 | <0.01 | <0.01 |
| NDF 3 | 0.73 | 0.65 | 0.62 | 0.62 | 0.63 | 0.02 | 0.15 | 0.47 | <0.01 |
| ADF 4 | 0.66 | 0.55 | 0.54 | 0.52 | 0.59 | 0.02 | 0.32 | 0.67 | 0.03 |
| Phosphorus | 0.58 | 0.49 | 0.37 | 0.36 | 0.39 | 0.03 | <0.01 | 0.11 | <0.01 |
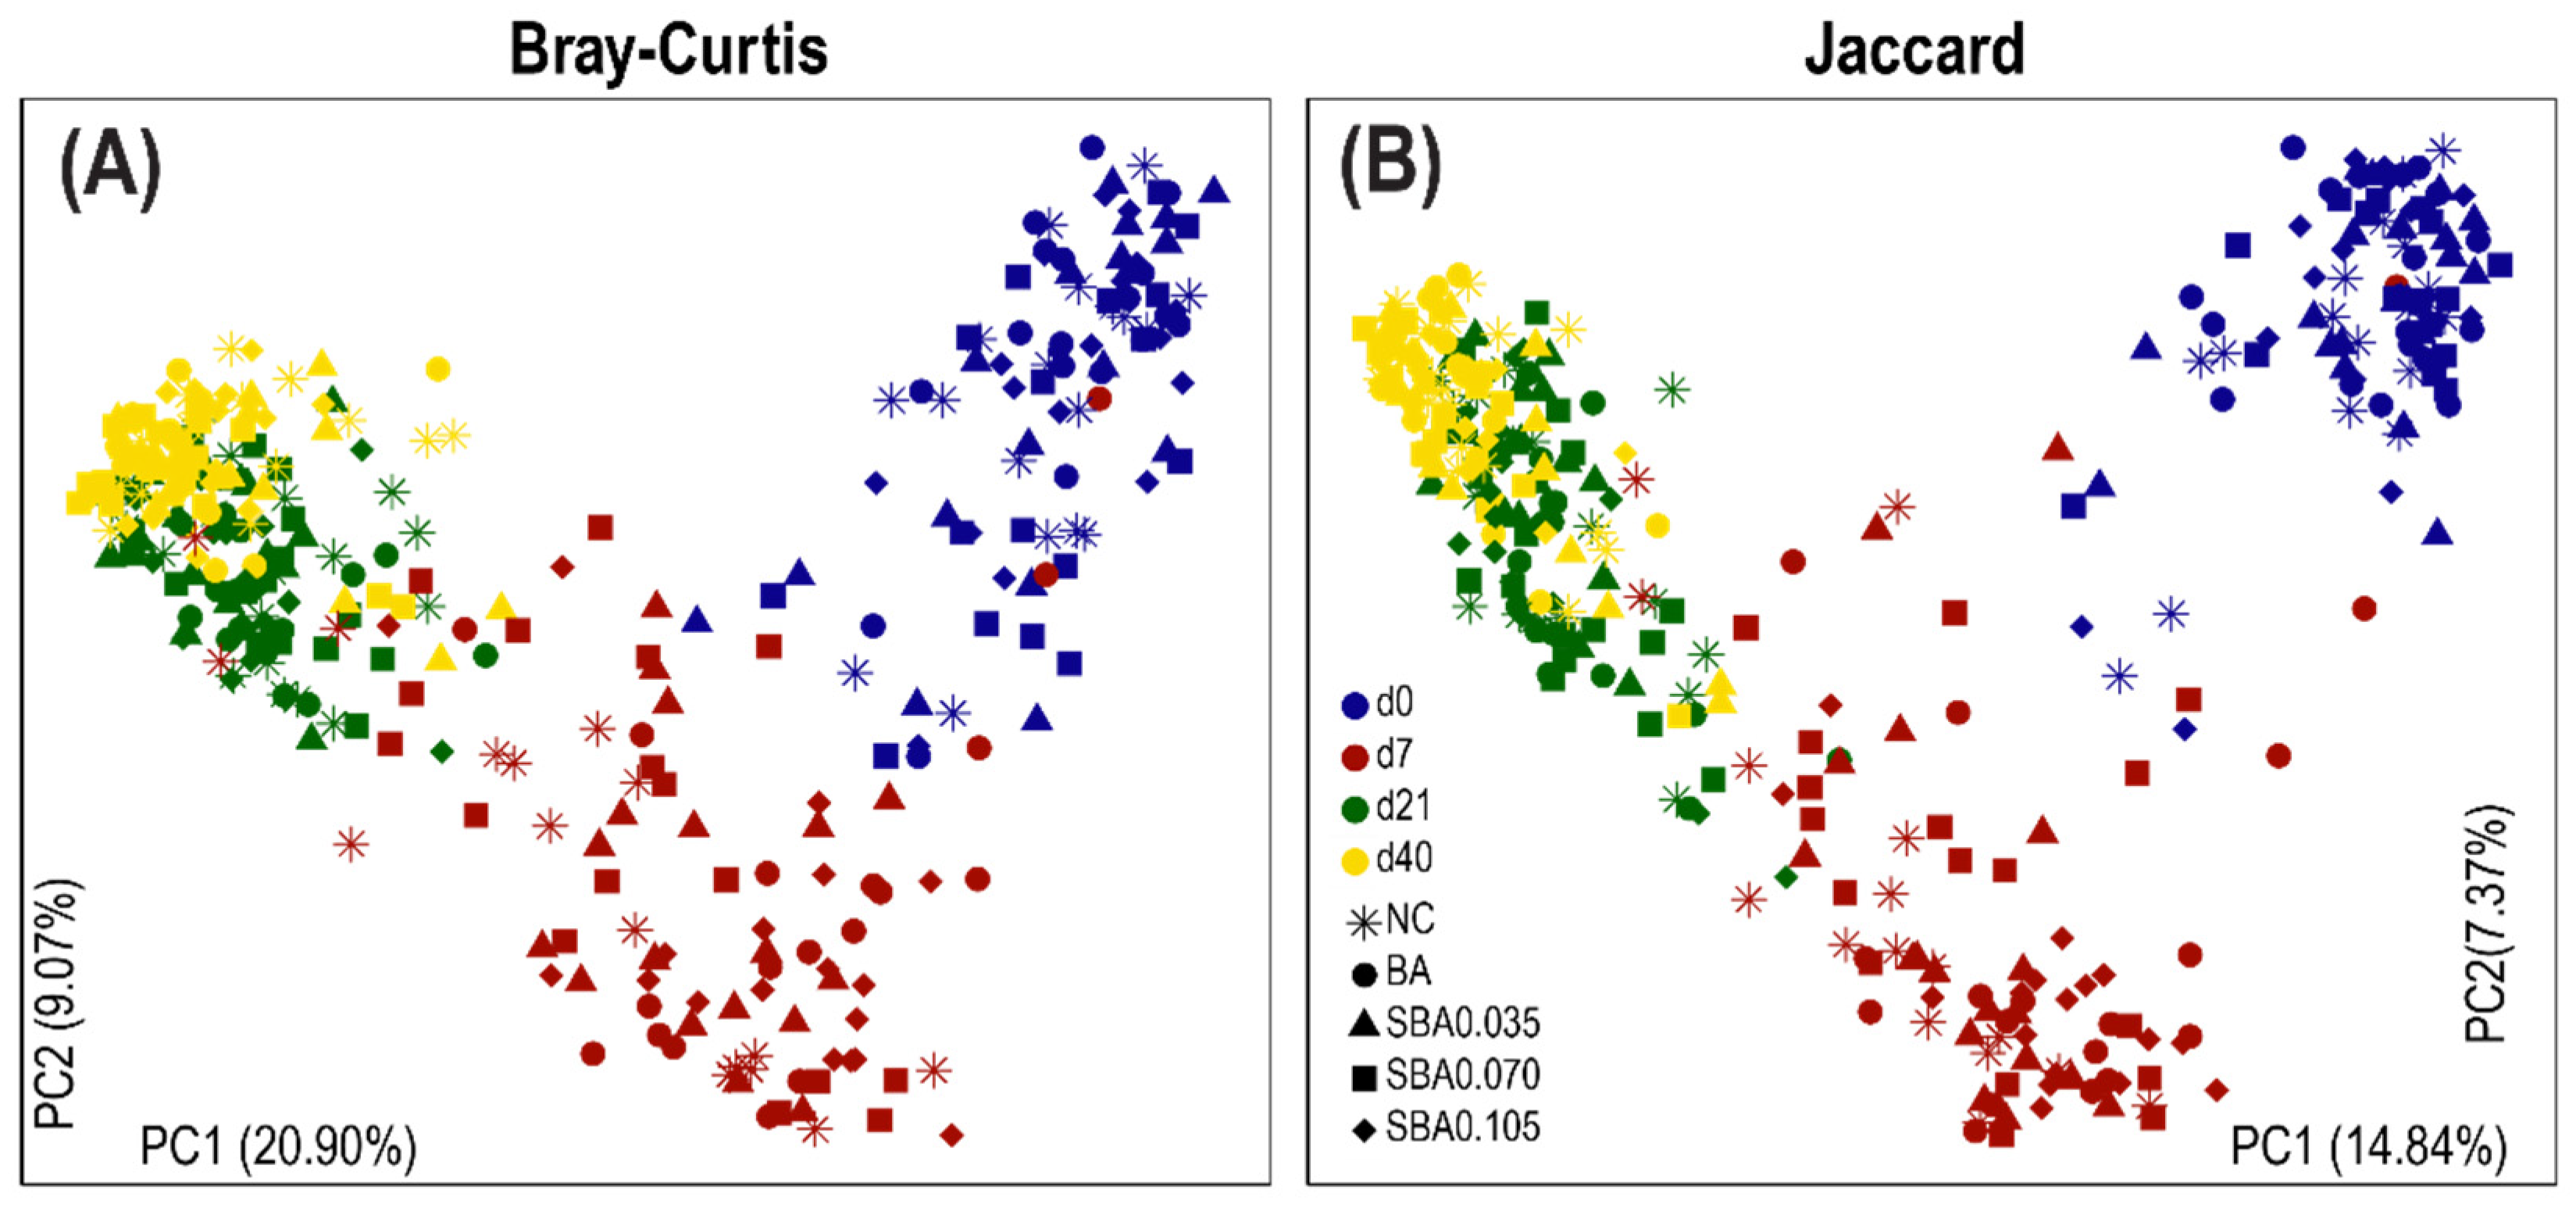
| Group 1 | Group 2 | Sample Size | Permutations | Bray–Curtis | Jaccard | ||||
|---|---|---|---|---|---|---|---|---|---|
| R | p-Value | q-Value | R | p-Value | q-Value | ||||
| d0 | d7 | 176 | 999 | 0.69 | 0.001 | 0.001 | 0.80 | 0.001 | 0.001 |
| d0 | d21 | 179 | 999 | 0.82 | 0.001 | 0.001 | 0.91 | 0.001 | 0.001 |
| d0 | d40 | 178 | 999 | 0.84 | 0.001 | 0.001 | 0.92 | 0.001 | 0.001 |
| d7 | d21 | 177 | 999 | 0.56 | 0.001 | 0.001 | 0.68 | 0.001 | 0.001 |
| d7 | d40 | 176 | 999 | 0.69 | 0.001 | 0.001 | 0.83 | 0.001 | 0.001 |
| d21 | d40 | 179 | 999 | 0.46 | 0.001 | 0.001 | 0.49 | 0.001 | 0.001 |
Publisher’s Note: MDPI stays neutral with regard to jurisdictional claims in published maps and institutional affiliations. |
© 2021 by the authors. Licensee MDPI, Basel, Switzerland. This article is an open access article distributed under the terms and conditions of the Creative Commons Attribution (CC BY) license (http://creativecommons.org/licenses/by/4.0/).
Share and Cite
Wei, X.; Bottoms, K.A.; Stein, H.H.; Blavi, L.; Bradley, C.L.; Bergstrom, J.; Knapp, J.; Story, R.; Maxwell, C.; Tsai, T.; et al. Dietary Organic Acids Modulate Gut Microbiota and Improve Growth Performance of Nursery Pigs. Microorganisms 2021, 9, 110. https://doi.org/10.3390/microorganisms9010110
Wei X, Bottoms KA, Stein HH, Blavi L, Bradley CL, Bergstrom J, Knapp J, Story R, Maxwell C, Tsai T, et al. Dietary Organic Acids Modulate Gut Microbiota and Improve Growth Performance of Nursery Pigs. Microorganisms. 2021; 9(1):110. https://doi.org/10.3390/microorganisms9010110
Chicago/Turabian StyleWei, Xiaoyuan, Kristopher A. Bottoms, Hans H. Stein, Laia Blavi, Casey L. Bradley, Jon Bergstrom, Joshua Knapp, Robert Story, Charles Maxwell, Tsungcheng Tsai, and et al. 2021. "Dietary Organic Acids Modulate Gut Microbiota and Improve Growth Performance of Nursery Pigs" Microorganisms 9, no. 1: 110. https://doi.org/10.3390/microorganisms9010110