Emulsion PCR (ePCR) as a Tool to Improve the Power of DGGE Analysis for Microbial Population Studies

Abstract
:
1. Introduction
2. Materials and Methods
2.1. Sampling
2.2. DNA Preparation and Extraction
2.3. Conventional PCR Protocol
2.4. ePCR Protocol
2.5. DGGE and Bands Identification
3. Results and Discussion
4. Conclusions
Author Contributions
Funding
Conflicts of Interest
References
- Muyzer, G.; de Waal, E.C.; Uitterlinden, A.G. Profiling of complex microbial populations by denaturing gradient gel electrophoresis of polymerase chain reaction-amplified genes coding for 16S rRNA. Appl. Environ. Microbiol. 1993, 59, 695–700. [Google Scholar] [CrossRef] [PubMed] [Green Version]
- Ercolini, D.; Mauriello, G.; Blaiotta, G.; Moschetti, G.; Coppola, S. PCR-DGGE fingerprints of microbial succession during a manufacture of traditional water buffalo mozzarella cheese. J. Appl. Microbiol. 2004, 96, 263–270. [Google Scholar] [CrossRef] [PubMed] [Green Version]
- Iacumin, L.; Osualdini, M.; Bovolenta, S.; Boscolo, D.; Chiesa, L.; Panseri, S.; Comi, G. Microbial, chemico-physical and volatile aromatic compounds characterization of Pitina PGI, a peculiar sausage-like product of North East Italy. Meat Sci. 2020, 163, 108081. [Google Scholar] [CrossRef] [PubMed]
- Iacumin, L.; Cecchini, F.; Manzano, M.; Osualdini, M.; Boscolo, D.; Orlic, S.; Comi, G. Description of the microflora of sourdoughs by culture-dependent and culture-independent methods. Food Microbiol. 2009, 26, 128–135. [Google Scholar] [CrossRef]
- Comi, G.; Iacumin, L. Ecology of moulds during the pre-ripening and ripening of San Daniele dry cured ham. Food Res. Int. 2013, 54, 1113–1119. [Google Scholar] [CrossRef]
- Manzano, M.; Cocolin, L.; Iacumin, L.; Cantoni, C.; Comi, G. A PCR-TGGE (Temperature Gradient Gel Electrophoresis) technique to assess differentiation among enological Saccharomyces cerevisiae strains. Int. J. Food Microbiol. 2005, 101, 333–339. [Google Scholar] [CrossRef]
- Kesmen, Z.; Kacmaz, N. Determination of lactic microflora of kefir grains and kefir beverage by using culture-dependent and culture-independent methods. J. Food Sci. 2011, 76, 276–283. [Google Scholar] [CrossRef]
- Bao, Q.; Liu, W.; Yu, J.; Wang, W.; Qing, M.; Chen, X.; Wang, F.; Zhang, J.; Zhang, W.; Qiao, J.; et al. Isolation and identification of cultivable lactic acid bacteria in traditional yak milk products of Gansu Province in China. J. Gen. Appl. Microbiol. 2012, 58, 95–105. [Google Scholar] [CrossRef] [Green Version]
- Iacumin, L.; Manzano, M.; Comi, G. Catalase-positive cocci in fermented sausage: Variability due to different pork breeds, breeding systems and sausage production technology. Food Microbiol. 2012, 29, 178–186. [Google Scholar] [CrossRef]
- Yamasaki, S.; Nomura, N.; Nakajima, T.; Uchiyama, H. Cultivation-independent identification of candidate dehalorespiring bacteria in tetrachloroethylene degradation. Environ. Sci. Technol. 2012, 46, 7709–7716. [Google Scholar] [CrossRef]
- Zhao, J.; Wu, X.; Nie, C.; Wu, T.; Dai, W.; Liu, H.; Yang, R. Analysis of unculturable bacterial communities in tea orchard soils based on nested PCR-DGGE. World J. Microbiol. Biotechnol. 2012, 28, 1967–1979. [Google Scholar] [CrossRef]
- Freire, A.L.; Ramos, C.L.; de Almeida, E.G.; Duarte, W.F.; Schwan, R.F. Study of the physicochemical parameters and spontaneous fermentation during the traditional production of yakupa, an indigenous beverage produced by Brazilian Amerindians. World J. Microbiol. Biotechnol. 2014, 30, 567–577. [Google Scholar] [CrossRef]
- Reysenbach, A.L.; Giver, L.J.; Wickham, G.S.; Pace, N.R. Differential amplification of rRNA genes by polymerase chain reaction. Appl. Environ. Microbiol. 1992, 58, 3417–3418. [Google Scholar] [CrossRef] [Green Version]
- Suzuki, M.; Giovannoni, S.J. Bias caused by template annealing in the amplification of misture of 16S rRNA genes by PCR. Appl. Environ. Microbiol. 1996, 62, 625–630. [Google Scholar] [CrossRef] [PubMed] [Green Version]
- Franciosa, I.; Alessandria, V.; Dolci, P.; Rantsiou, K.; Cocolin, L. Sausage fermentation and starter cultures in the era of molecular biologymethods. Int. J. Food Microbiol. 2018, 279, 26–32. [Google Scholar] [CrossRef] [PubMed]
- Dabney, J.; Meyer, M. Length and GC-biases during sequencing library amplification: A comparison of various polymerase-buffer systems with ancient and modern DNA sequencing libraries. Biotechniques 2012, 52, 87–94. [Google Scholar] [CrossRef] [Green Version]
- Aird, D.; Ross, M.G.; Chen, W.; Danielsson, M.; Fennell, T.; Russ, C.; Jaffe, D.B.; Nusbaum, C.; Gnirke, A. Analyzing and minimizing PCR amplification bias in Illumina sequencing libraries. Genome Biol. 2011, 12, R18. [Google Scholar] [CrossRef] [PubMed] [Green Version]
- Fontana, C.; Bassi, D.; López, C.; Pisacane, V.; Otero, M.C.; Puglisi, E.; Rebecchi, A.; Cocconcelli, P.; Vignolo, G. Microbial ecology involved in the ripening of naturally fermented llama meat sausages. A focus on lactobacilli diversity. Int. J. Food Microbiol. 2016, 236, 17–25. [Google Scholar] [CrossRef]
- Piwosz, K.; Shabarova, T.; Pernthaler, J.; Posch, T.; Šimek, K.; Porcal, P.; Salcher, M.M. Bacterial and eukaryotic small-subunit amplicon data do not provide a quantitative picture of microbial communities, but they are reliable in the context of ecological interpretations. mSphere 2020, 5, e00052-20. [Google Scholar] [CrossRef] [Green Version]
- Nakano, M.; Komatsu, J.; Matsuura, S.; Kazunori, T.; Katsura, S.; Mizuno, A. Single-molecule PCR using water-in-oil emulsion. J. Biotechnol. 2003, 102, 117–124. [Google Scholar] [CrossRef]
- Griffiths, A.D.; Tawfik, D.S. Miniaturizing the laboratory in emulsion droplets. TRENDS Biotechnol. 2006, 30, 1–8. [Google Scholar]
- Leng, X.; Zhang, W.; Wang, C.; Cui, L.; Yang, C.J. Agarose droplet microfluidics for highly parallel and efficient single molecule emulsion PCR. Lab Chip 2010, 10, 2841–2843. [Google Scholar] [CrossRef] [PubMed] [Green Version]
- Rothrock, M.J.; Hiett, K.L.; Kiepper, B.H.; Ingram, K.; Hinton, A. Quantification of zoonotic bacterial pathogens within commercial poultry processing water samples using droplet digital PCR. Adv. Microbiol. 2013, 3, 403–411. [Google Scholar] [CrossRef] [Green Version]
- Gerdes, L.; Iwobi, A.; Busch, U.; Pecoraro, S. Optimization of digital droplet polymerase chain reaction for quantification of genetically modified organisms. Biomol. Detect. Quantif. 2016, 7, 9–20. [Google Scholar] [CrossRef] [PubMed] [Green Version]
- Liu, X.; Feng, J.; Zhang, Q.; Guo, D.; Zhang, L.; Suo, T.; Hu, W.; Guo, M.; Wang, X.; Huang, Z.; et al. Analytical comparisons of SARS-COV-2 detection by qRT-PCR and ddPCR with multiple primer/probe sets. Emerg. Microb. Infect. 2020, 9, 1175–1179. [Google Scholar] [CrossRef] [PubMed]
- Chen, J.; Luo, Z.; Li, L.; He, J.; Li, L.; Zhu, J.; Wu, P.; He, L. Capillary-based integrated digital PCR in picoliter droplets. Lab Chip 2018, 18, 412–421. [Google Scholar] [CrossRef]
- Cremonesi, P.; Cortimiglia, C.; Picozzi, C.; Minozzi, G.; Malvisi, M.; Luini, M.; Castiglioni, B. Development of a droplet digital polymerase chain reaction for rapid and simultaneous identification of common foodborne pathogens in soft cheese. Front. Microbiol. 2016, 7, 1725. [Google Scholar] [CrossRef]
- Querol, A.; Barrio, E.; Ramon, D. A comparative study of different methods of yeast strain characterizatio. System. Appl. Microbiol. 1992, 15, 439–446. [Google Scholar] [CrossRef]
- Iacumin, L.; Comi, G.; Cantoni, C.; Cocolin, L. Ecology and dynamics of coagulase-negative cocci isolated from naturally fermented Italian sausages. Syst. Appl. Microbiol. 2006, 29, 480–486. [Google Scholar] [CrossRef]
- Ercolini, D.; Moschetti, G.; Blaiotta, G.; Coppola, S. The potential of a polyphasic PCR-DGGE approach in evaluating microbial diversity of natural whey cultures for water-buffalo mozzarella cheese production: Bias of culturedependent and culture-independent approaches. Syst. Appl. Microbiol. 2001, 24, 610–617. [Google Scholar] [CrossRef]
- Klijn, N.; Weerkamp, A.H.; de Vos, W.M. Identification of mesophilic lactic acid bacteria by using polymerase chain reaction-amplified variable regions of 16S rRNA and specific DNA probes. Appl. Environ. Microbiol. 1991, 57, 3390–3393. [Google Scholar] [CrossRef] [PubMed] [Green Version]
- Sheffild, V.C.; Cox, D.R.; Lerman, L.S.; Myers, R.M. Attachment of a 40-base pair GC-rich sequence (GC clamp) to genomic DNA fragments by the polymerase chain reaction results improved detection of single base changes. Proc. Natl. Acad. Sci. USA 1989, 86, 232–236. [Google Scholar] [CrossRef] [PubMed] [Green Version]
- Cocolin, L.; Rantsiou, K.; Iacumin, L.; Urso, R.; Cantoni, C.; Comi, G. Study of the ecology of fresh sausages and characterization of populations of lactic acid bacteria by molecular methods. Appl. Environ. Microbiol. 2004, 70, 1883–1894. [Google Scholar] [CrossRef] [Green Version]
- Altschul, S.F.; Madden, T.L.; Shaffer, A.A.; Zhang, J.; Zhang, Z.; Miller, W.; Lipman, D.J. Gapped BLAST and PSI-BLAST: A new generation of protein database search programs. Nucl. Acid Res. 1997, 25, 3389–3402. [Google Scholar] [CrossRef] [PubMed] [Green Version]
- Stolovitzky, G.; Cecchi, G. Efficiency of DNA replication in the polymerase chain reaction. Proc. Natl. Acad. Sci. USA 1996, 93, 12947–12952. [Google Scholar] [CrossRef] [Green Version]
- Ross, M.G.; Russ, C.; Costello, M.; Hollinger, A.; Lennon, N.J.; Hegarty, R.; Nusbaum, C.; Jaffe, D.B. Characterizing and measuring bias in sequence data. Genome Biol. 2013, 14, R51. [Google Scholar] [CrossRef] [Green Version]
- Hori, M.; Fukano, H.; Suzuki, Y. Uniform amplification of multiple DNAs by emulsion PCR. Biochem. Biophys. Res. Commun. 2007, 352, 323–328. [Google Scholar] [CrossRef]
- Williams, R.; Peisajovich, S.G.; Miller, O.J.; Magdassi, S.; Tawfik, D.S.; Griffiths, A.D. Amplification of complex gene libraries by emulsion PCR. Nat. Methods 2006, 3, 545–550. [Google Scholar] [CrossRef]
- Cocolin, L.; Alessandria, V.; Dolci, P.; Gorra, R.; Rantsiou, K. Culture independent methods to assess the diversity and dynamics of microbiota during food fermentation. Int. J. Food Microbiol. 2013, 167, 29–43. [Google Scholar] [CrossRef]
- Cocolin, L.; Innocente, N.; Biasutti, M.; Comi, G. The late blowing in cheese: A new molecular approach based on PCR and DGGE to study the microbial ecology of the alteration process. Int. J. Food Microbiol. 2004, 90, 83–91. [Google Scholar] [CrossRef]
- Cocolin, L.; Manzano, M.; Cantoni, C.; Comi, G. Denaturing gradient gel electrophoresis analysis of the 16S rRNA gene V1 region to monitor the dynamic changes in the bacterial population during the fermentation of Italian sausages. Appl. Environ. Microbiol. 2001, 67, 5113–5121. [Google Scholar] [CrossRef] [PubMed] [Green Version]


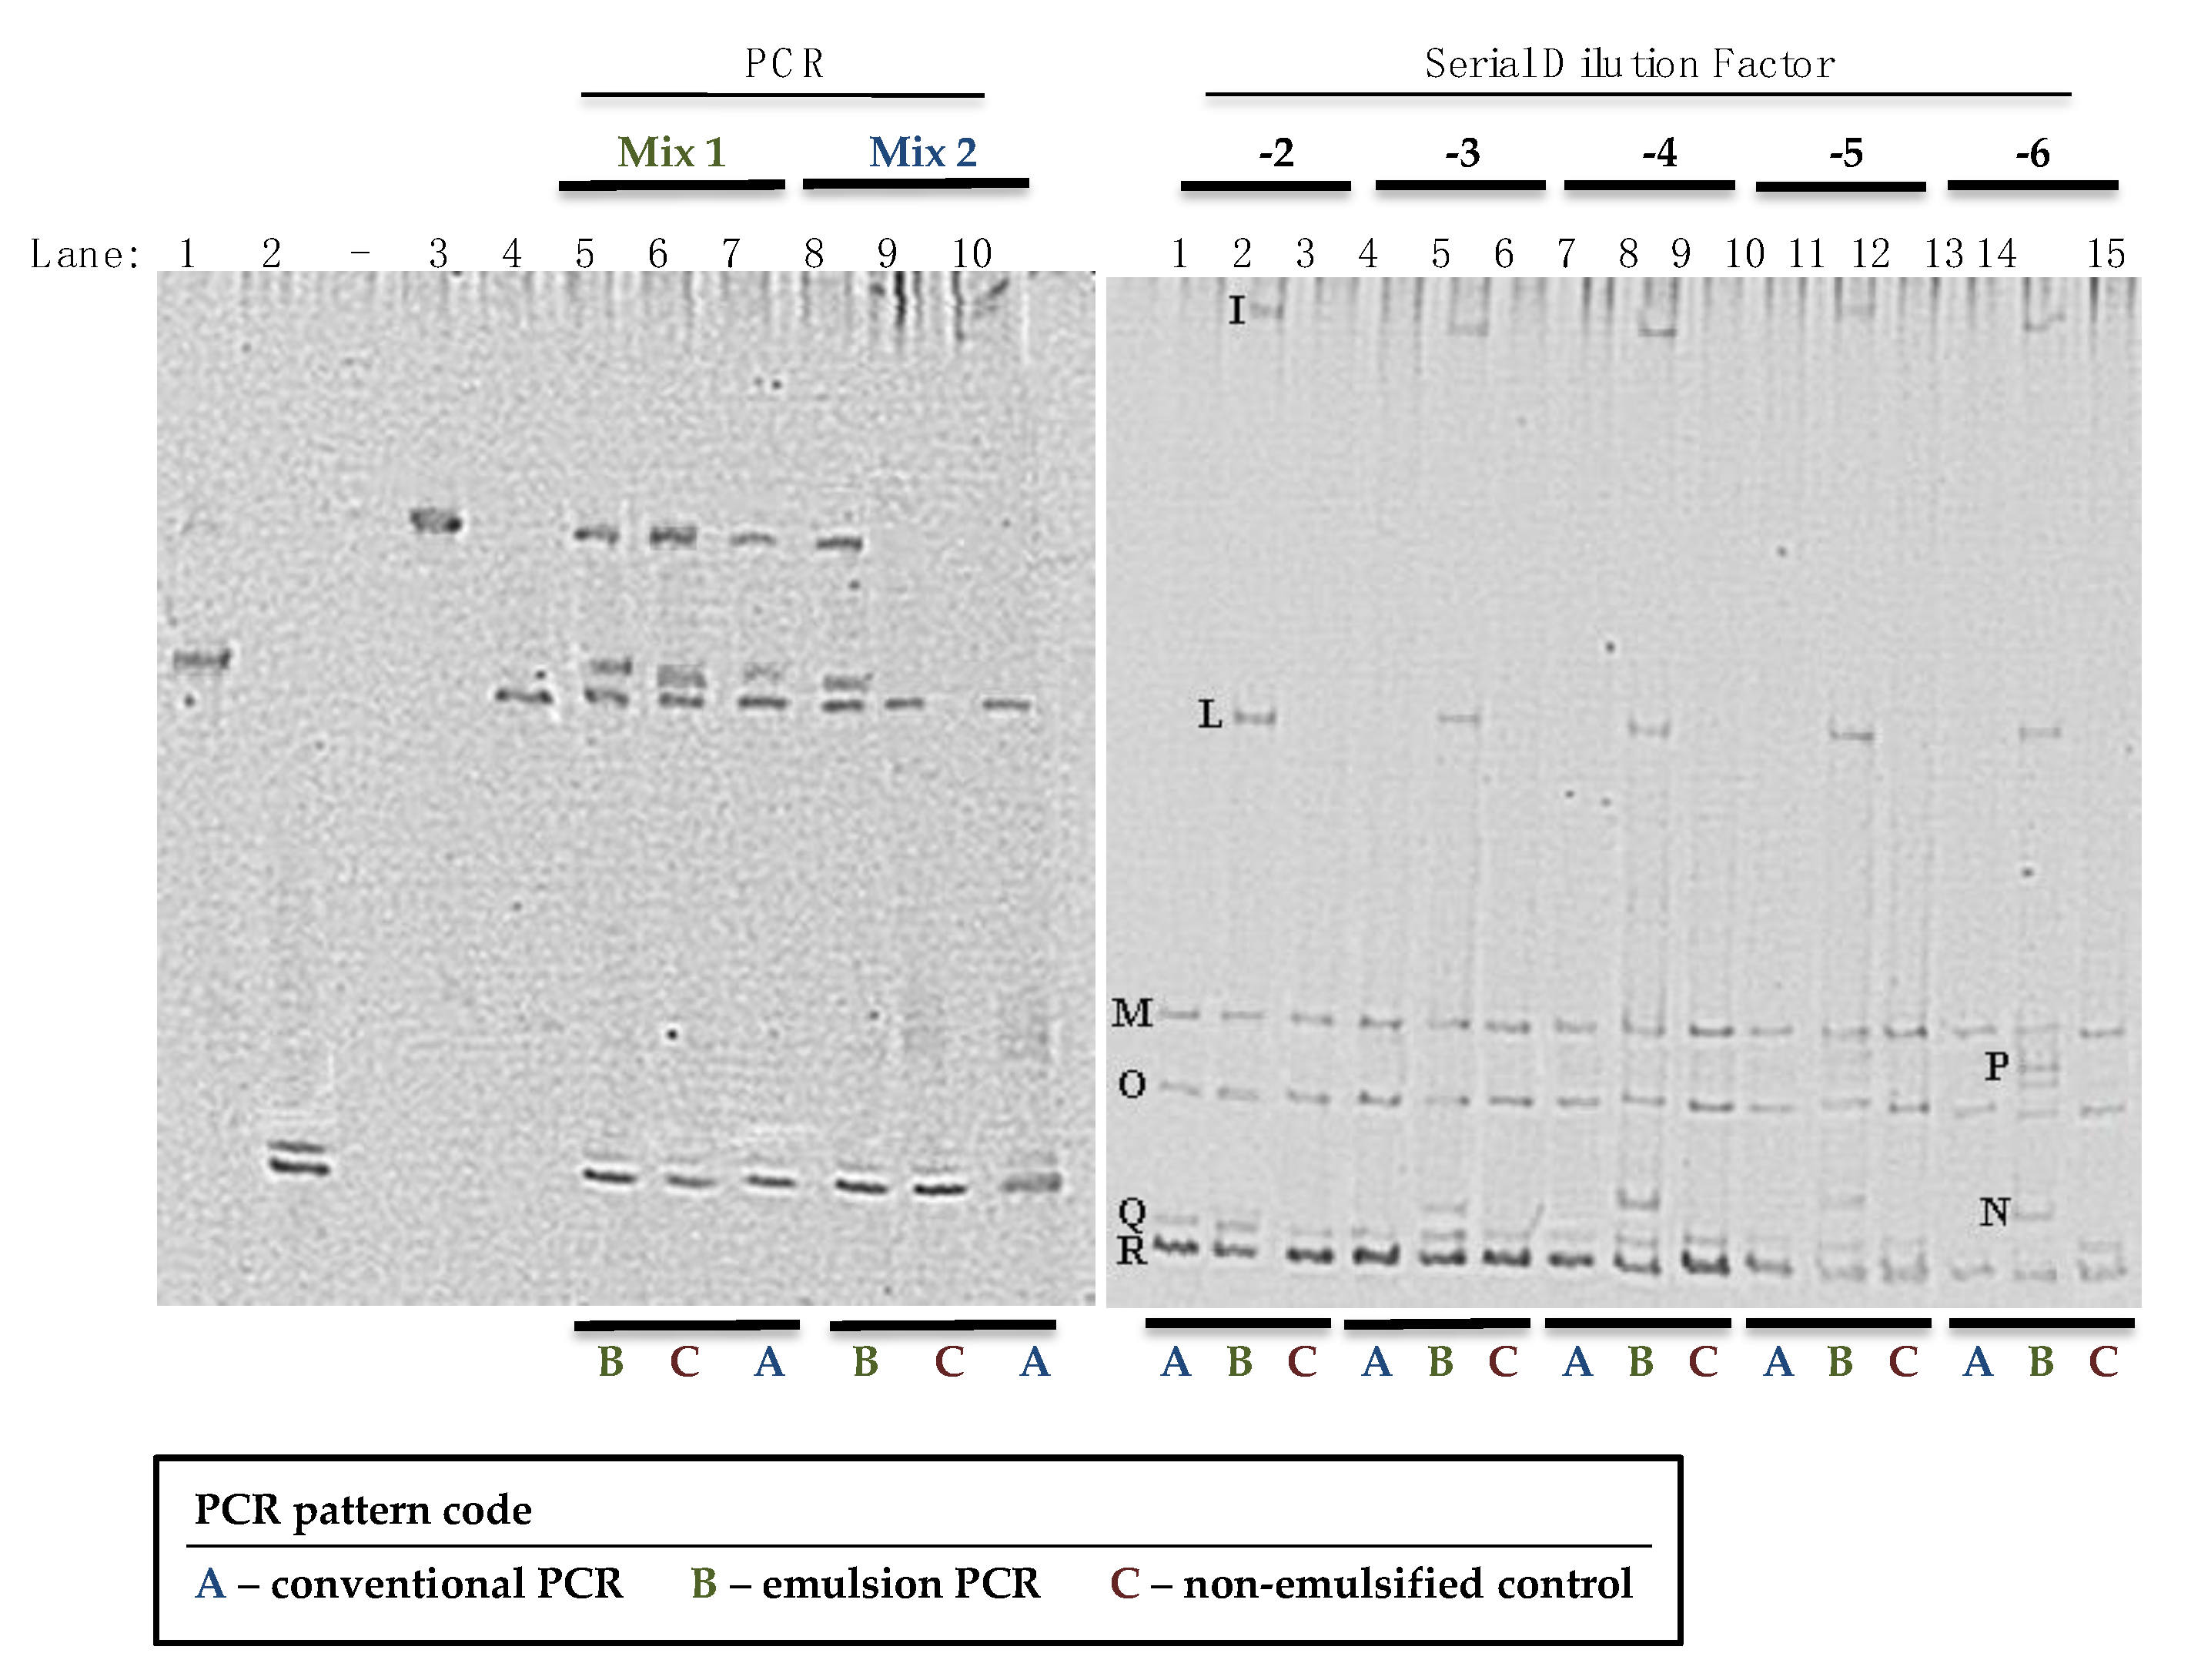
| Band(s) | Size | Closest Relative | % Identity | Accession Number |
|---|---|---|---|---|
| I | 119 | St. haemoliticus | 99 | GQ304781 |
| L | 120 | St. epidermidis | 100 | AM157417 |
| M | 117 | St. equorum | 98 | AY37597 |
| N | 121 | St. aureus | 100 | CP003033 |
| O | 123 | St. succinus | 99 | MK015781 |
| P | 120 | St. carnosus | 100 | AM295250 |
| Q | 123 | St. xylosus | 99 | AB626129 |
| R | 124 | St. xylosus | 99 | AB626129 |
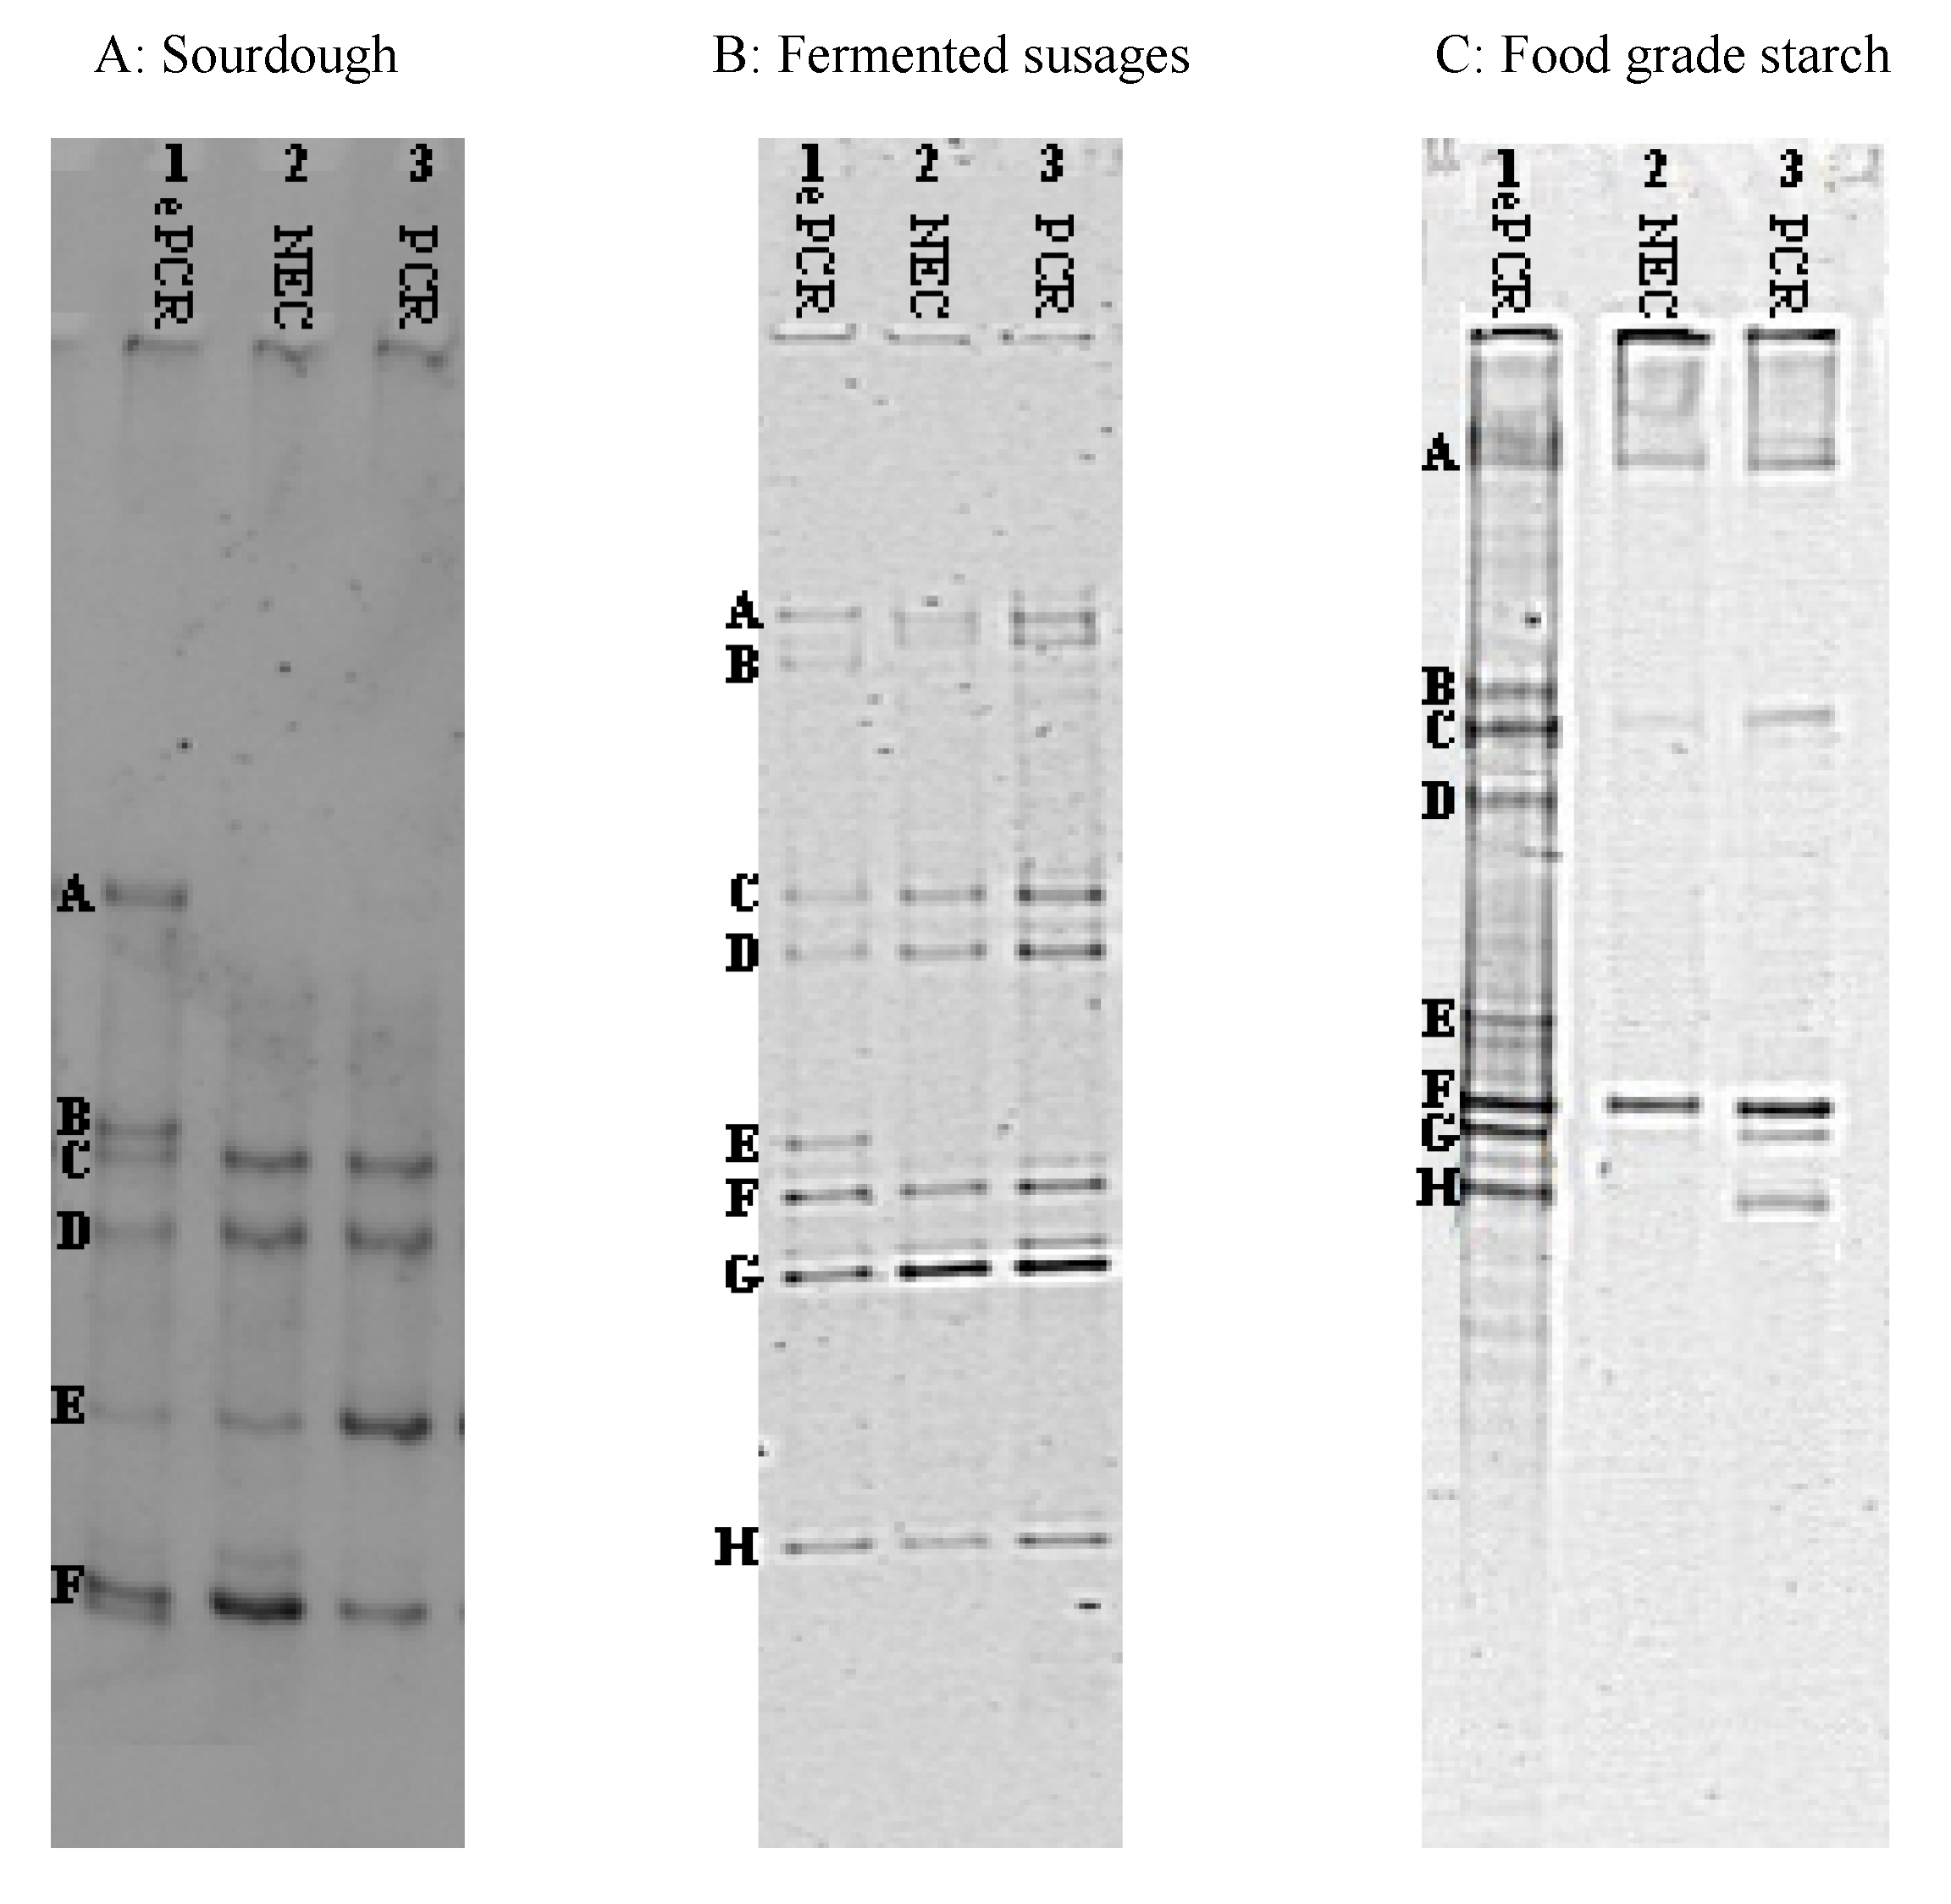
| Sample | Band(s) a | Size | Closet Relative | % Identity | Accession Number b |
|---|---|---|---|---|---|
| Panel A Sourdough | |||||
| A | 218 | Lb. brevis | 100 | AB362618 | |
| B | 223 | Weissella cibaria | 100 | DQ885576 | |
| C | 223 | Leuc. fructosus | 100 | AF360737 | |
| D | 209 | Ped. pentosaceus | 100 | AB362605 | |
| E | 199 | Lb. paralimentarius | 99 | AB289235 | |
| F | 203 | Lc. lactis | 100 | EF694031 | |
| Panel B Fermented Sausages | |||||
| A | Lb. sakei | 99 | AB682465 | ||
| B | Lb. curvatus | 99 | JN382074 | ||
| C | St. xylosus | 99 | AY126259 | ||
| D | Lc. garviae | 100 | FJ611799 | ||
| E | St. equorum | 98 | AY37597 | ||
| F | Lb. sakei | 99 | AB124845 | ||
| G | Ped. pentosaceus | 97 | AB681648 | ||
| H | Macr. caseolyticus | 98 | AY126157 | ||
| Panel C Food-Grade Starch | |||||
| A | 155 | B. pseudofirmus | 98 | JN566125 | |
| B | 165 | St. epidermidis | 100 | HM161755 | |
| C | 180 | B. cereus | 100 | JQ178332 | |
| D | 171 | B. thuringiensis | 100 | JN411477 | |
| E | 130 | B. licheniformis | 100 | JQ388689 | |
| F | 158 | B. cereus | 98 | HQ290100 | |
| G | 160 | B. thuringiensis | 98 | JN411477 | |
| H | 157 | B. subtilis | 98 | JN408331 |
© 2020 by the authors. Licensee MDPI, Basel, Switzerland. This article is an open access article distributed under the terms and conditions of the Creative Commons Attribution (CC BY) license (http://creativecommons.org/licenses/by/4.0/).
Share and Cite
Iacumin, L.; Cecchini, F.; Vendrame, M.; Comi, G. Emulsion PCR (ePCR) as a Tool to Improve the Power of DGGE Analysis for Microbial Population Studies. Microorganisms 2020, 8, 1099. https://doi.org/10.3390/microorganisms8081099
Iacumin L, Cecchini F, Vendrame M, Comi G. Emulsion PCR (ePCR) as a Tool to Improve the Power of DGGE Analysis for Microbial Population Studies. Microorganisms. 2020; 8(8):1099. https://doi.org/10.3390/microorganisms8081099
Chicago/Turabian StyleIacumin, Lucilla, Francesca Cecchini, Marco Vendrame, and Giuseppe Comi. 2020. "Emulsion PCR (ePCR) as a Tool to Improve the Power of DGGE Analysis for Microbial Population Studies" Microorganisms 8, no. 8: 1099. https://doi.org/10.3390/microorganisms8081099