Daily Intake of Paraprobiotic Lactobacillus amylovorus CP1563 Improves Pre-Obese Conditions and Affects the Gut Microbial Community in Healthy Pre-Obese Subjects: A Double-Blind, Randomized, Placebo-Controlled Study

 ,
,
Abstract
:1. Introduction
2. Materials and Methods
2.1. Study Procedures
2.2. Sample Size
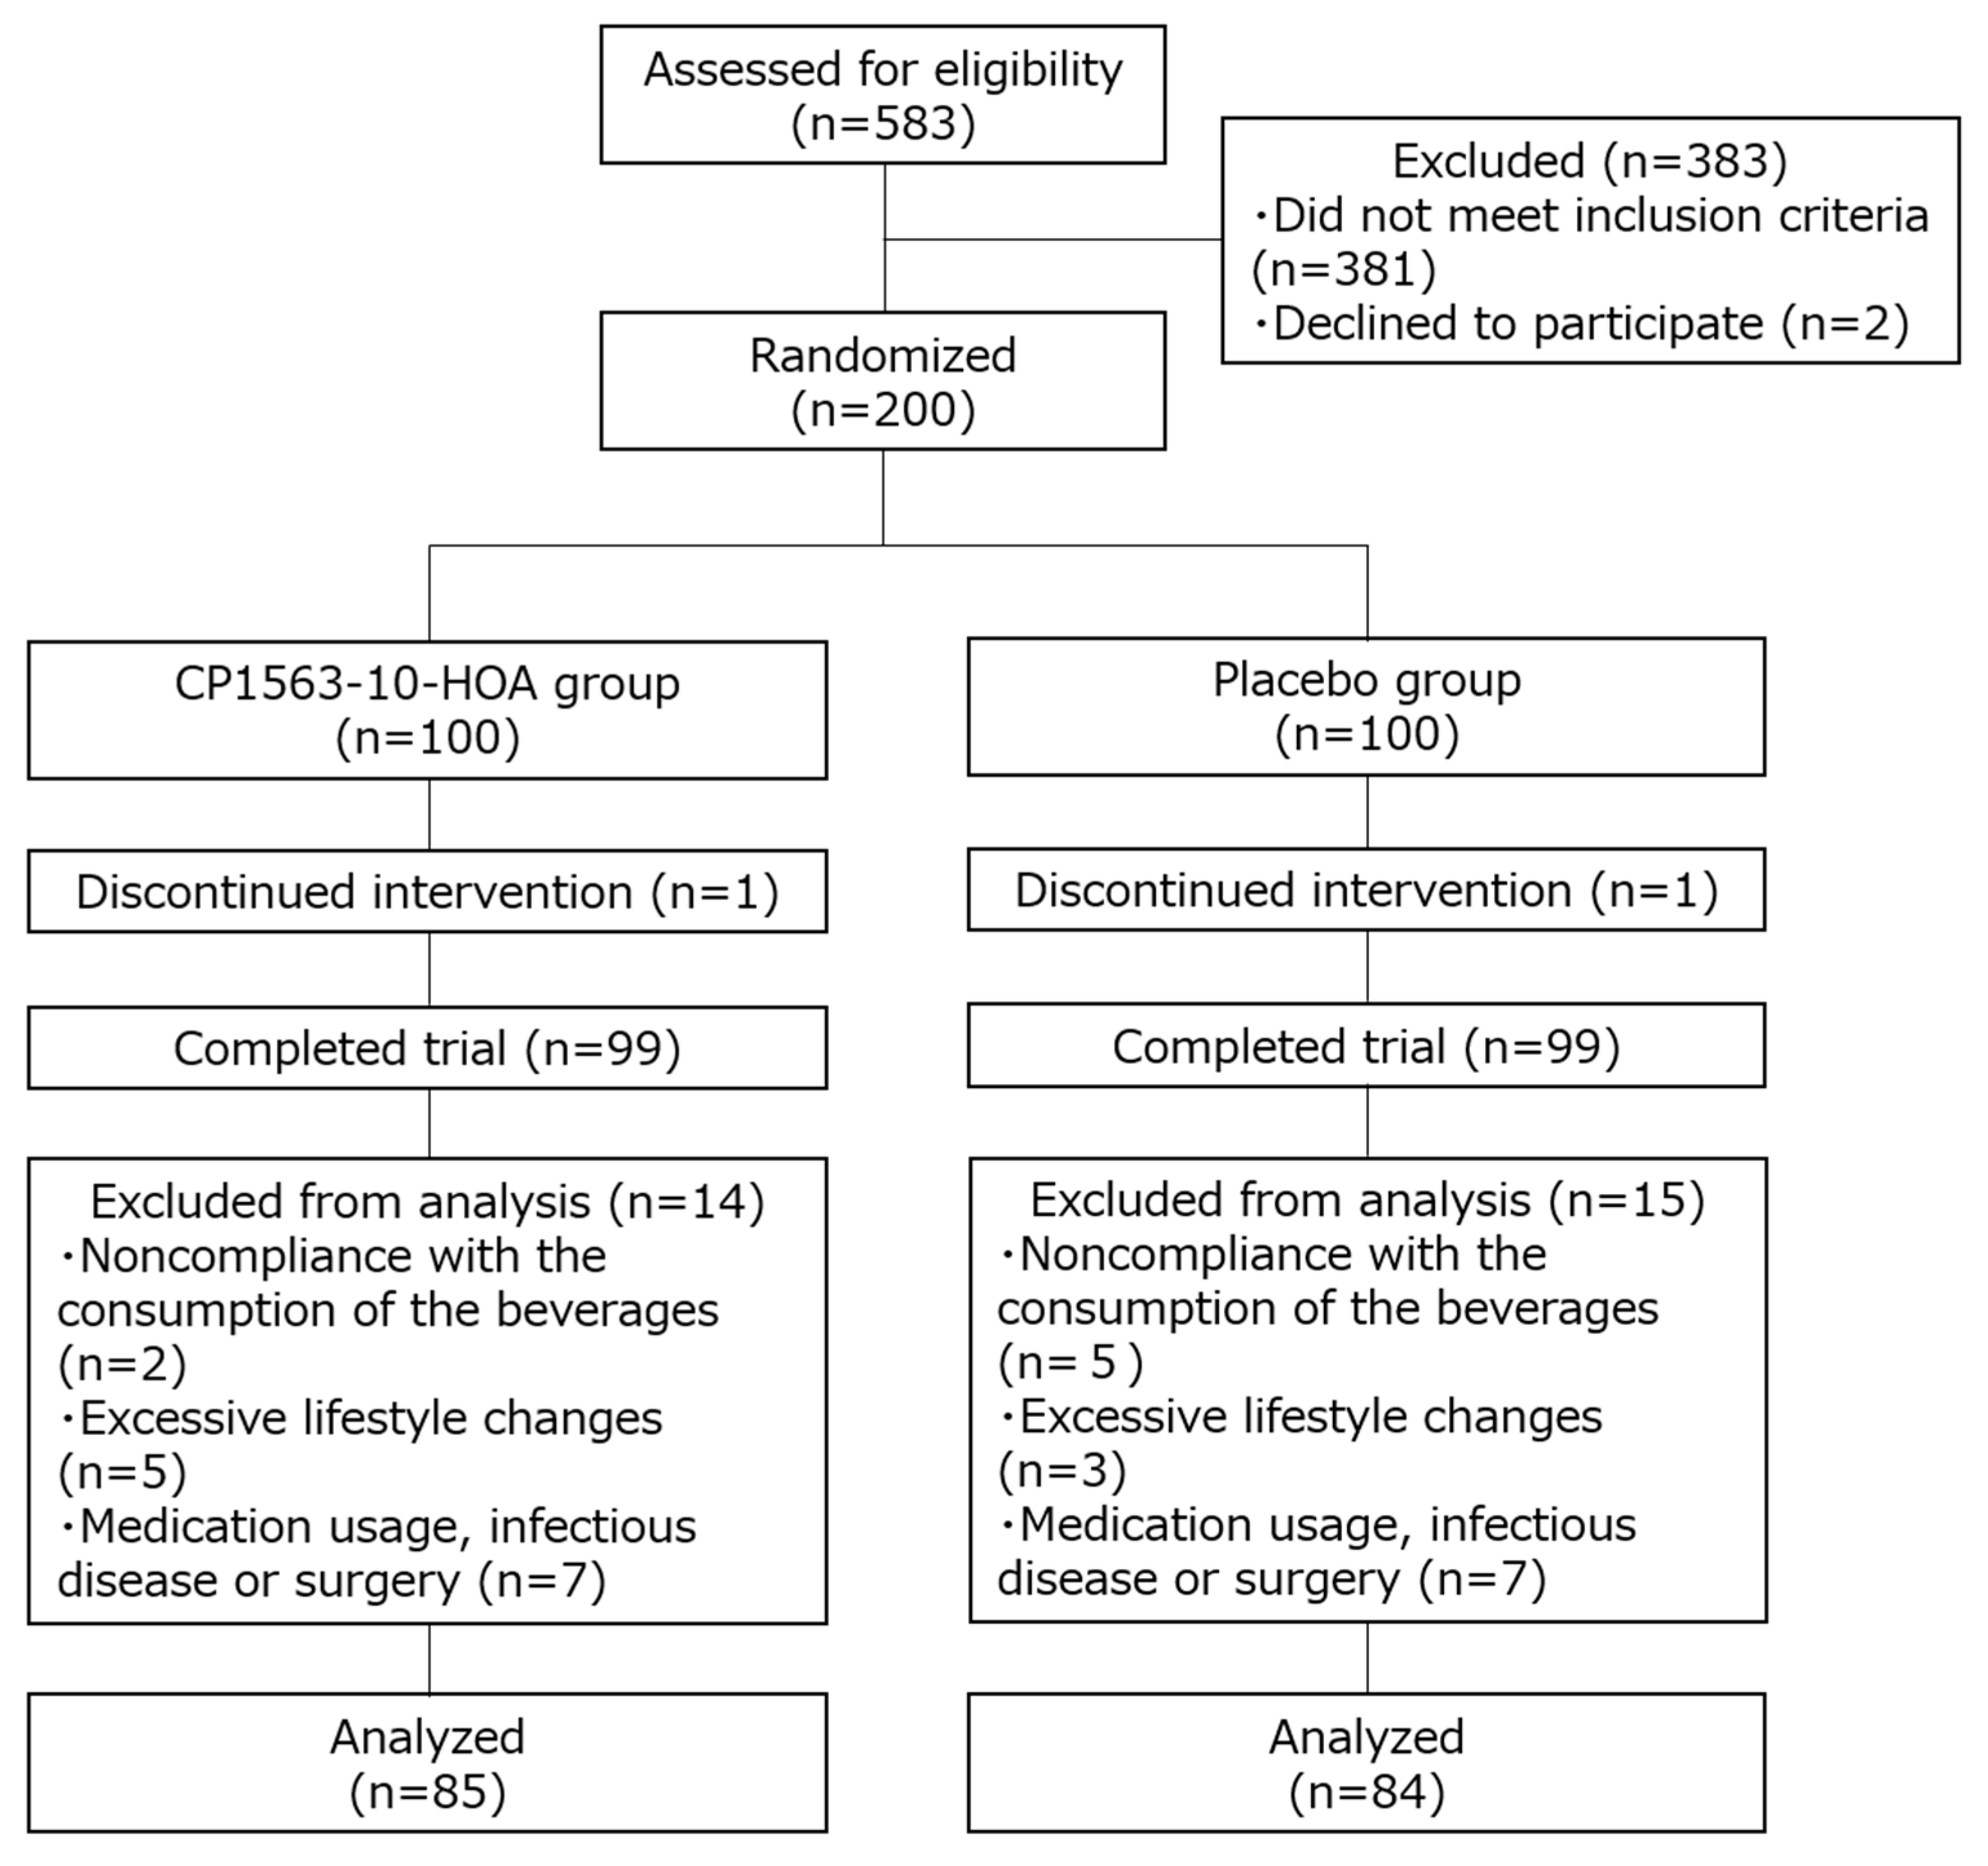
2.3. Subjects
2.4. Supplementary Beverages
2.5. Study Design
2.6. Measurement
2.7. Analysis of Fecal Microbiota
2.8. Measurement of Fecal Short Chain Fatty Acids (SCFAs)
2.9. Statistical Analysis
3. Results
3.1. Characteristics of the Subjects
3.2. Dietary Nutritional Content and Physical Activity During the Study Period
3.3. Effects of Fragmented CP1563 on Abdominal Fat Area, Body Weight, and BMI
3.4. Effect of Fragmented CP1563 on Fecal Microbiota and Fecal SCFAs
4. Discussion
Supplementary Materials
Author Contributions
Funding
Acknowledgments
Conflicts of Interest
References
- Mathieu, P.; Pibarot, P.; Despres, J.P. Metabolic syndrome: The danger signal in atherosclerosis. Vasc. Health Risk Manag. 2006, 2, 285–302. [Google Scholar] [CrossRef] [PubMed] [Green Version]
- Sharma, A.M.; Chetty, V.T. Obesity, hypertension and insulin resistance. Acta Diabetol. 2005, 42, S3–S8. [Google Scholar] [CrossRef]
- Simopoulos, A.P. Dietary omega-3 fatty acid deficiency and high fructose intake in the development of metabolic syndrome, brain metabolic abnormalities, and non-alcoholic fatty liver disease. Nutrients 2013, 5, 2901–2923. [Google Scholar] [CrossRef] [PubMed] [Green Version]
- Wu, G.D.; Chen, J.; Hoffmann, C.; Bittinger, K.; Chen, Y.-Y.; Keilbaugh, S.A.; Bewtra, M.; Knights, D.; Walters, W.A.; Knight, R.; et al. Linking long-term dietary patterns with gut microbial enterotypes. Sciences 2011, 334, 105–108. [Google Scholar] [CrossRef] [PubMed] [Green Version]
- Shen, T.D. Diet and Gut Microbiota in Health and Disease. Nestle Nutr. Inst. Workshop Ser. 2017, 88, 117–126. [Google Scholar] [CrossRef] [PubMed] [Green Version]
- Turnbaugh, P.J.; Backhed, F.; Fulton, L.; Gordon, J.I. Diet-induced obesity is linked to marked but reversible alterations in the mouse distal gut microbiome. Cell Host Microbe 2008, 3, 213–223. [Google Scholar] [CrossRef] [PubMed] [Green Version]
- Turnbaugh, P.J.; Ridaura, V.K.; Faith, J.J.; Rey, F.E.; Knight, R.; Gordon, J.I. The effect of diet on the human gut microbiome: A metagenomic analysis in humanized gnotobiotic mice. Sci. Transl. Med. 2009, 1. [Google Scholar] [CrossRef] [Green Version]
- Cani, P.D.; Bibiloni, R.; Knauf, C.; Waget, A.; Neyrinck, A.M.; Delzenne, N.M.; Burcelin, R. Changes in gut microbiota control metabolic endotoxemia-induced inflammation in high-fat diet-induced obesity and diabetes in mice. Diabetes 2008, 57, 1470–1481. [Google Scholar] [CrossRef] [Green Version]
- De La Serre, C.B.; Ellis, C.L.; Lee, J.; Hartman, A.L.; Rutledge, J.C.; Raybould, H.E. Propensity to high-fat diet-induced obesity in rats is associated with changes in the gut microbiota and gut inflammation. Am. J. Physiol. Gastrointest. Liver Physiol. 2010, 299, G440–G448. [Google Scholar] [CrossRef]
- Ding, S.; Chi, M.M.; Scull, B.P.; Rigby, R.; Schwerbrock, N.M.; Magness, S.; Jobin, C.; Lund, P.K. High-fat diet: Bacteria interactions promote intestinal inflammation which precedes and correlates with obesity and insulin resistance in mouse. PLoS ONE 2010, 5, e12191. [Google Scholar] [CrossRef] [Green Version]
- Morimoto-Kobayashi, Y.; Ohara, K.; Ashigai, H.; Kanaya, T.; Koizumi, K.; Manabe, F.; Kaneko, Y.; Taniguchi, Y.; Katayama, M.; Kowatari, Y.; et al. Matured hop extract reduces body fat in healthy overweight humans: A randomized, double-blind, placebo-controlled parallel group study. Nutr. J. 2016, 15, 25. [Google Scholar] [CrossRef] [PubMed] [Green Version]
- Racine, N.M.; Watras, A.C.; Carrel, A.L.; Allen, D.B.; McVean, J.J.; Clark, R.R.; O’Brien, A.R.; O’Shea, M.; Scott, C.E.; Schoeller, D.A. Effect of conjugated linoleic acid on body fat accretion in overweight or obese children. Am. J. Clin. Nutr. 2010, 91, 1157–1164. [Google Scholar] [CrossRef] [PubMed] [Green Version]
- Snitker, S.; Fujishima, Y.; Shen, H.; Ott, S.; Pi-Sunyer, X.; Furuhata, Y.; Sato, H.; Takahashi, M. Effects of novel capsinoid treatment on fatness and energy metabolism in humans: Possible pharmacogenetic implications. Am. J. Clin. Nutr. 2009, 89, 45–50. [Google Scholar] [CrossRef] [PubMed] [Green Version]
- Kadooka, Y.; Sato, M.; Imaizumi, K.; Ogawa, A.; Ikuyama, K.; Akai, Y.; Okano, M.; Kagoshima, M.; Tsuchida, T. Regulation of abdominal adiposity by probiotics (Lactobacillus gasseri SBT2055) in adults with obese tendencies in a randomized controlled trial. Eur. J. Clin. Nutr. 2010, 64, 636–643. [Google Scholar] [CrossRef] [Green Version]
- Minami, J.; Iwabuchi, N.; Tanaka, M.; Yamauchi, K.; Xiao, J.Z.; Abe, F.; Sakane, N. Effects of Bifidobacterium breve B-3 on body fat reductions in pre-obese adults: A randomized, double-blind, placebo-controlled trial. Biosci. Microbiota Food Health 2018, 37, 67–75. [Google Scholar] [CrossRef] [Green Version]
- O’Toole, P.W.; Cooney, J.C. Probiotic bacteria influence the composition and function of the intestinal microbiota. Interdiscip. Perspect. Infect. Dis. 2008, 2008, 175285. [Google Scholar] [CrossRef] [Green Version]
- Takahashi, S.; Anzawa, D.; Takami, K.; Ishizuka, A.; Mawatari, T.; Kamikado, K.; Sugimura, H.; Nishijima, T. Effect of Bifidobacterium Animalis ssp. lactis GCL2505 on visceral fat accumulation in healthy Japanese adults: A randomized controlled trial. Biosci. Microbiota Food Health 2016, 35, 163–171. [Google Scholar] [CrossRef] [Green Version]
- Food and Agriculture Organization of the United Nations/World Health Organization (FAO/WHO). Guidelines for the Evaluation of Probiotics in Food. In Joint FAO/WHO Working Group on Drafting Guidelines for the Evaluation of Probiotics in Food; WHO: London, UK, 2002. [Google Scholar]
- Bagarolli, R.A.; Tobar, N.; Oliveira, A.G.; Araujo, T.G.; Carvalho, B.M.; Rocha, G.Z.; Vecina, J.F.; Calisto, K.; Guadagnini, D.; Prada, P.O.; et al. Probiotics modulate gut microbiota and improve insulin sensitivity in DIO mice. J. Nutr. Biochem. 2017, 50, 16–25. [Google Scholar] [CrossRef] [Green Version]
- Murphy, E.F.; Cotter, P.D.; Hogan, A.; O’Sullivan, O.; Joyce, A.; Fouhy, F.; Clarke, S.F.; Marques, T.M.; O’Toole, P.W.; Stanton, C.; et al. Divergent metabolic outcomes arising from targeted manipulation of the gut microbiota in diet-induced obesity. Gut 2013, 62, 220–226. [Google Scholar] [CrossRef]
- Deshpande, G.; Athalye-Jape, G.; Patole, S. Para-probiotics for Preterm Neonates—The Next Frontier. Nutrients 2018, 10, 871. [Google Scholar] [CrossRef] [Green Version]
- Taverniti, V.; Guglielmetti, S. The immunomodulatory properties of probiotic microorganisms beyond their viability (ghost probiotics: Proposal of paraprobiotic concept). Genes Nutr. 2011, 6, 261–274. [Google Scholar] [CrossRef] [PubMed] [Green Version]
- Murata, M.; Kondo, J.; Iwabuchi, N.; Takahashi, S.; Yamauchi, K.; Abe, F.; Miura, K. Effects of paraprobiotic Lactobacillus paracasei MCC1849 supplementation on symptoms of the common cold and mood states in healthy adults. Benef. Microbes 2018, 9, 855–864. [Google Scholar] [CrossRef] [PubMed]
- Nishibayashi, R.; Inoue, R.; Harada, Y.; Watanabe, T.; Makioka, Y.; Ushida, K. RNA of Enterococcus faecalis Strain EC-12 Is a Major Component Inducing Interleukin-12 Production from Human Monocytic Cells. PLoS ONE 2015, 10, e0129806. [Google Scholar] [CrossRef] [PubMed]
- Higashikawa, F.; Noda, M.; Awaya, T.; Danshiitsoodol, N.; Matoba, Y.; Kumagai, T.; Sugiyama, M. Antiobesity effect of Pediococcus pentosaceus LP28 on overweight subjects: A randomized, double-blind, placebo-controlled clinical trial. Eur. J. Clin. Nutr. 2016, 70, 582–587. [Google Scholar] [CrossRef] [PubMed]
- Hsieh, M.C.; Tsai, W.H.; Jheng, Y.P.; Su, S.L.; Wang, S.Y.; Lin, C.C.; Chen, Y.H.; Chang, W.W. The beneficial effects of Lactobacillus reuteri ADR-1 or ADR-3 consumption on type 2 diabetes mellitus: A randomized, double-blinded, placebo-controlled trial. Sci. Rep. 2018, 8, 16791. [Google Scholar] [CrossRef] [PubMed]
- Pedret, A.; Valls, R.M.; Calderon-Perez, L.; Llaurado, E.; Companys, J.; Pla-Paga, L.; Moragas, A.; Martin-Lujan, F.; Ortega, Y.; Giralt, M.; et al. Effects of daily consumption of the probiotic Bifidobacterium animalis subsp. lactis CECT 8145 on anthropometric adiposity biomarkers in abdominally obese subjects: A randomized controlled trial. Int. J. Obes. 2019, 43, 1863–1868. [Google Scholar] [CrossRef] [Green Version]
- Nakamura, F.; Ishida, Y.; Sawada, D.; Ashida, N.; Sugawara, T.; Sakai, M.; Goto, T.; Kawada, T.; Fujiwara, S. Fragmented Lactic Acid Bacterial Cells Activate Peroxisome Proliferator-Activated Receptors and Ameliorate Dyslipidemia in Obese Mice. J. Agric. Food Chem. 2016, 64, 2549–2559. [Google Scholar] [CrossRef]
- Evans, R.M.; Barish, G.D.; Wang, Y.X. PPARs and the complex journey to obesity. Nat. Med. 2004, 10, 355–361. [Google Scholar] [CrossRef]
- Nakamura, F.; Ishida, Y.; Aihara, K.; Sawada, D.; Ashida, N.; Sugawara, T.; Aoki, Y.; Takehara, I.; Takano, K.; Fujiwara, S. Effect of fragmented Lactobacillus amylovorus CP1563 on lipid metabolism in overweight and mildly obese individuals: A randomized controlled trial. Microb. Ecol. Health Dis. 2016, 27, 30312. [Google Scholar] [CrossRef] [Green Version]
- Aoki, Y.; Sugawara, T.; Yanagihara, S.; Goto, T.; Kawada, T.; Fujiwara, S.; Sawada, D. 10-Hydroxyoctadecanoic Acid from Lactobacillus amylovorus CP1563 Activates PPARα and Improves Dyslipidemia. Pharmacometrics 2018, 95, 73–82. [Google Scholar]
- Faul, F.; Erdfelder, E.; Lang, A.-G.; Buchner, A. G*Power 3: A flexible statistical power analysis program for the social, behavioral, and biomedical sciences. Behav. Res. Methods 2007, 39, 175–191. [Google Scholar] [CrossRef] [PubMed]
- World Health Organization. Obesity: Preventing and Managing the Global Epidemic. Report of a WHO Consultation; World Health Organization Technical Report Series; World Health Organization: Geneva, Switzerland, 2000; Volume 894, pp. 1–253. [Google Scholar]
- Hatanaka, M.; Yamamoto, K.; Suzuki, N.; Iio, S.; Takara, T.; Morita, H.; Takimoto, T.; Nakamura, T. Effect of Bacillus subtilis C-3102 on loose stools in healthy volunteers. Benef. Microbes 2018, 9, 357–365. [Google Scholar] [CrossRef] [PubMed]
- Imoto, N.; Morita, H.; Amanuma, F.; Maruyama, H.; Watanabe, S.; Hashiguchi, N. Maternal antimicrobial use at delivery has a stronger impact than mode of delivery on bifidobacterial colonization in infants: A pilot study. J. Perinatol. 2018, 38, 1174–1181. [Google Scholar] [CrossRef] [PubMed] [Green Version]
- Sawada, D.; Kuwano, Y.; Tanaka, H.; Hara, S.; Uchiyama, Y.; Sugawara, T.; Fujiwara, S.; Rokutan, K.; Nishida, K. Daily intake of Lactobacillus gasseri CP2305 relieves fatigue and stress-related symptoms in male university Ekiden runners: A double-blind, randomized, and placebo-controlled clinical trial. J. Funct. Foods 2019, 57, 465–476. [Google Scholar] [CrossRef]
- Caporaso, J.G.; Kuczynski, J.; Stombaugh, J.; Bittinger, K.; Bushman, F.D.; Costello, E.K.; Fierer, N.; Pena, A.G.; Goodrich, J.K.; Gordon, J.I.; et al. QIIME allows analysis of high-throughput community sequencing data. Nat. Methods 2010, 7, 335–336. [Google Scholar] [CrossRef] [Green Version]
- The Greengenes Reference Database. Available online: https://greengenes.secondgenome.com/ (accessed on 15 January 2020).
- Ikeda, N.; Saito, Y.; Shimizu, J.; Ochi, A.; Mizutani, J.; Watabe, J. Variations in concentrations of bacterial metabolites, enzyme activities, moisture, pH and bacterial composition between and within individuals in faeces of seven healthy adults. J. Appl. Bacteriol. 1994, 77, 185–194. [Google Scholar] [CrossRef] [PubMed]
- Storey, J.D. A direct approach to false discovery rates. J. R. Stat. Soc. Ser. B 2002, 64, 479–498. [Google Scholar] [CrossRef] [Green Version]
- Duncan, S.H.; Louis, P.; Flint, H.J. Lactate-utilizing bacteria, isolated from human feces, that produce butyrate as a major fermentation product. Appl. Environ. Microbiol. 2004, 70, 5810–5817. [Google Scholar] [CrossRef] [Green Version]
- Pryde, S.E.; Duncan, S.H.; Hold, G.L.; Stewart, C.S.; Flint, H.J. The microbiology of butyrate formation in the human colon. FEMS Microbiol. Lett. 2002, 217, 133–139. [Google Scholar] [CrossRef]
- Ley, R.E.; Turnbaugh, P.J.; Klein, S.; Gordon, J.I. Microbial ecology: Human gut microbes associated with obesity. Nature 2006, 444, 1022–1023. [Google Scholar] [CrossRef]
- Brown, A.J.; Goldsworthy, S.M.; Barnes, A.A.; Eilert, M.M.; Tcheang, L.; Daniels, D.; Muir, A.I.; Wigglesworth, M.J.; Kinghorn, I.; Fraser, N.J.; et al. The Orphan G protein-coupled receptors GPR41 and GPR43 are activated by propionate and other short chain carboxylic acids. J. Biol. Chem. 2003, 278, 11312–11319. [Google Scholar] [CrossRef] [PubMed] [Green Version]
- Le Poul, E.; Loison, C.; Struyf, S.; Springael, J.Y.; Lannoy, V.; Decobecq, M.E.; Brezillon, S.; Dupriez, V.; Vassart, G.; Van Damme, J.; et al. Functional characterization of human receptors for short chain fatty acids and their role in polymorphonuclear cell activation. J. Biol. Chem. 2003, 278, 25481–25489. [Google Scholar] [CrossRef] [PubMed] [Green Version]
- Inoue, D.; Kimura, I.; Wakabayashi, M.; Tsumoto, H.; Ozawa, K.; Hara, T.; Takei, Y.; Hirasawa, A.; Ishihama, Y.; Tsujimoto, G. Short-chain fatty acid receptor GPR41-mediated activation of sympathetic neurons involves synapsin 2b phosphorylation. FEBS Lett. 2012, 586, 1547–1554. [Google Scholar] [CrossRef] [PubMed] [Green Version]
- Tazoe, H.; Otomo, Y.; Karaki, S.; Kato, I.; Fukami, Y.; Terasaki, M.; Kuwahara, A. Expression of short-chain fatty acid receptor GPR41 in the human colon. Biomed. Res. 2009, 30, 149–156. [Google Scholar] [CrossRef] [PubMed] [Green Version]
- Kimura, I.; Inoue, D.; Hirano, K.; Tsujimoto, G. The SCFA Receptor GPR43 and Energy Metabolism. Front. Endocrinol. 2014, 5, 85. [Google Scholar] [CrossRef] [PubMed] [Green Version]
- Furusawa, Y.; Obata, Y.; Fukuda, S.; Endo, T.A.; Nakato, G.; Takahashi, D.; Nakanishi, Y.; Uetake, C.; Kato, K.; Kato, T.; et al. Commensal microbe-derived butyrate induces the differentiation of colonic regulatory T cells. Nature 2013, 504, 446–450. [Google Scholar] [CrossRef] [PubMed]
- Lumeng, C.N.; Saltiel, A.R. Inflammatory links between obesity and metabolic disease. J. Clin. Investig. 2011, 121, 2111–2117. [Google Scholar] [CrossRef] [Green Version]
- Saltiel, A.R.; Olefsky, J.M. Inflammatory mechanisms linking obesity and metabolic disease. J. Clin. Investig. 2017, 127, 1–4. [Google Scholar] [CrossRef]
- Bergman, E.N. Energy contributions of volatile fatty acids from the gastrointestinal tract in various species. Physiol. Rev. 1990, 70, 567–590. [Google Scholar] [CrossRef] [Green Version]
- Roediger, W.E. Role of anaerobic bacteria in the metabolic welfare of the colonic mucosa in man. Gut 1980, 21, 793–798. [Google Scholar] [CrossRef] [Green Version]
- Nakatani, M.; Inoue, R.; Tomonaga, S.; Fukuta, K.; Tsukahara, T. Production, Absorption, and Blood Flow Dynamics of Short-Chain Fatty Acids Produced by Fermentation in Piglet Hindgut during the Suckling(-)Weaning Period. Nutrients 2018, 10, 1220. [Google Scholar] [CrossRef] [PubMed] [Green Version]
- Kristensen, N.B.; Danfaer, A.; Agergaard, N. Absorption and metabolism of short-chain fatty acids in ruminants. Arch. Tierernahr. 1998, 51, 165–175. [Google Scholar] [CrossRef] [PubMed]
- Larsen, N.; Vogensen, F.K.; van den Berg, F.W.; Nielsen, D.S.; Andreasen, A.S.; Pedersen, B.K.; Al-Soud, W.A.; Sorensen, S.J.; Hansen, L.H.; Jakobsen, M. Gut microbiota in human adults with type 2 diabetes differs from non-diabetic adults. PLoS ONE 2010, 5, e9085. [Google Scholar] [CrossRef] [PubMed]
- Qin, J.; Li, Y.; Cai, Z.; Li, S.; Zhu, J.; Zhang, F.; Liang, S.; Zhang, W.; Guan, Y.; Shen, D.; et al. A metagenome-wide association study of gut microbiota in type 2 diabetes. Nature 2012, 490, 55–60. [Google Scholar] [CrossRef]
- Lambeth, S.M.; Carson, T.; Lowe, J.; Ramaraj, T.; Leff, J.W.; Luo, L.; Bell, C.J.; Shah, V.O. Composition, Diversity and Abundance of Gut Microbiome in Prediabetes and Type 2 Diabetes. J. Diabetes Obes. 2015, 2, 1–7. [Google Scholar] [CrossRef] [Green Version]
- Frost, F.; Storck, L.J.; Kacprowski, T.; Gartner, S.; Ruhlemann, M.; Bang, C.; Franke, A.; Volker, U.; Aghdassi, A.A.; Steveling, A.; et al. A structured weight loss program increases gut microbiota phylogenetic diversity and reduces levels of Collinsella in obese type 2 diabetics: A pilot study. PLoS ONE 2019, 14, e0219489. [Google Scholar] [CrossRef] [Green Version]
- Laserna-Mendieta, E.J.; Clooney, A.G.; Carretero-Gomez, J.F.; Moran, C.; Sheehan, D.; Nolan, J.A.; Hill, C.; Gahan, C.G.M.; Joyce, S.A.; Shanahan, F.; et al. Determinants of Reduced Genetic Capacity for Butyrate Synthesis by the Gut Microbiome in Crohn’s Disease and Ulcerative Colitis. J. Crohn’s Colitis 2018, 12, 204–216. [Google Scholar] [CrossRef]


| Parameters | CP1563-10-HOA Group | Placebo Group | p Value |
|---|---|---|---|
| Age (years) | 43.6 ± 1.3 | 41.7 ± 1.5 | 0.34 |
| Sex (male/female) | 38/47 | 41/43 | 0.59 |
| Height (cm) | 163.5 ± 0.9 | 165.7 ± 1.0 | 0.10 |
| Body weight (kg) | 72.5 ± 0.9 | 74.5 ± 1.0 | 0.14 |
| Body mass index (BMI) (kg/m2) | 27.0 ± 0.2 | 27.1 ± 0.2 | 0.86 |
| Abdominal total fat area (cm2) | 335.0 ± 6.7 | 340.1± 6.3 | 0.58 |
| Abdominal visceral fat area (cm2) | 92.0 ± 3.5 | 90.8 ± 3.7 | 0.81 |
| Abdominal subcutaneous fat area (cm2) | 243.0 ± 6.5 | 249.3 ± 6.4 | 0.48 |
| Body fat percentage (%) | 34.2 ± 0.7 | 33.9 ± 0.7 | 0.79 |
| Waist circumference (cm) | 91.1 ± 0.7 | 91.4 ± 0.7 | 0.74 |
| Parameters | Treatment | Values | |||
|---|---|---|---|---|---|
| 0 Weeks | 4 Weeks | 8 Weeks | 12 Weeks | ||
| Calories (kcal/day) | CP1563-10-HOA | 1748.8 ± 49.6 | 1691.7 ± 53.6 | 1669.8 ± 56.4 | 1624.9 ± 63.7 |
| Placebo | 1652.9 ± 54.1 | 1644.5 ± 57.2 | 1583.3 ± 56.4 | 1651.6 ± 60.9 | |
| p value (vs. placebo) | 0.19 | 0.55 | 0.28 | 0.76 | |
| Protein (g/day) | CP1563-10-HOA | 66.5 ± 2.2 | 66.7 ± 2.7 | 62.8 ± 2.1 | 63.5 ± 3.0 |
| Placebo | 62.5 ± 2.3 | 63.1 ± 2.4 | 58.7 ± 2.6 | 68.0 ± 7.0 | |
| p value (vs. placebo) | 0.21 | 0.32 | 0.21 | 0.56 | |
| Fat (g/day) | CP1563-10-HOA | 62.4 ± 2.1 | 57.9 ± 2.3 | 59.4 ± 2.3 | 56.4 ± 2.5 |
| Placebo | 59.2 ± 2.6 | 57.8 ± 2.5 | 56.9 ± 2.4 | 60.7 ± 2.7 | |
| p value (vs. placebo) | 0.34 | 0.98 | 0.44 | 0.25 | |
| Carbohydrate (g/day) | CP1563-10-HOA | 218.9 ± 7.2 | 219.3 ± 8.6 | 210.9 ± 8.5 | 206.4 ± 8.4 |
| Placebo | 212.0 ± 7.9 | 218.1 ± 8.1 | 204.0 ± 8.2 | 207.5 ± 8.2 | |
| p value (vs. placebo) | 0.52 | 0.92 | 0.56 | 0.93 | |
| Salt (g/day) | CP1563-10-HOA | 9.1 ± 0.3 | 8.4 ± 0.4 | 9.0 ± 0.4 | 8.2 ± 0.4 |
| Placebo | 8.1 ± 0.3 | 8.2 ± 0.3 | 9.1 ± 0.4 | 8.3 ± 0.3 | |
| p value (vs. placebo) | 0.03 | 0.66 | 0.77 | 0.88 | |
| Steps (counts/day) | CP1563-10-HOA | 6025.9 ± 315.0 | 5551.9 ± 299.8 | 5833.0 ± 338.2 | 6414.5 ± 498.2 |
| Placebo | 5979.6 ± 330.4 | 6691.7 ± 839.6 | 6957.9 ± 906.6 | 7270.5 ± 866.1 | |
| p value (vs. placebo) | 0.92 | 0.20 | 0.24 | 0.39 | |
| Genus | Compositional Change (%) | p Value | q Value | |
|---|---|---|---|---|
| CP1563-10-HOA | Placebo | |||
| Blautia | −2.1 ± 1.2 | −0.8 ± 1.0 | 0.39 | 0.45 |
| Bifidobacterium | −0.0 ± 1.2 | 1.3 ± 1.3 | 0.44 | 0.45 |
| Faecalibacterium | 0.8 ± 1.1 | 2.0 ± 1.1 | 0.45 | 0.45 |
| Coprococcus | −1.1 ± 0.6 | −1.3 ± 0.7 | 0.80 | 0.57 |
| Lachnospiraceae;g_[Ruminococcus] | −0.7 ± 0.5 | −1.3 ± 0.6 | 0.43 | 0.45 |
| Lachnospiraceae;g | 1.0 ± 0.4 | −0.6 ± 0.5 | 0.01 | 0.047 |
| Roseburia | 0.8 ± 0.7 | −1.4 ± 0.6 | 0.01 | 0.047 |
| Bacteroides | 1.5 ± 1.3 | 2.3 ± 1.0 | 0.64 | 0.53 |
| Streptococcus | −0.8 ± 0.5 | 0.2 ± 0.6 | 0.21 | 0.37 |
| Ruminococcus | 0.4 ± 0.4 | −0.3 ± 0.3 | 0.22 | 0.37 |
| Dorea | −0.1 ± 0.2 | −0.2 ± 0.2 | 0.88 | 0.59 |
| Erysipelotrichaceae;g_[Eubacterium] | −0.0 ± 0.2 | −0.1 ± 0.2 | 0.80 | 0.57 |
| Lachnospiraceae;Other | 0.1 ± 0.1 | 0.0 ± 0.1 | 0.62 | 0.53 |
| Butyricicoccus | 0.0 ± 1.1 | −0.4 ± 0.1 | 0.046 | 0.12 |
| Collinsella | −0.3 ± 0.1 | 0.2 ± 0.1 | 0.003 | 0.03 |
| SCFAs | Change in the Concentration (mg g−1 Feces) | p Value | |
|---|---|---|---|
| CP1563-10-HOA | Placebo | ||
| Acetic acid | 7.9 ± 2.1 | 4.7 ± 1.7 | 0.23 |
| Propionic acid | 2.4 ± 0.8 | 1.0 ± 0.8 | 0.22 |
| n-Butyric acid | 0.8 ± 0.8 | 1.1 ± 0.7 | 0.78 |
| iso-Butyric acid | 0.5 ± 0.1 | 0.2 ± 0.1 | 0.10 |
| n-Valeric acid | 0.2 ± 0.1 | 0.3 ± 0.2 | 0.72 |
| iso-Valeric acid | 0.2 ± 0.2 | 0.4 ± 0.2 | 0.39 |
© 2020 by the authors. Licensee MDPI, Basel, Switzerland. This article is an open access article distributed under the terms and conditions of the Creative Commons Attribution (CC BY) license (http://creativecommons.org/licenses/by/4.0/).
Share and Cite
Sugawara, T.; Sawada, D.; Yanagihara, S.; Aoki, Y.; Takehara, I.; Sugahara, H.; Hirota, T.; Nakamura, Y.; Ishikawa, S. Daily Intake of Paraprobiotic Lactobacillus amylovorus CP1563 Improves Pre-Obese Conditions and Affects the Gut Microbial Community in Healthy Pre-Obese Subjects: A Double-Blind, Randomized, Placebo-Controlled Study. Microorganisms 2020, 8, 304. https://doi.org/10.3390/microorganisms8020304
Sugawara T, Sawada D, Yanagihara S, Aoki Y, Takehara I, Sugahara H, Hirota T, Nakamura Y, Ishikawa S. Daily Intake of Paraprobiotic Lactobacillus amylovorus CP1563 Improves Pre-Obese Conditions and Affects the Gut Microbial Community in Healthy Pre-Obese Subjects: A Double-Blind, Randomized, Placebo-Controlled Study. Microorganisms. 2020; 8(2):304. https://doi.org/10.3390/microorganisms8020304
Chicago/Turabian StyleSugawara, Tomonori, Daisuke Sawada, Sae Yanagihara, Yumeko Aoki, Isao Takehara, Hirosuke Sugahara, Tatsuhiko Hirota, Yasunori Nakamura, and Susumu Ishikawa. 2020. "Daily Intake of Paraprobiotic Lactobacillus amylovorus CP1563 Improves Pre-Obese Conditions and Affects the Gut Microbial Community in Healthy Pre-Obese Subjects: A Double-Blind, Randomized, Placebo-Controlled Study" Microorganisms 8, no. 2: 304. https://doi.org/10.3390/microorganisms8020304