Article

The Potential of Digested Sludge-Assimilating Microflora for Biogas Production from Food Processing Wastes

1
Department of Chemistry and Life Science, School of Advanced Engineering, Kogakuin University, 2665-1 Nakano-cho, Hachioji 1920015, Tokyo, Japan
2
Applied Chemistry and Chemical Engineering Program, Graduate School of Engineering, Kogakuin University, 2665-1 Nakano-cho, Hachioji 1920015, Tokyo, Japan
*
Author to whom correspondence should be addressed.
Microorganisms 2023, 11(9), 2321; https://doi.org/10.3390/microorganisms11092321
Submission received: 29 July 2023 / Revised: 31 August 2023 / Accepted: 13 September 2023 / Published: 15 September 2023
(This article belongs to the Special Issue Anaerobic Digestion 2.0)

Abstract

:
Food processing wastes (FPWs) are residues generated in food manufacturing, and their composition varies depending on the type of food product being manufactured. Therefore, selecting and acclimatizing seed microflora during the initiation of biogas production is crucial for optimal outcomes. The present study examined the biogas production capabilities of digested sludge-assimilating and biogas-yielding soil (DABYS) and enteric (DABYE) microflorae when used as seed cultures for biogas production from FPWs. After subculturing and feeding these microbial seeds with various FPWs, we assessed their biogas-producing abilities. The subcultures produced biogas from many FPWs, except orange peel, suggesting that the heterogeneity of the bacterial members in the seed microflora facilitates quick adaptation to FPWs. Microflorae fed with animal-derived FPWs contained several methanogenic archaeal families and produced methane. In contrast, microflorae fed with vegetable-, fruit-, and crop-derived FPWs generated hydrogen, and methanogenic archaeal populations were diminished by repeated subculturing. The subcultured microflorae appear to hydrolyze carbohydrates and protein in FPWs using cellulase, pectinase, or protease. Despite needing enhancements in biogas yield for future industrial scale-up, the DABYS and DABYE microflorae demonstrate robust adaptability to various FPWs.

1. Introduction

Food waste represents the unnecessary biomass generated from the consumption of food in both households and industries. In 2019, 931 million tons of food waste were produced worldwide [1]. Of this, 86% is considered food garbage, a mixture of leftovers generated from households, restaurants, and retail stores [2]. The garbage is mainly composed of soluble sugars, starch, lipids, and proteins [3] and serves as a substrate for anaerobic digestion, a process that significantly reduces food waste volume and produces biogas [4]. Technologies for the anaerobic digestion of food garbage combined with physicochemical pretreatments have been extensively studied [5].
The remaining 14% of food waste is food processing wastes (FPWs), which are mainly composed of inedible parts generated during food manufacturing [2]. In developed countries, such as Japan and the United States, food manufacturers have managed to recycle approximately 95% of FPWs by using them as raw materials for composting or as animal feeds [6,7]. However, the number of farms is steadily declining in many countries [8], which suggests that this recycling rate may soon drop. Thus, novel uses for FPWs must be developed.
Anaerobic digestion is a bioprocess employed to break down organic waste, including garbage, sludge, and manure, and produces biogas—a renewable alternative to natural gas. This process involves sequential steps: hydrolysis, acidogenesis, acetogenesis, and methanogenesis, executed by a diverse group of hydrolase-producing bacteria, acidogens, acetogens, and methanogenic archaea, respectively [9]. Because anaerobic digestion can be employed to process a wide range of biomass wastes, it has received attention from the food industry regarding the recycling of FPWs for energy production, aiming to achieve zero emissions [10].
However, the technological approaches to anaerobically digesting FPWs are still in their nascent stages, with different challenges to those for food garbage. For instance, the rapid conversion of FPWs can lead to an overproduction of volatile fatty acids, resulting in increasing acid levels [11]. Additionally, the high protein content in FPWs leads to the accumulation of ammonia and hydrogen sulfide, making the digestion process unstable [11]. The composition of FPWs varies depending on the type of food product being manufactured. Thus, seed microflora used in the start-up of digesters should be specifically selected and acclimatized to ensure the successful digestion of FPWs [12]. Unlike food garbage, which generally consists of easily digestible materials such as starch, lipid, and protein, as described above, the major components of FPWs are cellulose, hemicellulose (from fruit and vegetable peels), and bone-derived collagen and hydroxyapatite [13]. Therefore, cultivating biogas-producing microflora that can effectively hydrolyze a wide range of FPWs may accelerate the acclimation period, reduce waste disposal costs, and conserve energy during food manufacturing.
We previously cultivated five sets of microflorae, two digested sludge-assimilating and biogas-yielding soil (DABYS) microflorae, by enriching riverbank soil, and three digested sludge-assimilating and biogas-yielding enteric (DABYE) microflorae, by enriching goat, sheep, and rabbit dung [14]. They can convert digested sludge, the stabilized residue from sewage sludge anaerobic digestion, into biogas. They primarily consist of representatives from the eubacterial genera, mainly Clostridiaceae and Eubacteriaceae, together with the Methanobacteriaceae family as major methanogenic archaea. Enzymatic analysis suggested that the microflorae could hydrolyze digested sludge through cellulase, chitinase, and protease activities. Heat-treated DABYS microflorae at 80 and 100 °C, which inactivated the methanogens but left thermotolerant bacteria unaffected, transformed methanogenic microflorae into hydrogenic ones [15]. Both Clostridiaceae and Enterobacteriaceae family bacteria are known to be involved in substrate hydrolysis and acido/acetogenesis during the anaerobic digestion of food garbage [16,17,18,19,20].
Considering the above-mentioned challenges limiting the successful conversion of FPWs into biogas, we aimed to assess the suitability of DABYS and DABYE microflorae as seed cultures for biogas production from FPWs, aiming for future applications in the food industry.

2. Materials and Methods

2.1. Chemicals and Materials

Standard gas of hydrogen, methane, and carbon dioxide were purchased from GL Sciences (Tokyo, Japan). Molecular biology reagents were purchased from Toyobo (Osaka, Japan), Thermo Fisher Scientific (Waltham, MA, USA), and MP Biomedicals (Santa Ana, CA, USA). All other chemicals were purchased from Wako Pure Chemical Industries (Kyoto, Japan). The glass and plastic labware used for enrichment culture were purchased from Maruemu Corporation (Osaka, Japan) and AS ONE Corporation (Osaka, Japan), respectively. The FPWs in Table 1 were supplied by grocery stores, restaurants, and food manufacturers in Hachioji city, Tokyo. In brief, cattle bone was obtained from a barbecue restaurant, and spent bonito flakes and spent dried kelp were from a Japanese-style restaurant. Spent tea leaves and spent coffee ground were obtained from a cafe. Soy sauce lees was provided by a soy sauce manufacturer. Fishbone (horse mackerel), peels of carrot, white radish, cabbage, lotus stem peel, apple, orange (Citrus hassaku), and grape (Vitis cv. Pione) were provided by the deli kitchen of grocery stores. Rice hull and rice bran were obtained from a rice mill plant, while wheat bran was provided by a flour milling company. Rapeseed oil cake was provided by a fertilizer manufacturer.

2.2. Preparation of Powders of FPWs

FPWs were dried completely in an FSP450 drying oven (Advantec, Tokyo, Japan) at 60 °C for 72 h (h), powdered using a WB-1 crusher (Osaka Chemical, Osaka, Japan), and sieved (1 mm pore). The sieved powder was used as a substrate for the enrichment culture. Extracts were prepared by autoclaving 1.0 g of each FPW powder suspended in 100 mL distilled water at 121 °C for 20 min. The total organic carbon (TOC) and total nitrogen (TN) contents in each extract were determined using a Shimadzu TOC-V CSH/TNM-1 analyzer (Shimadzu, Kyoto, Japan). The TOC, TN, and pH values of each FPW extract are listed in Table 1.

2.3. Seed Culture

Two types of DABYS and three types of DABYE microflorae were used as seed cultures to develop FPW-degrading and biogas-producing microflorae. DABYS microflorae enriched from two riverbank soils were designated as DABYS-A and DABYS-B, respectively. DABYE microflorae derived from the dung of goats, sheep, and rabbits were designated as DABYE-G, DABYE-S, and DABYS-R, respectively. Detailed descriptions of the sample locations are provided in the published article [14].

2.4. Vial-Scale Biogas Fermentation

Fermentation and subculture experiments were performed in 17 mL glass vials. For each vial, 100 μL of seed culture from each source (both DABYS and DABYE) was added to a mixture of 10 mL sterile water and 100 mg FPW powder. To create an anaerobic environment, the headspace in each vial was flushed with nitrogen for 1 min. Vials were sealed with butyl rubber stoppers and aluminum caps and incubated for 1 month (30 days) at 30 °C. After 1 month’s incubation, the headspace gas of each vial was sampled to quantify methane, hydrogen, and carbon dioxide yields. For subculturing, 100 μL aliquot from each vial was transferred to a fresh mixture of 10 mL sterile water and 100 mg FPW powder.

2.5. Biogas Analysis

The composition of the biogas was determined using a GC2014-TCD gas chromatography system equipped with a thermal conductivity detector (Shimadzu, Kyoto, Japan). The settings were as follows: Shincarbon ST column 50–80 (2.0 m × 3.0 mm internal diameter, Shinwa Chemical Industries, Kyoto, Japan); injection volume, 0.5 mL; injection port temperature 120 °C; carrier gas, argon (40.0 mL/min); column oven temperature, 120 °C; and the thermal conductivity detector, 260 °C. Peak identification and quantification of methane, hydrogen, and carbon dioxide in biogas was accomplished using standard pure gases of methane, hydrogen, and carbon dioxide gas, respectively (GL Science).

2.6. Enzymatic Assay

A 2.0 mL sample of the 1-month-subcultured microflora was centrifuged at 14,000× g and 4 °C for 10 min. The resultant supernatant, termed enzyme solution, was analyzed for the presence of cellulase, chitinase, and pectinase using the modified dinitro salicylic acid (DNS) method [21]. In brief, 200 μL of the enzyme solution and 800 μL of 50 mM citrate buffer (pH 4.8) containing 12.5 mg/mL of carboxymethyl cellulose, chitin from shrimp shells, or citrus pectin, as a substrate for cellulase, chitinase, or pectinase, respectively, were mixed in a microtube and incubated for 1 h at 50 °C. The tubes were then centrifuged at 14,000× g and 4 °C for 10 min. A total of 100 μL of the supernatant and 200 μL of the DNS reagent was incubated in boiling water for 5 min. After cooling to room temperature in an ice-water bath, 700 μL distilled water was added to the mixture, and the absorbance of the supernatant at 540 nm was measured using a UV-1800 spectrophotometer (Shimadzu). One unit of cellulase, chitinase, or pectinase activity was defined as the quantity of enzyme required to release 1 μmol of glucose, β-N-acetyl-D-glucosamine, or galacturonic acid via substrate hydrolysis in 1 h. Protease activity in the enzyme solution was quantified as the μg-trypsin equivalent activity using a Pierce protease assay kit (Thermo Fisher Scientific), according to the manufacturer’s instructions.

2.7. Community Fingerprinting of Microflorae

Microbial cells were collected from 1.0 mL of the subculture by centrifuging at 14,000× g and 4 °C for 10 min. Genomic DNA was extracted using the FastDNA SPIN Kit for Soil (MP Biomedicals). The 16S rRNA gene fragments corresponding to the V6–V8 region of eubacteria were amplified via polymerase chain reaction (PCR) using the primer pair F984GC/R1378 and the KOD Fx Neo polymerase (Toyobo), as described by Heuer et al. [22]. The PCR regimen comprised an initial denaturation at 94 °C for 2 min, followed by 34 cycles of 94 °C for 15 s, 50 °C for 30 s, and 68 °C for 30 s. For the amplification of methanogen 16S rRNA gene fragments corresponding to the V3 region, the nested PCR method was employed, as described by Zhou et al. [23]. The primary primer pair used was Met86f/Met915r for archaea, followed by the secondary primer pair GCARC344f/519r for methanogens. Amplification involved an initial denaturation at 95 °C for 5 min, followed by 30 cycles of 95 °C for 30 s, 56.5 °C for 30 s, and 68 °C for 30 s.
Denaturing gradient gel electrophoresis (DGGE) analysis of the PCR amplicons was performed using an NB-1480A DGGE system (Nihon Eido, Tokyo, Japan) according to the manufacturer’s instructions. Approximately 1 μg of each amplified product was loaded onto each well of a 6.0% polyacrylamide gel with a linear denaturant gradient of 50–70% for eubacterial amplicons and 35–45% for archaeal amplicons. Electrophoresis was performed at a constant voltage of 50 V for 18 h at 58 °C or 30 V for 17.5 h at 60 °C for an analysis of eubacterial or archaeal amplicons, respectively. The gels were stained using a solution of 10 μL of SYBR Green (Thermo Fisher Scientific) in 100 mL of TAE buffer (pH 8.0).

2.8. DNA Sequencing of the PCR-DGGE Amplicons

Distinct amplicons were visualized using a 470 nm light-emitting diode, and excised from the DGGE gels. The DNA was eluted by soaking the excised gel fragment containing the amplicon in 20 μL TE buffer (pH 8.0) for 72 h at 4 °C. Subsequently, 1.0 μL of the eluted DNA was used to reamplify rRNA gene fragments with a set of primers lacking the GC clamp [22,23,24] using the PCR regimen described above for DGGE analysis. The resulting PCR products were purified using the GeneJET PCR Purification Kit (Thermo Fisher Scientific) and directly sequenced using the BigDye Terminator v3.1 Cycle Sequencing Kit (Thermo Fisher Scientific). DNA sequences were compared to those of known microbial species in the GenBank, EMBL, and DDBJ databases using the BLAST algorithm.

2.9. Statistical Analysis

Statistical analyses for the experimental data were performed using Student’s t-test (p < 0.05).

3. Results and Discussion

3.1. Biogas Production from FPWs by the Subcultured Microflorae

Two DABYS and three DABYE microflorae were cultured with various FPWs suspended in water. The biogas yield from the 1st to the 10th subculture is detailed in Tables S1–S5 and Figure S1. All microflorae produced methane or hydrogen from most FPWs, except orange peel. Biogas production persisted through repeated subcultures.
Microflorae produced methane from FPWs with low TOC/TN ratios (such as cattle bones, fish bones, and spent bonito flakes) and hydrogen from FPWs with high TOC/TN ratios (fruit peels, vegetable peels, and crop residues). DABYS-A produced 8.4–11.7 mL methane and up to 13.8 mL hydrogen per 1.0 g of respective FPWs (Table S1 and Figure S1a). DABYS-B exhibited similar biogas production characteristics, producing 9.0–14.3 mL methane and up to 15.8 mL hydrogen per 1.0 g of FPWs (Table S2 and Figure S1b). DABYS-G produced up to 14.2 mL hydrogen but only 3.6–8.0 mL methane from 1.0 g of FPWs, being less efficient in terms of methane production than DABYS-A and DABYS-B (Table S3 and Figure S1c). DABYS-S produced 3.7–7.5 mL methane and a maximum of 9.6 mL hydrogen from 1.0 g FPWs, not matching the yields of DABYS-A, DABYS-B, or DABYE-G (Table S4 and Figure S1d). DABYS-R was optimal for fermenting wheat bran and rapeseed oil cake, producing 17.5 mL and 15.1 mL hydrogen, respectively (Table S5 and Figure S1e).
As mentioned above, all microflorae were found to produce methane or hydrogen from various food residues whose pH and TOC/TN ratio ranged from 4.5 to 8.3 and 3.2 (nitrogen-rich) to 170.8 (carbon-rich), respectively. Therefore, we think that the microflorae acclimate to a wide variety of FPWs and use them as substrate for biogas production. For the successful anaerobic digestion of garbage, a mixture of different types of food wastes, its TOC/TN ratio is basic and serves as an important parameter. Since it is reported that a TOC/TN ratio of approximately 10–30 is suitable for the successful digestion of garbage [25,26], the microflorae seem to assimilate this and produce biogas.
Conversely, no microflora could produce biogas when fed with orange peels. Hence, their cultivation was aborted in the third subculture. Since citrus peel is known to contain limonene, an antibacterial monoterpene [27], our microflorae seem susceptible to this, and some pretreatment would be necessary to utilize orange peel for biogas production. For instance, biochar was recently found to be a suitable absorbent for limonene and its addition in digestion liquor successfully stimulated biogas production [28,29]. Some substrates, like lotus stem peel and rice hull, were fermented by the microflorae, but had lower gas yields than other FWPs.
Our microflorae could produce biogas at an ambient temperature, being energy-efficient. However, the biogas yields of our microflorae were lower than the standard rates reported in published articles. For instances, 350–380 mL of methane was produced from 1.0 g volatile solid of meat and bone meal [30], while 280 mL or 830 mL of methane was produced from 1.0 g volatile solid of defatted fish wastes (anchovy or salmon, respectively) containing heads, bones, and tails [31,32]. Agrawal et al. reported that 270–520 mL of methane is produced from 1.0 g solids of several fruit and vegetable peels [33]. While 120 mL or 50 mL of hydrogen was produced from 1.0 g of rice bran or wheat bran [34,35], respectively, 5.9 mL hydrogen was produced from 1.0 g of rice hull [36,37]. Approximately 800 mL of hydrogen was produced from 1.0 g of Calophyllum inophyllum oil cake [38], and 2.9–3.9 mL of hydrogen was produced from a 1.0 g volatile solid of acid–hydrolysate in coffee grounds [39]. Since the microflorae were found to show significant hydrolase activity, as mentioned below, the reason for the low biogas yield of our microflorae may be the increased gas pressure in the vial headspace [40,41] and lack of substrate pretreatment. Therefore, reducing the gas pressure and developing an optimal pretreatment method are indispensable for industrial-scale biogas production.

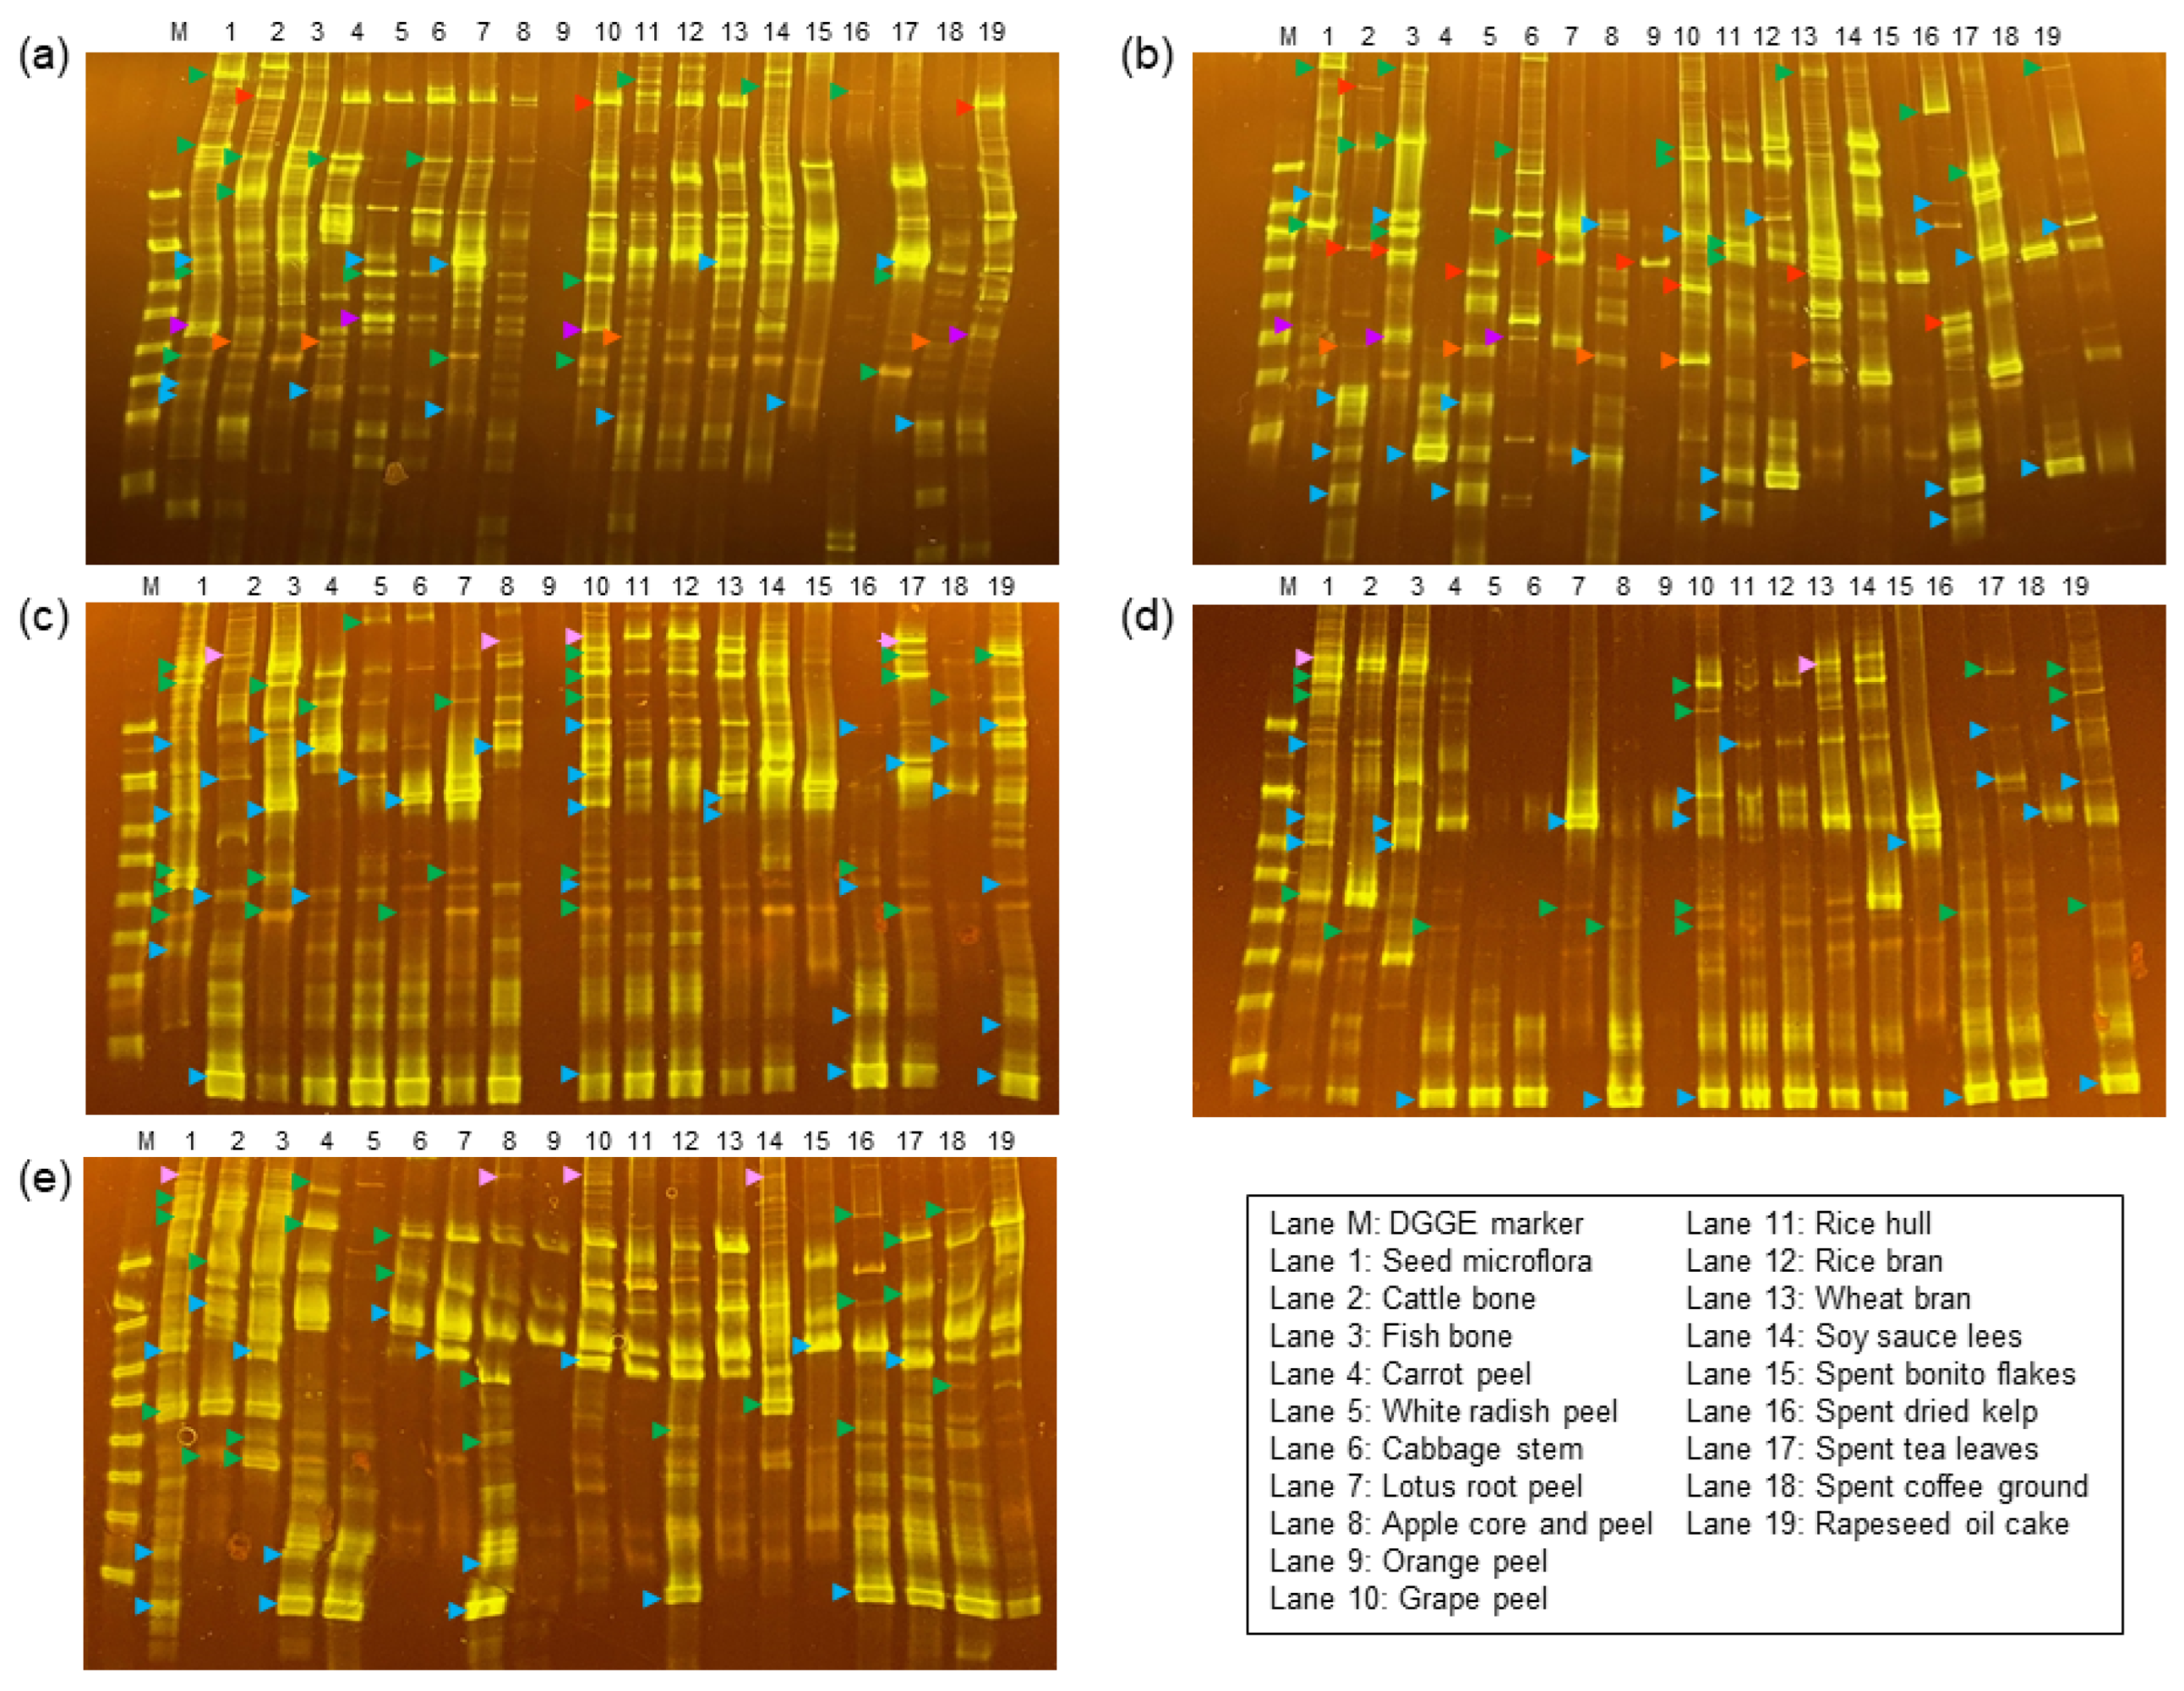
3.2. Eubacterial Compositions of the Subcultured Microflorae

Eubacterial members play a role in substrate hydrolysis during anaerobic digestion [9]. To assess their genetic diversity, a DGGE analysis of the 16S rRNA gene fragments from subcultured microflorae was conducted. Within the subcultured microflorae samples, many rRNA gene amplicons were identified. Each of these fragments had a unique base sequence, which allowed them to be easily differentiated from one another. Significant shifts in eubacterial composition were observed when microflorae were exposed to FPWs compared to their original compositions (Figure 1). The DNA sequencing of major amplicon bands identified dominant members belonging to the Clostridiaceae (green arrowheads in Figure 1) and Enterobacteriaceae (blue arrowheads in Figure 1) families. Among the eubacterial species, some Clostridiaceae and Enterobacteriaceae strains were commonly found in both the subcultured florae and their seed florae, whereas other Clostridiaceae and Enterobacteriaceae strains, which were a minor population in their seed florae, were found to be dominant in the subcultured microflorae. Pseudomonas species, found in the DABYS seed microflorae and the corresponding subcultured flora (purple arrowheads in Figure 1), establish a symbiotic relationship with methanogens during anaerobic digestion. This promotes the syntrophic acetate oxidation and hydrogenotrophic methanogenesis (SAO-HM) pathway, preventing volatile fatty acid accumulation, which inhibits methanogenesis [42,43]. Conversely, Bacillaceae strains (red arrowheads in Figure 1) and Lachnospiraceae strains (orange arrowheads in Figure 1), despite initially being nearly undetectable in the seed florae, were predominant in the subcultured microflorae. DABYE-derived microflorae contained strains belonging to the Oscillospiraceae family (pink arrowheads in Figure 1), commonly found in herbivore gut microbiomes [44]. Thus, maintaining the diversity of eubacterial members in the original seed microflora appears to be important in the immediate acclimation to various FPW substrates and their hydrolysis, making it an ideal seed culture for biogas production from FPWs.

3.3. Archaea Compositions of the Subcultured Microflorae

Methane production from FPWs with a low TOC/TN ratio, such as cattle bone, fish bone, and spent bonito flakes, indicated the presence of methanogenic archaea in the subcultured microflorae. The Methanosarcinaceae (green arrowheads in Figure 2), Methanobacteriaceae (blue arrowheads in Figure 2), and an unidentified archaeal genus (white arrowheads in Figure 2), which were the major methanogens in the seed microflorae, were found to persist in the subcultured florae fed with low TOC/TN ratio FPWs. The unidentified genus includes only environmental clones, suggesting that they are unculturable. Methanobacteriaceae and Methanosarcinaceae methanogens are widespread in environments such as rice paddy soil, aquatic sediments, and anaerobic digesters [45,46,47]. These methanogens produce methane in two ways: Methanosarcinaeae strains utilize acetic acid to produce methane (acetoclastic pathway), while Methanobacteriaceae strains, being hydrogenotrophic, use hydrogen and carbon dioxide to yield methane [48]. These pathways can overlap; for example, the excess carbon dioxide generated in the acetoclastic pathway can be combined with hydrogen to synthesize methane [49]. Thus, both eubacterial and archaeal diversity may be beneficial for biogas production from various FPWs. However, when the microflorae were fed with high TOC/TN ratio substrates, most methanogenic archaea were not detectable, implying that dilution during repeated subcultures removed them.

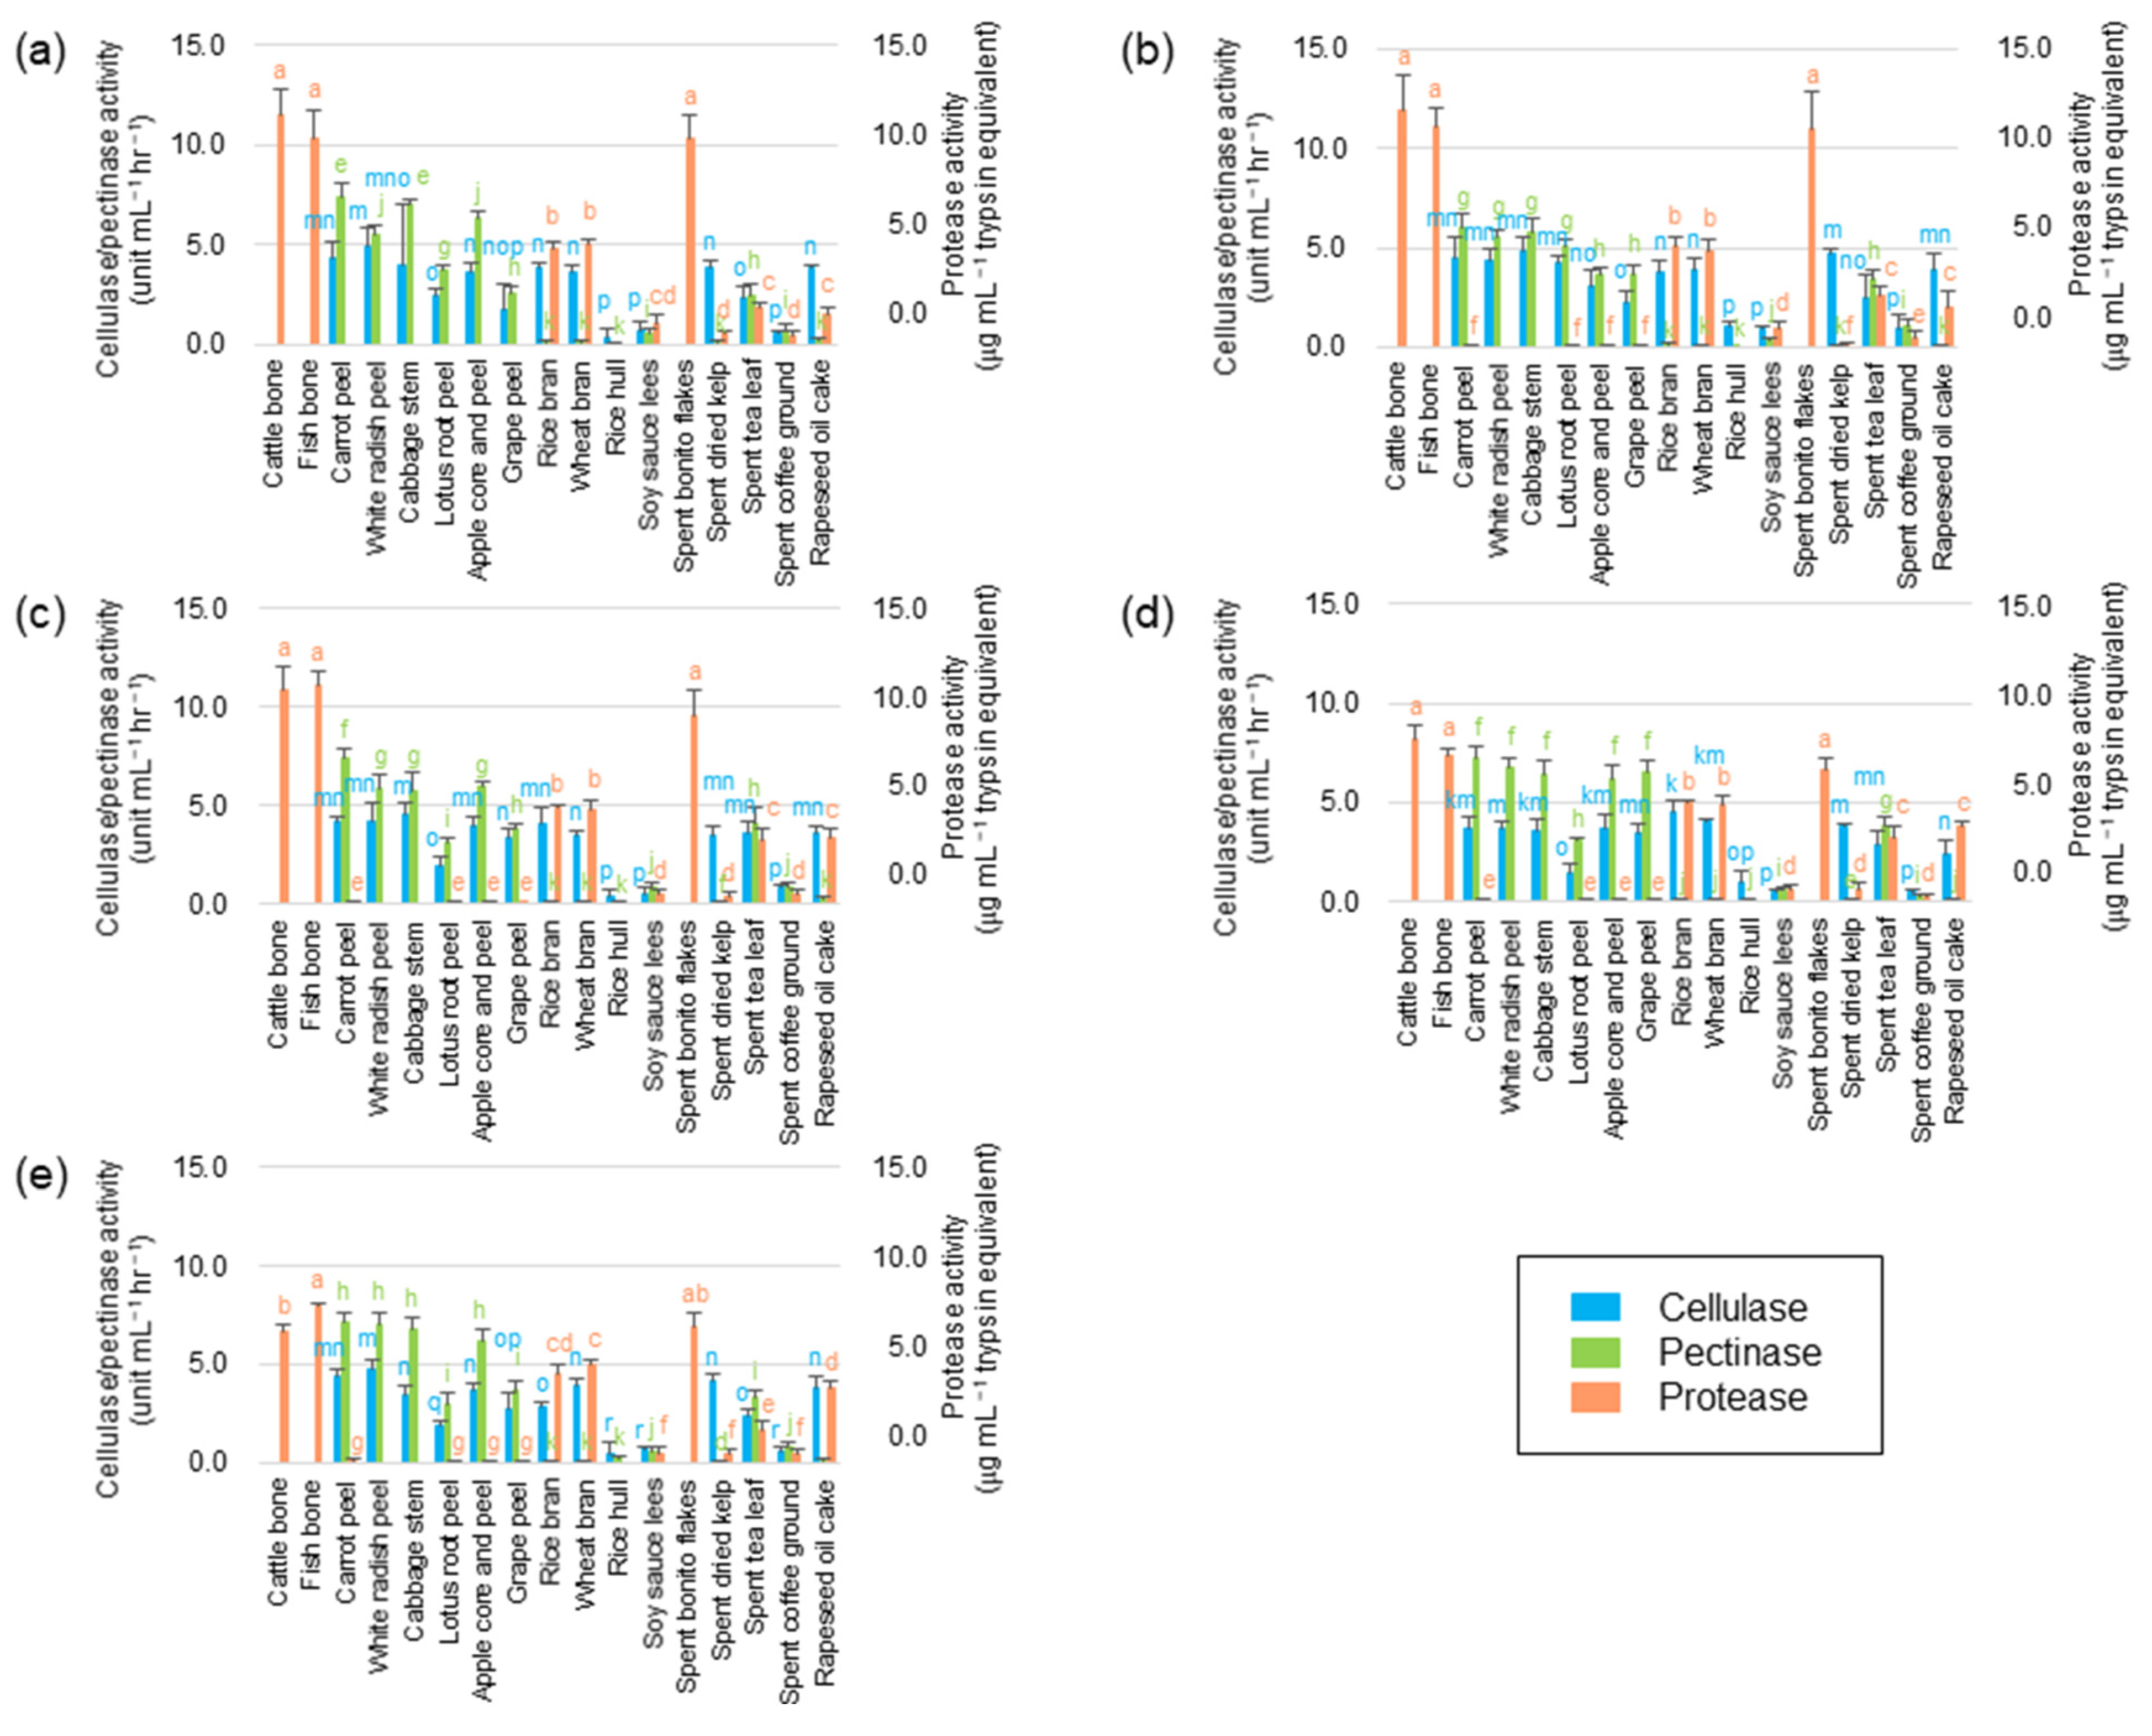
3.4. Enzymatic Activity in Subcultured Microflorae

Substrate hydrolysis, driven by eubacterial hydrolase enzymes, kickstarts biogas production. Since FPWs mainly contain insoluble carbohydrates (such as cellulose), soluble carbohydrates (such as pectin), and protein [13], we examined the cellulase, pectinase, and protease activities of the subcultured microflorae. The results of the enzymatic assays of the tenth subculture of each microflora (excluding the microflora fed with orange peel) are illustrated in Figure 3.
Subcultures fed with low C/N ratio substrates (such as cattle bone, fish bone, or spent bonito flakes) exhibited protease activity, but lacked detectable cellulase and pectinase activities. Conversely, microflorae cultured with high C/N ratio substrates (vegetable and fruit residues) exhibited cellulase and pectinase activities with minimal protease activity, suggesting a change in eubacterial compositions despite originating from the same seed flora. The hydrolase activity of anaerobic digester microflorae is reported in several published articles. For instance, Jensen et al. reported that microflora fed with wheat straw showed 58–70 mg/L/h of MUF release from 4-methylumbelliferyl β-D-cellobioside, a substrate for their cellulase assay, which is comparable to 0.31–0.44 units/mL/h of cellulase activity determined by the DNS method [50]. Zhu et al. reported that microflora fed with corn straw possessed 95–120 units/L (which is comparable to 5.7–7.2 units/mL/h) of cellulase activity [51]. Mshandete et al. reported that microflora obtained from an anaerobic digester for potato processing wastes showed 0.3 units/mL/min (18 units/mL/h) of pectinase activity [52]. Parawira et al. reported that microflora obtained from an anaerobic digester for food processing wastes showed 0.003 units/mL/min (0.18 units/mL/h) pectinase and 0.008 units/mL/min (0.48 units/mL/h) of protease activity [53]. Gao et al. reported that microflora obtained from an anaerobic digester for kitchen wastes showed 0.04 units/mL/min (2.4 units/mL/h) of protease activity [54]. Through comparison with the published data, as shown above, our microflorae are suggested to possess significant hydrolase activity and have an advantage in the hydrolysis of FPWs. Microflorae subcultured with rice hull or lotus stem peels showed very weak hydrolase activity, which is consistent with their low biogas yields. Silica in rice hulls appear to inhibit the growth of hydrolase-producing bacteria in the microflorae [55], while antibacterial compounds in lotus stem may repress the growth of hydrolase-producing bacteria in the microflora [56].
DNA analysis highlighted the dominance of Clostridiaceae and Enterobacteriaceae families in the subcultured microflorae. Notably, certain bacterial families, including Bacillaceae, Lachnospiraceae, and Oscillospiraceae, which were minor in seed microflorae, flourished with FWPs. Both Clostridiaceae and Enterobacteriaceae families have species known for their cellulase, pectinase, and protease activities and hydrogen-producing potential [57,58,59,60,61,62], suggesting that they contribute to both FPWs hydrolysis and hydrogen production. Moreover, Bacillaceae, Lachnospiraceae, and Oscillospiraceae families are known for their proteolytic, pectinolytic, and cellulolytic activities, respectively [63,64,65,66]. Chitinase was not detected in any subculture, suggesting that chitinolytic strains diminished.
Overall, DABYS and DABYE seed microflorae exhibit adaptability to fermentation substrates by changing their bacterial composition, in which FPW-specific hydrolytic and hydrogenic bacteria are enriched, and ultimately optimize FPW conversion to biogas.

4. Conclusions

In the present study, we subcultured DABYS and DABYE microflorae to convert FPWs into biogas, aiming for improved food waste recycling. The subcultured microflorae demonstrated the ability to hydrolyze carbohydrates and protein in FPWs, by using enzymes such as cellulase, pectinase, or protease. This facilitates methane or hydrogen production by respective microflorae. The results highlight the adaptability of DABYS and DABYE microflorae and their usefulness as seed cultures for diverse FPW-derived biogas production. However, biogas yields from FPWs by the subcultured microflorae have not reached their theoretical maximal value. Increasing the surface area-to-volume ratio of the FPWs particles through physicochemical treatments, coupled with a reduction in biogas pressure in the fermentation reactor, could enhance solubilization and accelerate biogas production, which should be investigated in future studies.

Supplementary Materials

The following supporting information can be downloaded at: https://www.mdpi.com/article/10.3390/microorganisms11092321/s1, Figure S1: Biogas yield of the subcultures originating from DABYS-A (a), DABYS-B (b), DABYE-G (c), DABYE-S (d), and DABYE-R (e) seed microflorae; Table S1: Biogas production from FPWs by the subcultured DABYS-A microflorae; Table S2: Biogas production from FPWs by the subcultured DABYS-B microflorae; Table S3: Biogas production from FPWs by the subcultured DABYS-G microflorae; Table S4: Biogas production from FPWs by the subcultured DABYS-S microflorae; Table S5: Biogas production from FPWs by the subcultured DABYS-R microflorae.

Author Contributions

Conceptualization, K.F.; methodology, S.H. and K.F.; validation, S.H., S.S. and K.F.; investigation, S.H., S.S. and K.F.; writing—original draft preparation, S.H.; writing—review and editing, S.H. and K.F.; supervision, K.F.; project administration, K.F.; funding acquisition, K.F. All authors have read and agreed to the published version of the manuscript.

Funding

This study was funded by a Grant-in-Aid for Scientific Research (C:22K12430) from the Japan Society for the Promotion of Science, and a Grant from the Research Institute of Science and Technology, Kogakuin University.

Data Availability Statement

The data presented in this study are available upon request from the corresponding author.

Conflicts of Interest

The authors declare no conflict of interest.

References

  1. UNEP. Food waste amounts: Measured estimates and extrapolations. In Food Waste Index Report 2021; UNEP: Nairobi, Kenya, 2021; pp. 54–72. Available online: https://www.unep.org/resources/report/unep-food-waste-index-report-2021 (accessed on 25 July 2023).
  2. FAO. Food Loss and Waste—Framing the Issues. In The State of Food and Agriculture; FAO: Rome, Italy, 2019; pp. 1–19. Available online: https://www.fao.org/3/ca6030en/ca6030en.pdf (accessed on 25 July 2023).
  3. Zhang, C.; Kang, X.; Wang, F.; Tian, Y.; Liu, T.; Su, Y.; Qian, T.; Zhang, Y. Valorization of food waste for cost-effective reducing sugar recovery in a two-stage enzymatic hydrolysis platform. Energy 2020, 208, 118379. [Google Scholar] [CrossRef]
  4. Ali, A.; Bux Mahar, R.; Panhwar, S.; Ahmed Keerio, H.; Hussain Khokhar, N.; Suja, F.; Rundong, L. Generation of green renewable energy through anaerobic digestion technology (ADT): Technical insights review. Waste Biomass Valoriz. 2023, 14, 663–686. [Google Scholar] [CrossRef]
  5. Ferdeș, M.; Zăbavă, B.Ș.; Paraschiv, G.; Ionescu, M.; Dincă, M.N.; Moiceanu, G. Food waste management for biogas production in the context of sustainable development. Energies 2022, 15, 6268. [Google Scholar] [CrossRef]
  6. Food Waste Reduction Alliance. Analysis of U.S. Food Waste among Food Manufacturers, Retailers, and Restaurants. 2016. Available online: https://foodwastealliance.org/wp-content/uploads/2020/05/FWRA-Food-Waste-Survey-2016-Report_Final.pdf (accessed on 25 July 2023).
  7. Ministry of Agriculture, Forestry and Fisheries of Japan. Annual Amount of Food Waste Generated and Recycling Rate of Cyclical Food Resources. 2019. Available online: http://www.maff.go.jp/j/shokusan/recycle/syokuhin/kouhyou.html (accessed on 25 July 2023). (In Japanese).
  8. Mehrabi, Z. Likely decline in the number of farms globally by the middle of the century. Nat. Sustain. 2023, 6, 949–954. [Google Scholar] [CrossRef]
  9. Ma, S.; Jiang, F.; Huang, Y.; Zhang, Y.; Wang, S.; Fan, H.; Liu, B.; Li, Q.; Yin, L.; Wang, H.; et al. A microbial gene catalog of anaerobic digestion from full-scale biogas plants. GigaScience 2021, 10, 1–10. [Google Scholar] [CrossRef] [PubMed]
  10. Roy, P.; Mohanty, A.K.; Dick, P.; Misra, M. A review on the challenges and choices for food waste valorization: Environmental and economic impacts. ACS Environ. 2023, 3, 58–75. [Google Scholar] [CrossRef]
  11. Xu, F.; Li, Y.; Ge, X.; Yang, L.; Li, Y. Anaerobic digestion of food waste–Challenges and opportunities. Bioresour. Technol. 2018, 247, 1047–1058. [Google Scholar] [CrossRef]
  12. Polizzi, C.; Alatriste-Mondragón, F.; Munz, G. The role of organic load and ammonia inhibition in anaerobic digestion of tannery fleshing. Water Resour. Ind. 2018, 19, 25–34. [Google Scholar] [CrossRef]
  13. Lizundia, E.; Luzi, F.; Puglia, D. Organic waste valorization towards circular and sustainable biocomposites. Green Chem. 2022, 24, 5429–5459. [Google Scholar] [CrossRef]
  14. Kon, A.; Omata, S.; Hayakawa, Y.; Aburai, N.; Fujii, K. Microflora communities which can convert digested sludge to biogas. Environ. Technol. 2022, 43, 2391–2403. [Google Scholar] [CrossRef]
  15. Hayakawa, Y.; Aburai, N.; Fujii, K. Development of digested sludge-assimilating and biohydrogen-yielding microflorae. Fermentation 2023, 9, 175. [Google Scholar] [CrossRef]
  16. Santiago, S.G.; Trably, E.; Latrille, E.; Buitron, G.; Moreno-Andrade, I. The hydraulic retention time influences the abundance of Enterobacter, Clostridium and Lactobacillus during the hydrogen production from food waste. Lett. Appl. Microbiol. 2019, 69, 138–147. [Google Scholar] [CrossRef] [PubMed]
  17. Jung, J.H.; Sim, Y.B.; Baik, J.H.; Park, J.H.; Kim, S.M.; Yang, J.; Kim, S.H. Effect of genus Clostridium abundance on mixed-culture fermentation converting food waste into biohydrogen. Bioresour. Technol. 2021, 342, 125942. [Google Scholar] [CrossRef] [PubMed]
  18. Nzeteu, C.; Joyce, A.; Thorn, C.; McDonnell, K.; Shirran, S.; O’Flaherty, V.; Abram, F. Resource recovery from the anaerobic digestion of food waste is underpinned by cross-kingdom microbial activities. Bioresour. Technol. Rep. 2021, 16, 100847. [Google Scholar] [CrossRef]
  19. Xiao, L.; Deng, Z.; Fung, K.Y.; Ng, K.M. Biohydrogen generation from anaerobic digestion of food waste. Int. J. Hydrogen Energy 2013, 38, 13907–13913. [Google Scholar] [CrossRef]
  20. Torres-León, C.; Chávez-González, M.L.; Hernández-Almanza, A.; Martínez-Medina, G.A.; Ramírez-Guzmán, N.; Londoño-Hernández, L.; Aguilar, C.N. Recent advances on the microbiological and enzymatic processing for conversion of food wastes to valuable bioproducts. Curr. Opin. Food Sci. 2021, 38, 40–45. [Google Scholar] [CrossRef]
  21. Al Talebi, Z.A.; Al-Kawaz, H.S.; Mahdi, R.K.; Al-Hassnawi, A.T.; Alta’ee, A.H.; Hadwan, A.M.; Abbas khudhair, D.; Hadwan, M.H. An optimized protocol for estimating cellulase activity in biological samples. Anal. Biochem. 2022, 655, 114860. [Google Scholar] [CrossRef]
  22. Heuer, H.; Krsek, M.; Baker, P.; Smalla, K.; Wellington, E.M.H. Analysis of actinomycete communities by specific amplification of genes encoding 16S rRNA and gel electrophoretic separation in denaturing gradients. Appl. Environ. Microbiol. 1997, 63, 3233–3241. [Google Scholar] [CrossRef]
  23. Zhou, M.; Hernandez-Sanabria, E.; Guan, L.L. Characterization of variation in rumen methanogenic communities under different dietary and host feed efficiency conditions, as determined by PCR-denaturing gradient gel electrophoresis analysis. Appl. Environ. Microbiol. 2010, 76, 3776–3786. [Google Scholar] [CrossRef]
  24. May, L.A.; Smiley, B.; Schmidt, M.G. Comparative denaturing gradient gel electrophoresis analysis of fungal communities associated with whole plant corn silage. Can. J. Microbiol. 2001, 47, 829–841. [Google Scholar] [CrossRef]
  25. Salangsang, M.C.D.; Sekine, M.; Akizuki, S.; Sakai, H.D.; Kurosawa, N.; Toda, T. Effect of carbon to nitrogen ratio of food waste and short resting period on microbial accumulation during anaerobic digestion. Biomass Bioenergy 2022, 162, 106481. [Google Scholar] [CrossRef]
  26. Azis, F.A.; Choo, M.; Suhaimi, H.; Abas, P.E. The Effect of initial carbon to nitrogen ratio on kitchen waste composting maturity. Sustainability 2023, 15, 6191. [Google Scholar] [CrossRef]
  27. Li, Y.; Liu, S.; Zhao, C.; Zhang, Z.; Nie, D.; Tang, W.; Li, Y. The chemical composition and antibacterial and antioxidant activities of five citrus essential oils. Molecules 2022, 27, 7044. [Google Scholar] [CrossRef] [PubMed]
  28. Fagbohungbe, M.O.; Herbert, B.M.J.; Hurst, L.; Li, H.; Usmani, S.Q.; Semple, K.T. Impact of biochar on the anaerobic digestion of citrus peel waste. Bioresour. Technol. 2016, 216, 142–149. [Google Scholar] [CrossRef] [PubMed]
  29. Chen, L.; Fang, W.; Liang, J.; Nabi, M.; Cai, Y.; Wang, Q.; Zhang, P.; Zhang, G. Biochar application in anaerobic digestion: Performances, mechanisms, environmental assessment and circular economy. Resour. Conserv. Recycl. 2023, 188, 106720. [Google Scholar] [CrossRef]
  30. Wu, G.; Healy, M.G.; Zhan, X. Effect of the solid content on anaerobic digestion of meat and bone meal. Bioresour. Technol. 2009, 100, 4326–4331. [Google Scholar] [CrossRef]
  31. Nges, I.A.; Mbatia, B.; Bjornsson, L. Improved utilization of fish waste by anaerobic digestion following omega-3 fatty acids extraction. J. Environ. Manag. 2012, 110, 159–165. [Google Scholar] [CrossRef]
  32. Paone, E.; Fazzino, F.; Pizzone, D.M.; Scurria, A.; Pagliaro, M.; Ciriminna, R.; Calabrò, P.S. Towards the anchovy biorefinery: Biogas production from anchovy processing Waste after fish oil extraction with biobased limonene. Sustainability 2021, 13, 2428. [Google Scholar] [CrossRef]
  33. Agrawal, A.; Chaudhari, P.K.; Ghosh, P. Anaerobic digestion of fruit and vegetable waste: A critical review of associated challenges. Environ. Sci. Pollut. Res. 2023, 30, 24987–25012. [Google Scholar] [CrossRef]
  34. Sivaramakrishnan, R.; Ramprakash, B.; Ramadoss, G.; Suresh, S.; Pugazhendhi, A.; Incharoensakdi, A. High potential of Rhizopus treated rice bran waste for the nutrient-free anaerobic fermentative biohydrogen production. Bioresour. Technol. 2021, 319, 124193. [Google Scholar] [CrossRef]
  35. Pan, C.; Fan, Y.; Hou, H. Fermentative production of hydrogen from wheat bran by mixed anaerobic cultures. Ind. Eng. Chem. Res. 2008, 47, 5812–5818. [Google Scholar] [CrossRef]
  36. Silvestri, S.; Roman, L.M.G.; Alcaraz-González, V.; Carissimi, E. Rice husk to produce both bio-H2 via dark fermentation and photocatalytic hydrochar. Waste Biomass Valor. 2023; published online. [Google Scholar] [CrossRef]
  37. Tosuner, Z.V.; Taylan, G.G.; Özmıhçı, S. Effects of rice husk particle size on biohydrogen production under solid state fermentation. Int. J. Hydrogen Energy 2019, 44, 18785–18791. [Google Scholar] [CrossRef]
  38. Arumugam, A.; Sandhya, M.; Ponnusami, V. Biohydrogen and polyhydroxyalkanoate co-production by Enterobacter aerogenes and Rhodobacter sphaeroides from Calophyllum inophyllum oil cake. Bioresour. Technol. 2014, 164, 170–176. [Google Scholar] [CrossRef] [PubMed]
  39. Vanyan, L.; Cenian, A.; Trchounian, K. Biogas and biohydrogen production using spent coffee grounds and alcohol production waste. Energies 2022, 15, 5935. [Google Scholar] [CrossRef]
  40. Prajapati, B.R.; Sharma, R.K.; Amatya, I.M. Efect of reduced gas pressure on yield of biogas and other physicochemical parameters. Int. J. Energy Environ. Eng. 2021, 12, 31–37. [Google Scholar] [CrossRef]
  41. Ghimire, A.; Frunzo, L.; Pirozzi, F.; Trably, E.; Escudie, R.; Lens, P.N.L.; Esposito, G. A review on dark fermentative biohydrogen production from organic biomass: Process parameters and use of by-products. Appl. Energy 2015, 144, 73–95. [Google Scholar] [CrossRef]
  42. Yin, D.M.; Westerholm, M.; Qiao, W.; Bi, S.J.; Wandera, S.M.; Fan, R.; Jiang, M.M.; Dong, R.J. An explanation of the methanogenic pathway for methane production in anaerobic digestion of nitrogen-rich materials under mesophilic and thermophilic conditions. Bioresour. Technol. 2018, 264, 42–50. [Google Scholar] [CrossRef]
  43. Buettner, C.; von Bergen, M.; Jehmlich, N.; Noll, M. Pseudomonas spp. are key players in agricultural biogas substrate degradation. Sci. Rep. 2019, 9, 12871. [Google Scholar] [CrossRef]
  44. Zoelzer, F.; Burger, A.L.; Dierkes, P.W. Unraveling differences in fecal microbiota stability in mammals: From high variable carnivores and consistently stable herbivores. Anim. Microbiome 2021, 3, 77. [Google Scholar] [CrossRef]
  45. Zeikus, J.G.; Winfrey, M.R. Temperature limitation of methanogenesis in aquatic sediments. Appl. Environ. Microbiol. 1976, 31, 99–107. [Google Scholar] [CrossRef]
  46. Großkopf, R.; Janssen, P.H.; Liesack, W. Diversity and structure of the methanogenic community in anoxic rice paddy soil microcosms as examined by cultivation and direct 16S rRNA gene sequence retrieval. Appl. Environ. Microbiol. 1998, 64, 960–969. [Google Scholar] [CrossRef] [PubMed]
  47. Ike, M.; Inoue, D.; Miyano, T.; Liu, T.T.; Sei, K.; Soda, S.; Kadoshin, S. Microbial population dynamics during startup of a full-scale anaerobic digester treating industrial food waste in Kyoto eco-energy project. Bioresour. Technol. 2010, 101, 3952–3957. [Google Scholar] [CrossRef]
  48. Vítězová, M.; Kohoutová, A.; Vítěz, T.; Hanišáková, N.; Kushkevych, I. Methanogenic microorganisms in industrial wastewater anaerobic treatment. Processes 2020, 8, 1546. [Google Scholar] [CrossRef]
  49. Park, S.G.; Rhee, C.; Shin, S.G.; Shin, J.; Mohamed, H.O.; Choi, Y.G.; Chae, K.J. Methanogenesis stimulation and inhibition for the production of different target electrobiofuels in microbial electrolysis cells through an on-demand control strategy using the coenzyme M and 2-bromoethanesulfonate. Environ. Int. 2019, 131, 105006. [Google Scholar] [CrossRef] [PubMed]
  50. Jensen, M.B.; de Jonge, N.; Dolriis, M.D.; Kragelund, C.; Fischer, C.H.; Eskesen, M.R.; Noer, K.; Møller, H.B.; Ottosen, L.D.M.; Nielsen, J.L.; et al. Cellulolytic and xylanolytic microbial communities associated with lignocellulose-rich wheat straw degradation in anaerobic digestion. Front. Microbiol. 2021, 12, 645174. [Google Scholar] [CrossRef]
  51. Zhu, R.; Wang, D.H.; Zheng, Y.; Zou, H.; Fu, S.F. Understanding the mechanisms behind micro-aeration to enhance anaerobic digestion of corn straw. Fuel 2022, 318, 123604. [Google Scholar] [CrossRef]
  52. Mshandete, A.M.; Björnsson, L.; Kivaisi, A.K.; Rubindamayugi, M.S.T.; Mattiasson, B. Two-stage anaerobic digestion of aerobic pre-treated sisal leaf decortications residues: Hydrolases activities and biogas production profile. Afr. J. Biochem. Res. 2008, 2, 211–218. [Google Scholar]
  53. Parawira, W.; Murto, M.; Read, J.S.; Mattiasson, B. Profile of hydrolases and biogas production during two-stage mesophilic anaerobic digestion of solid potato waste. Process Biochem. 2005, 40, 2945–2952. [Google Scholar] [CrossRef]
  54. Gao, S.; Huang, Y.; yang, L.; Wang, H.; Zhao, M.; Xu, Z.; Huang, Z.; Ruan, W. Evaluation the anaerobic digestion performance of solid residual kitchen waste by NaHCO3 buffering. Energy Convers. Manag. 2015, 93, 166–174. [Google Scholar] [CrossRef]
  55. Kuhn, F.; Berghahn, E.; Sperotto, R.A. Use of biotechnological approaches to add value to rice hulls. Biotechnol. Prog. 2019, 35, e2861. [Google Scholar] [CrossRef]
  56. Koh, K.H.; Tham, F.Y. Screening of traditional Chinese medicinal plants for quorum-sensing inhibitors activity. J. Microbiol. Immunol. Infect. 2011, 44, 144–148. [Google Scholar] [CrossRef] [PubMed]
  57. Thomas, L.; Joseph, A.; Gottumukkala, L.D. Xylanase and cellulase systems of Clostridium sp.: An insight on molecular approaches for strain improvement. Bioresour. Technol. 2014, 158, 343–350. [Google Scholar] [CrossRef] [PubMed]
  58. Reddy, M.P.; Saritha, K.V. Effects of the culture media optimization on pectinase production by Enterobacter sp. PSTB-1. 3 Biotech 2016, 6, 207. [Google Scholar] [CrossRef] [PubMed]
  59. Mahato, R.K.; Kumar, D.; Rajagopalan, G. Biohydrogen production from fruit waste by Clostridium strain BOH3. Renew. Energy 2020, 153, 1368–1377. [Google Scholar] [CrossRef]
  60. Zhang, Y.; Zhang, T.; Zhang, Z.; Tahir, N.; Zhang, Q. Biohydrogen production from Humulus scandens by dark fermentation: Potential evaluation and process optimization. Int. J. Hydrogen Energy 2020, 45, 3760–3768. [Google Scholar] [CrossRef]
  61. Sarma, M.K.; Ramkumar, N.; Subudhi, S. Biohydrogen production from aquatic plant and algae biomass by Enterobacter cloacae strain DT-1. Chem. Eng. Technol. 2023, 46, 234–241. [Google Scholar] [CrossRef]
  62. Sukumaran, S.; Raguvaran, K.; Nagarajan, K.; Chinnaperumal, K.; Maheswaran, R.; Chinnasamy, R. Isolation, molecular identification, and characterization of cellulolytic microbes from the gut of grasshopper Eyprepocnemis alacris (Serv. 1838). Biomass Convers. Biorefinery 2023, 1–13. [Google Scholar] [CrossRef]
  63. Sheng, P.; Li, Y.; Marshall, S.D.G.; Zhang, H. High genetic diversity of microbial cellulase and hemicellulase genes in the hindgut of Holotrichia parallela larvae. Int. J. Mol. Sci. 2015, 16, 16545–16559. [Google Scholar] [CrossRef]
  64. Contesini, F.J.; Melo, R.R.D.; Sato, H.H. An overview of Bacillus proteases: From production to application. Crit. Rev. Biotechnol. 2018, 38, 321–334. [Google Scholar] [CrossRef]
  65. Ren, Z.; You, W.; Wu, S.; Poetsch, A.; Xu, C. Secretomic analyses of Ruminiclostridium papyrosolvens reveal its enzymatic basis for lignocellulose degradation. Biotechnol. Biofuels 2019, 12, 183. [Google Scholar] [CrossRef]
  66. Wang, N.; Yan, Z.; Liu, N.; Zhang, X.; Xu, C. Synergy of cellulase systems between Acetivibrio thermocellus and Thermoclostridium stercorarium in consolidated-bioprocessing for cellulosic ethanol. Microorganisms 2022, 10, 502. [Google Scholar] [CrossRef] [PubMed]
Figure 1. Denaturing gradient gel electrophoresis (DGGE) band patterns of eubacterial members from subcultured microflorae originating from DABYS-A (a), DABYS-B (b), DABYE-G (c), DABYE-S (d), and DABYE-R (e) seed microflorae. The data display patterns for the 10th subculture fed with FPWs, except for the third subculture fed with orange peel, along with their originating seed cultures. Green, blue, purple, red, orange, and pink arrowheads indicate major characteristic amplicons for the V6–V8 region of the 16S rRNA genes of the Clostridiaceae, Enterobacteriaceae, Pseudomonadaceae, Bacillaceae, Lachnospiraceae, and Oscillospiraceae families, respectively.
Microorganisms 11 02321 g001
Figure 2. Denaturing gradient gel electrophoresis (DGGE) band patterns of methanogen members from subcultured microflorae originating from DABYS-A (a), DABYS-B (b), DABYE-G (c), DABYE-S (d), and DABYE-R (e) seed microflorae. The data display patterns for the 10th subculture fed with FPWs, except for the third subculture fed with orange peel, along with their originating seed cultures. Green, blue, and white arrowheads indicate characteristic amplicons for the V3 region of the 16S rRNA genes of Methanobacteriaceae, Methanosarcinaceae, and unidentified archaeal families, respectively.
Microorganisms 11 02321 g002
Figure 3. Cellulase, pectinase, and protease activities of the subcultures originating from DABYS-A (a), DABYS-B (b), DABYE-G (c), DABYE-S (d), and DABYE-R (e) seed microflorae. The data are presented as the mean ± standard deviation of independent triplicates. The blue-, green-, and orange-colored letters on the columns indicate significant differences at p < 0.05 (Student’s t-test) in cellulase, pectinase, and protease activity, respectively.
Microorganisms 11 02321 g003
Table 1. The total organic carbon (TOC, mg/L), total nitrogen (TN, mg/L), and pH value of autoclaved FPW extract.
Food WasteTOCTNTOC/TN RatiopH
Cattle bone87.827.53.28.3
Fish bone66.320.93.25.8
Carrot peel230.73.860.75.3
White radish peel230.016.314.15.0
Cabbage stem233.515.614.95.4
Lotus stem peel236.910.123.56.8
Apple core and peel318.61.9170.84.8
Orange peel311.57.144.24.4
Grape peel206.14.051.94.5
Rice hull18.40.537.36.6
Rice bran147.113.111.26.6
Wheat bran104.16.416.26.4
Soy sauce lees62.911.15.75.9
Spent bonito flakes20.16.73.06.1
Spent dried kelp156.94.237.56.5
Spent tea leaves103.46.416.25.5
Spent coffee ground62.75.012.65.3
Rapeseed oil cake96.05.617.05.9
Disclaimer/Publisher’s Note: The statements, opinions and data contained in all publications are solely those of the individual author(s) and contributor(s) and not of MDPI and/or the editor(s). MDPI and/or the editor(s) disclaim responsibility for any injury to people or property resulting from any ideas, methods, instructions or products referred to in the content.

