Article

Viability and Virulence of Listeria monocytogenes in Poultry

by
Sarah Panera-Martínez
1,2,
Rosa Capita
1,2,
Camino García-Fernández
2 and
Carlos Alonso-Calleja
1,2,*
1
Department of Food Hygiene and Technology, Veterinary Faculty, University of León, 24071 León, Spain
2
Institute of Food Science and Technology, University of León, 24071 León, Spain
*
Author to whom correspondence should be addressed.
Microorganisms 2023, 11(9), 2232; https://doi.org/10.3390/microorganisms11092232
Submission received: 2 July 2023 / Revised: 11 August 2023 / Accepted: 18 August 2023 / Published: 4 September 2023

Abstract

:
The prevalence of Listeria monocytogenes in 30 samples of poultry was determined using culture-dependent (isolation on OCLA and confirmation by conventional polymerase chain reaction -PCR-, OCLA&PCR) and culture-independent (real-time polymerase chain reaction, q-PCR) methods. L. monocytogenes was detected in 15 samples (50.0%) by OCLA&PCR and in 20 (66.7%) by q-PCR. The concentrations (log10 cfu/g) of L. monocytogenes (q-PCR) ranged from 2.40 to 5.22 (total cells) and from <2.15 to 3.93 (viable cells). The two methods, q-PCR using a viability marker (v-PCR) and OCLA&PCR (gold standard), were compared for their capacity to detect viable cells of L. monocytogenes, with the potential to cause human disease. The values for sensitivity, specificity and efficiency of the v-PCR were 100%, 66.7% and 83.3%, respectively. The agreement between the two methods (kappa coefficient) was 0.67. The presence of nine virulence genes (hlyA, actA, inlB, inlA, inlC, inlJ, prfA, plcA and iap) was studied in 45 L. monocytogenes isolates (three from each positive sample) using PCR. All the strains harbored between six and nine virulence genes. Fifteen isolates (33.3% of the total) did not show the potential to form biofilm on a polystyrene surface, as determined by a crystal violet assay. The remaining strains were classified as weak (23 isolates, 51.1% of the total), moderate (one isolate, 2.2%) or strong (six isolates, 13.3%) biofilm producers. The strains were tested for susceptibility to a panel of 15 antibiotics. An average of 5.11 ± 1.30 resistances per isolate was observed. When the values for resistance and for reduced susceptibility were taken jointly, this figure rose to 6.91 ± 1.59. There was a prevalence of resistance or reduced susceptibility of more than 50.0% for oxacillin, cefoxitin, cefotaxime, cefepime ciprofloxacin, enrofloxacin and nitrofurantoin. For the remaining antibiotics tested, the corresponding values ranged from 0.0% for chloramphenicol to 48.9% for rifampicin. The high prevalence and level of L. monocytogenes with numerous virulence factors in poultry underline how crucial it is to follow correct hygiene procedures during the processing of this foodstuff in order to reduce the risk of human listeriosis.

Graphical Abstract

1. Introduction

The genus Listeria is composed of Gram-positive, rod-shaped, facultatively anaerobic, psychrotrophic bacteria that do not form spores [1]. Although, in total, 26 species of Listeria have been described [2], the most prevalent species in food are Listeria monocytogenes, Listeria innocua, Listeria grayi, Listeria seeligeri and Listeria ivanovii [3,4]. L. monocytogenes is the species responsible for the vast majority of cases of listeriosis in both humans and animals [5,6]. Listeriosis is a zoonosis associated with a high fatality rate and is mostly contracted by consuming contaminated food [7,8]. This bacterium can be found in different types of foodstuffs, including meat, milk, vegetables and even ready-to-eat (RTE) foods [9].
Culture-dependent methods based on two stages of enrichment in a liquid medium, with the subsequent isolation and identification of the colonies by biochemical or molecular methods, have been commonly used for the detection of L. monocytogenes in samples of food origin [10]. Such methods are incorporated into European Union regulations, specifically Commission Regulation (EC) No. 2073/2005. Detection can also be performed using rapid methods based on molecular techniques such as q-PCR, requiring less time to obtain results, having greater specificity, and also permitting the detection of viable but non-culturable cells [11,12]. In view of their potential pathogenicity for consumers, L. monocytogenes cells in a viable, non-culturable state pose a challenge for food safety and public health.
However, q-PCR is not a widely used technique for quantifying bacteria, since it may overestimate bacterial concentrations because of the presence and detection of DNA from dead cells [13,14]. In recent years, a variant of q-PCR, viability PCR (v-PCR), has become increasingly common in various sectors, such as food safety, with this method allowing for cell viability to be determined [15]. The technique is based on treating samples with a viability marker, for example, propidium mono-azide (PMA) [16]. This compound is only capable of penetrating inactivated bacteria with damaged cell membranes. Once inside, the marker binds to the DNA molecules, preventing their amplification during the subsequent PCR process [17], consequently achieving only the selective amplification of the DNA of the viable cells [18,19]. In this way, if q-PCR is performed with and without PMA, viable cells and total cells can be detected and quantified separately.
The virulence of a pathogenic microorganism is related to its ability to cause death in an infected host [20,21,22]. Different virulence factors can be considered, such as the inherent components of the microorganisms that cause damage to host cells, for example, through the production of endotoxins, or the mechanisms that allow a microorganism to evade host defense systems, such as a capacity to form biofilm or resistance to antibiotics [23].
Checks on meat from poultry are a fundamental aspect of food safety, in view of the worldwide trend toward increased consumption of this type of food [12,24]. In this context, this research work was undertaken with the objective of determining the prevalence of L. monocytogenes in poultry meat cuts, quantifying the cells present in both viable and inactivated physiological states. In addition, three factors related to the virulence of the strains, namely, the presence of virulence genes, the potential of the bacteria to form biofilms, and their resistance to antibiotics, were also investigated.

2. Materials and Methods

2.1. Samples

Thirty samples (of approximately 300 g each) of poultry meat cuts (chicken and turkey) were obtained from nine retail outlets (E1 to E9) in the city of León in the North-West of Spain. From one to seven samples were purchased, depending on the establishment concerned: E1 (4 samples), E2 (1), E3 (7), E4 (1), E5 (1), E6 (6), E7 (4), E8 (2), E9 (4). The cuts analyzed included wings (11 samples), thighs (3), drumsticks (12) and breasts (4). All samples were transported in individual bags and processed immediately upon arrival at the laboratory.

2.2. Isolation and Identification of Listeria spp.

Twenty-five grams of skin were homogenized with 225 mL of Half-Fraser broth in sterile bags for two minutes, using a Masticator (IUL Instruments, Barcelona, Spain). These bags were then incubated at 30 °C. After 24 h, aliquots comprising 100 µL were taken and transferred to tubes with 10 mL of Fraser broth, then incubated at 37 °C for a further 24 h. Subsequently, cultures were streaked onto plates of Oxoid chromogenic Listeria agar (OCLA), then incubated at 37 °C for 48 h, in accordance with the ISO 11290-1 standard. From each positive sample, three colonies with attributes typical of Listeria spp. (green colonies) and/or three colonies with those specifically characteristic of L. monocytogenes (green colonies with halo) were taken. The strains isolated were stored at −50 °C in tryptone soy broth (TSB) with 20% glycerol. All the culture media used were purchased from Oxoid Ltd. (Hampshire, UK).
Identification of the isolates was achieved by conventional PCR. This involved growing the strains in TSB at 37 °C for 24 h, and thereafter extracting the DNA from 1.5 mL of the culture. This extraction was performed using two cycles of centrifugation at 13,000 rpm for 60 s, then exposure in a water bath at 100 °C for 30 min. The purity and concentration of the DNA were determined with a NanoDrop™ One spectrophotometer (ThermoFisher Scientific, Wilmington, DE, USA), a wavelength of 260 nm being used. Samples with a DNA concentration between 80 and 180 ng/µL were deemed valid for analysis.
The target genes used for identification were specific for L. monocytogenes (lmo1030), L. innocua (lin0464), L. grayi (oxidoreductase), L. seeligeri (lmo0333), L. ivanovii (namA) and Listeria spp. (prs), as shown in Table 1 [9]. The amplification reaction was performed in a total volume of 25 µL, including 5 µL of the extracted DNA, 2.50 µL of incomplete NH4 reaction buffer (10×, BIORON GmbH, Ludwigshafen, Germany), 1.50 µL of MgCl2 (25 mM, BIORON), 0.50 µL of dNTP mix (10 mM, EURx, Gdansk, Poland), 0.50 µL of each primer (25 µM, Macrogen, Seoul, Republic of Korea), 0.25 µL of Taq DNA polymerase (5 U/µL, BIORON) and 14.25 µL of molecular biology grade distilled water.
Amplification reactions were carried out in a ProFlex™ thermal cycler (Applied Biosystems, Waltham, MA, USA). Denaturation was carried out for five minutes at 94 °C and subsequently, 35 amplification cycles were performed. Each comprised: denaturation for 30 s at 94 °C, annealing for 30 s at the temperature required for each primer, as indicated in Table 1, and elongation for 45 s at 72 °C. As a last stage, there was an extension period of five minutes at 72 °C. Positive controls (previously identified strains), and negative controls (samples without any DNA) were included.
The products of PCR were separated by horizontal electrophoresis in 1% agarose gel (BIORON) dissolved in Tris-acetate-EDTA buffer at 1× concentration and stained with SimplySafe (EURx,) diluted at 1× concentration. The results were visualized using a Gel Doc™ EZ System ultraviolet transilluminator (Bio-Rad, Hercules, CA, USA) and the size of each amplified fragment was estimated using a standard molecular weight marker (Perfect Plus 1kb DNA Ladder, EURx).

2.3. Quantification and Viability of Listeria monocytogenes Determined by q-PCR

Twenty-five grams of skin was homogenized with a Masticator (IUL Instruments) for two minutes in 225 mL of 0.1% peptone water. Two one-milliliter aliquots were separated from each homogenate, one to determine the total cell concentration and the other exclusively for viable cells (v-PCR). This second aliquot was treated prior to DNA extraction with 25 µM of PMAxx™ dye (Biotium, Landing Parkway, Fremont, CA, USA), which is only capable of penetrating inactivated bacteria with damaged cell membranes, where it binds DNA molecules and prevents their amplification.
After this procedure, DNA extraction was performed on the two aliquots, with and without PMAxx, using a commercial protocol PrepSEQ™ Rapid Spin Sample Preparation Kit with proteinase K (ThermoFisher Scientific, Waltham, MA, USA). For this purpose, 750 µL of each aliquot was loaded into separate extraction columns, and centrifuged at 13,000 rpm for three minutes. The column and supernatant were discarded, while the pellet was resuspended in 50 µL of buffer during lysis with proteinase K, incubated in a heat block for 30 min at 56 °C and then 12 min at 97 °C, in order to inactivate the proteinase K. After further centrifuging at 13,000 rpm for one minute and the addition of 250 µL of Milli-Q water to make up a total volume of 300 µL, each sample was centrifuged once more at 13,000 rpm for two minutes, leaving the DNA suspended in the aqueous phase.
Amplification by q-PCR was performed in a StepOne™ thermal cycler (Applied Biosystems, Foster City, CA, USA) using the commercial package MicroSEQ™ L. monocytogenes Detection Kit (ThermoFisher Scientific). The amplification results were transformed into the amount of DNA of the microorganism by setting a fluorescence threshold of 0.3, and using a standard straight line (y = −3.0525 x + 23.206; R2 = 0.966) previously calculated from samples with known amounts of DNA from L. monocytogenes. In order to transform the amount of DNA into log10 cfu/g of the sample, the following equation was used [12]:
C o n c e n t r a t i o n = l o g 10 10 C t 23.206 3.0525 × 340,000 × 10 5 750 c f u / g
In arriving at this formula, several factors were taken into account: (1) the total volume of the homogenization bag (250 mL); (2) the decimal dilution (10−1) of the homogenization bag (25 g of sample in 225 mL of diluent); (3) the fact that one-tenth of the total amount of DNA extracted, 30 µL out of a total of 300 µL, was placed in the reaction tube; (4) the fact that the DNA was extracted from a volume of 750 µL; and (5) the size of the L. monocytogenes genome, as 1 ng of DNA equates to approximately 340,000 cfu [25].
Finally, the percentage of viable cells in each sample was determined by comparing the concentration values obtained from the aliquot of viable cells, treated with PMA, and in the aliquot of total cells, not so treated, using the following formula:
% v i a b l e   c e l l s = C o n c e n t r a t i o n   i n   a l i q u o t   w i t h   P M A c f u g C o n c e n t r a t i o n   i n   a l i q u o t   w i t h o u t   P M A   c f u g × 100

2.4. Comparison between OCLA&PCR and v-PCR Techniques

The two methods used for detecting viable L. monocytogenes cells were compared, the first being the classic method involving isolation in OCLA medium (ISO 11290-1) followed by identification using PCR (OCLA&PCR), the second the culture-independent method (v-PCR). Since the prevalence of positive samples was unknown, it was assumed that the conventional method (OCLA&PCR) would provide the correct results, since it is considered to be the reference technique, or “gold standard”. The sensitivity, specificity, efficiency, and predictive values in respect of both positive and negative tests of the culture-independent method (v-PCR) were calculated. In addition, the two methods were compared by calculating the agreement between them in terms of their kappa coefficient [26]. The definitions and calculations for these parameters are shown in Figure 1.

2.5. Virulence Genes

From the same DNA extractions used to carry out the identification of the isolates, the presence or absence of nine major virulence factors was determined for L. monocytogenes, as indicated in Table 2 [27].
The hlyA, actA, inlB and iap genes were detected by single PCRs, while two multiple PCRs were performed for the remaining virulence genes: one for inlA, inlC and inlJ, and another for plcA and prfA. Single PCRs were performed using the same reagent concentrations employed to identify isolates (Table 1). However, the primers used, their concentrations and the thermocycling conditions were those shown in Table 3. In the case of the multiplex PCRs, a final volume of 50 µL was obtained, and the concentrations of MgCl2 (2 mM), of Taq DNA polymerase (2U), and of each primer used were modified, as can be seen in Table 2.
Amplification reactions were carried out in a ProFlex™ thermal cycler (Applied Biosystems). Results were examined by electrophoresis in 1.5% agarose gel and visualized by means of a UV light transilluminator (Bio-Rad).

2.6. Ability to Form Biofilm

Determination of the capacity of L. monocytogenes to form biofilm was performed in accordance with a protocol previously described by Díez-García et al. [28]. For this purpose, strains preserved at −50 °C in TSB with 20% glycerol were inoculated into tubes of TSB and incubated for 18 h at 37 °C, yielding a concentration of approximately 109 cfu/mL. Four decimal dilutions were carried out to obtain a concentration of 105 cfu/mL. Volumes of 225 µL of TSB and 25 µL of bacterial culture were deposited in the wells of polystyrene microtiter plates (Oy Growth Curves Ab Ltd., Helsinki, Finland), so as to reach a final concentration in the wells of 104 cfu/mL. Negative controls, containing 250 µL of plain TSB, were included on all the plates.
The microtiter plates were incubated at 37 °C for 24 h, after which the culture broth was drawn off and the wells were washed with 300 µL of sterile distilled water. The bacteria that remained adhering to the bottom of each well were fixed with 250 µL of methanol for 15 min. After this time had elapsed, the methanol was poured off, the plates were air dried, and then stained through five minutes of contact with 250 µL of a 0.5% aqueous crystal violet solution. The wells were then emptied and washed with running tap water. The plates were air-dried once again and the cell-bound dye was resolubilized by adding 250 µL of 33% acetic acid (Sigma-Aldrich Co., St. Louis, MO, USA) to the wells for subsequent measurement of the optical density at 580 nm (OD580) with a Bioscreen C MBR (Oy Growth Curves Ab).
Finally, the strains were classified on the basis of their ability to form biofilms, using a cut-off optical density at 580 nm, OD580, designated ODc. This ODc was defined as the mean OD580 value for negative controls plus three standard deviations. In this way, the strains were divided into four categories: non-biofilm producers, for which OD580 ≤ ODc; weak biofilm producers (ODc < OD580 ≤ 2 × ODc); moderate biofilm-producers (2 × ODc < OD580 ≤ 4 × ODc); and strong biofilm producers (4 × ODc < OD580) [29].

2.7. Antibiotic Resistance

The susceptibility of all the L. monocytogenes strains taken from the OCLA medium and identified by PCR was tested against 15 antibiotics of clinical importance using the disc diffusion technique [30]. The strains were incubated at 37 °C in Mueller–Hinton broth (MHB). Thereafter, they were inoculated onto dishes of Mueller–Hinton agar (MHA) by spread plating, after which antibiotic discs were placed onto the dishes, with five antibiotics on each.
The antibiotic discs (Oxoid) used were ampicillin (AMP, 10 µg), oxacillin (OX, 1 µg), cefoxitin (FOX, 30 µg), cefotaxime (CTX, 30 µg), cefepime (FEP, 30 µg), gentamycin (CN, 10 µg), erythromycin (E, 15 µg), vancomycin (VA, 30 µg), trimethoprim-sulfamethoxazole (SXT, 25 µg), rifampicin (RD, 5 µg), tetracycline (TE, 30 µg), chloramphenicol (C, 30 µg), ciprofloxacin (CIP, 5 µg), enrofloxacin (ENR, 5 µg) and nitrofurantoin (F, 300 µg). After incubation at 37 °C for 18–24 h, inhibition halos were measured and the strains were classified as being susceptible, as intermediate (with reduced susceptibility), or as resistant on the basis of the same criteria used in previous work [12]. These norms were (1) those of EUCAST [31] for E, SXT (L. monocytogenes), CN, RD, TE, C, CIP (Staphylococcus spp.), CTX, FEP (Streptococcus spp.) and VA (Enterococcus spp.); (2) those of the CLSI [30] in the case of OX, FOX, F (Staphylococcus spp.), AMP (Enterococcus spp.); and (3) the CLSI’s VET08 standard [32] for ENR (Staphylococcus spp.).
Finally, with these data, antibiotic resistance patterns were established on the basis of the criteria defined by the European Centre for Disease Prevention and Control (ECDC) and the Centers for Disease Control and Prevention (CDC) of the USA for classifying bacteria of interest for public health. These norms include references to “multidrug-resistant” (MDR), “extensively drug-resistant” (XDR) and “pan-drug-resistant” (PDR) phenotypes. The MDR phenotype is defined as an acquired absence of susceptibility to at least one antibiotic from each of three or more categories of antimicrobials. The XDR phenotype is explained as a lack of susceptibility to at least one antimicrobial agent from all but two or fewer antimicrobial categories. Finally, the PDR phenotype involves an absence of susceptibility to all agents in all antimicrobial categories [33].

2.8. Statistical Analysis

The data obtained, both for the prevalence of bacteria as well as for the prevalence of virulence genes and the percentages of resistance to antibiotics, were compared using exact Chi-square tests. To determine if there were differences between the quantification results for samples that had been treated with PMA and those that had not, a Mann–Whitney U test was performed. In addition, a Pearson correlation analysis was performed between the variables studied: the percentage of virulence genes relative to the total number of virulent genes tested shown by each isolate, the capacity to form biofilm, OD580 values, and the percentage of reactions of resistance to antibiotics relative to the total number of tests carried out for each isolate. Outcomes were grouped into four categories: no correlation (0.00 ≤ r < 0.10), weak correlation (0.10 ≤ r < 0.30), moderate correlation (0.30 ≤ r < 0.50) and strong correlation (0.50 ≤ r < 1.00), on lines similar to what is described by Cohen [34] and Hernández-Lalinde et al. [35]. All analyses were carried out using the RStudio software package, V.3.6.3 [36], and the Statistica® 8.0 package (Statsoft Ltd., Tulsa, OK, USA), the confidence level being set at 95.0% (p < 0.05).

3. Results

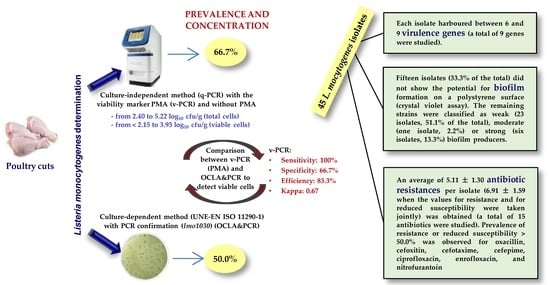
3.1. Prevalence of Listeria spp. and Listeria monocytogenes

When the OCLA&PCR method (isolation on OCLA and confirmation by conventional PCR), dependent upon culturing, was used, Listeria spp. cells were detected in 21 samples (70.0%). In nine of these, L. monocytogenes was the species detected, in four, L. innocua, and in seven, more than one species was found. The combinations were L. monocytogenes and L. innocua (five samples), L. innocua and L. grayi (one), and L. monocytogenes, L. innocua and L. grayi (one). Isolates from one of the samples were assignable to the genus Listeria, but could not be identified at the species level. Hence, L. monocytogenes was detected in 50.0% of the samples analyzed, and from each of these positive samples, three colonies were isolated, yielding 45 isolates in total.
Figure 2 shows the prevalence of Listeria spp. and L. monocytogenes in respect of the particular type of poultry cut and the outlet where it was purchased. In the case of Listeria spp., thighs were the samples with a tendency to show the lowest prevalence of Listeria spp. (33.3%), while for other cuts, the prevalence ranged between 63.6% for wings and 83.3% for breasts. In establishments E2 and E5, no sample with Listeria spp. was detected, while in the remaining outlets, between 50% and 100% of the samples were contaminated with this microorganism.
With regard to the prevalence specifically of L. monocytogenes, the samples with a tendency to show the highest prevalence of L. monocytogenes were drumsticks (58.3%) and breasts (75.0%). Furthermore, establishments E2, E4 and E5 had no samples among those they provided that were contaminated with L. monocytogenes. In contrast, the outlets labeled E3 and E8 showed the highest figures for contamination with this microorganism, the first having 85.7%, and the second, 100% of all the items purchased.
Similar (p > 0.05) prevalence values were observed for Listeria spp. and L. monocytogenes in breasts and thighs. On the other hand, drumsticks and wings showed the highest (p < 0.05) prevalence for Listeria spp. With regard to the establishment, differences in the prevalence of Listeria spp. and L. monocytogenes were observed for E3, E4, E6 and E7.

3.2. Concentration of Viable Cells of Listeria monocytogenes

Table 4 shows the levels of L. monocytogenes obtained using q-PCR. It indicates the concentrations of total cells and viable cells, as well as the percentage of viable cells in each of the samples, and the results, whether positive or negative, obtained with the culture-dependent OCLA&PCR method. In cases where no amplification was observed in the samples treated with PMA, the percentage of viable cells was calculated on the basis of the figure for 40 amplification cycles (detection limit).
There were significant differences (p < 0.001) between the concentrations of L. monocytogenes (log10 cfu/g) in the aliquots not treated with PMA, for which the average concentration of total cells was 3.16 ± 0.74, and those that were treated, where the mean concentration of viable cells was 2.47 ± 0.54. Analysis of these data in accordance with the type of sample involved yielded the results shown in Figure 3. Significant differences p < 0.05) were observed between total cells (before treatment with PMA) and viable cells (after this treatment) in the case of wings, drumsticks and breasts.
Regarding the establishment (Figure 4), significant differences (p < 0.05) between total and viable cells were found in E3 and E7. As previously noted, establishments E2, E4 and E5 provided no samples positive for L. monocytogenes and, thus, were excluded from the statistical analysis.

3.3. Comparison between OCLA&PCR and v-PCR

When the capacity of the two methods (OCLA&PCR and v-PCR) used for the detection of L. monocytogenes in poultry cuts was compared, taking OCLA&PCR as the reference method, the v-PCR technique obtained sensitivity values of 100%, specificity of 66.7% and efficiency of 83.3%. The agreement between the two methods (kappa coefficient) was 0.67. All the samples found positive for L. monocytogenes by the OCLA&PCR method, 15 in total, were also recorded as positive by the v-PCR technique. However, five samples showed positive for the pathogen with v-PCR, but not so with the classic method (OCLA&PCR). Finally, ten samples were rated negative by both methods.

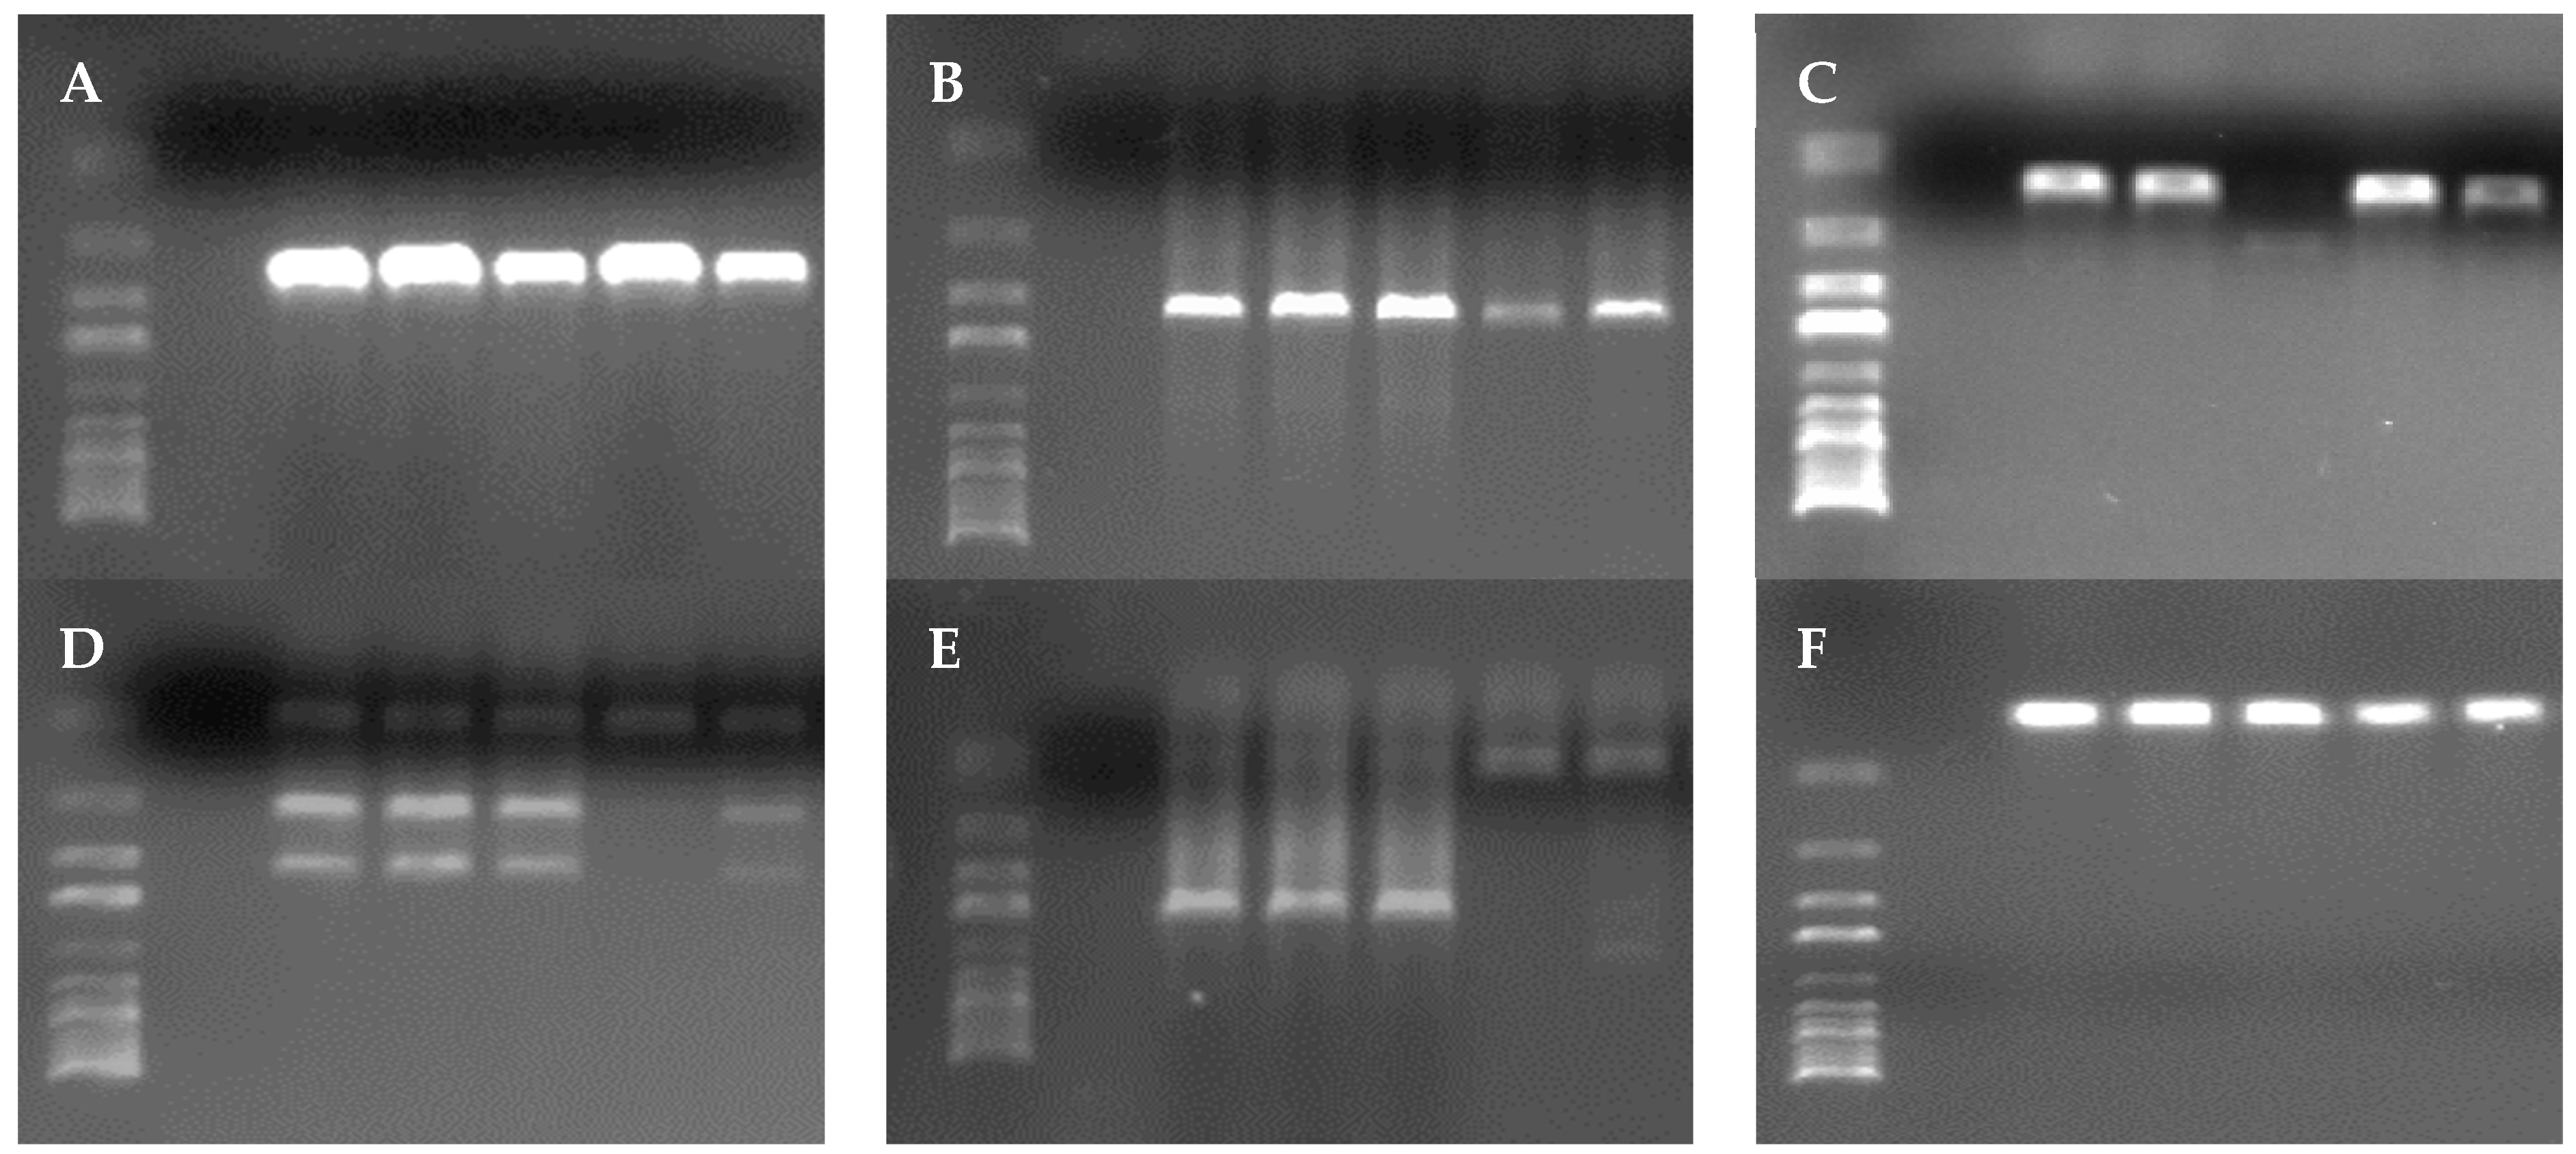
3.4. Virulence Genes

The presence of nine virulence genes, hlyA, actA, inlB, inlA, inlC, inlJ, prfA, plcA and iap, was investigated using PCR in the 45 isolates identified as L. monocytogenes, as shown in Figure 5. All the strains studied were positive for between six and nine virulence genes. A total of 22.2% of the isolates were positive for all nine genes studied, 62.2% for eight, 13.3% for seven, and 2.2% for six genes.
All the strains analyzed, regardless of the type of sample or the establishment where it was obtained, were positive for the hlyA, actA, inlC, inlJ and iap genes. The lowest percentage of prevalence was observed in the case of the plcA and prfA genes, present in 55.6% of the isolates in both cases. The inlA gene was found in 95.6% of the isolates and inlB in 97.8%. Figure 6 shows the prevalence of each gene according to the type of cut and the establishment. In most cases, the highest prevalence (p < 0.05) was observed for inlA and inlB genes.

3.5. Potential for Biofilm Formation

Fifteen isolates (33.3% of the total) did not form biofilm on the polystyrene surfaces used. The remaining strains had a potential for biofilm formation, and were classified as weak (23 isolates, 51.1% of the total), moderate (one isolate, 2.2%) or strong (six isolates, 13.3%) biofilm producers. The average OD580 of the negative controls was 0.134 ± 0.073. Consequently, in classifying strains the ODc was set at 0.353.
Figure 7 shows the distribution of strains on the basis of their potential to form biofilm, in respect of the type of sample and the establishment of acquisition. All the strains classified as strong biofilm producers were isolated from wings or drumsticks from the outlets labeled E3, E6 and E8, while those classified as moderate biofilm producers were isolated from wings purchased in establishment E8.
The overall average value for OD580 obtained from the whole set of isolates was 0.639 ± 0.594. According to the type of cut, OD580 values were 0.542 ± 0.433 (wings), 0.306 ± 0.141 (thighs), 0.493 ± 0.433 (drumsticks) and 1.220 ± 0.849 (breasts). Data for establishments were 0.434 ± 0.121 (E1), 0.507 ± 0.366 (E3), 0.662 ± 0.398 (E6), 0.333 ± 0.159 (E7), 1.730 ± 0.844 (E8) and 0.278 ± 0.053 (E9).

3.6. Antibiotic Resistance

The 45 isolates of L. monocytogenes were tested for susceptibility to a panel of 15 antibiotics. An average of 5.11 ± 1.30 resistances per isolate was recorded. When figures for resistance and reduced susceptibility were taken together, this number rose to 6.91 ± 1.59.
Consideration of average resistance data for the antibiotics examined, as shown in Figure 8, revealed significant differences (p < 0.05) between substances. All the strains analyzed were resistant to OX, FOX, CTX and FEP, but none were resistant to AMP, VA, TE and C. For the rest of the antibiotics, the percentages of resistance ranged from 2.2% (CN and ENR) to 33.3% (RD). If resistant strains are lumped together with those having reduced susceptibility, prevalence was higher than 50.0% for OX, FOX, CTX, FEP, CIP, ENR and F. For all the other antibiotics, with the exception of C (0.00%), there was some prevalence, with values ranging from 2.2% (TE) to 48.9% (RD).
Seventeen different resistance patterns were found, as displayed in Table 5. Two main phenotypes were prominent: OX-FOX-CTX-FEP (presented by 19 isolates) and OX-FOX-CTX-FEP-RD (six isolates). The other patterns were present in a number of isolates ranging from one to three.
A total of ten different categories of antibiotics were tested: beta-lactams (AMP, OX, FOX, CTX and FEP), aminoglycosides (CN), macrolides (E), glycopeptides (VA), sulphonamides (SXT), rifamycins (RD), tetracyclines (TE), phenicols (C), fluoroquinolones (CIP, ENR) and nitrofurans (F). Of the forty-five strains tested, none had a phenotype that was pan-drug-resistant (PDR) or extensively drug-resistant (XDR, implying resistance to between eight and ten of the complete set of different categories of antibiotics trialed). On the other hand, nineteen strains (42.2%) showed resistance to four antibiotics, thirteen strains (28.9%) to five, and a further thirteen strains had a multidrug-resistant (MDR) phenotype, there being resistance to six antibiotics in six strains, to seven in four, to eight in two, and to nine in one, as may be seen from Figure 9.

3.7. Relationships between Virulence Factors

To determine any possible relationship between the three groups of factors tested that might influence the virulence of L. monocytogenes, the presence of virulence genes, the potential for biofilm formation, and resistance to antibiotics, a Pearson correlation analysis was performed. The results obtained show a weak but non-significant (p > 0.05) correlation between the percentage of resistant reactions per isolate and the potential for biofilm formation (OD580 values) (r = 0.227;), and between the potential for biofilm formation and the percentage of virulence genes detected (r = 0.152). No correlation was observed between the percentage of strains with resistance to antibiotics and the percentage of virulence genes detected (r = 0.098).

4. Discussion

4.1. Prevalence of Listeria spp. and Listeria monocytogenes

The average percentage of samples contaminated with Listeria spp. was 70.0%; this figure being as high as 100% in three of the nine establishments studied. This widespread presence may be related to the ubiquity of these bacteria and to fecal contamination during evisceration, since birds can be carriers of this microorganism [37,38]. The prevalence of Listeria spp. found in this research work was higher than that observed in other studies, where values noted were 14.6% in poultry meat products [39], 22.0% in meat and poultry carcasses [40], 40.0% in chicken carcasses [41] and 48.0% in fresh chicken meat [42]. However, the results presented here are very similar to those observed in other studies carried out in north-western Spain: 73.0% in poultry preparations [12], 76.3% in free-range poultry meat [43], 92.1% in raw chicken meat [37] and 95.0% in chicken carcasses [26].
The predominant species in the present study was L. monocytogenes, present in 50% of the samples analyzed. This percentage is lower than those previously recorded in the North-West of the Iberian Peninsula for prepared poultry meat, with figures of 56.0% [12] and 70% [44] having been reported. The higher prevalence obtained in meat preparations may be due to the greater amount of handling that such samples receive, as suggested previously by Rodríguez-Melcón et al. [44]. On the other hand, the prevalence detected during the research work being presented here was higher than values previously observed in fresh chicken meat from this region, with figures of 24.5% [37] and of 32% [26] having been seen, and in work undertaken by other authors elsewhere, most ranging from 0% to 20% [39,42,45,46,47,48,49,50,51,52,53].
It should be noted that various outlets (E2, E4 and E5) provided samples completely uncontaminated with L. monocytogenes, while in others (E3 and E8) the microorganism was detected in more than 85.0% of the items acquired. This fact may be related to the ability of L. monocytogenes to form biofilms and so resist the usual treatments employed to eliminate it, giving it the capacity to remain in food-processing environments for long periods, causing cross-contamination [54]. However, these results should be interpreted with caution due to the low number of samples analyzed.
After L. monocytogenes, L. innocua was the most prevalent species, being detected in 36.7% of the samples. This value is similar to the 46.3% found in poultry meat by Fallah et al. [47] and the 32.0% in poultry meat preparations recorded by Panera-Martínez et al. [12]. It should be noted that in some previous studies, L. innocua was the most prevalent species, with percentages for contamination of 57.8% [26] and 59.5% [37] in samples of fresh chicken and of 67.4% in poultry meat samples [43]. In contrast, other authors have detected a lower prevalence of L. innocua in poultry meat products, with 0% being observed by Osaili et al. [50] and 13.6% by Amajoud et al. [39].
The remaining Listeria species studied had low prevalence. For instance, L. grayi was found in 6.7% of the samples, a value slightly higher than the 2.0% observed in previous studies carried out on poultry meat preparations by Panera-Martínez et al. [12], the 2.2% seen in fresh chicken meat by Alonso-Hernando et al. [37] and the 3.5% in processed chicken meat products recorded by Osaili et al. [50]. No strains of L. seeligeri or L. ivanovii were isolated, this being a result similar to those of other authors, who found a low prevalence of these species, ranging between 0.0% and 1.8% [39,43,50] for L. seeligeri, and between 0.0% and 1.1% for L. ivanovii [37,43].
Finally, three isolates obtained from one of the samples analyzed proved impossible to identify at the species level. A similar outcome was noted in earlier work with regard to strains obtained from whole carcasses and legs of poultry, with figures of 6.7% in 1993 and 12.8% in 2006 [37].

4.2. Concentration of Viable Cells of Listeria monocytogenes

The levels of L. monocytogenes in the samples were determined by q-PCR. The use of this technique yielded positives in 20 samples (66.7%). The levels of total cells, both viable and inactivated, ranged between 2.40 and 5.22 log10 cfu/g, while for viable cells alone, they ran from <2.15 to 3.93 log10 cfu/g. The concentrations of L. monocytogenes were similar to those obtained in previous studies carried out on poultry meat preparations, at between 2.34 and 5.96 log10 cfu/g for total cells [12] and on minced chicken meat, running between <2.15 and 3.25 log10 cfu/g for viable cells, and between <2.15 and 4.32 log10 cfu/g for total cells [44].
Treatment with PMA brought about a decrease in the levels of L. monocytogenes detected. This was a finding to be expected, since the compound in question binds to the DNA of damaged cells only, preventing amplification, which thereafter solely affects the DNA from intact cells [55]. In eleven of the twenty samples with L. monocytogenes detected by q-PCR, the fluorescence detection limit was not breached after PMA treatment. In these cases, the number of viable cells was deemed to be below the limit of detection (2.15 log10 cfu/g). This detection limit in itself was lower than that set by other authors, for instance, the 3 to 4 log10 cfu/g used by Rantsiou et al. [56].
There has been much research focusing on the detection of Listeria spp. and of L. monocytogenes in food, using both culture-dependent (plating) and culture-independent (q-PCR) methods. However, the investigation being described here differs from most of those studies, which were based on previous enrichment stages, and which ruled out any possibility of quantifying the pathogen. The concentrations of L. monocytogenes noted in the present study were higher than those observed by other authors in raw chicken meat, with levels detected by plate count not exceeding a figure of 3 log10 cfu/g [53] or, when they were higher, this affected only a very small percentage of samples [57]. The differences between those research works and the present study may be due to the fact that the plate counts that were performed by the researchers in question were able to quantify only viable culturable cells, whereas the v-PCR technique permits non-culturable viable cells to be counted as well [58,59].

4.3. Comparison between OCLA&PCR and v-PCR

The high score for sensitivity obtained with v-PCR (100%) as against OCLA&PCR, seen as the “gold standard”, points to an absence of false negatives in this culture-independent method. In other words, all the samples rated positive using the OCLA&PCR technique were also classed as positive by v-PCR. In contrast, the figure for specificity, 66.7%, was an outcome of the presence of five samples classed negative by plating (OCLA&PCR) but positive by v-PCR. If it is kept in mind that the v-PCR procedure applied gives very good results in pure cultures of L. monocytogenes, and in samples inoculated with known amounts of the pathogen [15,58], it is highly likely that these five samples contained viable but non-culturable L. monocytogenes cells, so that no growth was observed on the culture medium, but they were detected by v-PCR.

4.4. Virulence Genes

All the L. monocytogenes isolates had between six and nine of the virulence genes hlyA, actA, inlA, inlB, inlC, inlJ, prfA, plcA and iap. These genes are frequently found in strains of L. monocytogenes of food origin. Thus, Arslan and Baytur [27] detected all nine of the virulence factors listed in 100% of the L. monocytogenes strains they isolated from fresh beef and poultry meat. For their part, Anwar et al. [60] also observed high prevalences for these genes: hlyA (100%), actA (100%), inlA (100%), inlB (100%), inlC (90.2%) and inlJ (90.2%), prfA (100%) and plcA (100%).
The presence of multiple virulence factors in L. monocytogenes strains is related to their potential to cause disease, since they favor entry into eukaryotic cells [60]. Of the virulence factors studied, inlA, inlB, inlC and inlJ are genes that encode proteins of the internalin family and are associated with penetration by the microorganism into non-phagocytic cells [61,62,63]. Moreover, it is noteworthy that all the isolates had the actA gene, which encodes a surface protein associated with the passing of the bacterium from one cell into another without contact with the extracellular medium, allowing L. monocytogenes to evade a host’s immune system [64,65].
The hlyA (alpha-hemolysin) and iap (invasion-associated protein) genes were found in 100% of the isolates analyzed. In contrast, the plcA (phosphatidylinositol-specific phospholipase C) and prfA (positive regulatory factor A) genes appeared in only 55.6% of the isolates. These four genes are predictors of the major virulence factors in L. monocytogenes, since they are directly related to its pathogenicity [66,67] and to the control of the expression of other virulence genes in this bacterium [68].

4.5. Potential for Biofilm Formation

The potential of L. monocytogenes isolates to form biofilm was limited. Isolates were classified as non-biofilm producers (33.3%), or as weak (51.1%), moderate (2.2%) or strong (13.3%) biofilm producers. Other authors have obtained results similar to those from the present study. Thus, Kayode and Okoh [69] isolated from ready-to-eat products a number of L. monocytogenes strains, 69.1% of which had some potential for biofilm formation. For their part, several researchers [70,71,72] have observed a clear predominance of strains with a weak or moderate capacity to form biofilms in L. monocytogenes isolates from food or clinical samples, these results being consistent with those of the work presented here. On the contrary, other authors have detected a strong ability to form biofilm in L. monocytogenes [69,73,74,75]. On these lines, various studies carried out in recent years revealed that 100% of the isolates of L. monocytogenes investigated were capable of forming biofilms on the surfaces tested [6,72,76,77,78]. Among other factors, such discrepancies between studies may be due to the varying origins of isolates, the employment of different strains, or the use of differing techniques, surface materials, or both.
One striking fact is that all the strains classified as strong or moderate biofilm producers (15.5%) were isolated from wings or drumsticks from establishments E3, E6 or E8. Indeed, the isolates from establishment E8 had a high average value of OD580 (1.73 ± 0.84). The greater capacity to form biofilm found among the strains isolated in samples from outlet E8 may be an outcome of cross-contamination produced by contact with the surfaces in that establishment, since biofilms are a frequent cause of contamination of food during processing [6].

4.6. Antibiotic Resistance

The susceptibility of the 45 L. monocytogenes isolates from cuts of poultry was tested against 15 antibiotics of clinical interest. All the isolates presented either resistance or reduced susceptibility to OX, FOX, CTX, FEP and CIP. Percentages clearly over 50% were observed for F (55.3%) and ENR (51.1%). For the remaining antibiotics, the percentages of strains that were resistant or had reduced susceptibility varied between 0.0% and 22.2%. In previous studies carried out with poultry meat preparations [12] and with poultry carcasses and portions [37,79], strains of L. monocytogenes resistant to these antibiotics were also found. This fact is worrying, since some of these substances are used for the treatment of listeriosis.
The extent of prevalence of susceptibility to ampicillin, to which 100% of strains were susceptible, is reassuring, since this is the drug of first choice, whether used alone or in combination with gentamycin, in treating human listeriosis [79]. These data are fully consistent with previous studies carried out on strains isolated from chicken meat from north-western Spain, in which no strain with reduced susceptibility or susceptibility to ampicillin was found [37]. In addition, among alternatives for the treatment of listeriosis would be the administration of erythromycin, vancomycin, trimethoprim-sulfamethoxazole, rifampicin, tetracycline and chloramphenicol [79]. These are drugs that in the present study met with some resistance or reduced susceptibility in isolates, with figures ranging between 2.38% and 52.38% of the total.
There was a high average number of resistances per strain: 5.11 ± 1.30 when resistance in the strict sense was considered, and 6.91 ±1.59 when resistance and reduced susceptibility were taken together. This shows a significant increase in comparison with previous studies, in which the mean values for resistance to antibiotics were 1.60 in 1993 and 4.24 in 2006 [37]. Hence, the results of the research being reported here confirm an increase in prevalence in L. monocytogenes of resistance to antibiotics occurring over recent years [47]. This would appear to be due primarily to the acquisition of mobile genetic elements, such as plasmids or transposons, through horizontal transfer mechanisms [80].
The high prevalence of antibiotic-resistant bacteria in foodstuffs of animal origin, which was observed in most of the research works performed in the last years, is most likely related to the use of antibiotics in animal production. This has had a great impact on microbial populations and has triggered the selection and proliferation of resistant bacteria, as has previously been suggested [81]. It must be noted that a great prevalence of resistance to antibiotics widely employed in animal production has been observed in the present work [82,83,84]. The resistance to substances whose use has been prohibited for decades in food-producing animals (e.g., nitrofurantoin) might be due to mechanisms for cross-resistance or co-resistance, which may have contributed to the persistence over time of genes for resistance to this compound [85,86].
The considerable levels of resistance observed in this study are a cause for concern, since resistance to antibiotics compromises the usefulness of these compounds as a therapeutic option, representing a significant challenge for public health [87]. On these lines, it should be noted that infections by multi-resistant bacteria not only increase morbidity and mortality rates, but also cause a considerable increase in the costs arising from medical treatments [88,89].

4.7. Relationships between Virulence Factors

The correlation values observed between the variables studied were low, with only weak values being found for the links between the percentage of resistance to antibiotics of each isolate and its potential for biofilm formation (OD580) (r = 0.227), and between the potential for biofilm formation and the percentage of virulence genes detected (r = 0.152). So, it cannot be stated that the greater the potential for biofilm formation, the greater also the percentage of resistance to antibiotics. These results do not coincide with what was expected, since the formation of biofilms promotes resistance to antibiotics in bacteria. In addition, biofilms are an environment that favors the transfer of genes and the appearance of adaptive mutations [90,91,92].
On the other hand, no correlation was demonstrated between the percentage of resistance to antibiotics and that for virulence genes in the isolates (r = 0.098). It should be noted that higher correlation values were expected, since the three variables in question are directly related to the pathogenicity of L. monocytogenes [23,93].

5. Conclusions

Raw poultry meat is an important reservoir of L. monocytogenes, in terms both of prevalence and of concentration. The v-PCR method is a useful technique for the rapid detection and quantification of L. monocytogenes in food. Additionally, it allows a distinction to be made between total and viable cells, whether culturable or not, thus making it possible to determine the concentration of bacteria with the potential to cause illness. On the other hand, the presence in chicken meat of strains with a high prevalence of virulence genes, with potential for biofilm formation, and with multiple resistances to antibiotics are worrying in the context of food safety and public health. The results from this study emphasize how crucial it is to maintain correct hygiene practices during the processing of poultry, so as to prevent retail establishments from becoming a reservoir of L. monocytogenes strains with a strong potential for virulence. Furthermore, it is vital to avoid undercooking chicken meat and to prevent cross-contamination events in order to reduce the risk of human listeriosis.

Author Contributions

Conceptualization, S.P.-M. and R.C.; methodology, S.P.-M. and R.C.; validation, R.C. and C.A.-C.; formal analysis, S.P.-M. and C.G.-F.; investigation, S.P.-M., C.G.-F., R.C. and C.A.-C.; resources, R.C. and C.A.-C.; data curation, S.P.-M., C.G.-F. and C.A.-C.; writing—original draft preparation, S.P.-M. and R.C.; writing—review and editing, S.P.-M., R.C. and C.A.-C.; supervision, R.C. and C.A.-C.; project administration, R.C. and C.A.-C.; funding acquisition, R.C. and C.A.-C. All authors have read and agreed to the published version of the manuscript.

Funding

This research was funded by the Junta de Castilla y León (Consejería de Educación, Spain, grant number LE018P20) and the Ministerio de Ciencia e Innovación (Spain, grant numbers RTI2018-098267-R-C33 and PID2022-142329OB-C31). Sarah Panera-Martínez is the recipient of a predoctoral research fellowship from the Junta de Castilla y León (Consejería de Educación, Spain) co-financed by the European Social Fund.

Institutional Review Board Statement

Not applicable.

Informed Consent Statement

Not applicable.

Data Availability Statement

The data presented in this study are available on request from the corresponding author. The data are not publicly available due to confidentiality issues.

Conflicts of Interest

The authors declare no conflict of interest.

References

  1. Nwaiwu, O. An overview of Listeria species in Nigeria. Int. Food Res. J. 2015, 22, 455–464. [Google Scholar]
  2. Rodríguez-Melcón, C.; Alonso-Calleja, C.; García-Fernández, C.; Carballo, J.; Capita, R. Minimum inhibitory concentration (MIC) and minimum bactericidal concentration (MBC) for twelve antimicrobials (biocides and antibiotics) in eight strains of Listeria monocytogenes. Biology 2022, 11, 46. [Google Scholar] [CrossRef] [PubMed]
  3. Hellberg, R.S.; Martin, K.G.; Keys, A.L.; Haney, C.J.; Shen, Y.; Smiley, R.D. 16S rRNA partial gene sequencing for the differentiation and molecular subtyping of Listeria species. Food Microbiol. 2013, 36, 231–240. [Google Scholar] [CrossRef] [PubMed]
  4. Liu, D.; Ainsworth, A.J.; Austin, F.W.; Lawrence, M.L. Identification of Listeria innocua by PCR targeting a putative transcriptional regulator gene. FEMS Microbiol. Lett. 2003, 223, 205–210. [Google Scholar] [CrossRef]
  5. Swaminathan, B.; Gerner-Smidt, P. The epidemiology of human listeriosis. Microbes Infect. 2007, 9, 1236–1243. [Google Scholar] [CrossRef]
  6. Quereda, J.J.; Morón-García, A.; Palacios-Gorba, C.; Dessaux, C.; García-del Portillo, F.; Pucciarelli, M.G.; Ortega, A.D. Pathogenicity and virulence of Listeria monocytogenes: A trip from environmental to medical microbiology. Virulence 2021, 12, 2509–2545. [Google Scholar] [CrossRef]
  7. Ryser, E.T.; Marth, E.H. Listeria, Listeriosis, and Food Safety, 3rd ed.; CRC Press: Boca Raton, FL, USA, 2007. [Google Scholar]
  8. Ragon, M.; Wirth, T.; Hollandt, F.; Lavenir, R.; Lecuit, M.; Le Monnier, A.; Brisse, S. A new perspective on Listeria monocytogenes evolution. PLoS Pathog. 2008, 4, e1000146. [Google Scholar] [CrossRef]
  9. Ryu, J.; Park, S.H.; Yeom, Y.S.; Shrivastav, A.; Lee, S.H.; Kim, Y.R.; Kim, H.Y. Simultaneous detection of Listeria species isolated from meat processed foods using multiplex PCR. Food Control 2013, 32, 659–664. [Google Scholar] [CrossRef]
  10. Barocci, S.; Calza, L.; Blasi, G.; Briscolini, S.; De Curtis, M.; Palombo, B.; Cucco, L.; Postacchini, M.; Sabbatini, M.; Graziosi, T.; et al. Evaluation of a rapid molecular method for detection of Listeria monocytogenes directly from enrichment broth media. Food Control 2008, 19, 750–756. [Google Scholar] [CrossRef]
  11. Ferrentino, G.; Tamburini, S.; Bath, K.; Foladori, P.; Spilimbergo, S.; Jousson, O. Application of culture-independent methods for monitoring Listeria monocytogenes inactivation on food products. Process Biochem. 2015, 50, 188–193. [Google Scholar] [CrossRef]
  12. Panera-Martínez, S.; Rodríguez-Melcón, C.; Serrano-Galán, V.; Alonso-Calleja, C.; Capita, R. Prevalence, quantification and antibiotic resistance of Listeria monocytogenes in poultry preparations. Food Control 2022, 135, 108608. [Google Scholar] [CrossRef]
  13. Josephson, K.L.; Gerba, C.P.; Pepper, I.L. Polymerase chain reaction detection of nonviable bacterial pathogens. Appl. Environ. Microbiol. 1993, 59, 3513–3515. [Google Scholar] [CrossRef] [PubMed]
  14. Klein, D. Quantification using real-time PCR technology: Applications and limitations. Trends Mol. Med. 2002, 8, 257–260. [Google Scholar] [CrossRef]
  15. Nkuipou-Kenfack, E.; Engel, H.; Fakih, S.; Nocker, A. Improving efficiency of viability-PCR for selective detection of live cells. J. Microbiol. Methods 2013, 93, 20–24. [Google Scholar] [CrossRef] [PubMed]
  16. Nocker, A.; Cheung, C.Y.; Camper, A.K. Comparison of propidium monoazide with ethidium monoazide for differentiation of live vs. dead bacteria by selective removal of DNA from dead cells. J. Microbiol. Methods 2006, 67, 310–320. [Google Scholar] [CrossRef] [PubMed]
  17. Soejima, T.; Iida, K.I.; Qin, T.; Taniai, H.; Seki, M.; Takade, A.; Yoshida, S.I. Photoactivated ethidium monoazide directly cleaves bacterial DNA and is applied to PCR for discrimination of live and dead bacteria. Microbiol. Immunol. 2007, 51, 763–775. [Google Scholar] [CrossRef]
  18. Nogva, H.K.; Drømtorp, S.M.; Nissen, H.; Rudi, K. Ethidium monoazide for DNA-based differentiation of viable and dead bacteria by 5′-nuclease PCR. BioTechniques 2003, 34, 804–813. [Google Scholar] [CrossRef]
  19. Rey, M.D.L.Á.; Cap, M.; Favre, L.C.; Rodríguez Racca, A.; Dus Santos, M.J.; Vaudagna, S.R.; Mozgovoj, M. Evaluation of PMA-qPCR methodology to detect and quantify viable Shiga toxin-producing Escherichia coli in beef burgers. J. Food Process. Preserv. 2021, 45, e15338. [Google Scholar] [CrossRef]
  20. Casadevall, A.; Pirofski, L.A. Host-pathogen interactions: Redefining the basic concepts of virulence and pathogenicity. Infect. Immun. 1999, 67, 3703–3713. [Google Scholar] [CrossRef]
  21. Johnson, D.I. Bacterial Pathogens and Their Virulence Factors, Bacterial Pathogens and Their Virulence Factors; Springer: Cham, Switzerland, 2018. [Google Scholar]
  22. Kubori, T.; Nagai, H. The Type IVB secretion system: An enigmatic chimera. Curr. Opin. Microbiol. 2016, 29, 22–29. [Google Scholar] [CrossRef]
  23. Colautti, A.; Arnoldi, M.; Comi, G.; Iacumin, L. Antibiotic resistance and virulence factors in lactobacilli: Something to carefully consider. Food Microbiol. 2022, 103, 103934. [Google Scholar] [CrossRef] [PubMed]
  24. Selvan, P.; Narendra Babu, R.; Sureshkumar, S.; Venkataramanujam, V. Microbial quality of retail meat products available in Chennai city. Am. J. Food Technol. 2007, 2, 55–59. [Google Scholar] [CrossRef]
  25. Glaser, P.; Frangeul, L.; Buchrieser, C.; Rusniok, C.; Amend, A.; Baquero, F.; Berche, P.; Bloecker, H.; Brandt, P.; Chakraborty, T.; et al. Comparative genomics of Listeria species. Science 2001, 294, 849–852. [Google Scholar] [CrossRef] [PubMed]
  26. Capita, R.; Alonso-Calleja, C.; Moreno, B.; García-Fernández, M.C. Occurrence of Listeria species in retail poultry meat and comparison of a cultural/immunoassay for their detection. Int. J. Food Microbiol. 2001, 65, 75–82. [Google Scholar] [CrossRef]
  27. Arslan, S.; Baytur, S. Prevalence and antimicrobial resistance of Listeria species and subtyping and virulence factors of Listeria monocytogenes from retail meat. J. Food Saf. 2019, 39, e12578. [Google Scholar] [CrossRef]
  28. Díez-García, M.; Capita, R.; Alonso-Calleja, C. Influence of serotype on the growth kinetics and the ability to form biofilms of Salmonella isolates from poultry. Food Microbiol. 2012, 31, 173–180. [Google Scholar] [CrossRef]
  29. Stepanović, S.; Ćirković, I.; Ranin, L.; Švabić-Vlahović, M. Biofilm formation by Salmonella spp. and Listeria monocytogenes on plastic surface. Lett. Appl. Microbiol. 2004, 38, 428–432. [Google Scholar] [CrossRef]
  30. CLSI. Performance Standards for Antimicrobial Susceptibility Testing, 28th ed.; Clinical and Laboratory Standars Institute: Wayne, PA, USA, 2018. [Google Scholar]
  31. EUCAST. The European Committee on Antimicrobial Susceptibility Testing. Breakpoint Tables for Interpretation of MICs and Zone Diameters. Version 10.0. 2020. Available online: http://www.eucast.org (accessed on 17 February 2023).
  32. CLSI. Performance Standards for Antimicrobial Disk and Dilution Susceptibility Tests for Bacteria Isolated from Animals, 4th ed.; CLSI supplement VET08; Clinical and Laboratory Standars Institute: Wayne, PA, USA, 2018. [Google Scholar]
  33. Magiorakos, A.P.; Srinivasan, A.; Carey, R.B.; Carmeli, Y.; Falagas, M.E.; Giske, C.G.; Harbarth, S.; Hindler, J.F.; Kahlmeter, G.; Olsson-Liljequist, B.; et al. Multidrug-resistant, extensively drug-resistant and pandrug-resistant bacteria: An international expert proposal for interim standard definitions for acquired resistance. Clin. Microbiol. Infect. 2012, 18, 268–281. [Google Scholar] [CrossRef]
  34. Cohen, J. Statistical Power Analysis for the Behavioral Sciences, 2nd ed.; Lawewnce Erlbaum Associates: New York, NY, USA, 1988. [Google Scholar]
  35. Hernández Lalinde, J.D.; Espinosa Castro, F.; Rodríguez, J.E.; Chacón Rangel, J.G.; Toloza Sierra, C.A.; Arenas Torrado, M.K.; Carrillo Sierra, S.M.; Bermúdez Pirela, V.J. Sobre el uso adecuado del coeficiente de correlación de Pearson: Definición, propiedades y suposiciones. Arch. Venez. Farmacol. Ter. 2018, 37, 587–595. [Google Scholar]
  36. RStudio Team. RStudio: Integrated Development for R; RStudio, Inc.: Boston, MA, USA, 2019; Available online: http://www.rstudio.com/ (accessed on 17 February 2023).
  37. Alonso-Hernando, A.; Prieto, M.; García-Fernández, C.; Alonso-Calleja, C.; Capita, R. Increase over time in the prevalence of multiple antibiotic resistance among isolates of Listeria monocytogenes from poultry in Spain. Food Control 2012, 23, 37–41. [Google Scholar] [CrossRef]
  38. Gonçalves-Tenório, A.; Nunes Silva, B.; Rodrigues, V.; Cadavez, V.; Gonzales-Barron, U. Prevalence of pathogens in poultry meat: A meta-analysis of European published surveys. Foods 2018, 7, 69. [Google Scholar] [CrossRef] [PubMed]
  39. Amajoud, N.; Leclercq, A.; Soriano, J.M.; Bracq-Dieye, H.; El Maadoudi, M.; Senhaji, N.S.; Kounnoun, A.; Moura, A.; Lecuit, M.; Abrini, J. Prevalence of Listeria spp. and characterization of Listeria monocytogenes isolated from food products in Tetouan, Morocco. Food Control 2018, 84, 436–441. [Google Scholar] [CrossRef]
  40. Tao, T.; Chen, Q.; Bie, X.; Lu, F.; Lu, Z. Investigation on prevalence of Listeria spp. and Listeria monocytogenes in animal-derived foods by multiplex PCR assay targeting novel genes. Food Control 2017, 73, 704–711. [Google Scholar] [CrossRef]
  41. Zeinali, T.; Jamshidi, A.; Bassami, M.; Rad, M. Isolation and identification of Listeria spp. in chicken carcasses marketed in northeast of Iran. Int. Food Res. J. 2017, 24, 881–887. [Google Scholar]
  42. Soultos, N.; Koidis, P.; Madden, R.H. Presence of Listeria and Salmonella spp. in retail chicken in Northern Ireland. Lett. Appl. Microbiol. 2003, 37, 421–423. [Google Scholar] [CrossRef] [PubMed]
  43. Vitas, A.I.; Aguado, V.; Garcia-Jalon, I. Occurrence of Listeria monocytogenes in fresh and processed foods in Navarra (Spain). Int. J. Food Microbiol. 2004, 90, 349–356. [Google Scholar] [CrossRef]
  44. Rodríguez-Melcón, C.; Esteves, A.; Panera-Martínez, S.; Capita, R.; Alonso-Calleja, C. Quantification of total and viable cells and determination of serogroups and antibiotic resistance patterns of Listeria monocytogenes in chicken meat from the North-Western Iberian peninsula. Antibiotics 2022, 11, 1828. [Google Scholar] [CrossRef]
  45. Aziz, S.A.A.A.; Mohamed, M.B.E.D. Prevalence, virulence genes, and antimicrobial resistance profile of Listeria monocytogenes isolated from retail poultry shops in Beni-Suef city, Egypt. J. Adv. Vet. Anim. Res. 2002, 7, 710–717. [Google Scholar] [CrossRef]
  46. Bilir Ormanci, F.S.; Erol, I.; Ayaz, N.D.; Iseri, O.; Sariguzel, D. Immunomagnetic separation and PCR detection of Listeria monocytogenes in turkey meat and antibiotic resistance of the isolates. Br. Poult. Sci. 2008, 49, 560–565. [Google Scholar] [CrossRef]
  47. Fallah, A.A.; Saei-Dehkordi, S.S.; Rahnama, M.; Tahmasby, H.; Mahzounieh, M. Prevalence and antimicrobial resistance patterns of Listeria species isolated from poultry products marketed in Iran. Food Control 2012, 28, 327–332. [Google Scholar] [CrossRef]
  48. Kanarat, S.; Jitnupong, W.; Sukhapesna, J. Prevalence of Listeria monocytogenes in chicken production chain in Thailand. Thai J. Vet. Med. 2011, 41, 155–161. [Google Scholar] [CrossRef]
  49. Kuan, C.H.; Goh, S.G.; Loo, Y.Y.; Chang, W.S.; Lye, Y.L.; Tang, J.Y.H.; Nakaguchi, Y.; Nishibuchi, M.; Mahyudin, N.A.; Radu, S. Prevalence and quantification of Listeria monocytogenes in chicken offal at the retail level in Malaysia. Poult. Sci. 2013, 92, 1664–1669. [Google Scholar] [CrossRef] [PubMed]
  50. Osaili, T.M.; Alaboudi, A.R.; Nesiar, E.A. Prevalence of Listeria spp. and antibiotic susceptibility of Listeria monocytogenes isolated from raw chicken and ready-to-eat chicken products in Jordan. Food Control 2011, 22, 586–590. [Google Scholar] [CrossRef]
  51. Saludes, M.; Troncoso, M.; Figueroa, G. Presence of Listeria monocytogenes in Chilean food matrices. Food Control 2015, 50, 331–335. [Google Scholar] [CrossRef]
  52. Santos Oliveira, T.; Milen Varjão, L.; Nunes da Silva, L.N.; de Castro Lisboa Pereira, R.; Hofer, E.; Vallim, D.C.; de Castro Almeida, R.C. Listeria monocytogenes at chicken slaughterhouse: Occurrence, genetic relationship among isolates and evaluation of antimicrobial susceptibility. Food Control 2018, 88, 131–138. [Google Scholar] [CrossRef]
  53. Sugiri, Y.D.; Gölz, G.; Meeyam, T.; Baumann, M.P.O.; Kleer, J.; Chaisowwong, W.; Alter, T. Prevalence and antimicrobial susceptibility of Listeria monocytogenes on chicken carcasses in Bandung, Indonesia. J. Food Prot. 2014, 77, 1407–1410. [Google Scholar] [CrossRef]
  54. Carpentier, B.; Cerf, O. Review—Persistence of Listeria monocytogenes in food industry equipment and premises. Int. J. Food Microbiol. 2011, 145, 1–8. [Google Scholar] [CrossRef]
  55. Yang, Y.; Liu, Y.; Shu, Y.; Xia, W.; Xu, R.; Chen, Y. Modified PMA-qPCR method for rapid quantification of viable Lactobacillus spp. in fermented dairy products. Food Anal. Methods 2021, 14, 1908–1918. [Google Scholar] [CrossRef]
  56. Rantsiou, K.; Alessandria, V.; Urso, R.; Dolci, P.; Cocolin, L. Detection, quantification and vitality of Listeria monocytogenes in food as determined by quantitative PCR. Int. J. Food Microbiol. 2008, 121, 99–105. [Google Scholar] [CrossRef]
  57. Rørvik, L.M.; Yndestad, M. Listeria monocytogenes in foods in Norway. Int. J. Food Microbiol. 1991, 13, 97–104. [Google Scholar] [CrossRef]
  58. Kragh, M.L.; Thykier, M.; Truelstrup Hansen, L. A long-amplicon quantitative PCR assay with propidium monoazide to enumerate viable Listeria monocytogenes after heat and desiccation treatments. Food Microbiol. 2020, 86, 103310. [Google Scholar] [CrossRef] [PubMed]
  59. Zhong, Q.; Tian, J.; Wang, B.; Wang, L. PMA based real-time fluorescent LAMP for detection of Vibrio parahaemolyticus in viable but nonculturable state. Food Control 2016, 63, 230–238. [Google Scholar] [CrossRef]
  60. Anwar, T.M.; Pan, H.; Chai, W.; Ed-Dra, A.; Fang, W.; Li, Y.; Yue, M. Genetic diversity, virulence factors, and antimicrobial resistance of Listeria monocytogenes from food, livestock, and clinical samples between 2002 and 2019 in China. Int. J. Food Microbiol. 2022, 366, 109572. [Google Scholar] [CrossRef] [PubMed]
  61. Cossart, P.; Pizarro-Cerda, J.; Lecuit, M. Invasion of mammalian cells by Listeria monocytogenes: Functional mimicry to subvert cellular functions. Trends Cell Biol. 2023, 13, 23–31. [Google Scholar] [CrossRef]
  62. Dramsi, S.; Dehoux, P.; Lebrun, M.; Goossens, P.L.; Cossart, P. Identification of four new members of the internalin multigene family of Listeria monocytogenes EGD. Infect. Immun. 1997, 65, 1615–1625. [Google Scholar] [CrossRef]
  63. Gaillard, J.L.; Berche, P.; Frehel, C.; Gouln, E.; Cossart, P. Entry of L. monocytogenes into cells is mediated by internalin, a repeat protein reminiscent of surface antigens from gram-positive cocci. Cell 1991, 65, 1127–1141. [Google Scholar] [CrossRef]
  64. Kocks, C.; Gouin, E.; Tabouret, M.; Berche, P.; Ohayon, H.; Cossart, P.L. L. monocytogenes-induced actin assembly requires the actA gene product, a surface protein. Cell 1992, 68, 521–531. [Google Scholar] [CrossRef]
  65. de Souza Santos, M.; Orth, K. Subversion of the cytoskeleton by intracellular bacteria: Lessons from Listeria, Salmonella and Vibrio. Cell. Microbiol. 2015, 17, 164–173. [Google Scholar] [CrossRef]
  66. Furrer, B.; Candrian, U.; Hoefelein, C.; Luethy, J. Detection and identification of Listeria monocytogenes in cooked sausage products and in milk by in vitro amplification of haemolysin gene fragments. J. Appl. Bacteriol. 1991, 70, 372–379. [Google Scholar] [CrossRef]
  67. Portnoy, D.A.; Chakraborty, T.; Goebel, W.; Cossart, P. Molecular determinants of Listeria monocytogenes pathogenesis. Infect. Immun. 1992, 60, 1263–1267. [Google Scholar] [CrossRef]
  68. Rabinovich, L.; Sigal, N.; Borovok, I.; Nir-Paz, R.; Herskovits, A.A. Prophage excision activates Listeria competence genes that promote phagosomal escape and virulence. Cell 2012, 150, 792–802. [Google Scholar] [CrossRef] [PubMed]
  69. Kayode, A.J.; Okoh, A.I. Assessment of the molecular epidemiology and genetic multiplicity of Listeria monocytogenes recovered from ready-to-eat foods following the South African listeriosis outbreak. Sci. Rep. 2022, 12, 20129. [Google Scholar] [CrossRef]
  70. Barbosa, J.; Borges, S.; Camilo, R.; Magalhães, R.; Ferreira, V.; Santos, I.; Silva, J.; Almeida, G.; Teixeira, P. Biofilm formation among clinical and food isolates of Listeria monocytogenes. Int. J. Microbiol. 2013, 2013, 524975. [Google Scholar] [CrossRef]
  71. Harvey, J.; Keenan, K.P.; Gilmour, A. Assessing biofilm formation by Listeria monocytogenes strains. Food Microbiol. 2007, 24, 380–392. [Google Scholar] [CrossRef] [PubMed]
  72. Rodrigues, L.B.; dos Santos, L.R.; Tagliari, V.Z.; Rizzo, N.N.; Trenhago, G.; de Oliveira, A.P.; Goetz, F.; do Nascimento, V.P. Quantification of biofilm production on polystyrene by Listeria, Escherichia coli and Staphylococcus aureus isolated from a poultry slaughterhouse. Braz. J. Microbiol. 2010, 41, 1082–1085. [Google Scholar] [CrossRef] [PubMed]
  73. Chavant, P.; Martinie, B.; Meylheuc, T.; Hebraud, M. Listeria monocytogenes LO28: Surface physicochemical properties and ability to form biofilms at different temperatures and growth phases. Appl. Environ. Microbiol. 2002, 68, 728–737. [Google Scholar] [CrossRef]
  74. Guilbaud, M.; Piveteau, P.; Desvaux, M.; Brisse, S. Exploring the diversity of Listeria monocytogenes biofilm architecture by high-throughput confocal laser scanning microscopy and the predominance of the honeycomb-like morphotype. Appl. Environ. Microbiol. 2014, 81, 1813. [Google Scholar] [CrossRef] [PubMed]
  75. Torlak, E.; Sert, D. Combined effect of benzalkonium chloride and ultrasound against Listeria monocytogenes biofilm on plastic surface. Lett. Appl. Microbiol. 2013, 57, 220–226. [Google Scholar] [CrossRef]
  76. Rodríguez-Melcón, C.; Riesco-Peláez, F.; Carballo, J.; García-Fernández, C.; Capita, R.; Alonso-Calleja, C. Structure and viability of 24- and 72-h-old biofilms formed by four pathogenic bacteria on polystyrene and glass contact surfaces. Food Microbiol. 2018, 76, 513–517. [Google Scholar] [CrossRef]
  77. Rodríguez-Melcón, C.; Riesco-Peláez, F.; García-Fernández, C.; Alonso-Calleja, C.; Capita, R. Susceptibility of Listeria monocytogenes planktonic cultures and biofilms to sodium hypochlorite and benzalkonium chloride. Food Microbiol. 2019, 82, 533–540. [Google Scholar] [CrossRef]
  78. Kadam, S.R.; Den Besten, H.M.W.; Van Der Veen, S.; Zwietering, M.H.; Moezelaar, R.; Abee, T. Diversity assessment of Listeria monocytogenes biofilm formation: Impact of growth condition, serotype and strain origin. Int. J. Food Microbiol. 2013, 165, 259–264. [Google Scholar] [CrossRef] [PubMed]
  79. Capita, R.; Felices-Mercado, A.; García-Fernández, C.; Alonso-Calleja, C. Characterization of Listeria monocytogenes originating from the Spanish meat-processing chain. Foods 2019, 8, 542. [Google Scholar] [CrossRef] [PubMed]
  80. González-Gutiérrez, M.; García-Fernández, C.; Alonso-Calleja, C.; Capita, R. Microbial load and antibiotic resistance in raw beef preparations from northwest Spain. Food Sci. Nutr. 2020, 8, 777–785. [Google Scholar] [CrossRef] [PubMed]
  81. Cameron, A.; McAllister, A.A. Antimicrobial usage and resistance in beef production. J. Anim. Sci. Biotechnol. 2016, 7, 68. [Google Scholar] [CrossRef]
  82. De Briyne, N.; Atkinson, J.; Pokludová, L.; Borriello, S.P. Antibiotics used most commonly to treat animals in Europe. Vet. Rec. 2014, 175, 325. [Google Scholar] [CrossRef]
  83. Roth, N.; Käsbohrer, A.; Mayrhofer, S.; Zitz, U.; Hofacre, C.; Doming, K.J. The application of antibiotics in broiler production and the resulting antibiotic resistance in Escherichia coli: A global overview. Poult. Sci. 2019, 98, 1791–1804. [Google Scholar] [CrossRef]
  84. Capita, R.; Álvarez-Fernández, E.; Fernández-Buelta, E.; Manteca, J.; Alonso-Calleja, C. Decontamination treatments can increase the prevalence of resistance to antibiotics of Escherichia coli naturally present on poultry. Food Microbiol. 2013, 34, 112–117. [Google Scholar] [CrossRef]
  85. Álvarez-Fernández, E.; Cancelo, A.; Díaz-Vega, C.; Capita, R.; Alonso-Calleja, C. Antimicrobial resistance in E. coli isolates from conventionally and organically reared poultry: A comparison of agar disc diffusion and Sensi Test Gram-negative methods. Food Control 2013, 30, 227–234. [Google Scholar] [CrossRef]
  86. Olaimat, A.N.; Al-Holy, M.A.; Shahbaz, H.M.; Al-Nabulsi, A.A.; Abu Ghoush, M.H.; Osaili, T.M.; Ayyash, M.M.; Holley, R.A. Emergence of antibiotic resistance in Listeria monocytogenes isolated from food products: A comprehensive review. Compr. Rev. Food Sci. Food Saf. 2018, 17, 1277–1292. [Google Scholar] [CrossRef]
  87. Capita, R.; Alonso-Calleja, C. Antibiotic-resistant bacteria: A challenge for the food industry. Crit. Rev. Food Sci. Nutr. 2013, 5, 11–48. [Google Scholar] [CrossRef]
  88. Cosgrove, S.E. The relationship between antimicrobial resistance and patient outcomes: Mortality, length of hospital stay, and health care costs. Clin. Infect. Dis. 2006, 42 (Suppl. 2), S82–S89. [Google Scholar] [CrossRef]
  89. Capita, R.; Vicente-Velasco, M.; Rodríguez-Melcón, C.; García-Fernández, C.; Carballo, J.; Alonso-Calleja, C. Effect of low doses of biocides on the antimicrobial resistance and the biofilms of Cronobacter sakazakii and Yersinia enterocolitica. Sci. Rep. 2019, 9, 15905. [Google Scholar] [CrossRef] [PubMed]
  90. Di Ciccio, P.; Conter, M.; Zanardi, E.; Ghidini, S.; Vergara, A.; Paludi, D.; Festino, A.R.; Ianieri, A. Listeria monocytogenes: Biofilms in food processing. Ital. J. Food Sci. 2014, 24, 203–213. [Google Scholar]
  91. Nourbakhsh, F.; Sadat, M.; Amineh, N.; Tajani, S.; Soheili, V. Bacterial biofilms and their resistance mechanisms: A brief look at treatment with natural agents. Folia Microbiol. 2022, 67, 535–554. [Google Scholar] [CrossRef] [PubMed]
  92. Wu, S.; Liu, F.; Zhu, K.; Shen, J. Natural products that target virulence factors in antibiotic resistant Staphylococcus aureus. J. Agric. Food Chem. 2019, 67, 13195–13211. [Google Scholar] [CrossRef]
  93. Roy, P.K.; Song, M.G.; Park, S.Y. The inhibitory effect of quercetin on biofilm formation of Listeria monocytogenes mixed culture and repression of virulence. Antioxidants 2022, 11, 1733. [Google Scholar] [CrossRef]
Figure 1. Definitions and calculations for sensitivity, specificity, efficiency, and kappa coefficient for the v-PCR technique used in detecting viable cells of Listeria monocytogenes in poultry: (1) OCLA&PCR, isolation using the culture-dependent method ISO 11290-1 involving streak plating on OCLA and identification of presumptive colonies by polymerase chain reaction (PCR); (2) quantitative PCR detection (v-PCR), using the viability marker propidium monoazide (PMAxx).
Microorganisms 11 02232 g001
Figure 2. Prevalence of Listeria spp. and Listeria monocytogenes relative to type of sample (upper graph) and establishment where purchased (lower graph). The columns in the same graph for the same type of sample or the same establishment (the prevalence values for Listeria spp. and L. monocytogenes were compared) that do not share any letter present significant differences one from another (p < 0.05).
Microorganisms 11 02232 g002
Figure 3. Box and Whisker graph showing concentrations of Listeria monocytogenes (log10 cfu/g) by type of sample and treatment used: total cells (without PMA) and viable cells (with PMA). The boxes run from the 25 to the 75 percentile and are intersected by the median line. The average value is marked inside each box with a cross (×). The whiskers range from the lowest to the highest value of each sample. The values for the same type of sample (concentrations of total cells and viable cells were compared) not sharing any letter present significant differences (p < 0.05).
Microorganisms 11 02232 g003
Figure 4. Box and Whisker graph showing concentrations of Listeria monocytogenes (log10 cfu/g) by establishment and treatment used: total cells (without PMA) and viable cells (with PMA). The boxes run from the 25 to the 75 percentile and are intersected by the median line. The average value is marked inside each box with a cross (×). The whiskers range from the lowest to the highest value for each sample. Establishments E2, E4 and E5 were excluded because no positive samples (E2 and E4) or only one positive sample (E5) were found by q-PCR. The values for the same type of sample (concentrations of total cells and viable cells were compared) not sharing any letter present significant differences (p < 0.05).
Microorganisms 11 02232 g004
Figure 5. Agarose gels (1.5%) with results from PCR. The genes are (A) hlyA, (B) actA, (C) inlB, (D) inlA, inlC and inlJ, (E) prfA and plcA, and (F) iap. Within each image (AF) are displayed 7 lanes, from left to right: the size marker (from 0.25 to 10 kb), the negative control and the results obtained from five isolates.
Microorganisms 11 02232 g005
Figure 6. Percentage of samples having virulence genes inlA, inlB, plcA and prfA by type of sample (left-hand graph) and outlet (right-hand graph). Columns in each graph for the same type of cut or the same establishment (the prevalence of the four virulence genes were compared) not sharing any letter present significant differences one from another (p < 0.05). No L. monocytogenes strains were isolated from establishments E2, E4 and E5.
Microorganisms 11 02232 g006
Figure 7. Percentages of Listeria monocytogenes isolates classified on the basis of their potential for biofilm formation, by type of sample (left-hand graph) and by establishment (right-hand graph).
Microorganisms 11 02232 g007
Figure 8. Percentage of isolates of Listeria monocytogenes showing resistance, reduced susceptibility or susceptibility to each antibiotic tested. AMP (ampicillin, 10 µg), OX (oxacillin, 1 µg), FOX (cefoxitin, 30 µg), CTX (cefotaxime, 30 µg), FEP (cefepime, 30 µg), CN (gentamycin, 10 µg), E (erythromycin, 15 µg), VA (vancomycin, 30 µg), SXT (trimethoprim-sulfamethoxazole, 25 µg), RD (rifampicin, 5 µg), TE (tetracycline, 30 µg), C (chloramphenicol, 30 µg), CIP (ciprofloxacin, 5 µg), ENR (enrofloxacin, 5 µg) and F (nitrofurantoin, 300 µg). Columns of the same color (resistant strains, those with reduced or intermediate susceptibility, and susceptible strains are compared separately) not sharing any letter present significant differences one from another (p < 0.05).
Microorganisms 11 02232 g008
Figure 9. Isolates of Listeria monocytogenes grouped by number of antibiotic resistances found. To the left are the strains with an MDR phenotype, separated according to the number of antibiotics to which they were resistant, and to the right are the strains having resistance to only two different categories of antibiotics. MDR is defined as an acquired non-susceptibility to at least one antibiotic in three or more categories of antimicrobials, one or more of which must be applied.
Microorganisms 11 02232 g009
Table 1. List of primers used, showing sequence, annealing temperature and size of amplified fragment [9].
GenePrimerSequence (5′ → 3′)Temp. (°C)Product Size (pb)
lmo1030FGCTTGTATTCACTTGGATTTGTCTGG62509
RACCATCCGCATATCTCAGCCAACT
lin0464FCGCATTTATCGCCAAAACTC60749
RTCGTGACATAGACGCGATTG
oxidoreductaseFGCGGATAAAGGTGTTCGGGTCAA62201
RATTTGCTATCGTCCGAGGCTAGG
lmo0333FGTACCTGCTGGGAGTACATA58673
RCTGTCTCCATATCCGTACAG
namAFCGAATTCCTTATTCACTTGAGC58463
RGGTGCTGCGAACTTAACTCA
prsFGCTGAAGAGATTGCGAAAGAAG58370
RCAAAGAAACCTTGGATTTGCGG
Table 2. List of primers used in detecting virulence factors, their sequence, the size of the amplified fragment, and concentrations used [27].
GenePrimerSequence (5′ → 3′)Product Size (bp)Concentration (µM)
hlyAFCCTAAGACGCCAATCGAA7020.50 each
RAAGCGCTTGCAACTGCTC
actAFGCTGATTTAAGAGATAGAGGAACA8270.50 each
RTTTATGTGGTTATTTGCTGTC
inlBFCTGGAAAGTTTGTATTTGGGAAA3430.50 each
RTTTCATAATCGCCATCATCACT
inlAFACGAGTAACGGGACAAATGC8000.25 each
RCCCGACAGTGGTGCTAGATT
inlCFAATTCCCACAGGACACAACC5170.20 each
RCGGGAATGCAATTTTTCACTA
inlJFTGTAACCCCCGCTTACACAGTT2380.15 each
RAGCGGCTTGGCAGTCTAATA
plcAFCTGCTTGAGCGTTCATGTCTCATCCCCC14840.20 each
RCATGGGTTTCACTCTCCTTCTAC
prfAFCTGTTGGAGCTCTTCTTGGTGAAGCAATCG10600.20 each
RAGCAACCTCGGTACCATATACTAACTC
iapFACAAGCTGCACCTGTTGCAG1310.50 each
RTGACAGCGTGTGTAGTAGCA
Table 3. Thermocycling programs used in amplification reactions.
ProgramsDenaturationCyclesElongation
hlyA94 °C/5 min30×94 °C/30 s50 °C/45 s72 °C/90 s72 °C/5 min
actA94 °C/2 min40×94 °C/180 s53 °C/60 s72 °C/120 s72 °C/5 min
inlB94 °C/2 min35×94 °C/45 s60 °C/45 s72 °C/90 s72 °C/8 min
inlA, inlC e inlJ94 °C/2 min30×94 °C/20 s55 °C/20 s72 °C/50 s72 °C/2 min
plcA y prfA95 °C/2 min35×95 °C/15 s60 °C/30 s72 °C/90 s72 °C/10 min
iap95 °C/2 min35×95 °C/15 s60 °C/30 s72 °C/90 s72 °C/10 min
Table 4. Results of quantification by q-PCR for total cells and viable cells from samples with Listeria monocytogenes. The samples are ordered from the lowest to highest concentration of viable cells.
Total Cells (without PMA)Viable Cells (with PMA)%Viable CellsOCLA&PCR
SampleCtng DNALog10 cfu/gCtng DNALog10 cfu/g
Breast139.240.0000062.40>40<0.000003<2.1556.4+
Wing138.980.0000072.49>40<0.000003<2.1546.3+
Breast238.700.0000082.58>40<0.000003<2.1537.5+
Thigh138.650.0000092.60>40<0.000003<2.1536.1+
Wing238.620.0000092.61>40<0.000003<2.1535.3+
Breast338.600.0000092.61>40<0.000003<2.1534.8
Thigh238.040.0000142.80>40<0.000003<2.1522.8
Wing337.890.0000152.85>40<0.000003<2.1520.4
Wing437.670.0000182.92>40<0.000003<2.1517.3+
Breast436.140.0000583.42>40<0.000003<2.155.4+
Drumstick136.130.0000583.42>40<0.000003<2.155.4+
Wing537.440.0000222.9939.990.0000032.1614.6
Drumstick237.870.0000162.8539.950.0000032.1720.8+
Wing637.670.0000182.9239.660.0000042.2722.3+
Wing738.610.0000092.6138.890.0000072.5281.0
Drumstick333.120.0005674.4138.090.0000132.782.3+
Drumstick434.630.0001813.9137.440.0000222.9912.0+
Drumstick534.500.0001993.9636.360.0000493.3524.6+
Drumstick635.230.0001153.7236.110.0000593.4351.7+
Drumstick730.660.0036285.2234.570.0001903.935.2+
Table 5. Antibiotic resistance patterns in forty-five Listeria monocytogenes isolates from cuts of poultry.
Pattern (Number of Isolates)Antibiotic
AMPOXFOXCTXFEPCNEVASXTRDTECCIPENRF
1 (19)SRRRRSSSSS/I *SSIS/I *S/I *
2 (1)SRRRRSSSRISSIII
3 (6)SRRRRSSSSRSSIS/I *S/I *
4 (3)SRRRRSSSSS/I *SSRS/I *S/I *
5 (1)SRRRRSSSSSSSIRS
6 (2)SRRRRSSSSSSSIS/I *R
7 (1)SRRRRSRSSISSIIR
8 (1)SRRRRSSSSRSSRII
9 (1)SRRRRSSSRRSSIII
10 (1)SRRRRSSSSRSSISR
11 (2)SRRRRSSSRS/I *SSIIR
12 (1)SRRRRSSSRISSRIR
13 (1)SRRRRSRSRRISIIS
14 (2)SRRRRSSSRRSSRIS
15 (1)SRRRRSRSSRSSRIR
16 (1)SRRRRSRSRRSSIIR
17 (1)SRRRRRSSRRSSRIR
AMP (ampicillin, 10 µg), OX (oxacillin, 1 µg), FOX (cefoxitin, 30 µg), CTX (cefotaxime, 30 µg), FEP (cefepime, 30 µg), CN (gentamycin, 10 µg), E (erythromycin, 15 µg), VA (vancomycin, 30 µg), SXT (trimethoprim-sulfamethoxazole, 25 µg), RD (rifampicin, 5 µg), TE (tetracycline, 30 µg), C (chloramphenicol, 30 µg), CIP (ciprofloxacin, 5 µg), ENR (enrofloxacin, 5 µg), F (nitrofurantoin, 300 µg). R = resistant; I = intermediate (reduced susceptibility); S = susceptible. *, different results were observed for the different isolates in each pattern.
Disclaimer/Publisher’s Note: The statements, opinions and data contained in all publications are solely those of the individual author(s) and contributor(s) and not of MDPI and/or the editor(s). MDPI and/or the editor(s) disclaim responsibility for any injury to people or property resulting from any ideas, methods, instructions or products referred to in the content.

