Article

Host-Associated Bacteroides 16S rDNA-Based Markers for Source Tracking of Fecal Pollution in Laguna Lake, Philippines

by
Gicelle T. Malajacan
1,
Mae Ashley G. Nacario
1,
Marie Christine M. Obusan
2 and
Windell L. Rivera
1,*
1
Pathogen-Host-Environment Interactions Research Laboratory, Institute of Biology, College of Science, University of the Philippines Diliman, Quezon City 1101, Philippines
2
Microbial Ecology of Terrestrial and Aquatic Systems Laboratory, Institute of Biology, College of Science, University of the Philippines Diliman, Quezon City 1101, Philippines
*
Author to whom correspondence should be addressed.
Microorganisms 2023, 11(5), 1142; https://doi.org/10.3390/microorganisms11051142
Submission received: 31 March 2023 / Revised: 23 April 2023 / Accepted: 25 April 2023 / Published: 27 April 2023
(This article belongs to the Special Issue Water Microorganisms Associated with Human Health)

Abstract

:
Sources of fecal contamination in Laguna Lake, Philippines, were identified using a library-independent microbial source tracking method targeting host-associated Bacteroides 16S rDNA-based markers. Water samples from nine lake stations were assessed for the presence of the fecal markers HF183 (human), BoBac (cattle), Pig-2-Bac (swine), and DuckBac (duck) from August 2019 to January 2020. HF183 (average concentration = 1.91 log10 copies/mL) was the most frequently detected, while Pig-2-Bac (average concentration = 2.47 log10 copies/mL) was the most abundant. The detected marker concentrations in different stations corresponded to the land use patterns around the lake. Generally, all marker concentrations were higher during the wet season (August–October), suggesting the effect of rainfall-associated factors on the movement and retention of markers from sources. There was a significant association (ρ = 0.45; p < 0.001) between phosphate and the concentration of HF183, suggesting domestic sewage-derived pollution. The markers had acceptable sensitivity and specificity, i.e., HF183 (S = 0.88; R = 0.99), Pig-2-Bac (S = 1.00; R = 1.00), and DuckBac (S = 0.94; R = 1.00), and therefore may be used for the continuous monitoring of fecal pollution in the lake and in designing interventions to improve the quality of the lake water.

1. Introduction

Laguna Lake, the largest inland water body in the Philippines, serves various domestic, agricultural, and industrial purposes for an estimated 14.6 million users in the region [1,2]. However, the rapid increase in population and urbanization in the Laguna Lake area in recent years has contributed to the decline in the quality of the lake water [3,4]. Increased fecal coliform from different point and non-point sources of contamination in the water body and its tributaries exposes the public to risks associated with waterborne diseases. Point sources are pollution sources that are commonly discharged in water bodies that can be directly identified, while non-point sources are the cumulative contaminations from different sources that diffuse into the environment [5]. In addition to presenting serious health risks, fecal pollution has a negative impact on economic activities and can lead to environmental degradation [6]. Therefore, it is necessary to monitor the levels of fecal pollution in the lake and to determine its point sources.
As part of water quality monitoring, microbiological parameters are evaluated to determine the extent of fecal pollution. Fecal indicator bacteria (FIB), such as Escherichia coli and other enterococci, are currently used to assess the level of microbiological pollution in fresh and coastal waters. However, these microorganisms are present in both human and animal feces [7], and so their detection does not discriminate the origin of the fecal pollution [7]. Microbial source tracking (MST) methods have been developed to distinguish between contamination from human and animal sources such as cattle, swine, poultry, etc. Library-independent MST uses host-specific microbial indicators to accurately track fecal sources. Bernhard and Field [8] suggested the use of Bacteroides species as indicators of fecal pollution due to their abundance in the feces of warm-blooded animals. Bacteroides are strict anaerobes and do not survive for long in aerobic conditions. Therefore, their presence in environmental waters suggests continuous fecal inputs, making Bacteroides an ideal marker of fecal pollution. Several assays have been designed to target specific sequences within the Bacteroides 16S rRNA gene, and to differentiate human-derived contamination from that of other animals. Markers for the estimation of fecal pollution from pigs [6], dogs [9], humans [10,11], cows [10,11], and poultry [12] have been designed and evaluated. However, due to their variability in validity and efficiency when applied in different regions, there are no gold standards for human and nonhuman markers that are applicable to all geographical areas [13,14].
Sensitivity and specificity are critical parameters for determining the efficiency and validity of MST markers [15]. These criteria refer to the proportion of true positives (sensitivity) and true negatives (specificity) in the population. Bacteroides 16S rDNA-based markers for humans, cattle, swine, and poultry have been evaluated based on host-specificity and host-sensitivity in various geographical areas [16,17,18,19,20]. Among these markers, HF183 [10], BoBac [11], Pig-2-Bac [6], and DuckBac [12] achieved the recommended value (≥0.80) for a reliable and effective marker for both criteria [6,14]. ChickenBac has relatively weak sensitivity (0.69) but good specificity (0.92) [12]. However, it is important to know whether a particular marker would function differently in the Philippine setting, specifically in Laguna Lake.
In this study, human and animal sources of fecal contamination in Laguna Lake were investigated using the Bacteroides 16S rDNA-based markers HF183, BoBac, Pig-2-Bac, and DuckBac. The specific objectives were to (1) validate the performance of Bacteroides 16S rDNA markers specific for each host, (2) quantify and determine the key sources of pollution in the lake, (3) assess the spatiotemporal variations in marker abundance across sampling seasons and stations, and (4) investigate any correlations between water quality parameters and the presence of markers.

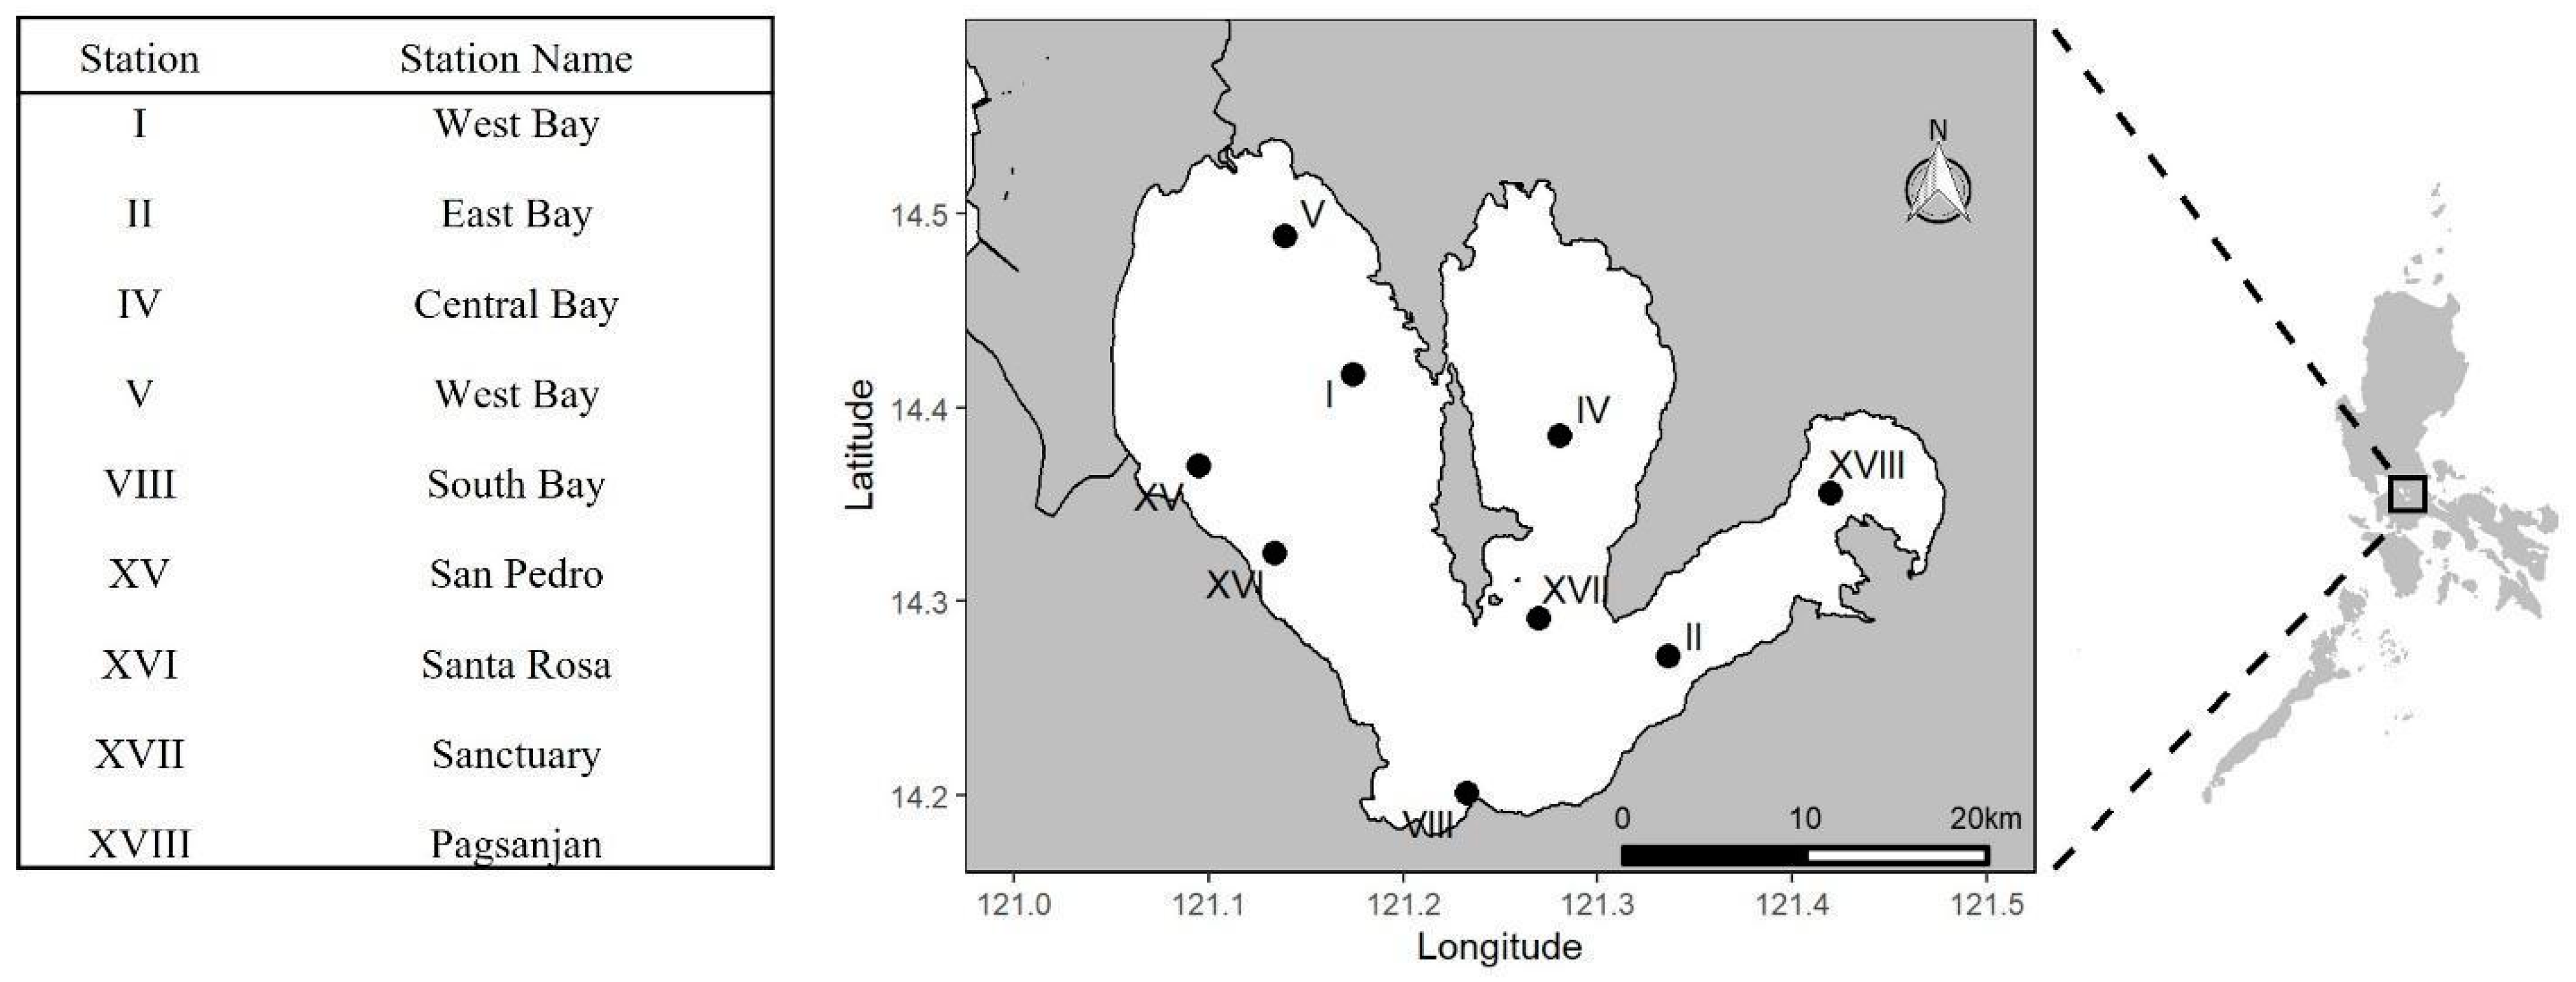
2. Materials and Methods

Sample collection and processing of lake water samples. Fresh feces from five host sources, namely, humans (n = 24), cows (n = 20), pigs (n = 15), ducks (n = 18), and chickens (n = 23), were collected from different farms and municipalities of Metro Manila, Laguna, and Rizal, sites which are located around Laguna Lake, Philippines. Research ethics clearance was obtained from the University of the Philippines Manila Research Ethics Board (UPMREB Code: 2018-356-01).
One liter of water from the selected Laguna Lake stations (Figure 1) was collected monthly from August 2019 to January 2020, with August–October and November–January representing the wet and dry seasons, respectively [21]. All fecal and water samples were transported on ice and processed immediately in the laboratory.
Environmental DNA was harvested by filtering 1 L of each water sample through a 0.45 µM membrane (Pall Corporation, Ann Arbor, MI, USA). The membrane filter was then resuspended in 5 mL of 1× TE (10 mM Tris-HCl and 1 mM EDTA) buffer or sterile type I water and vortexed vigorously to capture the adhered microorganisms. The final suspension was centrifuged at 14,000× g for 10 min to separate the pellet from the buffer. All pellets were stored at −20 °C until DNA extraction.
Measurement of water quality parameters. The measurements of the following water quality parameters, monitored from August 2019 to January 2020, were obtained from the Laguna Lake Development Authority (LLDA): pH (units), ammonia (mg/L), nitrate (mg/L), inorganic phosphates (mg/L), biological oxygen demand (BOD, mg/L), dissolved oxygen (DO, mg/L), and fecal coliform count (MPN/100).
DNA extraction from fecal and lake water samples. DNA extraction was performed using a PureLink™ Microbiome DNA Purification Kit (Invitrogen, Thermo Fisher Scientific, Carlsbad, CA, USA). Two hundred milligrams of fecal sample were used as the starting material, and extraction was performed by following the manufacturer’s protocol (Pub. No. MAN0014266). For water samples, the pellet was used as the starting material for the extraction of DNA, following the manufacturer’s protocol (Pub. No. MAN0014322). The final eluted DNA (100 µL) was then stored at −20 °C until further use.
Validation of host-associated Bacteroides markers. PCR-based assays were performed to determine the efficiency of candidate host-specific markers from published studies (Table 1) [6,10,11,12]. The performance criteria were host-specificity (S), host-sensitivity (R), and accuracy (A) for the detection of human-, swine-, cattle-, and poultry-specific contamination in Laguna Lake. Briefly, 10 µL of GoTaq Green Master Mix (Promega Corporation, Fitchburg, WI, USA), 1.0 µL of 10 µM forward and reverse primers, 2 µL of DNA, and nuclease free water, for a total of 20 µL per reaction, were mixed in a 200 µL tube. In a thermal cycler, the conditions were set at 95 °C for 5 min for initial denaturation, 30 cycles at 95 °C for 15 s, different annealing temperatures for each primer for 30 s, and 72 °C for 1 min. Final extension was performed at 72 °C for 5 min, and a holding temperature of 12 °C was set infinitely. To confirm the presence of a single product of the correct size, amplicons were subjected to 1.5% agarose gel electrophoresis and visualized under a UV Gel Documentation System (Bio-print ST4, Vilber Lourmat, Marne La Vallee, France).
The number of positive and negative results were used to calculate the metrics for marker performance following Kildare [22]: (1) true positives (TP) indicated the number of target host samples that tested positive for the assayed marker, (2) true negatives (TN) indicated the number of nontarget samples that tested negative for the assayed marker, (3) false positives (FP) indicated the presence of the marker in nontarget hosts, and (4) false negatives (FN) indicated the absence of the marker in the target host. The equations provided by Somnark [23] are as follows:
R = TP/TP + FN
S = TN/TN + FP
A = (TP + TN)/(TP + TN + FP + FN)
where R represents host-sensitivity, S represents host-specificity, and A represents accuracy.
Detection and quantification of host-associated contamination in lake waters. The reaction mix was prepared by mixing 10 µL of SensiFAST™ SYBR® Hi-ROX (Bioline, UK), 6 µL of nuclease-free water, 0.8 µL of each primer, and 2 µL of the sample or standard. The standard used was optimized from amplicons of markers known to be specific to Bacteroides. All reactions were performed in duplicate along with the no-template control. The cycling parameters for qPCR (StepOnePlus™ Real-time PCR system; Applied Biosystems, Woburn, MA, USA) were as follows: initial denaturation at 95 °C for 2 min, 40 cycles at 95 °C for 5 s, 60°C for 10 s, and 72 °C for 10 s. Melting curve analyses were set by default with the following conditions: 1.6 °C/s, 95 °C for 15 s, 1.6 °C/s, 60 °C for 1 min, and 0.15 °C/s, 95 °C for 15 s (Applied Biosystems, Waltham, MA, USA). The resulting standard curve was analyzed to assess the linearity and efficiency of amplification, and the dissociation curve was evaluated to determine the presence or absence of nonspecific amplifications. The resulting DNA marker concentrations were converted into DNA copy numbers using the standard formula given below:
number   of   copies   molecules = X   ng   × 6.0221 × 10 23   molecules / mole N   × 660 g mole × 1 × 10 9   ng / g
where X represents the DNA concentration and N represents the number of marker base pairs.
Analysis of data. Data were analyzed using R v.4.0.4 [24]. The concentrations of Bacteroides markers (copy number mL−1) were initially log10-transformed, and those that were not detected were assumed to be below the limit of detection (<LOD); these were then used to assess the spatiotemporal patterns of fecal contamination in the lake. The percentage of occurrence for each marker was calculated by dividing the number of times the marker was detected by the number of sampling events (n = 6) throughout the duration of the experiment. The association between the Bacteroides markers and water parameters was determined using the nonparametric Spearman correlation. Single imputation was performed for <LOD observations by dividing the LOD of each marker by 2 [25]. The resulting p-values were adjusted for multiple comparisons using Holm’s correction [26].

3. Results

3.1. Validation of Bacteroides 16S rDNA-Based Markers for MST

A total of 100 fecal samples was used to validate the performance characteristics of the five host-associated markers, namely, HF183, BoBac, Pig-2-Bac, DuckBac, and ChickenBac (Table 2). HF183 was only detected in 5% of the chicken fecal samples, while BoBac was present in 80–100% of the nontarget host samples. Neither the Pig-2-Bac or DuckBac markers were found in any of the nontarget host samples. Lastly, ChickenBac was present in 75–100% of the nontarget host samples, but not in the human samples.
Among the five markers, Pig-2-Bac, DuckBac, and HF183 achieved the recommended value (≥0.80) for both sensitivity and specificity (Table 3). Pig-2-Bac performed best (S = 1.00; R = 1.00), followed by DuckBac (S = 0.94; R = 1.00), and HF183 (S = 0.88; R = 0.99). By contrast, ChickenBac (S = 0.65; R = 0.31) and BoBac (S = 0.90; R = 0.10) performed poorly, and hence these two markers were not used further for source tracking analysis.

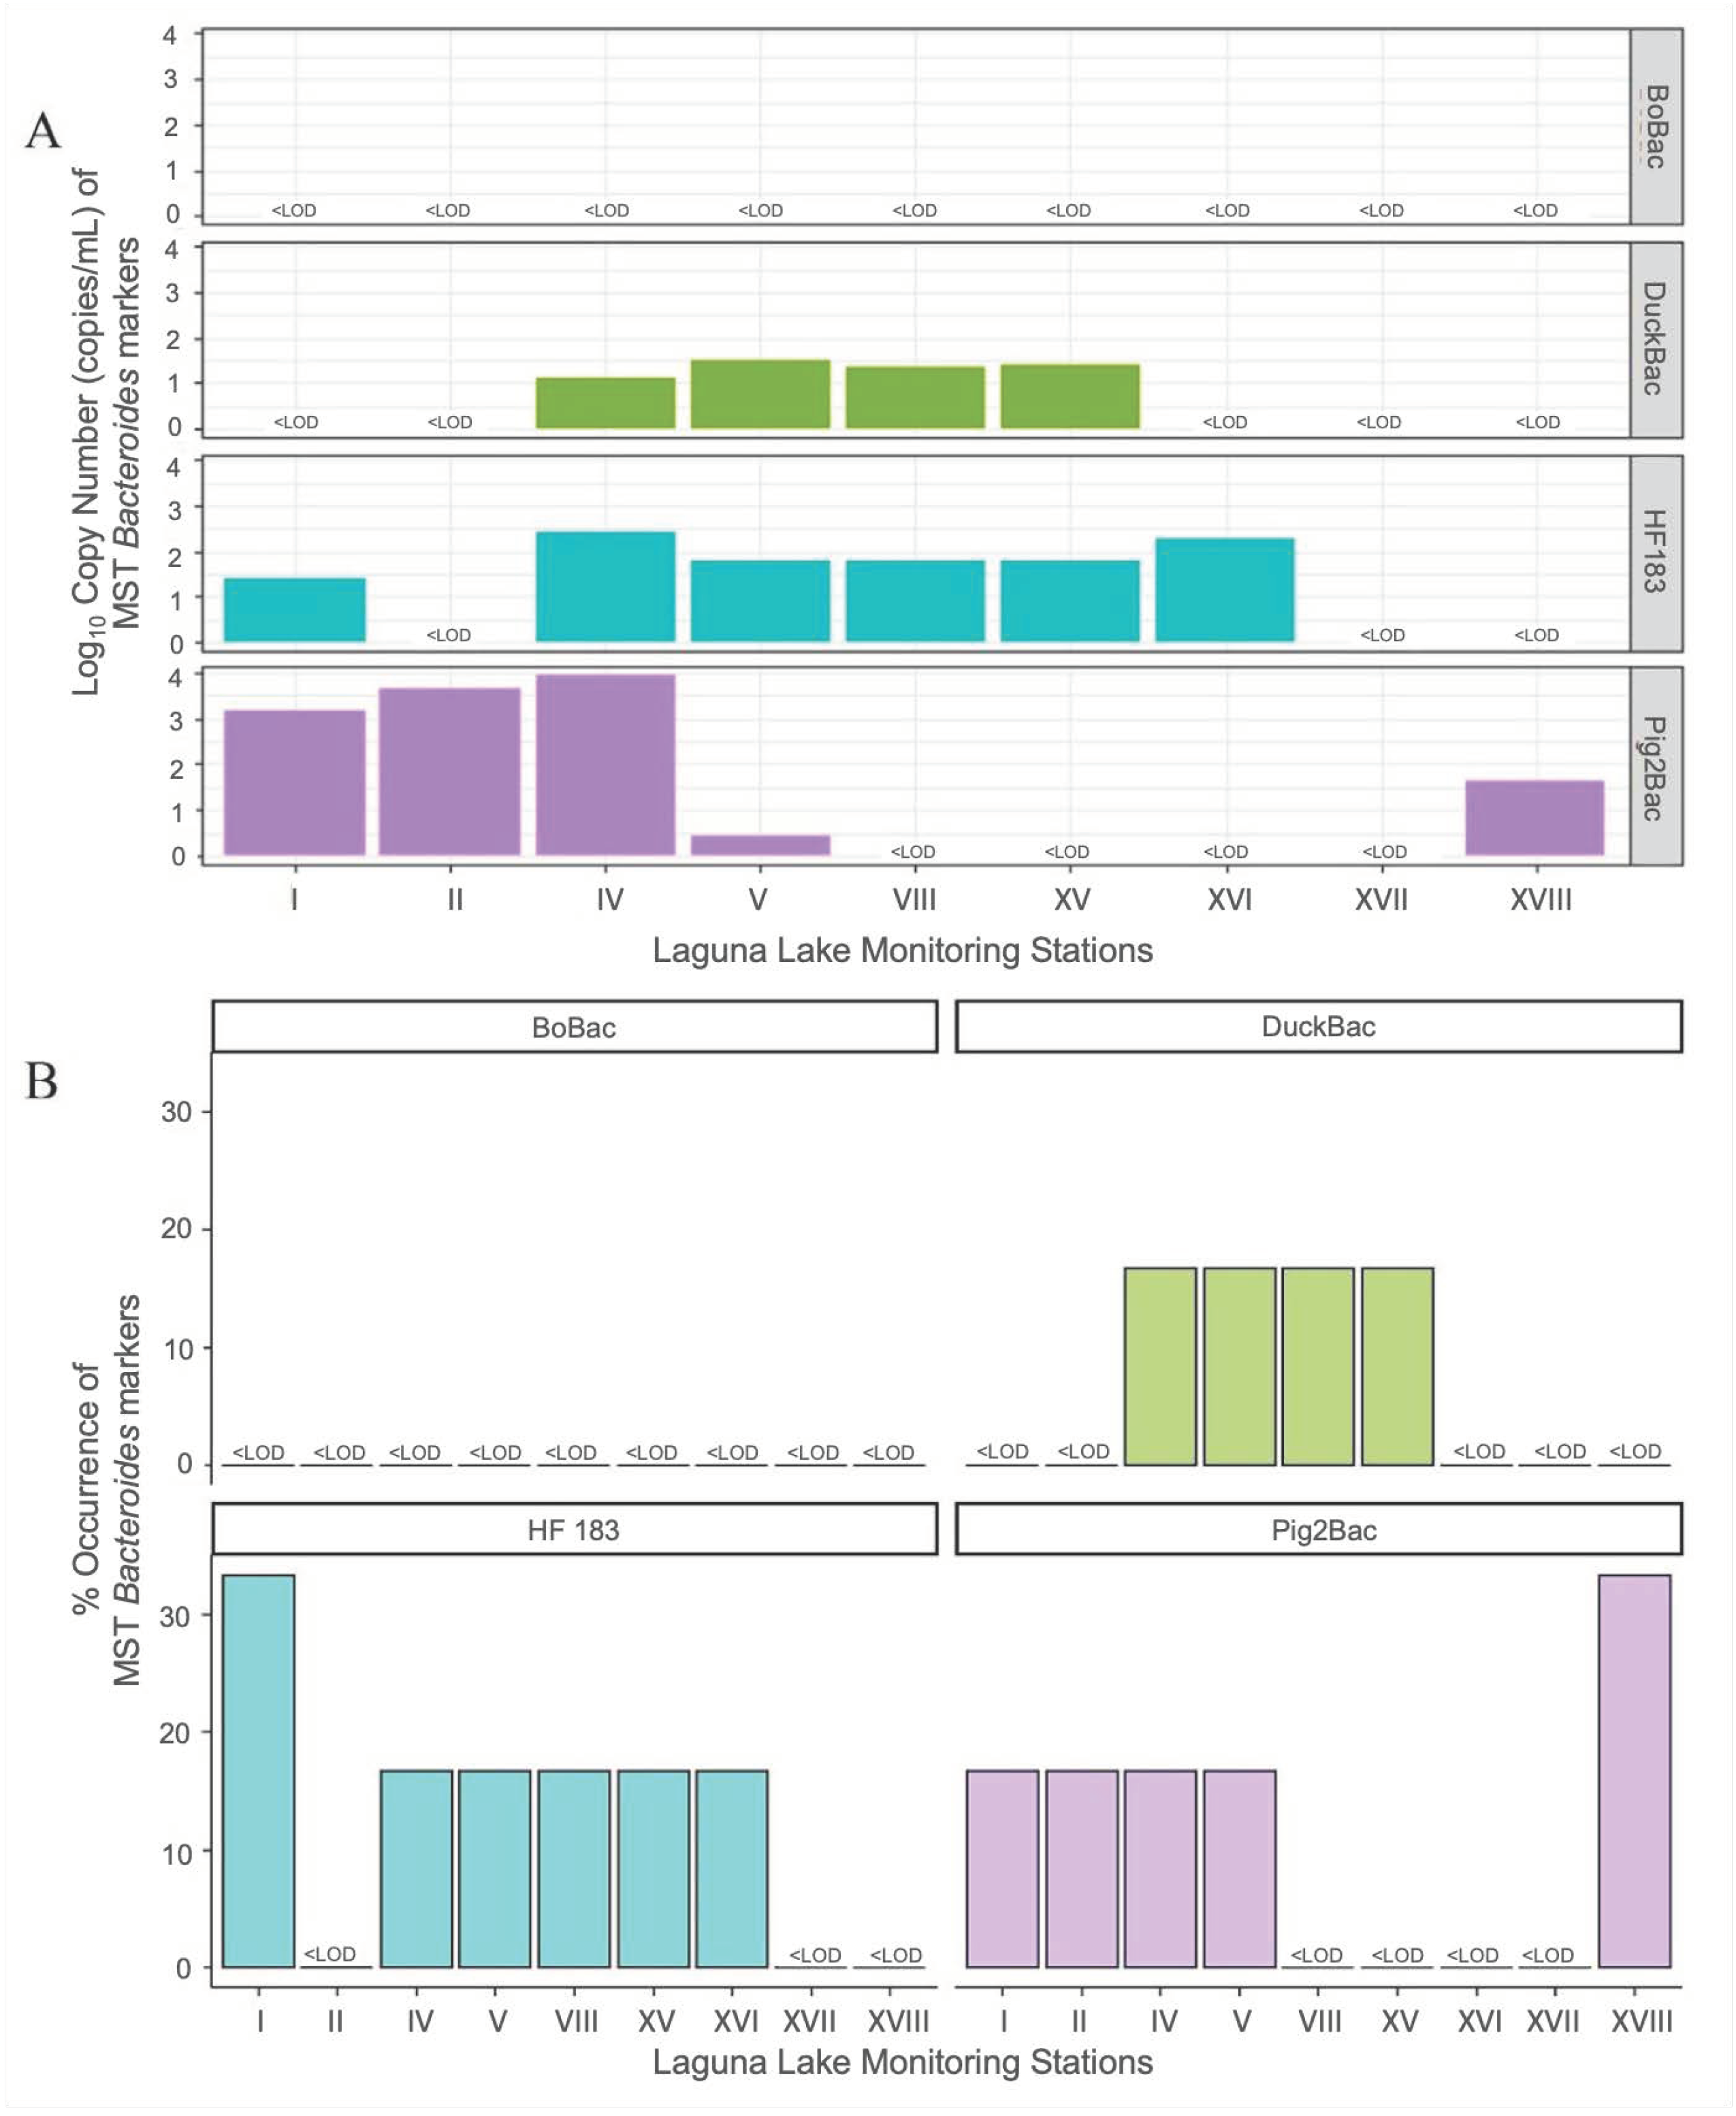
3.2. Detection and Quantification of Host-Associated Contamination in Lake Waters

The qPCR analysis of a total of 54 water samples using the host-associated markers revealed the most abundant contributors of fecal contamination in selected Laguna Lake stations from August 2019 to January 2020 (Figure 2). Pig-2-Bac was the most abundant and had the highest mean concentration (2.47 log10 copies/mL), which was detected in five out of nine stations. Pig fecal contamination was most abundant in the Central Bay (Station IV), followed by the East Bay (Station II) and West Bay (Stations I and V) (Figure 2A). HF183 (average concentration = 1.91 log10 copies/mL) was detected in six out of nine stations, making it the most frequently detected marker, covering mostly the west area of the lake (Stations I, V, XV, and XVI). However, this does not necessarily mean that it had the highest copy number. On the other hand, DuckBac (average concentration = 1.32 log10 copies/mL) was detected in four sites while BoBac was not detected in any of the study sites throughout the sampling duration.

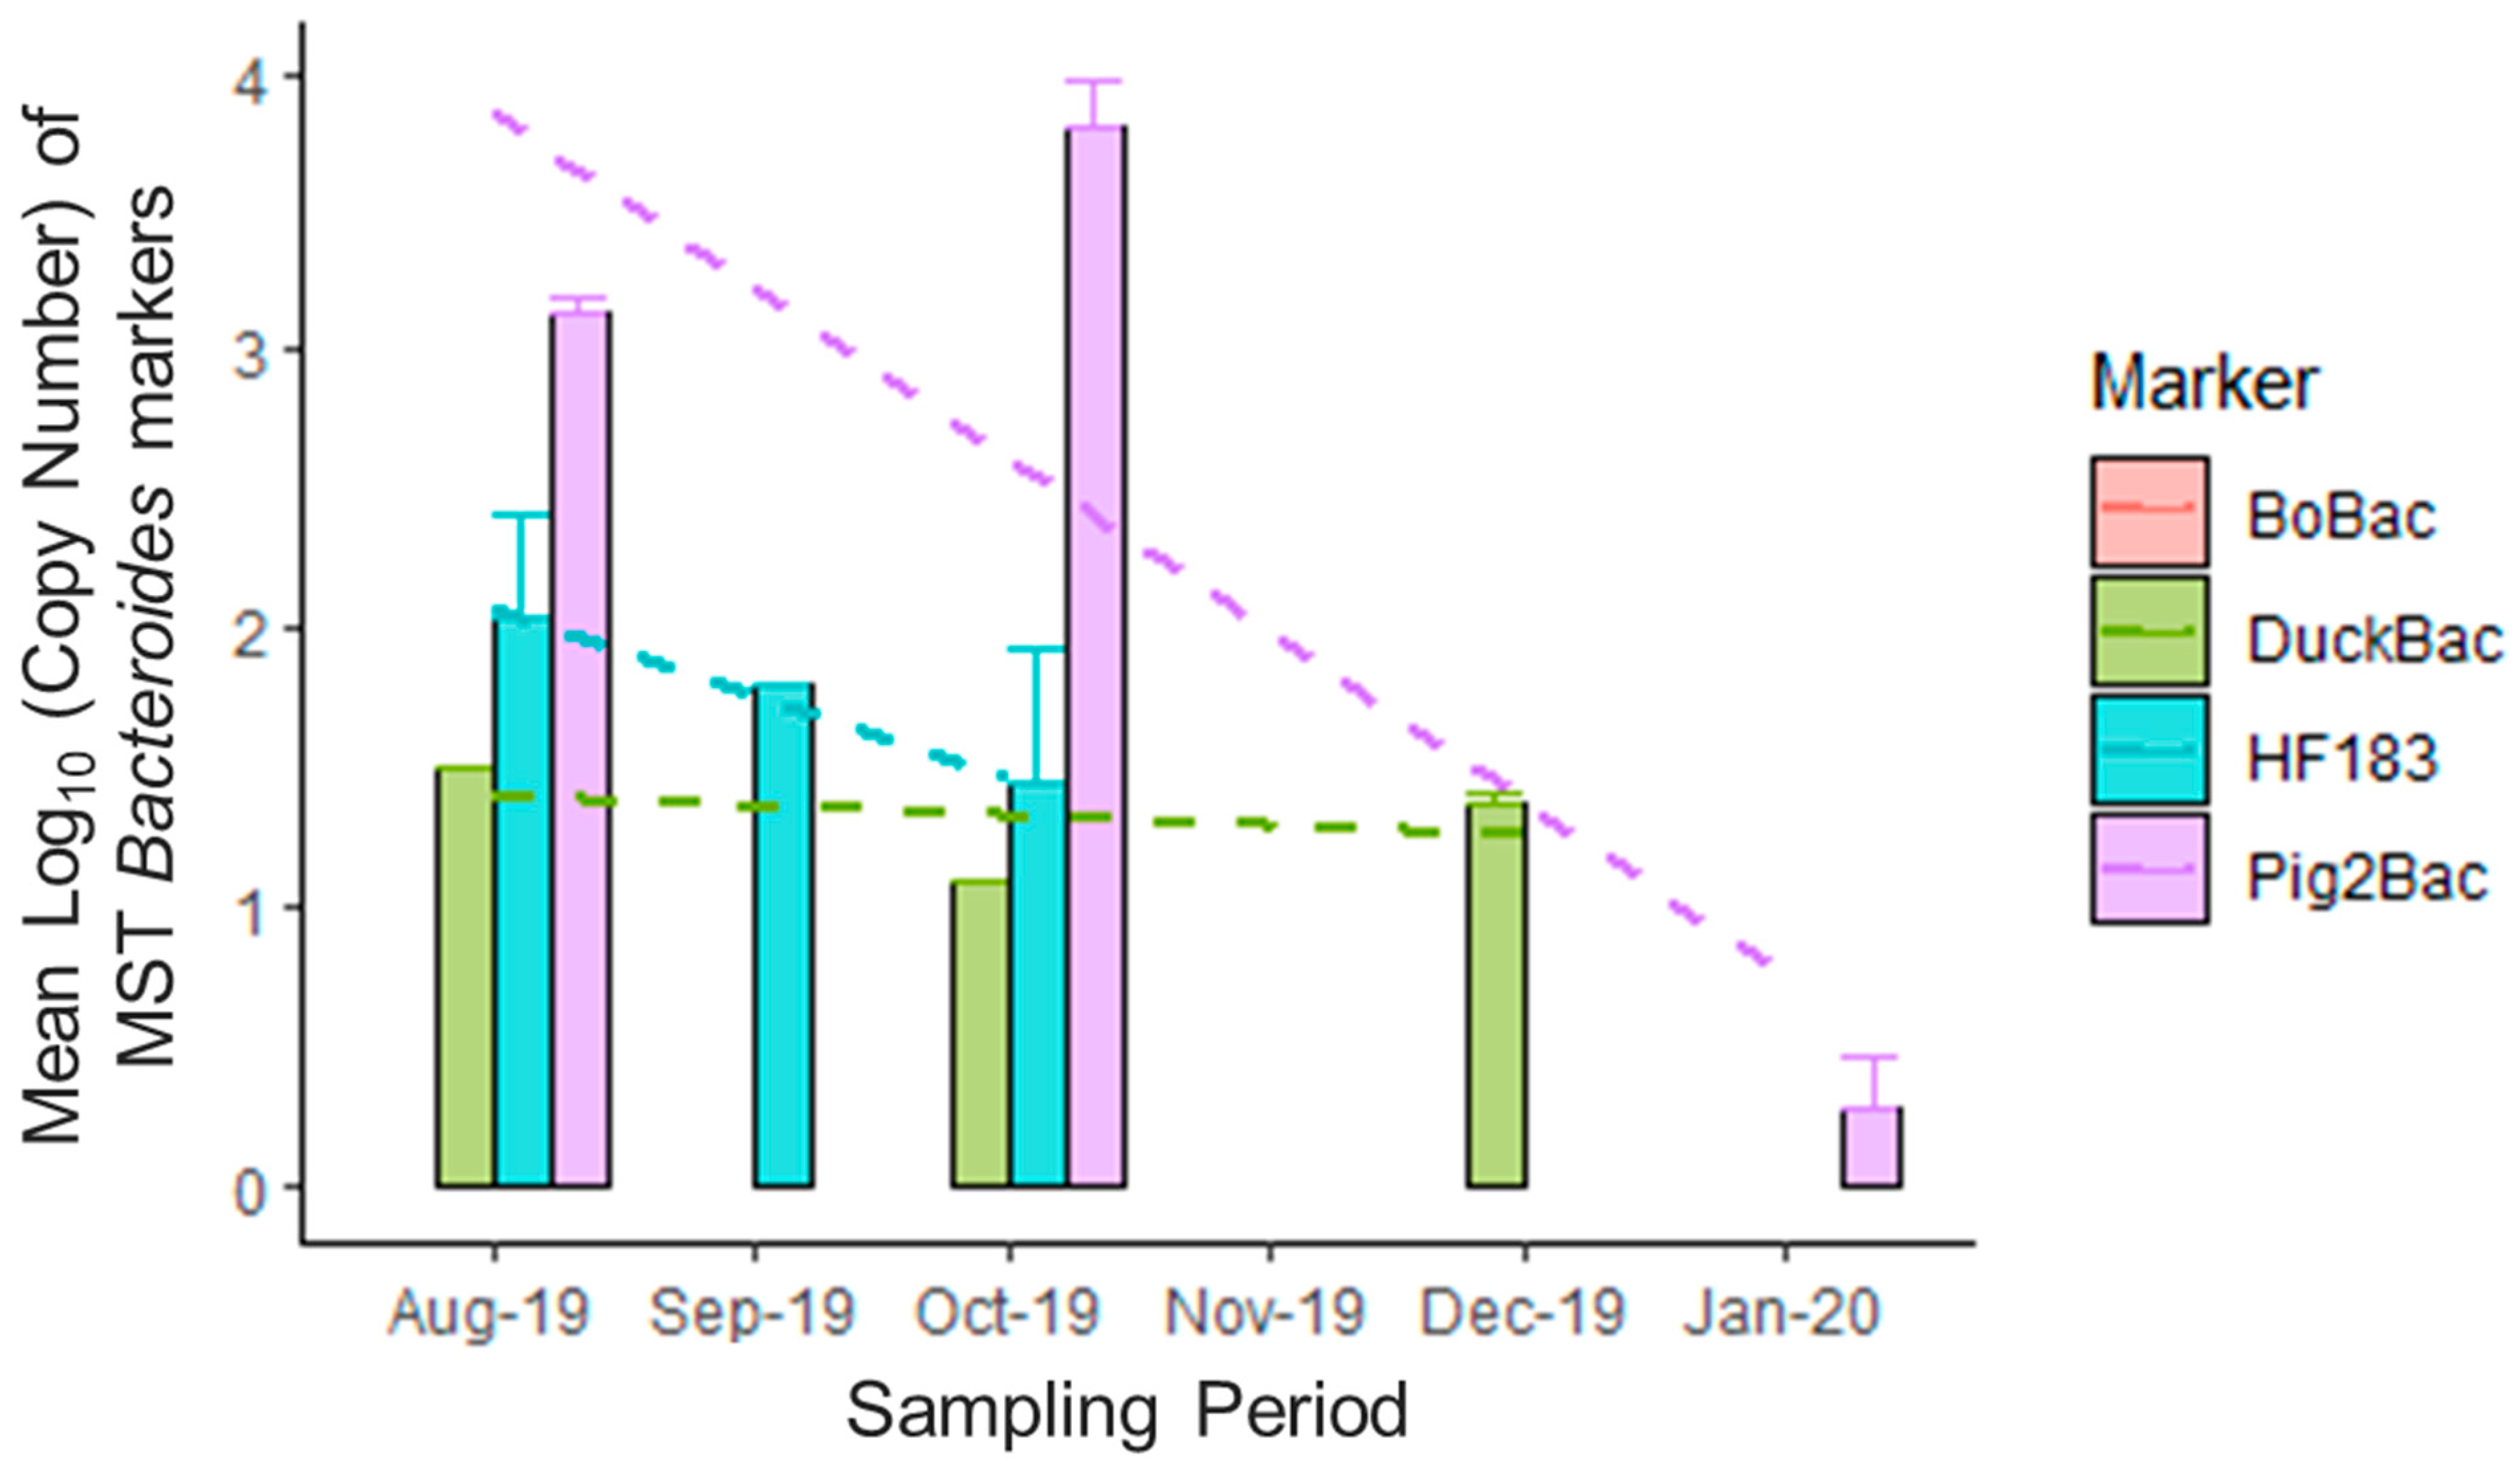
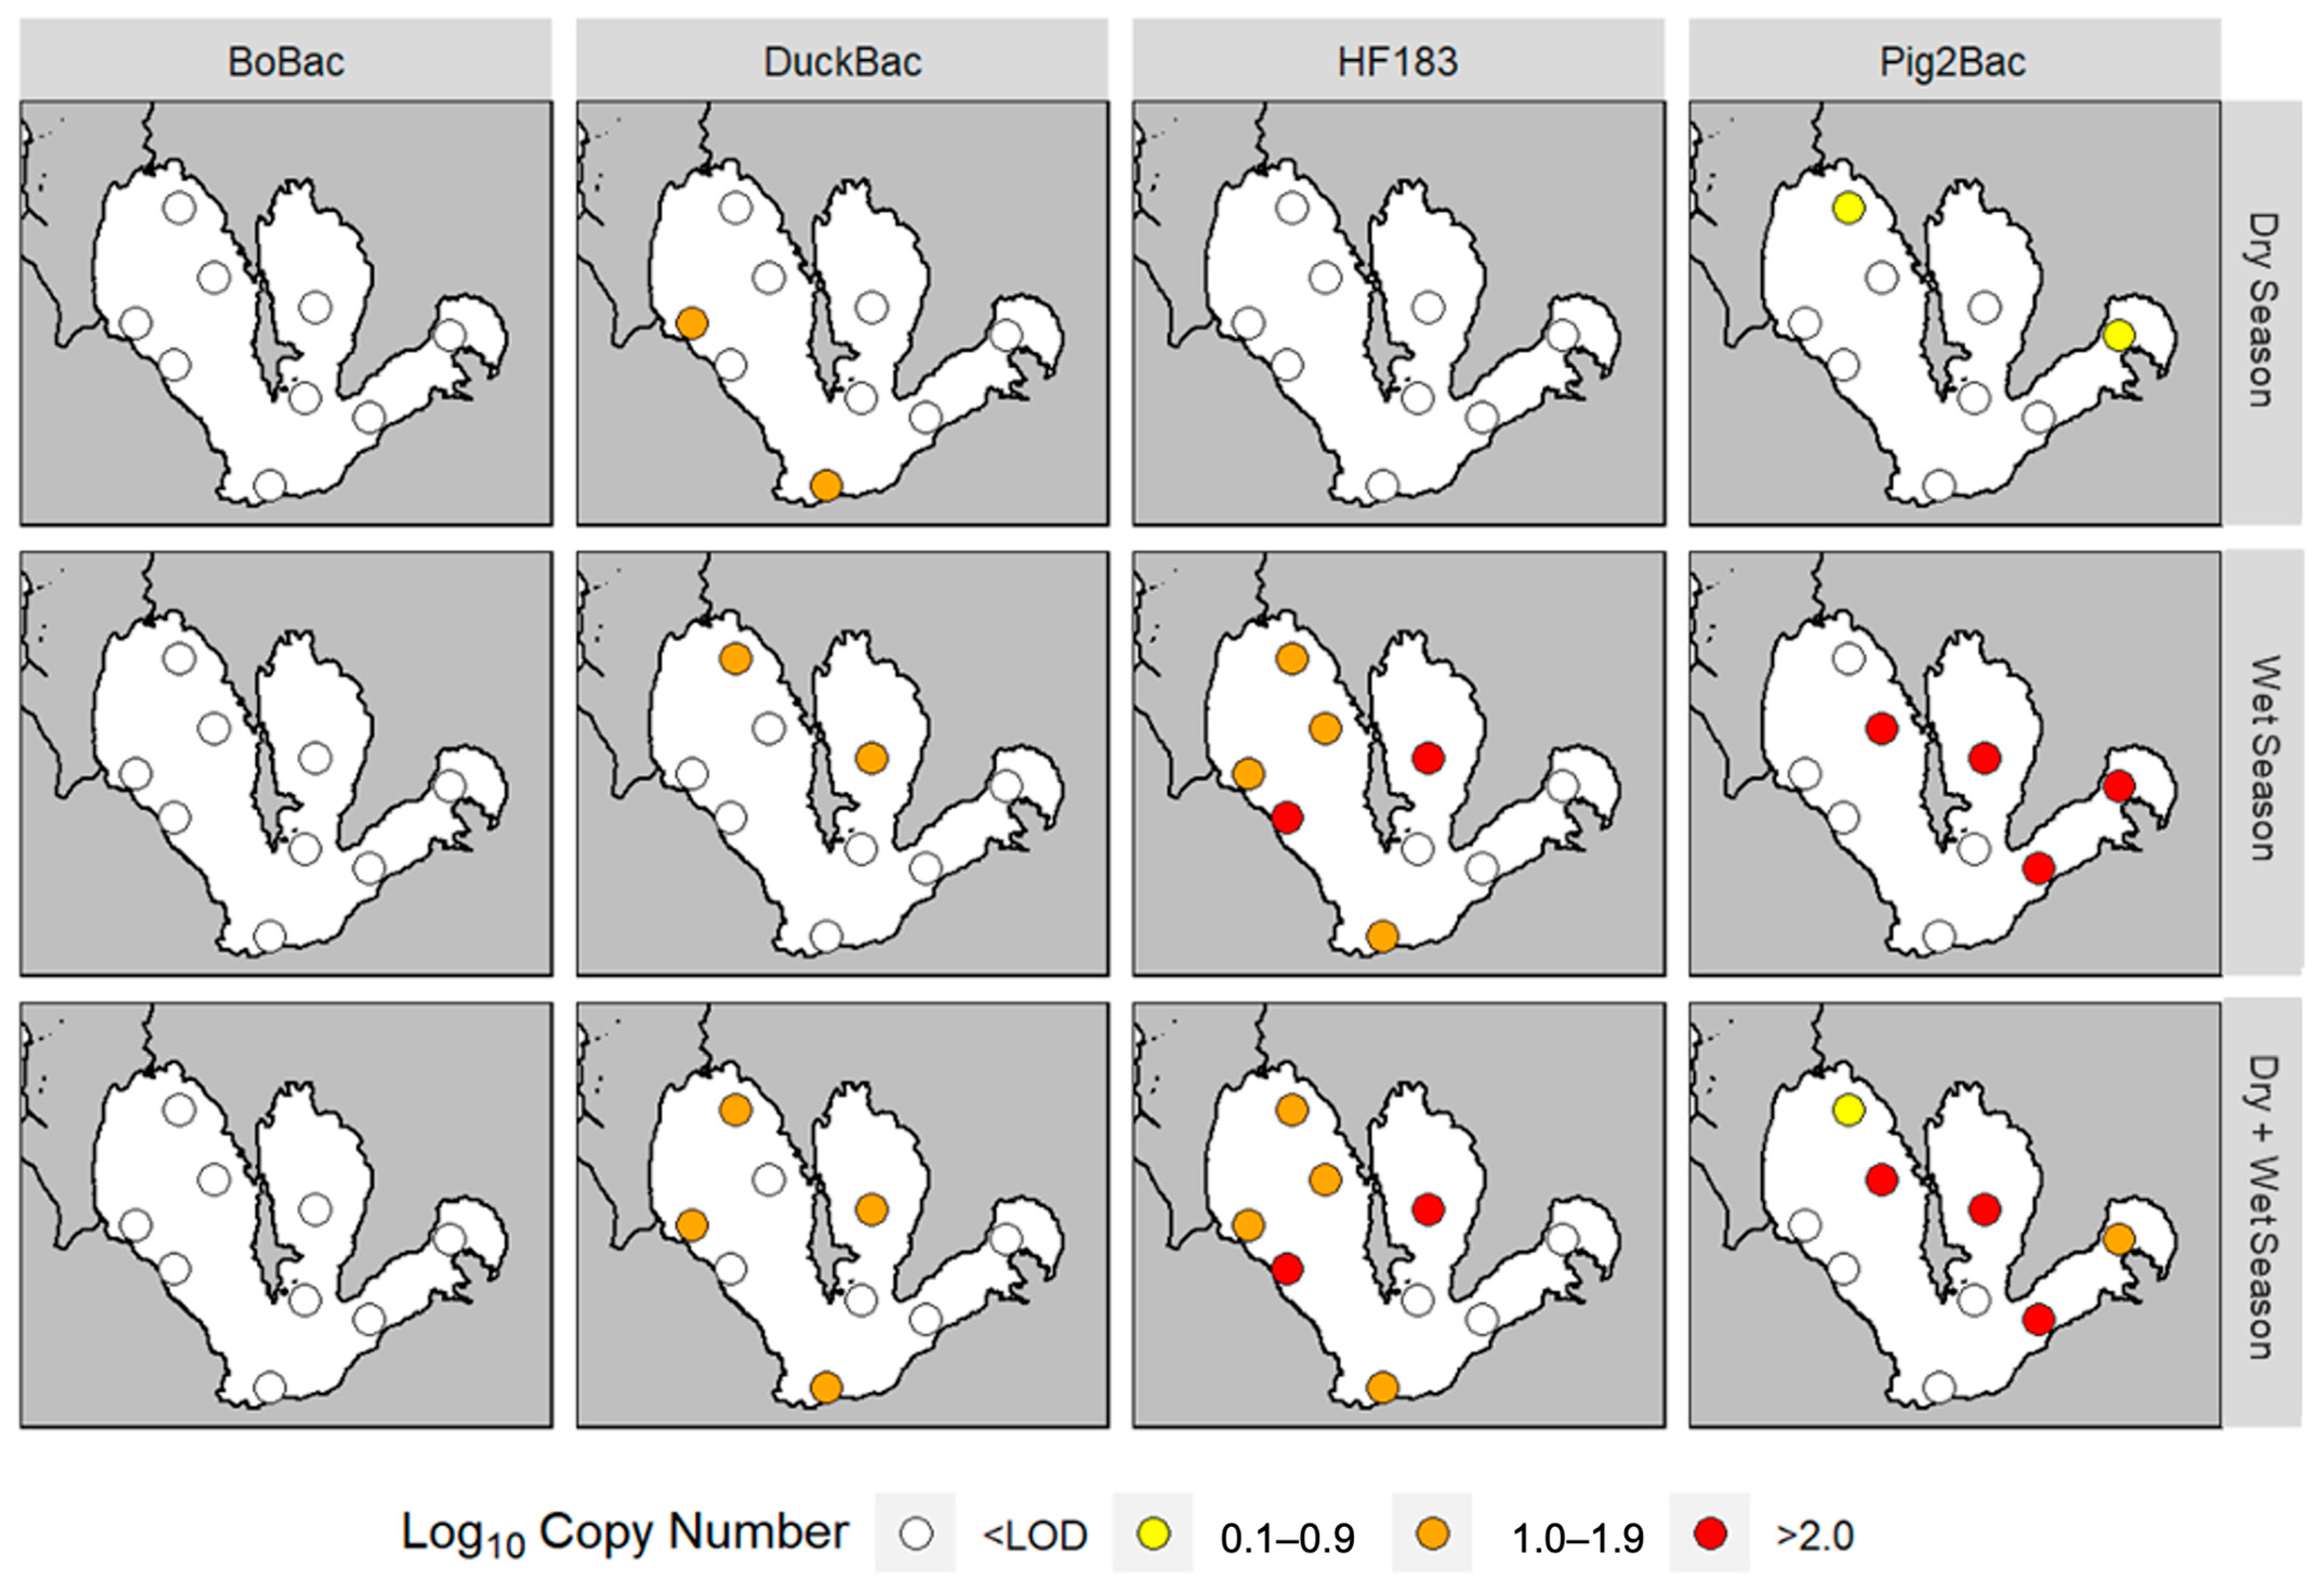
3.3. Seasonal Patterns in the Abundance of Bacteroides MST Markers

Higher marker concentrations were notable during the months of August, September, and October 2019 (Figure 3). Furthermore, the levels of DuckBac were generally constant, as observed from August to December 2019, except that it was not detected during November 2019. On the other hand, traces of Pig-2-Bac were detected in January 2020. Figure 4 shows the seasonal pattern of marker abundance across sampling sites. Marker concentrations from all sampling sites combined were higher during the wet season compared to the dry season (Figure 4). The spatial characteristics can also be considered as a major factor in the distribution and occurrence of the markers used.

3.4. Correlation between Bacteroides Markers, Fecal Coliforms, and Water Quality Parameters

The correlations between the monthly abundance (August 2019 to January 2020) of fecal contamination from each host source and environmental parameters (fecal coliform, BOD, DO, pH, ammonia, nitrate, and phosphate) were tested (Table 4). The abundance of DuckBac and Pig-2-Bac was not significantly correlated with any of the environmental variables, while the abundance of HF183 was significantly correlated with levels of phosphate present in the lake (ρ = 0.45; p < 0.001).

4. Discussion

Validation of Bacteroides 16S rDNA-based markers for MST. The human marker HF183, initially developed by Bernhard and Field [8] from the 16S rRNA gene of Bacteroides dorei and closely related taxa, has been widely used for two decades and is well characterized with regard to host-sensitivity and -specificity [27]. The improved primer pair HF183/BacR287 [10] was evaluated in this study, and relatively high values for sensitivity (0.88) and specificity (0.99) were obtained. The lower sensitivity of HF183 corroborated previous reports, which stated that this marker was more prevalent in composite water samples (raw, septic, and effluent wastewater) than in individual human fecal samples [28]. Meanwhile, the specificity value obtained in this study (0.99) was higher than the previously reported overall host-specificity value (0.946) [27]. The occasional presence of the HF183 marker in nonhuman fecal samples, including samples from chickens, has been previously reported in other validation studies [29,30]. Because chicken fecal samples were collected from backyard farms where animals are exposed to human contact, the possibility of cross-contamination between humans and chickens cannot be ruled out. The uptake of HF183 can also occur if chickens drink human wastewater [29].
The high host-specificity and -sensitivity of the Pig-2-Bac marker designed by Mieszkin [5] and Gourmelon [23] from pig feces and slurries make it ideal for detecting pig fecal contamination. In this presence/absence evaluation, no nontarget fecal sample was positive in the Pig-2-Bac assay. This was consistent with the previous validation studies [6,23] [31], which applied more sensitive qPCR platforms. This result suggests that the marker performs well even in endpoint PCR for qualitative assessment and is ideal for use in MST.
Because avian feces are potential sources of pathogens, genetic markers have been proposed for duck, goose, crane, and poultry feces, but most of these markers are not based on the Bacteroides 16S rRNA gene [32,33,34]. To date, PCR assays targeting duck and chicken markers have not been well established. Kobayashi [12] designed three markers (Chicken-Bac, Duck-Bac, and Chicken/Duck-Bac) for the detection and estimation of chicken and duck feces in the environment. We found that DuckBac performed better (S = 0.94; R = 1.00) than reported by Kobayashi (S = 0.85; R = 0.96) [12] and ChickenBac had a poorer performance (S = 0.65; R = 0.31) than that reported by Kobayashi [12] (S = 0.70; R = 0.92). In the current study, the ChickenBac marker was observed in fecal samples from ducks, pigs, and cows, confirming the presence of this marker in animals other than chickens. Hence, only the Duck-Bac marker was used in this study because the ChickenBac marker is not recommended for source tracking due to its low sensitivity and specificity.
In the estimation of contamination from cattle, BoBac performed poorly (R = 0.10) because of an extreme cross-reaction with all nontarget host groups. This result was not consistent with other studies, which have reported the BoBac marker to be 0.93–0.97 specific (11, 22) with only a few cross-reactions with human and dog fecal samples. This occurrence might have resulted from factors such as diet and cohabitation, which can influence the sharing of host-associated microorganisms among animals [35]. Because our results were based on presence/absence data, which are qualitative estimates, conclusive findings regarding the source of contamination based on this marker may not be accurate. Given that the specificity and distribution of a marker in host populations can vary in terms of geographical and temporal aspects, this type of data is not sufficient to establish the suitability and accuracy of the markers for successful field application [28]. The sensitivity and specificity values of the host-associated markers reported in this study prove that there is a need to validate these markers before conducting quantitative MST studies in other geographical regions [36]. Furthermore, a high degree of variability in microbes in the gut occurs due to cohabitation, diet, physiology, feeding habits, and geographical stability [37].
Quantification and spatial distribution of host-associated Bacteroides markers in lake water samples. Human contamination was frequently detected in the west area of the lake (Stations I, V, XV, and XVI) (Figure 4). These findings align with the most recent land cover data of the Laguna Lake basin, the area surrounding the lake. Based on the 2015 land cover map of the basin [38], built-up areas on the northwest to the west side of the lake are prevalent. These areas, in Metro Manila and the Laguna Province, have been converted, mostly by private owners for industrial or commercial use, but also for residential purposes [39]. Urban sprawl has led to an increase in the amount of domestic waste being disposed into local waterways [40]. These wastes are produced from human activities such as bathing, laundry, cleaning, cooking, and washing [41]. As may be inferred, domestic waste is a major contributor to pollution in Laguna Lake. This is also reported in the Pilot Ecosystem Account for Laguna de Bay Basin [4], which stated that 81% of BOD came from domestic wastes. De la Peña et al. [42] also reported that sewage was the most dominant contributor to fecal contamination in Laguna Lake. This could be linked to a lack of sewerage systems in the area, which transport sewage from its source to a treatment and disposal facility [41]. In Metro Manila, only around 12% of households are connected to a sewer line [43]. This problem of sewerage systems, as well as sewage and septage management and treatment, should be addressed.
Pig fecal contamination was most abundant in the Central Bay (Station IV), followed by the East Bay (Station II) and West Bay (Stations I and V). The high abundance of pig fecal contamination in these areas can be attributed to the prevalence of swine industries in these regions. According to the Selected Statistics on Agriculture report [44], the swine industry accounts for 82% of the total value of production in the livestock group in the Philippines. In 2019, the total swine population was 12.71 million heads. In terms of regional distribution, Calabarzon, where Laguna Lake is located, accounted for 16% of the total swine inventory.
It is important to note that the swine population is made up of both backyard and commercial farming operations. Backyard farms (<20 heads) account for around 64% of the swine population in the Philippines, and commercial farms (>1000 heads) account for the remaining 36% [44]. Waste disposal monitoring by the Environmental Management Bureau only applies to farms that produce more than 30 m3 of wastewater discharge per day [45]. This may suggest that backyard and small farms (1–999 swine heads) are likely contributors to swine fecal contamination in the Central and East Bays due to the discharge of waste products into nearby creeks and rivers [46], which could later drain into the lake. Meanwhile, large commercial farms are mainly established near Metro Manila to meet the demand for meat products in this area [47]. The foregoing facts suggest that pig fecal contamination in the West Bay could be associated with commercial farming.
In addition to pig fecal contamination, duck fecal contamination was confirmed in four of the nine lake sites: the Central, West, South, and San Pedro Bays. Like the swine industry, the poultry industry in the Philippines is also composed of commercial (>100 birds) and backyard operations. Backyard poultry farms are located almost anywhere near the markets and can operate in densely populated areas as long as the birds are caged, while bigger farms are located in less urbanized areas [48]. Compared to the chicken population, which comprises 186 million heads, the duck population comprises only 11.58 million heads according to the inventory made by the Philippine Statistics Authority in 2019 [44]. Among the different administrative regions, Calabarzon is among the highest producers of poultry in terms of percentage distribution. The presence of duck feces in the lake sites may be attributed to the duck-raising industries located along the lake shoreline. Because the lake provides an abundant water supply and freshwater snails that serve as food for ducks, it has become a common breeding site for ducks [49]. The largest duck-raising farm in the province of Laguna is in the town of Victoria [49], close to the South Bay station, where duck-associated markers were detected.
As for the cow fecal marker, non-detection may have been a result of significant degradation or dilution of the marker during in-stream transport [50]. The marker concentration in the lake could be very low to begin with, for its successful detection in the samples. The non-detection of the BoBac marker suggests that cattle feces is unlikely to be a major contributor of contamination at the sampling sites. This is consistent with the recent MST data derived from a library-dependent method (rep-PCR), where only 3.31% (11/332) of the environmental samples were reported to be contaminated with cattle fecal matter [42]. However, our finding differs from that of Abello et al. [51], which revealed cattle-associated contamination in the West Bay (Stations I and V) using the heat-labile E. coli toxin gene marker LTIIA. The differences in these results demonstrate the distinct properties and functions of different MST methods. Because MST is an emerging method, a “toolbox” approach, i.e., a combination of different strategies, is recommended for the definitive identification of pollutant sources and the optimal accuracy of data interpretation [7].
Seasonal patterns in the abundance of Bacteroides MST markers. The Laguna Lake watershed has two climate types based on Coronas’ modified climate classification system. The majority of the surrounding region falls under the Type I classification, exhibiting periods of low rainfall (dry season) during November to April, and high levels of precipitation (wet season) between May and October [52,53]. The higher marker concentrations observed from August to October in this study can be explained by higher levels or more frequent precipitation during these months, which may facilitate the movement of fecal matters from point sources. Seasonal changes can influence marker concentrations through the entry of fecal contaminants via various pathways during heavy rainfall events [54].
Laguna Lake has around 100 rivers and streams that drain into the lake, 22 of which are major river tributaries [55] that contribute to around 70% of the total lake inflow [56]. Fecal contamination, which comes from sewage, discharges from wastewater treatment plant channels, or the direct defecation of livestock, wildlife, and domestic animals [54,57], enters the lake during heavy rainfall via storm water runoff. Previous studies have shown that periods of intense precipitation and high river discharge are associated with an exponential increase in the concentration of FIB in water bodies [58,59]. FIB densities in rivers are typically 10 to 1000 times higher during flood events compared to during dry periods, depending on storm severity and watershed characteristics [60]. Conversely, increased precipitation can also reduce the pathogen concentration in surface water due to dilution [14,61]. In Laguna Lake, rainfall-related seasonal variations were found to influence water quality [40]. Rainfall affects the turbidity and pollution of water due to inflows from domestic waste or industrial effluents [62]. The absence or low detection of markers in most of the samples during the dry season indicated low levels of fecal pollution. During dry weather events, the increase in temperature can cause pathogens to die off, thereby lowering their concentration in the environment [63]. Sunlight raises the level of reactive oxygen species in the environment, which can affect Bacteroidales species depending on their oxygen protection mechanisms [64]. Furthermore, because streamflow is mainly influenced by precipitation runoff in the watershed [65], decreased streamflow during the dry season is likely to reduce the water inflow in the watershed. Thus, even though river tributaries were heavily contaminated with fecal coliforms from November 2019 [66] to January 2020 [67], these contaminants were detected at only low levels in the representative samples.
Correlation between Bacteroides markers, fecal coliforms, and water quality parameters. Among the markers, only the concentration of the human-associated marker appeared to have a significant correlation with the level of phosphate recorded in the lake. Phosphorus is present in inorganic and organic forms in natural waters [68]. It is also found in feces and waste materials, synthetic detergents, and household cleaning products [69]. It is present in sewage mainly as orthophosphate, and its removal is essential during sewage treatment [70]. Phosphorus and nitrogen promote algal growth and degrade water quality [71]. Therefore, limiting phosphorus discharge from wastewater treatment plants is a critical component in preventing the eutrophication of receiving waters [72].
The significant correlation between the level of phosphate and the prevalence of HF183 reflects the lack of connection to sewerage systems as well as the presence or level of wastewater treatment [73]. Issues in sewage management and treatment should be addressed immediately to efficiently reduce sewage contamination, effectively remove phosphorus in wastewaters, and prevent further eutrophication of the lake.

5. Conclusions

The validation of the Bacteroides 16S rDNA markers revealed the sensitivity and specificity of the three host-associated markers. HF183, Pig-2-Bac, and DuckBac were efficient Bacteroides markers for detecting fecal contamination from humans, pigs, and ducks, respectively. This study established that these three markers can be utilized with confidence in MST studies in Laguna Lake. Additionally, their performances are considered useful for assessing fecal contamination in other water bodies, especially those in close proximity to the lake. However, we recommend the validation of the markers prior to their use for quantitative MST studies in a new region in order to establish the marker performance.
The higher marker concentrations during the wet season compared to the dry season suggested that seasonal factors, such as precipitation, influence the occurrence and abundance of markers in lake water. Among the water quality parameters (fecal coliform, DO, BOD, pH, nitrate, ammonia, and phosphate level), only the phosphate level showed a significant correlation with human-associated markers.
The findings of this study can support policymakers in enforcing strict regulations on proper waste management and disposal in the areas surrounding Laguna Lake. Specifically, the data on the abundance of pig-associated contamination may guide environmental sectors in considering the monitoring of backyard and small commercial farms to mitigate pollution. Additionally, the issues regarding the limited sewerage systems should be addressed to reduce human- or sewage-derived contamination. These strategies will help in preserving lake water quality and preventing further degradation of the water body.

Author Contributions

Conceptualization, G.T.M. and W.L.R.; methodology, G.T.M., M.C.M.O., and W.L.R.; validation, G.T.M.; formal analysis, G.T.M. and M.A.G.N.; resources, W.L.R.; data curation, G.T.M.; writing—original draft preparation, G.T.M., M.C.M.O., and W.L.R.; writing—review and editing, M.A.G.N., M.C.M.O., and W.L.R.; supervision, W.L.R.; project administration, W.L.R.; funding acquisition, W.L.R. All authors have read and agreed to the published version of the manuscript.

Funding

This research was funded by the Philippine Council for Industry, Energy, and Emerging Technology Research and Development, Department of Science and Technology (PCIEERD-DOST) Project Code: 10091.

Data Availability Statement

All relevant data are included in this manuscript.

Acknowledgments

The authors thank the Laguna Lake Development Authority for the provision of available data on water quality parameters used in monitoring the lake, and Kevin L. Labrador for his technical assistance in data analysis and interpretation.

Conflicts of Interest

The authors declare no conflict of interest.

References

  1. Laguna Lake Development Authority. Existing Lake Uses. 2019. Available online: http://llda.gov.ph/existing-lake-uses/ (accessed on 23 April 2023).
  2. Laguna Lake Development Authority. Towards Climate-Resilience and Sustainable Development. 2015. Available online: http://gwhs-stg03.i.gov.ph/~s3lldagov/wp-content/dox/ldbMP2016.pdf (accessed on 23 April 2023).
  3. Santos-Borja, A.; Nepomuceno, D.N. Laguna de Bay: Institutional Development and Change for Lake Basin Management. Lakes Reserv. 2006, 11, 257–269. [Google Scholar] [CrossRef]
  4. Wealth Accounting and the Valuation of Ecosystem Services. In Pilot Ecosystem Account for Laguna de Bay Basin; The World Bank: Washington, DC, USA, 2016.
  5. US Environmental Protection Agency. Microbial Source Tracking Guide Document; U.S. Environmental Protection Agency: Washington, DC, USA, 2005.
  6. Gómez-Doñate, M.; Casanovas-Massana, A.; Muniesa, M.; Blanch, A.R. Development of New Host-Specific Bacteroides qPCRs for the Identification of Fecal Contamination Sources in Water. MicrobiologyOpen 2016, 5, 83–94. [Google Scholar] [CrossRef] [PubMed]
  7. Mieszkin, S.; Furet, J.-P.; Corthier, G.; Gourmelon, M. Estimation of Pig Fecal Contamination in a River Catchment by Real-Time PCR Using Two Pig-Specific Bacteroidales 16S rRNA Genetic Markers. Appl. Environ. Microbiol. 2009, 75, 3045–3054. [Google Scholar] [CrossRef] [PubMed]
  8. Bernhard, A.E.; Field, K.G. A PCR Assay to Discriminate Human and Ruminant Feces on the Basis of Host Differences in Bacteroides-Prevotella Genes Encoding 16S rRNA. Appl. Environ. Microbiol. 2000, 66, 4571–4574. [Google Scholar] [CrossRef]
  9. Hussein, K.R.; Waines, P.L.; Nisr, R.B.; Glegg, G.; Bradley, G. Development and Use of Bacteroides 16S rRNA Polymerase Chain Reaction Assay for Source Tracking Dog Faecal Pollution in Bathing Waters. Hydrol. Curr. Res. 2014, 5, 1–8. [Google Scholar] [CrossRef]
  10. Green, H.C.; Haugland, R.A.; Varma, M.; Millen, H.T.; Borchardt, M.A.; Field, K.G.; Walters, W.A.; Knight, R.; Sivaganesan, M.; Kelty, C.A.; et al. Improved HF183 Quantitative Real-Time PCR Assay for Characterization of Human Fecal Pollution in Ambient Surface Water Samples. Appl. Environ. Microbiol. 2014, 80, 3086–3094. [Google Scholar] [CrossRef]
  11. Layton, A.; Mckay, L.; Williams, D.; Garrett, V.; Gentry, R.; Sayler, G. Development of Bacteroides 16S rRNA Gene TaqMan-Based Real-Time PCR Assays for Estimation of Total, Human, and Bovine Fecal Pollution in Water. Appl. Environ. Microbiol. 2006, 72, 4214–4224. [Google Scholar] [CrossRef]
  12. Kobayashi, A.; Sano, D.; Hatori, J.; Ishii, S.; Okabe, S. Chicken- and Duck-Associated Bacteroides–Prevotella Genetic Markers for Detecting Fecal Contamination in Environmental Water. Appl. Microbiol. Biotechnol. 2013, 97, 7427–7437. [Google Scholar] [CrossRef]
  13. Stoeckel, D.M.; Harwood, V.J. Performance, Design, and Analysis in Microbial Source Tracking Studies. Appl. Environ. Microbiol. 2007, 73, 2405–2415. [Google Scholar] [CrossRef]
  14. Diston, D.; Sinreich, M.; Zimmermann, S.; Baumgartner, A.; Felleisen, R. Evaluation of Molecular- and Culture-Dependent MST Markers to Detect Fecal Contamination and Indicate Viral Presence in Good Quality Groundwater. Environ. Sci. Technol. 2015, 49, 7142–7151. [Google Scholar] [CrossRef]
  15. Harwood, V.J.; Stoeckel, D.M. Performance Criteria. In Microbial Source Tracking: Methods, Applications, and Case Studies; Hagedorn, C., Blanch, A.R., Harwood, V.J., Eds.; Springer Science+Business Media: Berlin/Heidelberg, Germany, 2011; pp. 7–30. [Google Scholar]
  16. Staley, C.; Gordon, K.V.; Schoen, M.E.; Harwood, V.J. Performance of Two Quantitative PCR Methods for Microbial Source Tracking of Human Sewage and Implications for Microbial Risk Assessment in Recreational Waters. Appl. Environ. Microbiol. 2012, 78, 7317–7326. [Google Scholar] [CrossRef] [PubMed]
  17. Yahya, M.; Blanch, A.R.; Meijer, W.G.; Antoniou, K.; Hmaied, F.; Ballesté, E. Comparison of the Performance of Different Microbial Source Tracking Markers Among European and North African Regions. J. Environ. Qual. 2017, 46, 760–766. [Google Scholar] [CrossRef] [PubMed]
  18. Nshimyimana, J.P.; Cruz, M.C.; Thompson, R.J.; Wuertz, S. Bacteroidales Markers for Microbial Source Tracking in Southeast Asia. Water Res. 2017, 118, 239–248. [Google Scholar] [CrossRef] [PubMed]
  19. Malla, B.; Ghaju Shrestha, R.; Tandukar, S.; Bhandari, D.; Inoue, D.; Sei, K.; Tanaka, Y.; Sherchand, J.B.; Haramoto, E. Validation of Host-Specific Bacteroidales Quantitative PCR Assays and Their Application to Microbial Source Tracking of Drinking Water Sources in the Kathmandu Valley, Nepal. J. Appl. Microbiol. 2018, 125, 609–619. [Google Scholar] [CrossRef] [PubMed]
  20. Haramoto, E.; Osada, R. Assessment and Application of Host-Specific Bacteroidales Genetic Markers for Microbial Source Tracking of River Water in Japan. PLoS ONE 2018, 13, e0207727. [Google Scholar] [CrossRef]
  21. Laguna Lake Development Authority. Laguna Lake Development Authority 2016 Annual Report; Laguna Lake Development Authority: Quezon City, Philippines, 2016.
  22. Kildare, B.J.; Leutenegger, C.M.; McSwain, B.S.; Bambic, D.G.; Rajal, V.B.; Wuertz, S. 16S rRNA-Based Assays for Quantitative Detection of Universal, Human-, Cow-, and Dog-Specific Fecal Bacteroidales: A Bayesian Approach. Water Res. 2007, 41, 3701–3715. [Google Scholar] [CrossRef]
  23. Somnark, P.; Chyerochana, N.; Mongkolsuk, S.; Sirikanchana, K. Performance Evaluation of Bacteroidales Genetic Markers for Human and Animal Microbial Source Tracking in Tropical Agricultural Watersheds. Environ. Pollut. 2018, 236, 100–110. [Google Scholar] [CrossRef]
  24. R Core Team. R: A Language and Environment for Statistical Computing. R Foundation for Statistical Computing; R Core Team: Vienna, Austria, 2021; Available online: http://www.R-project.org/ (accessed on 23 April 2023).
  25. Helsel, D.R. Statistics for Censored Environmental Data Using Minitab and R. In Statistics in Practice, 2nd ed.; Wiley: Hoboken, NJ, USA, 2012. [Google Scholar]
  26. Holm, S. A Simple Sequentially Rejective Multiple Test Procedure. Scand. J. Statist. 1979, 6, 65–70. [Google Scholar]
  27. Ahmed, W.; Hughes, B.; Harwood, V.J. Current Status of Marker Genes of Bacteroides and Related Taxa for Identifying Sewage Pollution in Environmental Waters. Water 2016, 8, 231. [Google Scholar] [CrossRef]
  28. Harwood, V.J.; Staley, C.; Badgley, B.D.; Borges, K.; Korajkic, A. Microbial Source Tracking Markers for Detection of Fecal Contamination in Environmental Waters: Relationships Between Pathogens and Human Health Outcomes. FEMS Microbiol. Rev. 2014, 38, 1–40. [Google Scholar] [CrossRef]
  29. Ahmed, W.; Masters, N.; Toze, S. Consistency in the Host Specificity and Host Sensitivity of the Bacteroides HF183 Marker for Sewage Pollution Tracking. Lett. Appl. Microbiol. 2012, 55, 283–289. [Google Scholar] [CrossRef] [PubMed]
  30. Gourmelon, M.; Caprais, M.P.; Ségura, R.; Le Mennec, C.; Lozach, S.; Piriou, J.Y.; Rincé, A. Evaluation of Two Library-Independent Microbial Source Tracking Methods to Identify Sources of Fecal Contamination in French Estuaries. Appl. Environ. Microbiol. 2007, 73, 4857–4866. [Google Scholar] [CrossRef] [PubMed]
  31. He, X.; Liu, P.; Zheng, G.; Chen, H.; Shi, W.; Cui, Y.; Ren, H.; Zhang, X.-X. Evaluation of Five Microbial and Four Mitochondrial DNA Markers for Tracking Human and Pig Fecal Pollution in Freshwater. Sci. Rep. 2016, 6, 35311. [Google Scholar] [CrossRef] [PubMed]
  32. Vadde, K.K.; McCarthy, A.J.; Rong, R.; Sekar, R. Quantification of Microbial Source Tracking and Pathogenic Bacterial Markers in Water and Sediments of Tiaoxi River (Taihu Watershed). Front. Microbiol. 2019, 10, 699. [Google Scholar] [CrossRef]
  33. Waso, M.; Khan, S.; Khan, W. Development and Small-Scale Validation of a Novel Pigeon-Associated Mitochondrial DNA Source Tracking Marker for the Detection of Fecal Contamination in Harvested Rainwater. Sci. Total Environ. 2018, 615, 99–106. [Google Scholar] [CrossRef]
  34. Green, H.C.; Dick, L.K.; Gilpin, B.; Samadpour, M.; Field, K.G. Genetic Markers for Rapid PCR-Based Identification of Gull, Canada Goose, Duck, and Chicken Fecal Contamination in Water. Appl. Environ. Microbiol. 2012, 78, 503–510. [Google Scholar] [CrossRef]
  35. Shanks, O.C.; Atikovic, E.; Blackwood, A.D.; Lu, J.; Noble, R.T.; Domingo, J.S.; Seifring, S.; Sivaganesan, M.; Haugland, R.A. Quantitative PCR for Detection and Enumeration of Genetic Markers of Bovine Fecal Pollution. Appl. Environ. Microbiol. 2008, 74, 745–752. [Google Scholar] [CrossRef]
  36. Korajkic, A.; Stoeckel, D.; Griffith, J.F. Validation of Microbial Source Tracking Markers and Detection Protocols: Considerations for Effective Interpretation. In Manual of Environmental Microbiology, 4th ed.; Wiley: Hoboken, NJ, USA, 2015. [Google Scholar] [CrossRef]
  37. Ahmed, W.; Gyawali, P.; Feng, S.; McLellan, S.L. Host Specificity and Sensitivity of Established and Novel Sewage-Associated Marker Genes in Human and Nonhuman Fecal Samples. Appl. Environ. Microbiol. 2019, 85, e00641-19. [Google Scholar] [CrossRef]
  38. Tanganco, L.J.J.U.; Alberto, M.A.J.; Gotangco, C.K.Z. Forecast of Potential Areas of Urban Expansion in the Laguna de Bay Basin and Its Implications to Water Supply Security. Philipp. J. Sci. 2019, 148, 715–724. [Google Scholar]
  39. Laguna Lake Development Authority. Laguna de Bay 2013 Ecosystem Health Report Card; Laguna Lake Development Authority: Quezon City, Philippines, 2013. Available online: http://llda.gov.ph (accessed on 23 April 2023).
  40. Reyes, N.J.D.G.; Geronimo, F.K.F.; Redillas, M.M.; Hong, J. Water Quality Analysis and Evaluation of Management Strategies and Policies in Laguna Lake, Philippines. J. Wetl Res. 2018, 20, 43–53. [Google Scholar] [CrossRef]
  41. Greenpeace. The State of Water in the Philippines; Greenpeace: Quezon City, Philippines, 2007. [Google Scholar] [CrossRef]
  42. dela Peña, L.B.R.O.; Labrador, K.L.; Nacario, M.A.G.; Bolo, N.R.; Rivera, W.L. Microbial Source Tracking of Fecal Contamination in Laguna Lake, Philippines Using the Library-Dependent Method, Rep-PCR. J. Water Health 2021, 19, 762–774. [Google Scholar] [CrossRef] [PubMed]
  43. Palanca-Tan, R. Health and Water Quality Benefits of Alternative Sewerage Systems in Metro Manila, Philippines. Environ. Urban. 2017, 29, 567–580. [Google Scholar] [CrossRef]
  44. Selected Statistics on Agriculture; Philippine Statistics Authority (PSA): Quezon City, Philippines, 2019.
  45. Angeles, M.; Catelo, O.; Dorado, M. Backyard and Commercial Piggeries in the Philippines: Environmental Consequences and Pollution Control Options; Economy and Environment Program for Southeast Asia (EEPSEA): Singapore, September 2001. [Google Scholar]
  46. Catelo, M.A.O.; Narrod, C.A.; Tiongco, M.M. Structural Changes in the Philippine Pig Industry and Their/Environmental Implications; The International Food Policy Research Institute (IFPRI): Washington, DC, USA, 2008. [Google Scholar]
  47. Resource Assessment for Livestock and Agro-Industrial Wastes—Philippines. 2009. Available online: http://www.globalmethane.org/documents/ag_philippines_res_assessment.pdf (accessed on 23 April 2023).
  48. Selected Statistics on Agriculture; Philippine Statistics Authority (PSA): Quezon City, Philippines, 2015.
  49. Atienza, M.; Rodriguez, D.P.G.M.; Babilonia, D.R.; Guimary, M.; Rebancos, C. Food Safety Study of Duck Eggs Produced Along Laguna Lake Areas, Philippines. J. Nutr. Food Sci. 2015, S3, 1. [Google Scholar] [CrossRef]
  50. Green, H.; Weller, D.; Johnson, S.; Michalenko, E. Microbial Source-Tracking Reveals Origins of Fecal Contamination in a Recovering Watershed. Water 2019, 11, 2162. [Google Scholar] [CrossRef]
  51. Abello, J.J.M.; Malajacan, G.T.; Labrador, K.L.; Nacario, M.A.G.; Galarion, L.H.; Obusan, M.C.M.; Rivera, W.L. Library-Independent Source Tracking of Fecal Contamination in Selected Stations and Tributaries of Laguna Lake, Philippines. J. Water Health 2021, 19, 846–854. [Google Scholar] [CrossRef]
  52. Lasco, R.D.; Espaldon, M.V.O.; Tapia, M.A. (Eds.) Ecosystem and People: The Philippine Millenium Ecosystem Assessment (MA); University of the Philippines: Los Baños, Philippines, 2005. [Google Scholar]
  53. Moron, V.; Lucero, A.; Hilario, F.; Lyon, B.; Robertson, A.W.; DeWitt, D. Spatio-temporal Variability and Predictability of Summer Monsoon Onset over the Philippines. Clim. Dyn. 2009, 33, 1159–1177. [Google Scholar] [CrossRef]
  54. Bradshaw, J.K.; Snyder, B.J.; Oladeinde, A.; Spidle, D.; Berrang, M.E.; Meinersmann, R.J.; Oakley, B.; Sidle, R.C.; Sullivan, K.; Molina, M. Characterizing Relationships Among Fecal Indicator Bacteria, Microbial Source Tracking Markers, and Associated Waterborne Pathogen Occurrence in Stream Water and Sediments in a Mixed Land Use Watershed. Water Res. 2016, 101, 498–509. [Google Scholar] [CrossRef]
  55. Laguna Lake Development Authority. Laguna de Bay: Characteristics of Lake Ecosystem. 2021. Available online: https://llda.gov.ph/laguna-de-bay/ (accessed on 15 August 2021).
  56. Herrera, E.C.; Nadaoka, K.; Blanco, A.C.; Hernandez, E.C. Hydrodynamic Investigation of a Shallow Tropical Lake Environment (Laguna Lake, Philippines) and Associated Implications for Eutrophic Vulnerability. Asean Eng. J. Part C 2015, 4, 48–62. [Google Scholar]
  57. Laguna Lake Development Authority. LLDA Quarterly Water Quality Monitoring Report Laguna Lake and Tributary Rivers; Laguna Lake Development Authority: Quezon City, Philippines, 2019. Available online: https://llda.gov.ph/wp-content/uploads/dox/waterqualityrpt/2019/2019q4.pdf (accessed on 23 April 2023).
  58. Kistemann, T.; Claβen, T.; Koch, C.; Dangendorf, F.; Fischeder, R.; Gebel, J.; Vacata, V.; Exner, M. Microbial Load of Drinking Water Reservoir Tributaries During Extreme Rainfall and Runoff. Appl. Environ. Microbiol. 2002, 68, 2188–2197. [Google Scholar] [CrossRef]
  59. Tornevi, A.; Bergstedt, O.; Forsberg, B. Precipitation Effects on Microbial Pollution in a River: Lag Structures and Seasonal Effect Modification. PLoS ONE 2014, 9, e98546. [Google Scholar] [CrossRef]
  60. Jeng, H.A.C.; Englande, A.J.; Bakeer, R.M.; Bradford, H.B. Impact of Urban Stormwater Runoff on Estuarine Environmental Quality. Estuar. Coast. Shelf Sci. 2005, 63, 513–526. [Google Scholar] [CrossRef]
  61. Lucas, F.S.; Therial, C.; Gonçalves, A.; Servais, P.; Rocher, V.; Mouchel, J.-M. Variation of Raw Wastewater Microbiological Quality in Dry and Wet Weather Conditions. Environ. Sci. Pollut. Res. 2014, 21, 5318–5328. [Google Scholar] [CrossRef] [PubMed]
  62. Santos-Borja, A.; Nepomoceno, D. Laguna de Bay: Experience and Lessons Learned Brief. World Lake Database 2006, 15, 225–258. [Google Scholar]
  63. Walters, S.P.; Thebo, A.L.; Boehm, A.B. Impact of Urbanization and Agriculture on the Occurrence of Bacterial Pathogens and stx Genes in Coastal Waterbodies of Central California. Water Res. 2011, 45, 1752–1762. [Google Scholar] [CrossRef]
  64. Ballesté, E.; Blanch, A.R. Persistence of Bacteroides Species Populations in a River as Measured by Molecular and Culture Techniques. Appl. Environ. Microbiol. 2010, 76, 7608–7616. [Google Scholar] [CrossRef]
  65. USGS. Streamflow and the Water Cycle. 2019. Available online: https://www.usgs.gov/special-topic/water-science-school/science/streamflow-and-water-cycle/ (accessed on 25 October 2021).
  66. Laguna Lake Development Authority. LLDA Quarterly Water Quality Monitoring Report Laguna Lake and Tributary Rivers; Laguna Lake Development Authority: Quezon City, Philippines, 2019. Available online: https://llda.gov.ph/wp-content/uploads/dox/waterqualityrpt/2019/2019q3.pdf (accessed on 23 April 2023).
  67. Laguna Lake Development Authority. LLDA Quarterly Water Quality Monitoring Report Laguna Lake and Tributary Rivers; Laguna Lake Development Authority: Quezon City, Philippines, 2020. Available online: https://llda.gov.ph/wp-content/uploads/dox/waterqualityrpt/2020/2020q1.pdf (accessed on 23 April 2023).
  68. PHILMINAQ. Water Quality Criteria and Standards for Freshwater and Marine Aquacultures; PHILMINAQ: Quezon City, Philippines, 2014. [Google Scholar]
  69. Bali, M.; Gueddari, M. Removal of Phosphorus from Secondary Effluents Using Infiltration-Percolation Process. Appl. Water Sci. 2019, 9, 54. [Google Scholar] [CrossRef]
  70. Bendicho, C.; Lavilla, I. Water Analysis|Sewage. In Encyclopedia of Analytical Science; Elsevier: Amsterdam, The Netherlands, 2019; pp. 371–381. [Google Scholar] [CrossRef]
  71. Ritter, W.; Shirmohammadi, S. Agricultural Nonpoint Source Pollution: Watershed Management and Hydrology; CRC Press: Boca Raton, FL, USA, 2000. [Google Scholar]
  72. Bunce, J.T.; Ndam, E.; Ofiteru, I.D.; Moore, A.; Graham, D.W.; Graham, D.W. A Review of Phosphorus Removal Technologies and Their Applicability to Small-Scale Domestic Wastewater Treatment Systems. Front. Environ. Sci. 2018, 6, 8. [Google Scholar] [CrossRef]
  73. van Puijenbroek, P.J.T.M.; Beusen, A.H.W.; Bouwman, A.F. Global Nitrogen and Phosphorus in Urban Waste Water Based on the Shared Socio-economic Pathways. J. Environ. Manag. 2019, 231, 446–456. [Google Scholar] [CrossRef]
Figure 1. Map of Laguna Lake sampling stations (generated through R programming). Nine sampling stations were selected to adequately represent each part of the lake.
Microorganisms 11 01142 g001
Figure 2. Log copy number (copies mL−1, (A)) and occurrence (%, (B)) of Bacteroides markers in the Laguna Lake monitoring stations from August 2019 to January 2020. Those that were below the limit of detection are shown as <LOD. qPCR analysis was carried out to detect and quantify host-associated contamination in water samples collected from nine sampling sites. The resulting copy numbers from each sampling site for each source were averaged to determine the most abundant source of contamination in the lake. The occurrence of each source was also obtained by measuring the frequency of detection of each marker across all nine sampling sites within the given sampling period.
Microorganisms 11 01142 g002
Figure 3. Temporal trend of mean marker abundance across Laguna Lake monitoring stations from August 2019 to January 2020. The mean copy number of each marker across all sites was obtained to determine the temporal trend of fecal contamination in the given sampling period. The period of August to October 2019 represents the wet season, while November 2019 to January 2020 represents the dry season. The broken lines represent the general trend or pattern of abundance of each marker throughout the 6 months of the sampling period.
Microorganisms 11 01142 g003
Figure 4. Seasonal patterns and spatial distribution in terms of the abundance of different MST Bacteroides markers (log10 copy number mL−1) during the wet and dry seasons, and both. To visualize the seasonal patterns of fecal contamination for each source, the mean copy number of each marker across all sites was obtained and plotted against the map of the lake generated through R programming. The period of August to October 2019 represents the wet season, while November 2019 to January 2020 represents the dry season.
Microorganisms 11 01142 g004
Table 1. Primer sequences of host-associated Bacteroides 16S rDNA markers.
AssayPrimer NameSequences (5′-3′)Amplicon Size (bp)Annealing Temp (°C)Reference
CowBoBac367 FGAAG(G/A)CTGAACCAGCCAAGTA10055[11]
BoBac367 RGCTTATTCATACGGTACATACAAG
PigPig-2-Bac41FGCATGAATTTAGCTTGCTAAATTTGAT11655[6]
Pig-2-Bac163RACCTCATACGGTATTAATCCGC
HumanHF183FATCATGAGTTCACATGTCCG12658[10]
BacR287CTTCCTCTCAGAACCCCTATCC
DuckBac366FTTGGTCAATGGGCGGAAG10860[12]
Duck474RGCACATTCCCACACGTGAGA
ChickenC160FAAGGGAGATTAATACCCGATGATG10560[12]
Bac265RCCGTTACCCCGCCTACTAC
Table 2. Number and percentage of positive samples in each host-specific assay.
HostHF183
(Human)
BoBac
(Cow)
Pig-2-Bac
(Pig)
DuckBac
(Duck)
ChickenBac
(Chicken)
Human21/24 (88)17/20 (85)0/20 (0)0/20 (0)0/20 (0)
Cow0/20 (0)18/20 (90)0/20 (0)0/20 (0)15/20 (75)
Pig0/15 (0)12/15 (80)15/15 (100)0/15 (0)15/15 (100)
Duck0/18 (0)15/15 (100)0/18 (0)17/18 (94)15/15 (100)
Chicken1/20 (5)19/20 (95)0/20 (0)0/20 (0)15/23 (65)
Note: Corresponding percentages are enclosed in parentheses.
Table 3. Performance characteristics of Bacteroides 16S rDNA markers.
MarkerSensitivitySpecificityAccuracyPositive Predictive ValueNegative Predictive Value
Pig-2-Bac1.001.001.001.001.00
DuckBac0.941.000.991.000.99
HF1830.880.990.960.950.96
BoBac0.900.100.280.220.78
ChickenBac0.650.310.400.250.61
Table 4. Spearman correlation (ρ) of Bacteroides marker concentration with environmental parameters. The measurements of environmental parameters were obtained from the Laguna Lake Development Authority (LLDA) and covered the period of August 2019 to January 2020.
Environmental ParameterCorrelation (ρ) with Bacteroides Marker Concentration (log10 Copy Number mL−1)
DuckBacPig-2-BacHF183
Ammonia (mg/L)−0.080.070.27
BOD (mg/L)−0.21−0.230.05
DO (mg/L)−0.090.04−0.25
Fecal coliform (MPN/100 mL geomean)0.20−0.020.06
Nitrate (mg/L)0.14−0.08−0.22
pH (units)0.020.07−0.03
Phosphate (mg/L)0.120.010.45 **
** p < 0.001.
Disclaimer/Publisher’s Note: The statements, opinions and data contained in all publications are solely those of the individual author(s) and contributor(s) and not of MDPI and/or the editor(s). MDPI and/or the editor(s) disclaim responsibility for any injury to people or property resulting from any ideas, methods, instructions or products referred to in the content.

