Article

Elevated Temperature-Induced Epimicrobiome Shifts in an Invasive Seaweed Gracilaria vermiculophylla

1
Marine Ecology Division, GEOMAR Helmholtz-Zentrum für Ozeanforschung Kiel, Düsternbrooker Weg 20, D-24105 Kiel, Germany
2
Alfred Wegener Institute, Helmholtz Center for Polar and Marine Research, Am Handelshafen 12, 27570 Bremerhaven, Germany
3
College of Marine Life Sciences, Ocean University of China, Qingdao 266003, China
4
Institute of Evolution & Marine Biodiversity, Ocean University of China, Qingdao 266003, China
5
Ocean School, Yantai University, Yantai 264005, China
*
Authors to whom correspondence should be addressed.
These authors contributed equally to this work.
Microorganisms 2023, 11(3), 599; https://doi.org/10.3390/microorganisms11030599
Submission received: 7 December 2022 / Revised: 4 February 2023 / Accepted: 5 February 2023 / Published: 27 February 2023
(This article belongs to the Special Issue Macro and Microorganism Interactions 2.0)

Abstract

:
Epibacterial communities on seaweeds are affected by several abiotic factors such as temperature and acidification. Due to global warming, surface seawater temperatures are expected to increase by 0.5–5 °C in the next century. However, how epibacterial communities associated with seaweeds will respond to global warming remains unknown. In this study, we investigated the response of epibacterial communities associated with the invasive Gracilaria vermiculophylla exposed to 3 °C above ambient temperature for 4 months using a benthocosm system in Kiel, Germany, and 16S rRNA gene amplicon sequencing. The results showed that elevated temperature affected the beta-diversity of the epibacterial communities. Some potential seaweed pathogens such as Pseudoalteromonas, Vibrio, Thalassotalea, and Acinetobacter were identified as indicator genera at the elevated temperature level. Thirteen core raw amplicon sequence variants in the elevated temperature group were the same as the populations distributed over a wide geographical range, indicating that these core ASVs may play an important role in the invasive G. vermicullophylla. Overall, this study not only contributes to a better understanding of how epibacterial communities associated with G. vermiculophylla may adapt to ocean warming, but also lays the foundation for further exploration of the interactions between G. vermiculophylla and its epimicrobiota.

1. Introduction

Epibacterial communities on seaweeds play an important role in the health, development, and disease of their algal hosts [1,2,3], depending on both the algal host itself (e.g., algal species, age) [3,4] and many abiotic factors (e.g., salinity, temperature, and carbon dioxide) [3,5,6,7]. To date, it has been documented that elevated temperatures can cause shifts in epibacterial communities in seaweeds [3,5,8]. For example, the relative abundance of Rhodobacteraceae on Fucus vesiculosus increased from 20% to 50% when temperature increased from 5 °C to 25 °C, and OTU (operational taxonomy unit) diversity was highest at 15 °C [5]. Epibacterial communities on F. vesiculosus forma mytili were significantly affected by 5 °C higher temperatures over an 11 week period in a mesocosm experiment. Elevated temperature significantly reduced the growth of F. vesiculosus forma mytili by 20%. Meanwhile, indicator OTUs were used to compare the species with higher relative abundance between the control and elevated temperature levels. Compared to the ambient temperature (control), the relative abundance of the indicator OTU Octadecabacter antarcticus of the Rhodobacter-aceae family decreased from 4.72‰ to 0.46‰ at elevated temperature. However, the relative abundance of an indicator OTU of the Gammaproteobacteria remarkably increased from week 4 to week 11 at elevated temperature, with a concomitant decrease at ambient temperature [8]. Mensch et al. [3] showed that the temperature effect on the epibacterial communities of F. vesiculosus was stronger in summer than in spring, while the number of the indicator OTUs at elevated temperature increased significantly from 12 to 38 during the summer period.
Gracilaria vermiculophylla is a red alga native to the northwest Pacific [7,9]. Over the past 100 years, it has successfully invaded many coastal habitats worldwide, including the eastern Pacific, western Atlantic, eastern Atlantic, and Mediterranean [7,10]. The invasion of G. vermiculophylla has had a severe negative impact on local coastal community structure, species richness, and ecosystem function [11]. This species has been listed as one of the most invasive seagrasses in Europe [11,12,13]. G. vermiculophylla can protect itself from facultative pathogens [14] depending on the associated microbiota, and the alga also has a core microbiome that has been detected in all Asian, European, and American populations studied so far [15]. The core microbiome may provide certain important functions, such as the production of vitamin B12 [16], which are valuable to the algal hosts. Similarly, the epibacterial communities of the invasive G. vermiculophylla was important for its successful invasion. Saha et al. [11] found that invasive G. vermiculophylla populations were significantly better defended than native populations when tested against the bacteria of the invaded area, suggesting that invasive G. vermiculophylla may rapidly adapt to the bacteria of the invaded areas. In addition, invasive algae were shown to be more capable than native algae of forming new functional symbiotic associations with microbiota in newly invaded habitats [11].
The richness, abundance, and composition of epibacterial communities in G. vermiculophylla have been shown to be influenced by abiotic factors such as salinity and time [7]. In particular, temperature is considered to be a very important environmental factor for seaweed growth. However, global sea surface temperatures are expected to increase by 0.5–2.5 °C or even 5 °C over the next century in the context of climate change [17,18]. Given the crucial ecological role of epibacterial communities for G. vermiculophylla and other seaweeds, it is important to know how increased seawater temperature translates into shifts in the epimicrobiome of these marine organisms.
In this study, we investigated the effects of elevated temperature on the dynamic changes of epibacterial communities on invasive G. vermiculophylla using a benthocosm system in Kiel, Germany, and 16S rRNA gene amplicon sequencing. We characterized the effect of elevated temperature on the dynamic composition and diversity of the epibacterial communities. We also tested whether there were core microbiota and indicator species. Understanding the dynamics of epibacteria on G. vermiculophylla will help us to explore potential mechanisms behind its invasion.

2. Materials and Methods

2.1. Collection of G. vermiculophylla Populations

Forty individuals of G. vermiculophylla were collected from Falkensteiner Strand (54°23′53.7″ N, 10°11′25.7″ E) at the Kiel Fjord on 22 May 2019. The samples were brought to the laboratory within 2 h using a cooler box. They were maintained in 5 L aquaria with aeration in a climate chamber for 2 days at 15 °C and a salinity of 14 psu (close to the salinity observed at the sampling site).

2.2. Experimental Design and Setup

The temperature experiment was conducted at the Kiel benthocosm facility in 2000 L mesocosms [18] from 24 May to 28 August 2019. Briefly, seawater was constantly supplied from the Kiel Fjord via a pipeline at a depth of 1 m with a flow rate of 1.3 tank volumes per 24 h. The fluctuations of seawater parameters (temperature, pH, and salinity) in the benthocosms were the same as in the Kiel Fjord. The seawater temperature in the tanks was monitored by internal sensors and could be controlled automatically by a heating and cooling system. Ten outdoor tanks were divided into two groups. The temperature of five tanks was the same as the ambient seawater temperature in the Kiel Fjord (normal temperature, Nt), while the temperature of the other five tanks was maintained at 3 °C above the ambient seawater temperature (higher temperature, Ht). Each replicate (net bag) contained material from only one individual of G. vermiculophylla. In general, most specimens collected at Falkensteiner Strand originally weighed 2–3 g. A 1 g piece of each individual was cut off, transferred to a net bag, and placed in the tank. Each net bag contained a 1 g piece from a different individual. Four net bags containing 1.0 g of G. vermiculophylla were placed in each tank. In order to maximize the exposure of G. vermiculophylla to sunlight, the nets containing G. vermiculophylla were fixed in the center of each tank just below the water surface. Five replicates (five tanks) were designed for both Nt and Ht groups.

2.3. Sampling of Epibacteria from G. vermiculophylla

For epibacterial sampling for 16S rRNA gene amplicon sequencing, one net bag was removed from each tank at each sampling time (28 May, 28 June, 28 July and 28 August 2019). Then, 1.0 g of G. vermiculophylla from the bag was transferred to a sterilized 50 mL Falcon tube filled with 15 mL of sterile seawater (SSW) and 15 sterilized glass beads. The Falcon tubes were then shaken on an oscillator for 5 min. The resulting bacterial cell suspension in the Falcon tube was transferred to a new sterilized 50 mL Falcon tube and centrifuged at 12,000 rpm (4 °C) for 10 min. The supernatant was removed, and the pellet was preserved by the addition of 10 mL of 100% anhydrous ethanol. Then, 40–45 cm3 of nitrogen was pumped into the tubes to remove oxygen. The tubes were transported on ice to Qingdao, China, and immediately stored at −20 °C until further processing.

2.4. Genomic DNA Extraction and 16S rRNA Gene Amplicon Sequencing

Genomic DNA was extracted using the HiPure Soil DNA Kits (Magen, Guangzhou, China) according to the manufacturer’s protocols. The 16S rDNA V3–V4 region of the ribosomal RNA gene was amplified by PCR (95 °C for 2 min, followed by 30 cycles at 95 °C for 1 min, 60 °C for 1 min, and 72 °C for 1 min, and a final extension at 72 °C for 7 min) using primers 341F: CCTACGGGNGGCWGCAG, 806R: GGACTACHVGGGTATCTAAT. PCR reactions were performed in a triplicate 50 μL mixture containing 10 μL of 5× Q5@ Reaction Buffer, 10 μL of 5× Q5@ High GC Enhancer, 1.5 μL of 2.5 mM dNTPs, 1.5 μL of each primer (10 μM), 0.2 μL of Q5@ High-Fidelity DNA Polymerase, and 50 ng of template DNA. Related PCR reagents were from New England Biolabs, USA. Amplicons were extracted from 2% agarose gels and purified using the AxyPrep DNA Gel Extraction Kit (Axygen Biosciences, Union City, CA, USA) according to the manufacturer’s instructions. Purified amplicons were pooled in equimolar and paired-end sequenced (PE250) on an Illumina NovaSeqTM 6000 Sequencing platform according to the standard protocols. The raw reads were uploaded to the NCBI Sequence Read Archive (SRA) database (Accession Number PRJNA909032).

2.5. Sequence Quality Filtering and Taxonomy Annotation

Quality control and clustering were carried out using the DADA2 R package (version 1.14) [19]. Raw reads were filtered and truncated by removing reads containing unknown nucleotides and removing primer sequences. Then, a dereplicated list of unique sequences and their abundances was generated by taking the average of the positional qualities of the component reads. After that, paired-end denoised reads were merged as raw amplicon sequence variants (ASVs) with a minimum overlap of 12 bp. Chimera sequences were identified and deleted using the UCHIME algorithm [20]. After chimera removal, the denoised, chimera-free ASV sequences and their abundances were compiled.
The representative ASV sequences were classified taxonomically by a naïve Bayesian model using the RDP classifier (version 2.2) [21] based on the SILVA database (version 138.1) [22] with the confidence threshold value of 0.8. Sequences classified as unknown and chloroplasts were removed prior to subsequent analyses. The raw reads were uploaded to the NCBI Sequence Read Archive (SRA) database (accession number PRJNA909032).

2.6. Statistical Analysis

To show the species composition at both temperature levels, the abundance statistics of each taxon were visualized using Krona (version 2.6) [22]. The stacked bar plot of community composition was visualized in R using the ggplot2 package (version 2.2.1) [23].
Alpha diversity indices were calculated in QIIME 2 [24]. ASV rarefaction curves and rank abundance curves were plotted in the R package ggplot2 package (version 2.2.1). Welch’s t-test and Kruskal–Wallis H-test, as implemented in the R project Vegan package (version 2.5.3), were used to compare alpha diversity indices between different groups for significant differences [25].
Beta diversity indices were used to assess the diversity of epibacterial communities. Principal coordinates analysis (PCoA) based on Bray–Curtis distances was generated using the R-project Vegan package (version 2.5.3). PERMANOVA (Adonis) was used on the distance matrix to test for differences between treatments.
Core epibacterial microbiota were defined as taxa that were consistently present in 100% of the samples (regardless of their relative abundance in the community). Venn analysis was performed using the R project Venn Diagram package (version 1.6.16) to identify unique and common species or ASVs [26]. Species comparison between groups was calculated using Welch’s t-test in Vegan package (version 2.5.3). Species comparison between normal and elevated temperature groups was calculated using the Kruskal–Wallis H-test.
The indicator species associated with elevated temperature was calculated using the indicator value (IndVal) method. It can be applied at different taxonomic levels [27]. IndVal calculations and cross-validation tests were performed using the labdsv package (version 2.0-1) in the R project [28]. Indicator species were selected at the genus level with p ≤ 0.05 and IndVal > 0.7 [29].
To infer the functional potential of epibacterial microbiomes, the Kyoto Encyclopedia of Genes and Genomes (KEGG) pathway analysis of ASVs was inferred using Tax4Fun (version 1.0) [30]. Analysis of functional differences between groups was calculated using Welch’s t-test and Kruskal–Wallis H-test in the Vegan package (version 2.5.3).

3. Results

3.1. Sequencing Summary of 16S rRNA Gene Amplicon Sequencing

The temperature changes during the experiment are shown in Figure 1. There were a total of 2,557,648 raw reads in the Nt group and 2,562,978 raw reads in the Ht group. After filtering, the numbers were 2,266,776 and 2,134,697, respectively. A total of 37,471 ASVs and 31,712 ASVs were obtained from the Nt and Ht samples, respectively. The ASV number of the Nt group was highest in June (Nt2, 12,711). The ASV number of the Ht group gradually decreased over time (Table S1). Good’s coverage indices together with the rarefaction curves indicated that sufficient sequencing was achieved to capture the full diversity of the epibacterial communities in this study (Figure S1).

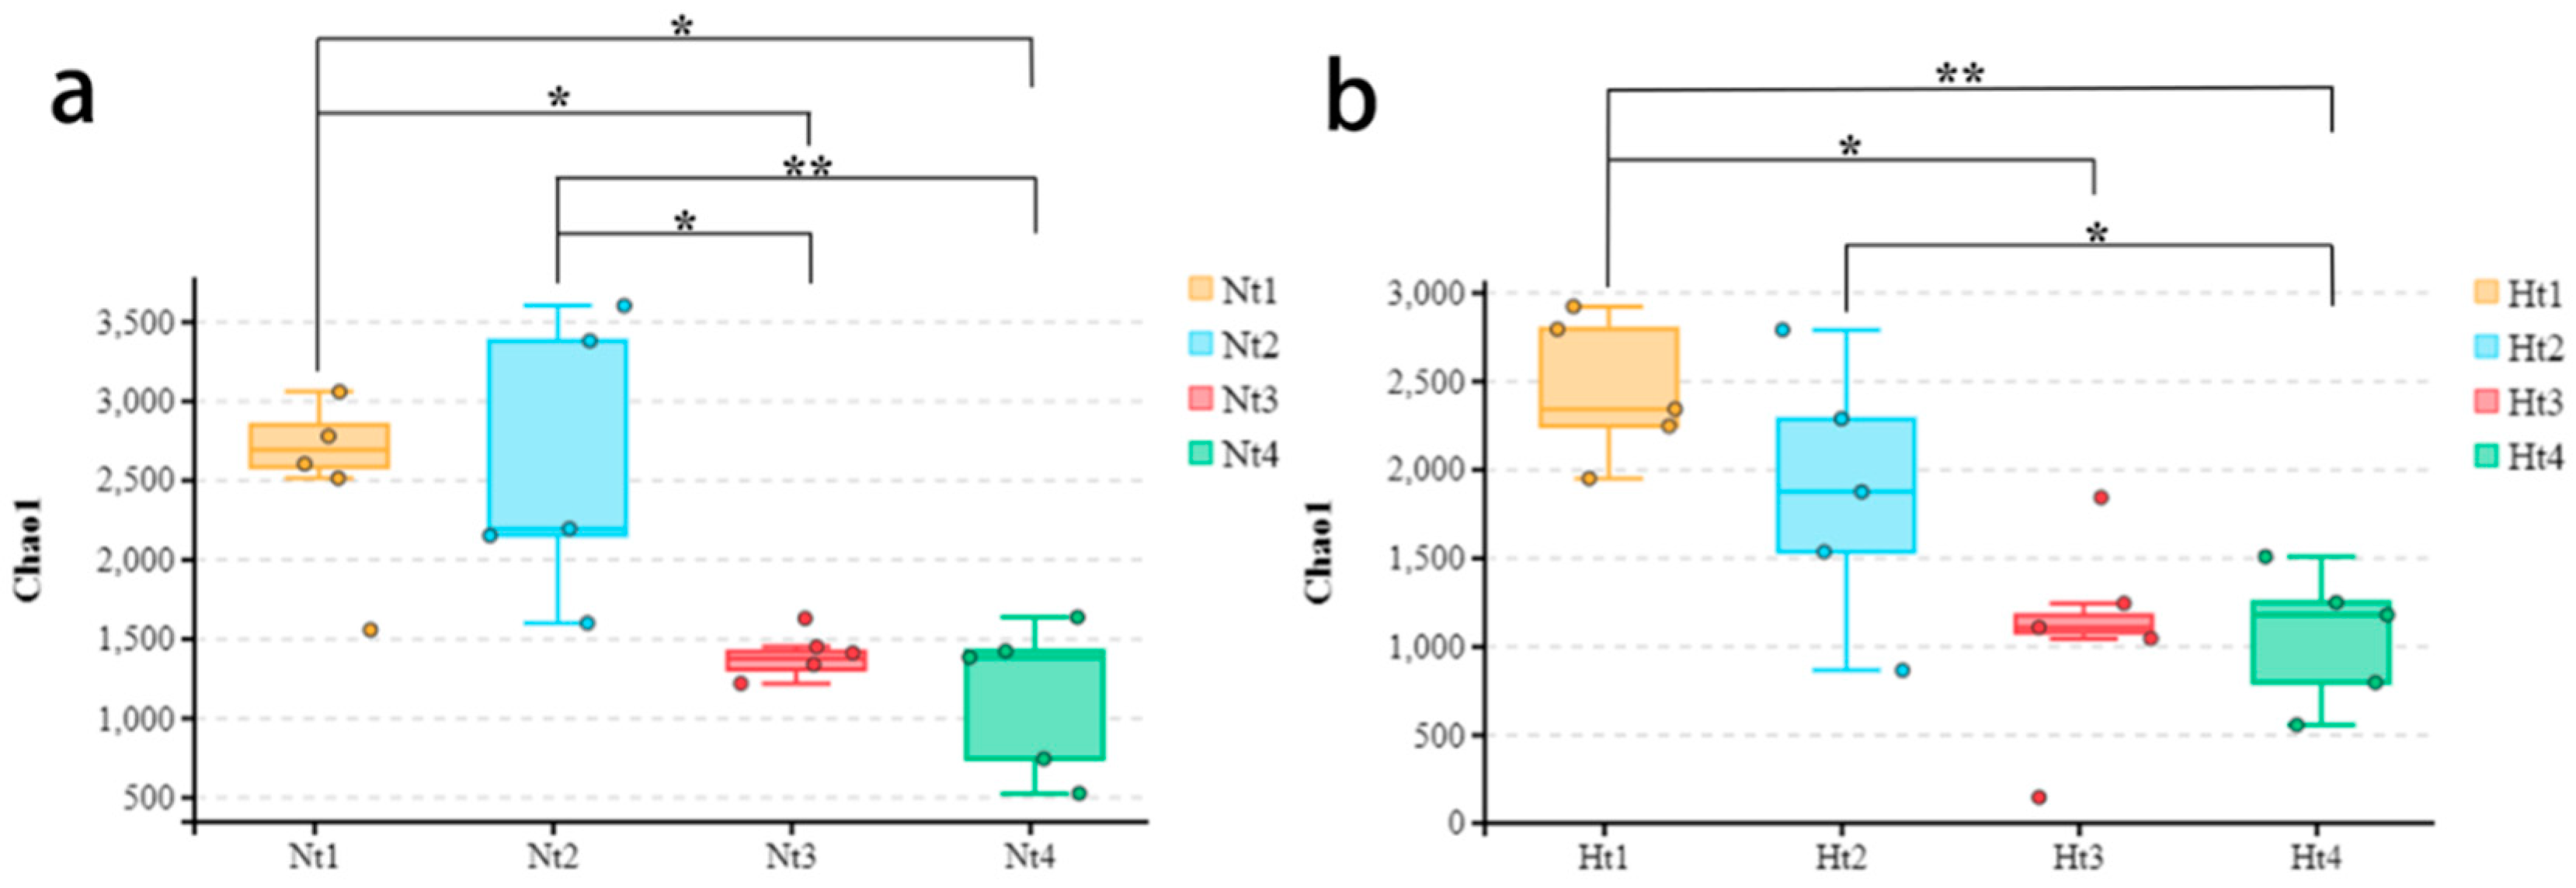
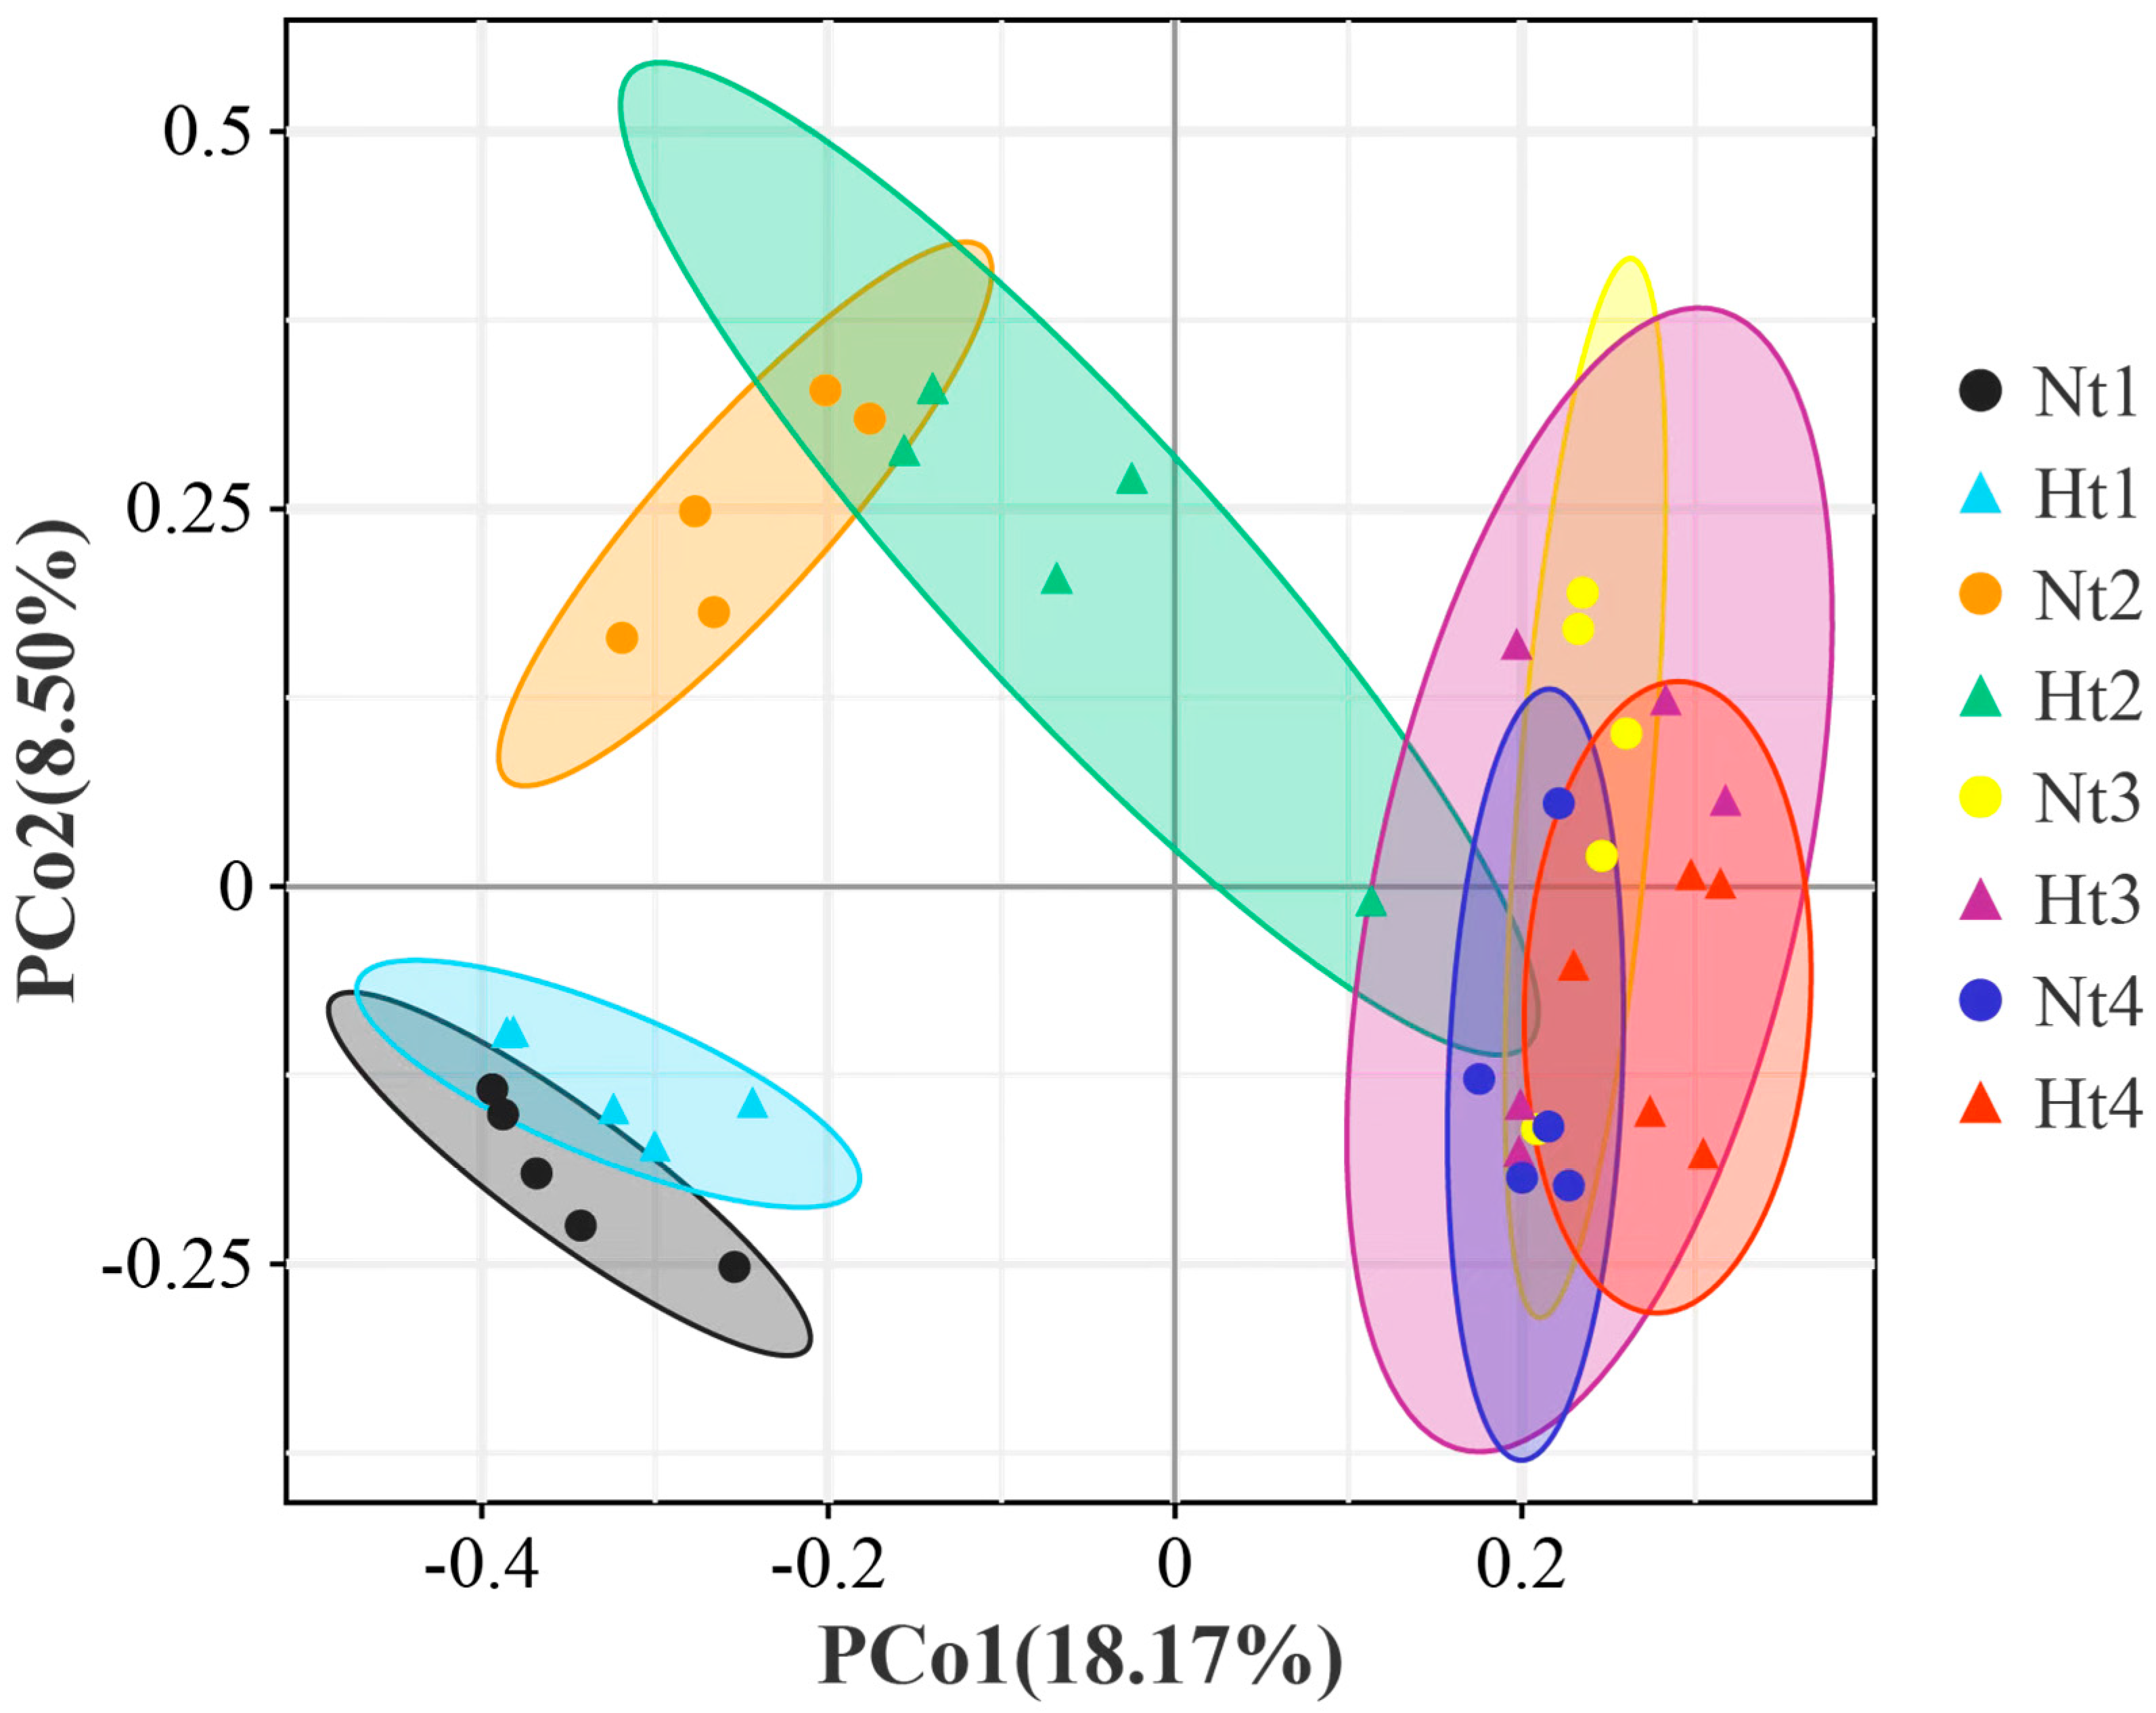
3.2. Effects of Elevated Temperature on Epibacterial Diversity Communities

There were no significant differences in the Shannon and Chao 1 indices between the Nt and Ht groups. However, Chao1 showed significant differences within both the Nt and Ht groups (Figure 2a,b, Table S2; Kruskal–Wallis test, p ≤ 0.05). The Nt group significantly differed between May and July, between May and August, and between June and July. Chao 1 showed highly significant differences between June and August within the Nt group. In the Ht group, there were significant differences between May and July, and between June and August. For Chao 1, highly significant differences were found between May and August.
Regarding beta diversity, a principal coordinate analysis (PCoA) plot based on Bray–Curtis distance revealed the changes in epibacterial communities at the two temperature levels. PCo1 and PCo2 explained 18.17% and 8.50% of the variation between samples, respectively (Figure 3). Except for July (Nt3 vs. Ht3; Adonis, p = 0.886), the bacterial community compositions in the other months were all significantly different for each of the Nt and Ht groups (Table 1). The difference in epibacterial community composition between the Nt and Ht groups was highly significant in August (Nt4 vs. Ht4; Adonis, p = 0.007). The results showed that Nt and Ht samples harbored different epibacterial communities.

3.3. Species Composition of Epibacterial Communities on G. vermiculophylla

Proteobacteria were the most dominant phylum in all G. vermiculophylla samples regardless of heat treatment (Figure 4a). Proteobacteria, Bacteroidetes, Firmicutes, and Actinobacteria accounted for almost 90% of the species composition in the Nt group, of which the relative abundances were 69.10% ± 20.78%, 13.54% ± 7.09%, 6.00% ± 7.59%, and 1.90% ± 1.89%, respectively. The relative abundance of Proteobacteria in the Nt group gradually decreased over the months (Nt1, 85.31% ± 2.37% vs. Nt4, 53.95% ± 25.90%). As for the Ht group, the first four phyla were the same as in the Nt group. The relative abundances of Proteobacteria, Bacteroidetes, Firmicutes, and Actinobacteria were 63.45% ± 15.82%, 13.60% ± 5.46%, 6.82% ± 2.14%, and 4.81% ± 2.01%, respectively. It is worth noting that the relative abundance of Firmicutes in the Ht group increased over time, from 0.50% ± 0.20% in May to 11.50% ± 4.99% in August.
At the genus level, Pseudoalteromonas, Vibrio, Shewanella, and Dokdonia were the top four dominant genera with relative abundances of 14.72% ± 14.69%, 7.63% ± 8.16%, 7.12% ± 7.25%, and 2.49% ± 3.71%, respectively, in the Nt group (Figure 4b). The relative abundance of Pseudoalteromonas and Vibrio in the Nt group showed a decreasing trend with month. As for the Ht group, Pseudoalteromonas, Thalassotalea, Shewanella, and Vibrio were the dominant genera, for which the relative abundances were 15.21% ± 13.95%, 4.72% ± 6.70%, 4.10% ± 4.49%, and 3.14% ± 2.20%, respectively. The relative abundance of Pseudoalteromonas showed an initial decreasing trend from May to July, followed by an increasing trend from July to August.

3.4. Core Epibacterial ASVs on G. vermiculophylla at Two Temperature Levels

In this study, we defined core ASVs that were always present in 100% of the samples as the core epibacterial microbiota (regardless of their relative abundance in the community). In general, 214 core ASVs were detected in the Nt group (Figure 5a). In the Ht group, the number of core ASVs was 234 (Figure 5b). In the Nt group, these ASVs mainly belonged to Proteobacteria, Bacteroidetes, Firmicutes, and Actinobacteria with numbers of 145, 35, 14, and 7, respectively. The most abundant of these core bacteria were members of Caulobacterales (Caulobacteraceae, Brevundimonas, ASV000002), Vibrionales (Vibrionaceae, Vibrio, ASV000003), Alteromonadales (Pseudoalteromonadaceae, Pseudoalteromonas, ASV000001), and Alteromonadales (Shewanellaceae, Shewanella, ASV000005) (Table S1). As for the Ht group, the core ASVs also belonged mainly to Proteobacteria, Bacteroidetes, Firmicutes, and Actinobacteria. Their numbers were 156, 45, 15, and five, respectively. The most abundant of these core bacteria were members of Alteromonadales (Pseudoalteromonadaceae, Pseudoalteromonas, ASV000001), Alteromonadales (Colwelliaceae, Thalassotalea, ASV000006), Enterobacteriales (Enterobacteriaceae, Klebsiella, ASV000011), and Alteromonadales (Pseudoalteromonadaceae, Pseudoalteromonas, ASV000004). The relative abundance of the core ASVs in both groups varied over the different months.

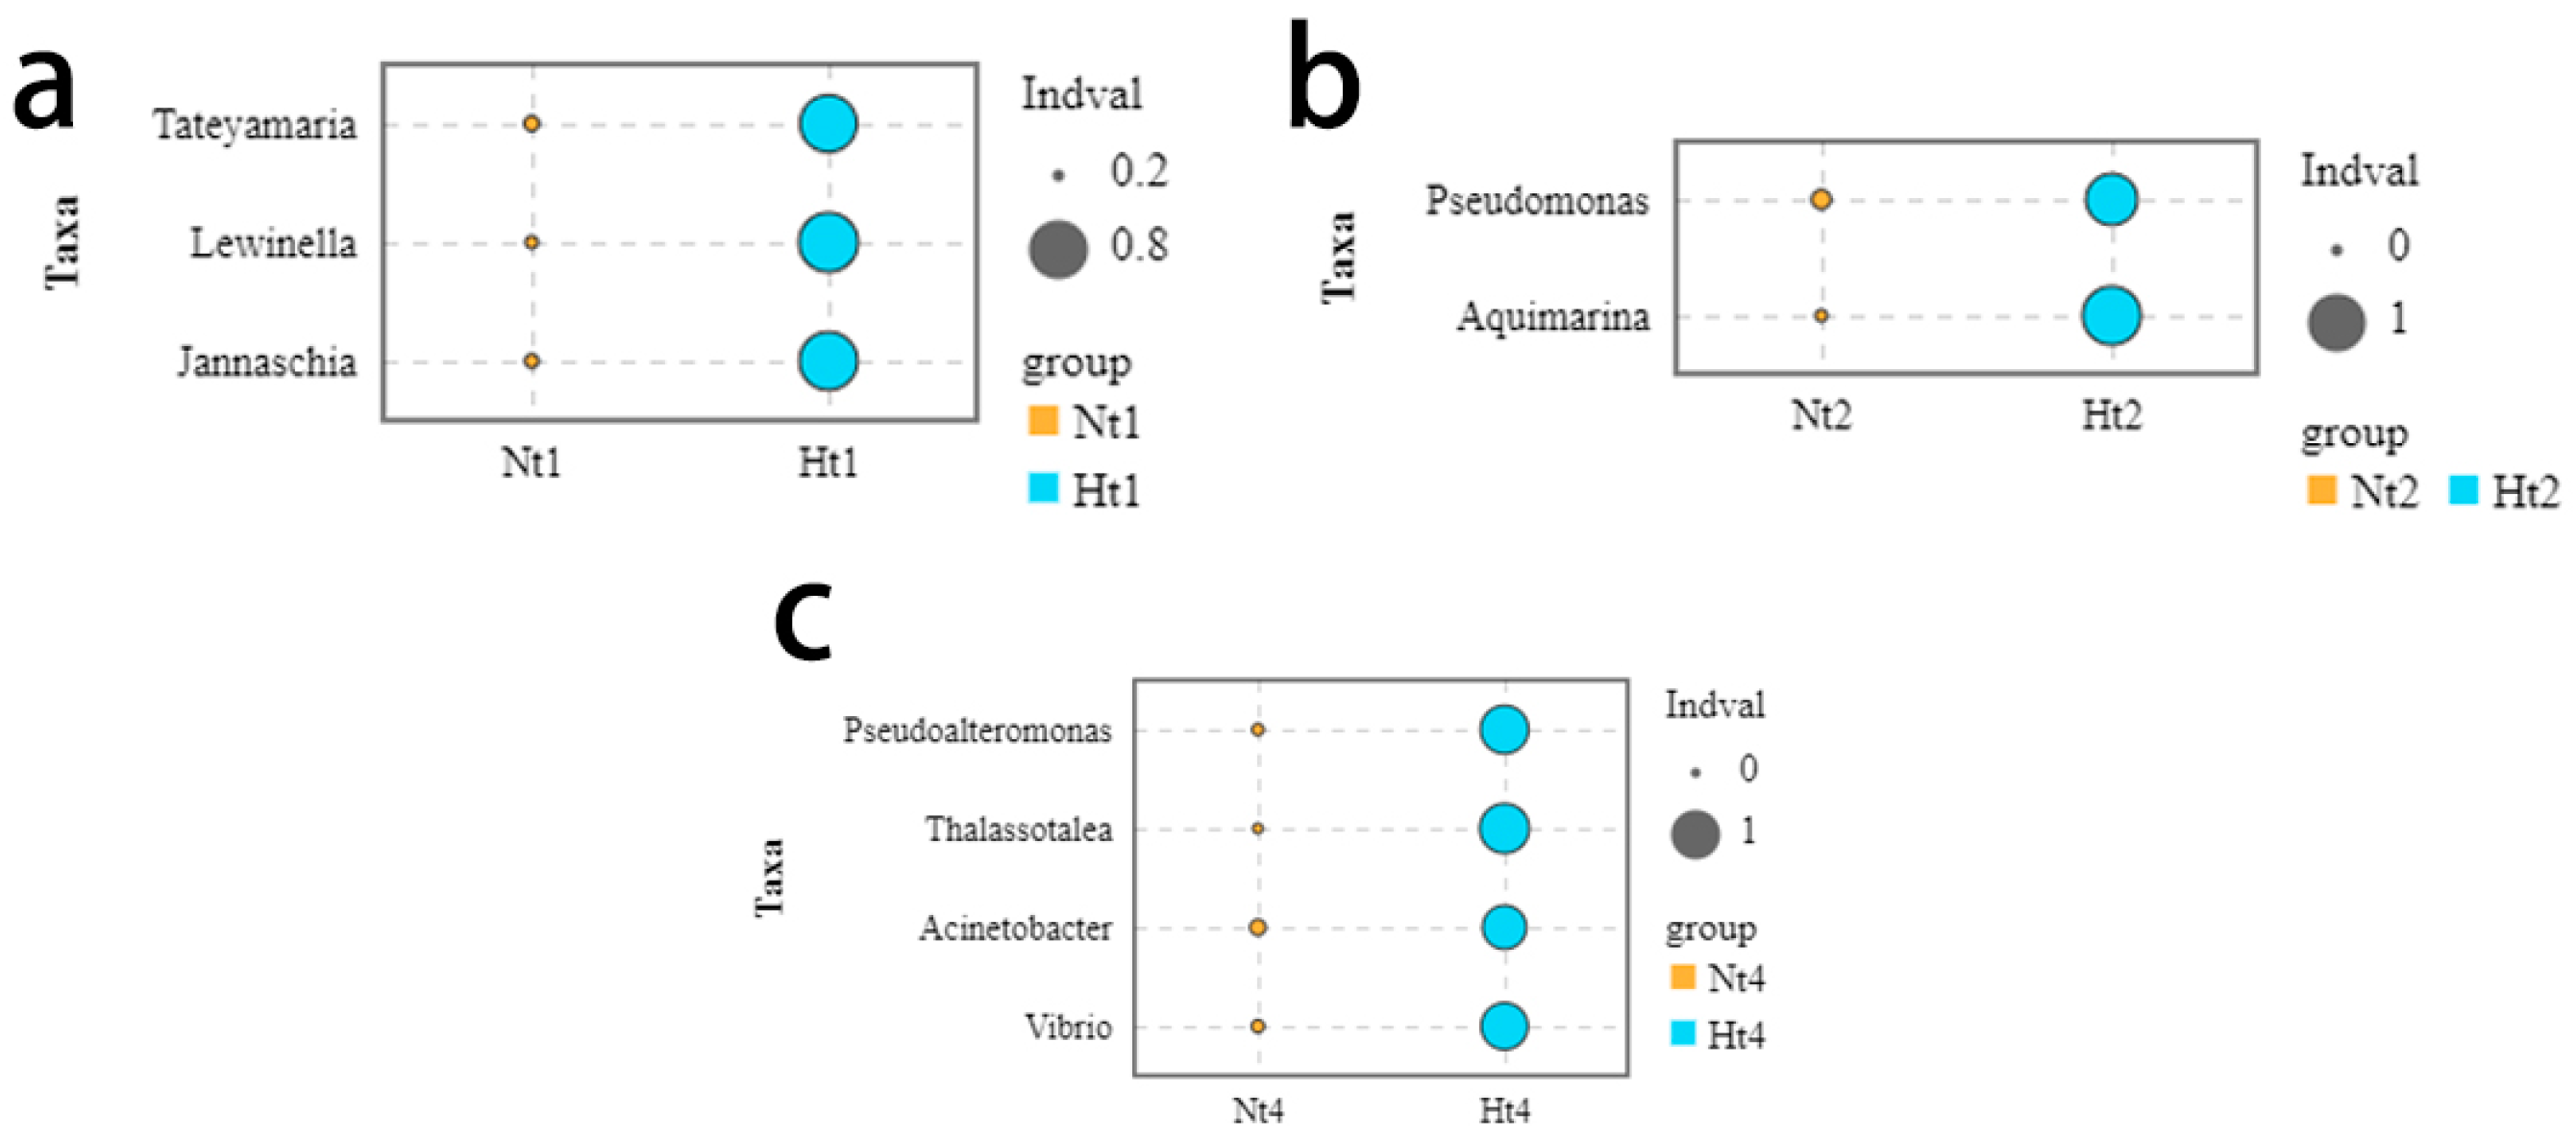
3.5. Indicator Species over Time at Two Temperature Level

The indicator value (Indval) method was used to test whether specific bacterial genera were associated with G. vermiculophylla at the two temperature levels. Taxa with p ≤0.05 and Indval ≥0.7 were considered as indicator genera [29]. In the Nt group, there were six indicator genera in May, 10 indicator genera in June, and two indicator genera in July, while no indicator genera were found in August (Table S2). As for the Ht group, there were 35 indicator genera in May, eight indicator genera in June, and 11 indicator genera in August, while no indicator genera were found in July (Table S2). We also selected some extremely significant indicator genera (p ≤ 0.05, Indval ≥0.7, relative abundance >0.3). Interestingly, no highly significant indicator genera were found in the Nt group at this level. In the Ht group, Tateyamaria, Lewinella, and Jannaschia were the extremely significant indicator genera in May (Figure 6a). Aquimarina and Pseudomonas were the highly significant indicator genera in June (Figure 6b). Pseudoalteromonas, Thalassotalea, Acinetobacter, and Vibrio were the highly significant indicator genera in August (Figure 6c).

3.6. Functional Prediction

Heatmaps were used to visualize the main differential functions (Figure 7). Compared to the Nt group, functions related to cofactor and vitamin metabolism, cell growth, and death were more abundant in the Ht group epimicrobiome in May (Welch’s t-test, p ≤ 0.05) (Figure S2). In June, the functions related to nucleotide metabolism and secondary metabolite biosynthesis were significantly higher in the epimicrobiome of the Ht group (Welch’s t-test, p ≤ 0.05). Functions related to infectious diseases were highly significantly enriched in the epimicrobial communities of the Ht group in August (Welch’s t-test, p ≤ 0.01).

4. Discussion

Gracilaria vermiculophylla has an optimum growth temperature of around 16 °C; therefore, artificial warming above this threshold will put pressure on its performance [31]. Performance will progressively decrease with increasing degree-days above this threshold [32] if acclimation does not result in a corresponding shift in the thermal optimum. In this study, the number of degree-days of supra-optimal thermal conditions for G. vermiculophylla was more than twice as high in the warmed treatment (399 vs. 126), and we suggest that the algae were consequently more stressed here than under ambient conditions. Stress can lead to a weakening of algal control over their bacterial epibionts [32].
In this study, we tested the influence of 3 °C higher temperature on the diversity and composition of the epibacterial communities of the invasive seaweed G. vermiculophylla using a benthocosm system from May to August 2019. Our results showed that a 3 °C increase in temperature could affect the beta diversity of G. vermiculophylla. However, there were almost no effects on alpha diversity during the 4 month benthocosm experiment. The dominant and indicator genera identified at the elevated temperature suggested that these genera may play an important role in response to the elevated temperature. In addition, the number of core ASVs was higher in the Ht group than in the control. The predicted KEGG metabolic pathways of the epibacterial communities changed with the shift of the epimicrobiota at the higher temperature level.
Increased temperature did not affect alpha diversity between the Nt and Ht groups. This is probably due to the ability of G. vermiculophylla to resist high-temperature stress [33,34,35]. The invasive G. vermiculophylla can tolerate relatively large temperature changes from 5 to 30 °C [33]. Hammann et al. [36] found that 60% of invasive G. vermiculophylla survived after being exposed to a temperature of 40.5 ± 0.5 °C for 3 h, whereas only 7% of native individuals survived such temperature stress. Invasive G. vermiculophylla populations showed significantly higher levels of HSP70 (heat-shock protein 70) expression. The strong resistance of the invasive G. vermiculophylla to heat stress may partly explain that there was no significant difference in alpha diversity between the Nt and Ht groups during the short period of 12 weeks.
Temperature is considered to be an important abiotic factor in shifting epibacterial communities of seagrasses [3,5,8,37]. Our results were generally consistent with this view, as higher temperature significantly structured the epibacterial communities of G. vermiculophylla. In this study, Pseudoalteromonas, Vibrio, Thalassotalea, and Acinetobacter were highly significant indicator genera for the Ht group in August based on p ≤ 0.05 and an Indval ≥0.7, as well as relative abundance >0.3 (Figure 6c). To date, the genus Pseudoalteromonas comprises more than 47 species [38]. Some species have been isolated from seaweeds and can grow at temperatures between 0 and 40 °C. Some members of the genus Pseudoalteromonas have been shown to have antibacterial activity, providing corals with defense against potential pathogens [39]. However, several studies have shown that Pseudoalteromonas are the opportunistic pathogens of algae [40,41,42,43]. Vibrio was the second indicator genus for the Ht group. Our results are consistent with the findings of Mensch et al. [8], as Vibrio was also the indicator genus on F. vesiculosus forma mytili in the 5 °C higher temperature group. Vibrio is widespread in marine environments around the world [44] and shows a strong temperature dependence; thus, its occurrence is more common in warm waters [45]. This may partly explain why Vibrio became the indicator genus in August when the temperature became relatively high (23 °C). In addition, Vibrio species were associated with coral diseases and were regulated by seawater temperature [45,46,47]. Therefore, the indicator species of Vibrio in this study may also be temperature-dependent. Most species of Pseudoalteromona and Vibrio have been identified as pathogens in seaweeds [40,41,42,48]. In August, the abundance of both Pseudoalteromonas and Vibrio was significantly higher in the Ht group than in the control, and there was no bleaching symptom in the Ht samples. Saha and Weinberger [14] found that potentially protective (Ralstonia sp., Shewanella aquimarina, Tenacibaculum skagerrakense, Alteromonas stellipolaris, Tenacibaculum aestuarii, Cobetia marina, Nonlabens dokdonensis, etc.) and pathogenic epibacteria (Kordia algicida, Croceitalea eckloniae, and Pseudoalteromonas arctica) were present on the surface of G. vermiculophylla. We speculate that there are protective bacterial strains that fight against pathogens and then prevent bleaching.
The genus Thalassotalea contains 19 species in the List of Prokaryotic Names with Standing in Nomenclature (LPSN) [49]. Bacteria of this genus have been isolated from seawater, marine sediments, and seaweeds [49,50,51]. The optimum temperature for most species of Thalassotalea is above 25 °C, while some species tolerate 37 °C [52,53]. This may indicate that Thalassotalea on G. vermiculophylla are able to grow at elevated temperatures. Some members of Thalassotalea can degrade polysaccharides derived from macroalgae [54], suggesting that Thalassotalea are potentially opportunistic bacteria. With regard to Acinetobacter, it has so far been identified as a human pathogen. Recently, some plant and human pathogenic bacteria have been identified in cultivated Saccharina japonica (personal communication of Prof. Gaoge Wang). Therefore, Acinetobacter may also be the opportunistic pathogenic bacteria for G. vermiculophylla. As there is relatively less information on the functions of Thalassotalea and Acinetobacter, the role of these indicator genera during heat stress needs to be further investigated. According to our indicator species, elevated temperature may increase the relative abundance of some potentially pathogenic bacteria on G. vermiculophylla.
Proteobacteria and Bacteroidetes were the dominant phyla for both Nt and Ht groups, which is consistent with other studies [37,55,56]. This also supported the view of the presence of generalist epibacteria common to many macroalgae [2]. It is interesting to note that the relative abundance of Firmicutes in the Ht group increased over time, from 0.50% in May to 11.50% in August. It has been reported that the predominance of Firmicutes can resist the effects of multiple stress parameters and may possess highly efficient energy production systems [57]. Therefore, the increase in Firmicutes may help vermiculophylla to survive better under high-temperature stress.
In this study, we identified the core epibacterial microbiota (present in 100% of the samples, regardless of their relative abundance in the community). Bonthond et al. [15] found 141 core OTUs in the epiphytic composition of A. vermiculophyllum (the synonym of G. vermiculophylla). After blasting the sequence data between Bonthond et al.’s core taxa and ours, 113 ASVs of sequences matched with 100% identity (Table S3). In total, 14 epiphytic ASVs in our results were also found in Bonthond’s study. Of these, the number of epiphytic ASVs in the control group was 10, while the number in the Ht group was 13. In Bonthond’s study, the A. vermiculophyllum samples came from the global scale, whereas in this study, the A. vermiculophyllum was collected from Kiel, Germany. This suggests that microbial community composition is more dependent on host conditions than on local and regional environments [58]. However, the role of core taxa in invasive seaweeds is crucial; the ability of an invasive seaweed to maintain specific taxa with beneficial functions may provide an advantage over competitors and perhaps even protection against detrimental microbiota from the environment that are unable to colonize the already populated niche [15].
Metabolic functions associated with Nt and Ht group epibacteria were predicted by Tax4Fun. Our results showed that the metabolic functions were altered by higher temperature. Compared with the Nt group, the functions related to the metabolism of cofactors and vitamins, the function related to the biosynthesis of secondary metabolites, and the function of infectious diseases were significantly higher in the epimicrobiome of the Ht group in different months. Functions related to the metabolism of cofactors and vitamins were more abundant in the epimicrobiome of the Ht group in May. Enzyme cofactors are known to be essential for the metabolism of microbial communities [59], while vitamins such as vitamin B12 are valuable for the algal hosts [16]. Functions related to the biosynthesis of secondary metabolites were significantly higher in the epimicrobiome of the Ht group in June. Macroalgae, especially red algae, are important sources of secondary metabolites such as halogenated aromatics [60]. Secondary metabolites such as bis-bromophenol (BDDE) ether have been isolated from the red alga Polyopes lancifolius [54]. Liu et al. [61] showed that BDDE has antifungal activity against several phytopatogenic fungi. In addition, the function of infectious diseases was significantly higher in the epimicrobiome of the Ht group in August. Lu et al. [62] found that the metabolic function of infectious diseases was associated with white feces syndrome in shrimp, and the increase in this function might lead to promote the invasiveness of other opportunistic pathogens. As this function was enriched in the Ht group, we speculate that an increase in temperature might affect the health status of the invasive G. vermiculophylla.

5. Conclusions

The epibacterial communities of G. vermiculophylla are important for its survival and invasion success. Our results suggest that temperature warming can significantly affect the beta-diversity and metabolic functions of the epibacterial communities of G. vermiculophylla. Indicator genera associated with elevated temperature suggest that warming supports the growth of potentially pathogenic bacteria. A recent study [63] showed that some adaptive changes in gene expression regulated by microRNA occurred after G. vermiculophylla invaded new areas in the European and North American coasts, allowing us to hypothesize that epibacteria are likely involved in such molecular interaction networks between the host G. vermiculophylla and associated microbiota. Future studies can focus on testing the epigenetic processes mediated by the epibacterial community structure of G. vermiculophylla at elevated temperatures.

Supplementary Materials

The following supporting information can be downloaded at https://www.mdpi.com/article/10.3390/microorganisms11030599/s1: Table S1. The ASV numbers of the Ht groups and Nt groups; Table S2. Numbers of tags and OTUs under temperature stress; Table S3. Number of alpha diversity indices of epibacterial communities of A.vermiculophyllum; Figure S1. Rarefaction curve for Good’s-coverage indices. The horizontal axis represents the number of tags sampled; Figure S2. Welch’s t-test of the mean for functional abundance.

Author Contributions

Data curation, L.D.; funding acquisition, F.W. and G.W.; investigation, M.H. and Y.R.; resources, L.D., M.W. and F.W.; writing—original draft, M.H., Y.R. and L.D.; writing—review and editing, M.W., Z.-M.H., F.W. and G.W. All authors have read and agreed to the published version of the manuscript.

Funding

This study was sponsored by Sino-German Center for Research Promotion (GZ1357), National Key R&D Program of China (2018YFD0900305), and the National Natural Science Foundation of China (42076106 and 41576158).

Informed Consent Statement

Not applicable.

Data Availability Statement

The raw reads of this research were uploaded to the NCBI Sequence Read Archive (SRA) database (Accession Number PRJNA909032).

Acknowledgments

The authors are grateful to Guangzhou Genedenovo Biotechnology Co. Ltd. for their kind technical support and the transnational access (TA) of AQUACOSM, which provides mesocosm facilities and supporting laboratories with different complimentary state-of-the-art instrumentation, methods, and know-how.

Conflicts of Interest

The authors declare no conflict of interest.

References

  1. Goecke, F.; Labes, A.; Wiese, J.; Imhoff, J.F. Chemical interactions between marine macroalgae and bacteria. Mar. Ecol. Prog. Ser. 2010, 409, 267–299. [Google Scholar] [CrossRef]
  2. Egan, S.; Harder, T.; Burke, C.; Steinberg, P.; Kjelleberg, S.; Thomas, T. The seaweed holobiont: Understanding seaweed–bacteria interactions. FEMS Microbiol. Rev. 2013, 37, 462–476. [Google Scholar] [CrossRef] [Green Version]
  3. Mensch, B.; Neulinger, S.C.; Künzel, S.; Wahl, M.; Schmitz, R.A. Warming, but Not Acidification, Restructures Epibacterial Communities of the Baltic Macroalga Fucus vesiculosus with Seasonal Variability. Front. Microbiol. 2020, 11, 1471. [Google Scholar] [CrossRef] [PubMed]
  4. Martin, M.; Portetelle, D.; Michel, G.; Vandenbol, M. Microorganisms living on. macroalgae: Diversity, interactions, and biotechnological applications. Appl. Microbiol. Biotechnol. 2014, 98, 2917–2935. [Google Scholar] [CrossRef] [Green Version]
  5. Stratil, S.B.; Neulinger, S.C.; Knecht, H.; Friedrichs, A.K.; Wahl, M. Temperature-driven shifts in the epibiotic bacterial community composition of the brown macroalga Fucus vesiculosus. MicrobiologyOpen 2013, 2, 338–349. [Google Scholar] [CrossRef] [Green Version]
  6. Minich, J.J.; Morris, M.; Brown, M.; Doane, M.; Edwards, M.S.; Michael, T.P.; Dinsdale, E.A. Elevated temperature drives kelp microbiome dysbiosis, while elevated carbon dioxide induces water microbiome disruption. PLoS ONE 2018, 13, e0192772. [Google Scholar] [CrossRef]
  7. Saha, M.; Ferguson, R.M.W.; Dove, S.; Künzel, S.; Meichssner, R.; Neulinger, S.C.; Petersen, F.O.; Weinberger, F. Salinity and Time Can Alter Epibacterial Communities of an Invasive Seaweed. Front. Microbiol. 2020, 10, 2870. [Google Scholar] [CrossRef] [Green Version]
  8. Mensch, B.; Neulinger, S.C.; Graiff, A.; Pansch, A.; Künzel, S.; Fischer, M.; Schmitz, R.A. Restructuring of Epibacterial Communities on Fucus vesiculosus forma mytili in Response to Elevated pCO2 and Increased Temperature Levels. Front. Microbiol. 2016, 7, 434. [Google Scholar] [CrossRef] [Green Version]
  9. Yoshida, T. Marine Algae of Japan; Uchida Rokakuho Publishing: Tokyo, Japan, 1998. [Google Scholar]
  10. Krueger-Hadfield, S.A.; Kollars, N.M.; Strand, A.E.; Byers, J.E.; Shainker, S.J.; Terada, R.; Greig, T.W.; Hammann, M.; Murray, D.C.; Weinberger, F.; et al. Genetic identification of source and likely vector of a widespread marine invader. Ecol. Evol. 2017, 7, 4432–4447. [Google Scholar] [CrossRef] [Green Version]
  11. Saha, M.; Wiese, J.; Weinberger, F.; Wahl, M. Rapid adaptation to controlling new microbial epibionts in the invaded range promotes invasiveness of an exotic seaweed. J. Ecol. 2016, 104, 969–978. [Google Scholar] [CrossRef] [Green Version]
  12. Inderjit; Chapman, D.; Ranelletti, M.; Kaushik, S. Invasive marine algae: An ecological perspective. Bot. Rev. 2006, 72, 153–178. [Google Scholar]
  13. Williams, S.L.; Smith, J.E. A Global Review of the Distribution, Taxonomy, and Impacts of Introduced Seaweeds. Annu. Rev. Ecol. Evol. Syst. 2007, 38, 327–359. [Google Scholar] [CrossRef] [Green Version]
  14. Saha, M.; Weinberger, F. Microbial “gardening” by a seaweed holobiont: Surface metabolites attract protective and deter pathogenic epibacterial settlement. J. Ecol. 2019, 107, 2255–2265. [Google Scholar] [CrossRef]
  15. Bonthond, G.; Bayer, T.; Krueger-Hadfield, S.A.; Barboza, F.R.; Nakaoka, M.; Valero, M.; Wang, G.; Künzel, S.; Weinberger, F. How do microbiota associated with an invasive seaweed vary across scales? Mol. Ecol. 2020, 29, 2094–2108. [Google Scholar] [CrossRef]
  16. Bonthond, G.; Shalygin, S.; Bayer, T.; Weinberger, F. Draft genome and description of Waterburya agarophytonicola gen. nov. sp. nov. (Pleurocapsales, Cyanobacteria): A seaweed symbiont. Antonie Leeuwenhoek 2021, 114, 2189–2203. [Google Scholar] [CrossRef]
  17. Elken, J.; Lehmann, A.; Myrberg, K. Recent Change—Marine Circulation and Stratification. In Second Assessment of Climate Change for the Baltic Sea Basin. Regional Climate Studies; The BACC II Author Team, Ed.; Springer: Cham, Switzerland, 2015. [Google Scholar] [CrossRef] [Green Version]
  18. Wahl, M.; Buchholz, B.; Winde, V.; Golomb, D.; Guy-Haim, T.; Müller, J.D.; Rilov, G.; Scotti, M.; Böttcher, M.E. A mesocosm concept for the simulation of near-natural shallow underwater climates: The Kiel Outdoor Benthocosms (KOB). Limnol. Oceanogr. Methods 2015, 13, 651–663. [Google Scholar] [CrossRef] [Green Version]
  19. Callahan, B.J.; Mcmurdie, P.J.; Rosen, M.J.; Han, A.W.; Johnson, A.J.A.; Holmes, S.P. DADA2: High-resolution sample inference from Illumina amplicon data. Nat. Methods 2016, 13, 581–583. [Google Scholar] [CrossRef] [PubMed] [Green Version]
  20. Edgar, R.C.; Haas, B.J.; Clemente, J.C.; Quince, C.; Knight, R. UCHIME improves sensitivity and speed of chimera detection. Bioinformatics 2011, 27, 2194–2200. [Google Scholar] [CrossRef] [Green Version]
  21. Wang, Q.; Garrity, G.M.; Tiedje, J.M.; Cole, J.R. Naive Bayesian classifier for rapid assignment of rRNA sequences into the new bacterial taxonomy. Appl. Environ. Microbiol. 2007, 73, 5261–5267. [Google Scholar] [CrossRef] [Green Version]
  22. Quast, C.; Pruesse, E.; Yilmaz, P.; Gerken, J.; Schweer, T.; Yarza, P.; Peplies, J.; Gloeckner, F.O. The SILVA ribosomal RNA gene database project: Improved data processing and web-based tools. Nucl. Acids Res. 2013, 41, D590–D596. [Google Scholar] [CrossRef]
  23. Wickham, H.; Chang, W. ggplot2: An implementation of the Grammar of Graphics. R Package Version 0.7, 2008, 3. Available online: http://CRAN.R-project.org/package=ggplot2 (accessed on 7 December 2022).
  24. Bolyen, E.; Rideout, J.R.; Dillon, M.R.; Bokulich, N.A.; Abnet, C.C.; Al-Ghalith, G.A.; Alexander, H.; Alm, E.J.; Arumugam, M.; Asnicar, F.; et al. Reproducible, Interactive, Scalable and Extensible Microbiome Data Science using QIIME 2. Nat. Biotechnol. 2019, 37, 852–857. [Google Scholar] [CrossRef] [PubMed]
  25. Oksanen, J.; Blanchet, F.G.; Kindt, R.; Legendre, P.; O’hara, R.B.; Simpson, G.L.; Solymos, P.; Stevens, M.H.; Wagner, H. Vegan: Community Ecology Package. R Package Version 2.4-6. 2022. Available online: https://CRAN.R-project.org/package=vegan (accessed on 7 December 2022).
  26. Chen, H.; Boutros, P.C. VennDiagram: A package for the generation of highly-customizable Venn and Euler diagrams in R. BMC Bioinform. 2011, 12, 35. [Google Scholar] [CrossRef] [PubMed] [Green Version]
  27. Mouillot, D.; Wilson, J. Can We Tell How a Community Was Constructed? A Comparison of Five Evenness Indices for Their Ability to Identify Theoretical Models of Community Construction. Theor. Popul. Biol. 2002, 61, 141–151. [Google Scholar] [CrossRef] [PubMed]
  28. Roberts, D.W.; Roberts, M.D.W. Package ‘labdsv’: Ordination and Multivariate Analysis for Ecology. R Package Version1.6-1[CP/OL]. 2016. Available online: http://CRAN.R-project.org/package=labdsv (accessed on 7 December 2022).
  29. McGeoch, M.A.; Van Rensburg, B.J.; Botes, A. The verification and application of bioindicators: A case study of dung beetles in a savanna ecosystem. J. Appl. Ecol. 2002, 39, 661–672. [Google Scholar] [CrossRef] [Green Version]
  30. Aßhauer, K.P.; Wemheuer, B.; Daniel, R.; Meinicke, P. Tax4Fun: Predicting functional profiles from metagenomic 16S rRNA data. Bioinformatics 2015, 31, 2882–2884. [Google Scholar] [CrossRef] [Green Version]
  31. Wahl, M.; Barboza, F.R.; Buchholz, B.; Dobretsov, S.; Guy-Haim, T.; Rilov, G.; Schuett, R.; Wolf, F.; Vajedsamiei, J.; Yazdanpanah, M.; et al. Pulsed pressure: Fluctuating impacts of multifactorial environmental change on a temperate macroalgal community. Limnol. Oceanogr. 2021, 66, 4210–4226. [Google Scholar] [CrossRef]
  32. Wahl, M.; Werner, F.J.; Buchholz, B.; Raddatz, S.; Graiff, A.; Matthiessen, B.; Karsten, U.; Hiebenthal, C.; Hamer, J.; Ito, M.; et al. Season affects strength and direction of the interactive impacts of ocean warming and biotic stress in a coastal seaweed ecosystem. Limnol. Oceanogr. 2020, 65, 807–827. [Google Scholar] [CrossRef] [Green Version]
  33. Yokoya, N.S.; Kakita, H.; Obika, H.; Kitamura, T. Effects of environmental factors and plant growth regulators on growth of the red alga Gracilaria vermiculophylla from Shikoku Island, Japan. Hydrobiologia 1999, 339–347. [Google Scholar] [CrossRef]
  34. Weinberger, F.; Buchholz, B.; Karez, R.; Wahl, M. The invasive red alga Gracilaria vermiculophylla in the Baltic Sea: Adaptation to brackish water may compensate for light limitation. Aquat. Biol. 2008, 3, 251–264. [Google Scholar] [CrossRef]
  35. Hu, Z.-M.; Juan, L.-B. Adaptation mechanisms and ecological consequences of seaweed invasions: A review case of agarophyte Gracilaria vermiculophylla. Biol. Invasions 2014, 16, 967–976. [Google Scholar] [CrossRef]
  36. Hammann, M.; Wang, G.; Boo, S.M.; Aguilar-Rosas, L.E.; Weinberger, F. Selection of heat-shock resistance traits during the invasion of the seaweed Gracilaria vermiculophylla. Mar. Biol. 2016, 163, 1–11. [Google Scholar] [CrossRef]
  37. Mancuso, F.P.; Sofie, D.; Anne, W.; Laura, A.; Olivier, D.C. Diversity and temporal dynamics of the epiphytic bacterial communities associated with the canopy-forming seaweed Cystoseira compressa (Esper) Gerloff and Nizamuddin. Front. Microbiol. 2016, 7, 476. [Google Scholar] [CrossRef] [Green Version]
  38. Park, S.; Lee, S.Y.; Kim, W.; Yoon, J.-H. Pseudoalteromonas caenipelagi sp. nov., isolated from a tidal flat. Int. J. Syst. Evol. Microbiol. 2020, 70, 6301–6306. [Google Scholar] [CrossRef]
  39. Shnit-Orland, M.; Sivan, A.; Kushmaro, A. Antibacterial Activity of Pseudoalteromonas in the Coral Holobiont. Microb. Ecol. 2012, 64, 851–859. [Google Scholar] [CrossRef]
  40. Liu, H.; Zheng, F.; Sun, X.; Hong, X.; Dong, S.; Wang, B.; Tang, X.; Wang, Y. Identification of the pathogens associated with skin ulceration and peristome tumescence in cultured sea cucumbers Apostichopus japonicus (Selenka). J. Invertebr. Pathol. 2010, 105, 236–242. [Google Scholar] [CrossRef]
  41. Wang, Y.; Feng, N.; Li, Q.; Ding, J.; Zhan, Y.; Chang, Y. Isolation and characterization of bacteria associated with a syndrome disease of sea urchin Strongylocentrotus intermedius in North China. Aquac. Res. 2012, 44, 691–700. [Google Scholar] [CrossRef]
  42. Zhang, X.; Chen, Y.; Saha, M.; Zhuang, Y.; Chang, L.; Xiao, L.; Wang, G. Pseudoalteromonas piscicida X-8 causes bleaching disease in farmed Saccharina japonica. Aquaculture 2021, 546, 737354. [Google Scholar] [CrossRef]
  43. Wang, G.; Ren, Y.; Wang, S.; Hou, M.; Weinberger, F. Shifting chemical defence or novel weapons? A review of defence traits in Agarophyton vermiculophyllum and other invasive seaweeds. Mar. Life Sci. Technol. 2022, 4, 138–149. [Google Scholar] [CrossRef]
  44. Rubio-Portillo, E.; Gago, J.F.; Martínez-García, M.; Vezzulli, L.; Rosselló-Móra, R.; Antón, J.; Ramos-Esplá, A.A. Vibrio communities in scleractinian corals differ according to health status and geographic location in the Mediterranean Sea. Syst. Appl. Microbiol. 2018, 41, 131–138. [Google Scholar] [CrossRef]
  45. Wright, A.C.; Hill, R.T.; A Johnson, J.; Roghman, M.C.; Colwell, R.R.; Morris, J.G. Distribution of Vibrio vulnificus in the Chesapeake Bay. Appl. Environ. Microbiol. 1996, 62, 717–724. [Google Scholar] [CrossRef] [Green Version]
  46. Ben-Haim, Y.; Zicherman-Keren, M.; Rosenberg, E. Temperature-Regulated Bleaching and Lysis of the Coral Pocillopora damicornis by the Novel Pathogen Vibrio coralliilyticus. Appl. Environ. Microbiol. 2003, 69, 4236–4242. [Google Scholar] [CrossRef] [Green Version]
  47. Bally, M.; Garrabou, J. Thermodependent bacterial pathogens and mass mortalities in temperate benthic communities: A new case of emerging disease linked to climate change. Glob. Chang. Biol. 2007, 13, 2078–2088. [Google Scholar] [CrossRef]
  48. Song, J.K.; Kim, D.; Eun, J.-B.; Choi, B.-D.; Oh, M.J.; Jung, S.J. Identification of cellulolytic bacteria associated with tunic softness syndrome in the sea squirt, Halocynthia roretzi. Food Sci. Biotechnol. 2012, 21, 1405–1411. [Google Scholar] [CrossRef]
  49. Lian, F.-B.; Jiang, S.; Ren, T.-Y.; Zhou, B.-J.; Du, Z.-J. Thalassotalea algicola sp. nov., an alginate-utilizing bacterium isolated from a red alga. Antonie Van Leeuwenhoek 2021, 114, 835–844. [Google Scholar] [CrossRef] [PubMed]
  50. Hou, T.T.; Liu, Y.; Zhong, Z.P.; Liu, H.C.; Liu, Z.P. Thalassotalea marina sp. nov., isolated from a marine recirculating aquaculture system, reclassification of Thalassomonas eurytherma as Thalassotalea eurytherma comb. nov. and emended description of the genus Thalassotalea. Int. J. Syst. Evol. Microbiol. 2015, 65, 4710–4715. [Google Scholar] [CrossRef]
  51. Liu, J.; Sun, Y.-W.; Li, S.-N.; Zhang, D.-C. Thalassotalea profundi sp. nov. isolated from a deep-sea seamount. Int. J. Syst. Evol. Microbiol. 2017, 67, 3739–3743. [Google Scholar] [CrossRef] [PubMed]
  52. Park, S.; Jung, Y.-T.; Kang, C.-H.; Park, J.-M.; Yoon, J.-H. Thalassotalea ponticola sp. nov., isolated from seawater, reclassification of Thalassomonas fusca as Thalassotalea fusca comb. nov. and emended description of the genus Thalassotalea. Int. J. Syst. Evol. Microbiol. 2014, 64, 3676–3682. [Google Scholar] [CrossRef] [PubMed] [Green Version]
  53. Zheng, S.; Zhang, D.; Gui, J.; Wang, J.; Zhu, X.; Lai, Q.; Wang, W.; Xu, H. Thalassotalea mangrovi sp. nov., a bacterium isolated from marine mangrove sediment. Int. J. Syst. Evol. Microbiol. 2019, 69, 3644–3649. [Google Scholar] [CrossRef]
  54. Kim, K.Y.; Nguyen, T.H.; Kurihara, H.; Kim, S.M. Alpha-glucosidase inhibitory activity of bromophenol purified from the red alga Polyopes lancifolia. J. Food Sci. 2010, 75, H145–H150. [Google Scholar]
  55. Bengtsson, M.; Sjøtun, K.; Øvreås, L. Seasonal dynamics of bacterial biofilms on the kelp Laminaria hyperborea. Aquat. Microb. Ecol. 2010, 60, 71–83. [Google Scholar] [CrossRef] [Green Version]
  56. Serebryakova, A.; Aires, T.; Viard, F.; Serrão, E.A.; Engelen, A.H. Summer shifts of bacterial communities associated with the invasive brown seaweed Sargassum muticum are location and tissue dependent. PLoS ONE 2018, 13, e0206734. [Google Scholar] [CrossRef]
  57. Singh, R.P.; Reddy, C. Seaweed-microbial interactions: Key functions of seaweed-associated bacteria. FEMS Microbiol. Ecol. 2014, 88, 213–230. [Google Scholar] [CrossRef] [Green Version]
  58. Marzinelli, E.M.; Campbell, A.H.; Valdes, E.Z.; Vergés, A.; Nielsen, S.; Wernberg, T.; de Bettignies, T.; Bennett, S.; Caporaso, J.G.; Thomas, T.; et al. Continental-scale variation in seaweed host-associated bacterial communities is a function of host condition, not geography. Environ. Microbiol. 2015, 17, 4078–4088. [Google Scholar] [CrossRef] [PubMed]
  59. Romine, M.F.; A Rodionov, D.; Maezato, Y.; Osterman, A.L.; Nelson, W.C. Underlying mechanisms for syntrophic metabolism of essential enzyme cofactors in microbial communities. ISME J. 2017, 11, 1434–1446. [Google Scholar] [CrossRef] [PubMed] [Green Version]
  60. Jesus, A.; Correia-Da-Silva, M.; Afonso, C.; Pinto, M.; Cidade, H. Isolation and Potential Biological Applications of Haloaryl Secondary Metabolites from Macroalgae. Mar. Drugs 2019, 17, 73. [Google Scholar] [CrossRef] [Green Version]
  61. Liu, M.; Wang, G.; Xiao, L.; Xu, X.; Liu, X.; Xu, P.; Lin, X. Bis(2,3-dibromo-4,5-dihydroxybenzyl) Ether, a Marine Algae Derived Bromophenol, Inhibits the Growth of Botrytis cinerea and Interacts with DNA Molecules. Mar. Drugs 2014, 12, 3838–3851. [Google Scholar] [CrossRef]
  62. Lu, J.; Zhang, X.; Qiu, Q.; Chen, J.; Xiong, J. Identifying Potential Polymicrobial Pathogens: Moving Beyond Differential Abundance to Driver Taxa. Microb. Ecol. 2020, 80, 447–458. [Google Scholar] [CrossRef]
  63. Xiang, J.; Saha, M.; Zhong, K.; Zhang, Q.; Zhang, D.; Jueterbock, A.; Krueger-Hadfield, S.A.; Wang, G.; Weinberger, F.; Hu, Z. Genome-scale signatures of adaptive gene expression changes in an invasive seaweed Gracilaria vermiculophylla. Mol. Ecol. 2022, 32, 613–627. [Google Scholar] [CrossRef] [PubMed]
Figure 1. Temperature variation during the period from 28 May to 27 August 2019. Nt: normal seawater temperature. Ht: 3 °C higher temperature. The times on the X-axis represent the sampling dates.
Microorganisms 11 00599 g001
Figure 2. Chao1 diversity within both the Nt and Ht groups. (a) Chao 1 indices at normal seawater temperature. (b) Chao 1 indices at 3 °C higher temperature. Nt: normal seawater temperature. Ht: 3 °C higher temperature. 1, 2, 3, 4 represented samplings conducted in May, June, July and August, respectively. A single asterisk (*) indicated a significance level of p < 0.05, and a double asterisk (**) indicated a significance level of p < 0.01.
Microorganisms 11 00599 g002
Figure 3. Beta diversity of G. vermiculophylla-associated epimicrobiota at two different temperatures. A principal coordinate analysis (PCoA) plot of G. vermiculophylla associated epimicrobiota based on Bray–Curtis distance. Different colors represented different months. Different dots indicate different samples. Nt: normal seawater temperature; Ht: 3 °C higher temperature; 1, 2, 3, and 4 represent May, June, July, and August, respectively.
Microorganisms 11 00599 g003
Figure 4. Epibacterial community composition of G. vermiculophylla. (a,b), The epibacterial distribution at phylum and genus level, respectively. Nt: normal seawater temperature; Ht: 3 °C higher temperature; 1, 2, 3, and 4 represent May, June, July, and August, respectively.
Microorganisms 11 00599 g004
Figure 5. Core ASVs of different months. (a,b), Veen diagram showing the distribution of ASVs, displaying the extent of the core and exclusive ASVs across the 4 months in the Nt and Ht groups, respectively. Nt: normal seawater temperature; Ht: 3 °C higher temperature; 1, 2, 3, and 4 represent May, June, July, and August, respectively.
Microorganisms 11 00599 g005
Figure 6. Extremely significant indicator genera at elevated temperature level. The horizontal and vertical axes represent different groups and indicator genera, respectively. The size of the bubbles in the figure represents the IndVal of the species between the Nt and Ht groups. Orange and blue represent the Nt group and the Ht group, respectively. Nt: normal seawater temperature; Ht: 3 °C higher temperature. (ac) May, June, and August respectively. No highly significant indicator genera (p ≤ 0.05, Indval ≥0.7, relative abundance >0.3) were found in July in any of the groups.
Microorganisms 11 00599 g006
Figure 7. Functional prediction of epibacterial communities. KEGG pathway annotation of ASVs was inferred using Tax4Fun (version 1.0, Aßhauer et al., 2015 [30]). Nt: normal seawater temperature; Ht: 3 °C higher temperature; 1, 2, 3, and 4 represent May, June, July, and August, respectively. The red to green color scale represents the relative abundance of metabolic functions in the epimicrobiome.
Microorganisms 11 00599 g007
Table 1. Adonis test value of PCoA analysis.
DiffsDfSumsOfSqsMeanSqsF ValueR2p-ValueSignificant
Nt1 vs. Ht110.35610.35612.65770.24940.031*
Nt2 vs. Ht210.43140.43142.08870.20700.011*
Nt3 vs. Ht310.33120.33120.82770.09380.886
Nt4 vs. Ht410.63260.63261.57130.16420.007**
Nt1 vs. Nt2 vs. Nt3 vs. Nt432.88240.96083.44620.39250.001**
Ht1 vs. Ht2 vs. Ht3 vs. Ht432.59440.86482.95280.35640.001**
* p ≤ 0.05; ** p ≤ 0.01.
Disclaimer/Publisher’s Note: The statements, opinions and data contained in all publications are solely those of the individual author(s) and contributor(s) and not of MDPI and/or the editor(s). MDPI and/or the editor(s) disclaim responsibility for any injury to people or property resulting from any ideas, methods, instructions or products referred to in the content.

