Article

Dietary Effects of a Short-Term Administration of Microalgae Blend on Growth Performance, Tissue Fatty Acids, and Predominant Intestinal Microbiota in Sparus aurata

by
Jorge García-Márquez
1,
Rosa María Rico
2,
Francisco Gabriel Acién
3,
Juan Miguel Mancera
4,
Félix L. Figueroa
2,
Antonio Jesús Vizcaíno
5,
Francisco Javier Alarcón
5,
Miguel Ángel Moriñigo
1,* and
Roberto Teófilo Abdala-Díaz
2
1
Departamento de Microbiología, Facultad de Ciencias, Instituto Andaluz de Biotecnología y Desarrollo Azul (IBYDA), Universidad de Málaga, Ceimar-Universidad de Málaga, 29071 Málaga, Spain
2
Departamento de Ecología y Geología, Facultad de Ciencias, Instituto Andaluz de Biotecnología y Desarrollo Azul (IBYDA), Universidad de Málaga, Ceimar-Universidad de Málaga, 29071 Málaga, Spain
3
Departamento de Ingeniería Química, Universidad de Almería, Ceimar-Universidad de Almería, 04120 Almería, Spain
4
Departamento de Biología, Facultad de Ciencias del Mar y Ambientales, Instituto Universitario de Investigación Marina (INMAR), Universidad de Cádiz, Ceimar-Universidad de Cádiz, 11510 Cádiz, Spain
5
Departamento de Biología y Geología, Universidad de Almería, Ceimar-Universidad de Almería, 04120 Almería, Spain
*
Author to whom correspondence should be addressed.
Microorganisms 2023, 11(2), 463; https://doi.org/10.3390/microorganisms11020463
Submission received: 7 January 2023 / Revised: 3 February 2023 / Accepted: 10 February 2023 / Published: 12 February 2023
(This article belongs to the Special Issue Gut Microbiota and Nutrients)

Abstract

:
Given the potential of microalgae as new aquafeed ingredients, this study focuses on using a blend of microalgae, Tisochrysis lutea, Nannochloropsis gaditana, and Scenedesmus almeriensis, as a dietary ingredient for feeding Sparus aurata juveniles. The growth performance, carcass composition, tissue fatty acid profile, and intestinal microbiota were evaluated after a 30 day-feeding period. A microalgae-free diet was used as control, and three experimental diets were formulated containing 5%, 15%, and 25% of the microalgae blend (MB-5%, MB-15%, and MB-25%, respectively). After 7, 15, and 30 days of feeding experimental diets, biological samples were taken. Growth performance and nutrient utilization were not significantly modified at the end of the experiment. Microalgae inclusion tended to decrease body lipids and affected the fatty acid profile, especially MB-25 diet increased DHA levels. Diet MB-25 promoted appropriate microbial diversity, favoring the presence of probiotic bacteria, such as Lactobacillus, and significantly influencing the fatty acid composition and lipid metabolism in fish. In conclusion, using a short pulse of dietary administration of 25% microalgal blend in S. aurata modulates the intestinal microbiota and lipid composition while maintaining growth performance.

1. Introduction

Aquaculture plays a relevant role in providing high-quality protein and lipids for human consumption. However, the culturing of aquatic animals involves a high amount of protein in their diets. Dietary protein is obtained mainly from captured wild fish or crop cultures, making aquaculture expansion based on fishmeal and land use unsustainable [1,2]. Thus, expanding the aquafeed industry requires finding sustainable ingredients [3]. The major challenges for finding suitable alternative protein sources in aquafeeds are the fluctuating protein content in those feedstuffs and the practicality of expanding their production, which are dependent on current processing technologies and scalability while promoting additional nutritional health advantages [4].
Microalgae have the potential to replace fishmeal and fish oil in aquafeeds because they provide high-quality protein and a noticeable amount of essential amino acids [5,6,7]. Furthermore, although there are strain- and species-specific differences in fatty acid content, some microalgae may be considered a viable source of polyunsaturated fatty acids (PUFA), particularly eicosapentaenoic and docosahexaenoic acids (EPA and DHA, respectively) [8].
Many studies have shown that microalgae can be used as a dietary ingredient in different aquaculture species, generally without a detrimental impact on growth and general health [9,10,11]. Despite this, the most significant limitation to the widespread use of microalgae is that any acceptable alternative feed ingredient has to provide adequate nutritional content at a competitive cost. However, this last still needs to be achieved by employing algae as a major component in aquafeeds, particularly in the case of microalgae [12].
The present work focuses on using a blend of microalgae, Tisochrysis lutea, Nannochloropsis gaditana, and Scenedesmus almeriensis, as a dietary ingredient for feeding Sparus aurata juveniles. The potential of these microalgae species for use individually as dietary ingredients has been previously assessed in previous studies performed by our research group [10,13,14,15]. The microalga T. lutea is considered a promising feed ingredient owing to its content in fatty acids, especially docosahexaenoic acid (DHA), up to 203 mg g−1 (dry biomass) total fatty acids. DHA plays key roles in the health and development of aquatic organisms, and this strain is widely used in aquaculture feeds [16]. N. gaditana is of particular interest to the aquafeed industry for the production of high-value oil containing omega-3 fatty acids, specifically eicosapentaenoic acid (EPA), ranging from 70 to 380 mg g−1 dry biomass [17]. S. almeriensis has huge potential to achieve commercial success due to its high contents of protein and lutein; this strain has been suggested as a potential functional feed ingredient showing potential for use as a feed ingredient promoting the gut functionality of fish [15]. The blend of those microalgae contains high amounts of protein and an interesting fatty acid profile that includes significant levels of α-linolenic acid, EPA, and DHA [18,19].
To the best of our knowledge, no studies are available evaluating the effect of dietary administration of that microalgal blend during a short feeding period as a functional feed ingredient in seabream juveniles. The objective of the present study was to evaluate the effect of different dietary levels of a microalgae blend composed of 33.3% Tisochrysis lutea, 33.3% Nannochloropsis gaditana, and 33.3% Scenedesmus almeriensis on growth performance, nutrient utilization, body composition, fatty acid profile, and intestinal microbiota in S. aurata juveniles.

2. Materials and Methods

2.1. Ethical Statement

Fish were kept and handled following the guidelines for experimental procedures in animal research from the Ethics and Animal Welfare Committee of the University of Cadiz, according to the Spanish (RD53/2013) and European Union (2010/63/UE) legislation.

2.2. Microalgae Biomass

The microalgae were cultured in photobioreactors at the pilot plant (EU-H2020 SABANA facilities funded by grant #727874) of the Universidad de Almería (Spain). The biomass was produced in tubular photobioreactors (PBR) (3000-L water capacity, 0.09 m tube diameter) with automatic temperature control. The pH, temperature, and dissolved oxygen values were continuously monitored at the end of the loop using specific probes (Crison Instruments, Alella, Spain). pH was controlled automatically by injection of CO2 at the beginning of the loop. The temperature was kept within the range required for optimal growth of each microalgae strain (T. lutea 23–25 °C, N. gaditana 25–27 °C, and S. almeriensis 28–30 °C) by passing cold/hot water through a heat exchanger located inside the bubble column of the reactor. The culture medium used was Mann and Myer [20], which was prepared by dissolving fertilizers in irrigation water and then sterilizing by filtration/ozone. Microalga biomass was harvested by centrifugation (OTC3, CEA Westphalia, Oelde, Germany), frozen at −20 °C, and lyophilized. Dry biomass was subsequently milled and sieved through a 50 µm pore to obtain a homogenized powder that was stored in the dark at −20 °C until further preparation of the experimental diets.

2.3. Experimental Feeds and Feeding Trial

The experimental diets were manufactured at the Servicio de Dietas Experimentales of the Universidad de Almería (http://www.ual.es/stecnicos_spe, accessed on 20 December 2022). For this, standard aquafeed procedures, i.e., mixing ingredients, the inclusion of feed additives, gentle extrusion with temperature control, and extrusion within the size range of experimental feed, consisting of four isoproteic (45%) and isolipidic (10%) inert diets (2.0 mm), were used. The algae-supplemented diet was formulated containing a 5%, 15%, and 25% of microalgae blend composed by 33.3% T. lutea (for providing protein and DHA), 33.3% N. gaditana (for providing protein and EPA), and 33.3% S. almeriensis (for providing protein and linolenic acid) (MB-5, MB-15, and MB-25, respectively). A control diet was formulated without microalgae. The ingredient composition, nutrient composition, and the fatty acid profile of the experimental diets are presented in Table 1 and Table 2, respectively.
Juvenile specimens of S. aurata were obtained from CUPIMAR (San Fernando, Cádiz, Spain). The feeding trial was conducted at the Servicios Centrales de Investigación en Cultivos Marinos (SCI-CM, CASEM, University of Cádiz, Puerto Real, Cádiz, Spain; Spanish Operational Code REGA ES11028000312). After arrival at the experimental unit, fish were conditioned in a 1000-L tank (4 tanks, 50–55 fish per tank) and acclimated in an open marine water circuit for two weeks. During the adaptation period, fish were fed a commercial diet (48% protein, 25% lipids, 11.5% ash, 20.2 kJ g−1; Skretting, L2 Active 1P, Skretting, Spain).
Fish (n = 144, 16.1 ± 0.3 g body mass, mean ± SD) were randomly distributed in a flow-through setup of twelve 100 L tanks to establish four experimental groups in triplicate. Fish were maintained under natural photoperiod (July–August, 14:10 h, light:dark, LD; 36°31′45″ N, 6°11′31″ W), temperature (18–19 °C) and salinity (38–39 ppt.). Fish were hand fed twice daily (9:00 and 17:00) at a rate of 2.5% of their body weight over 30 days with the experimental feeds. The uneaten pellets were collected after 1 h and then dried and weighed. Supplemental aeration was provided to maintain dissolved oxygen at 6.8 ± 0.4 mg L−1. Ammonia (<0.1 mg L−1), nitrite (<0.2 mg L−1), and nitrate (<50 mg L−1) were determined once weekly at 9 a.m.

2.4. Fish Sampling

Animals were anesthetized with 2-phenoxyethanol (0.5 mL L−1 SW, Sigma-Aldrich #77699, St. Louis, MI, USA) at the beginning of the assay (day 0) and on days 7, 15, and 30. Fish were individually weighed, and the daily feed rations were adjusted accordingly to maintain the initial 2.5% rate of their body mass during the experiment. At every sampling point (days 0, 7, 15, and 30), animals were taken from their respective tanks (two fish per tank × three tanks per diet) after 24 h of feed deprivation, and then euthanized by an overdose of 2-phenoxyethanol (1 mL L−1 SW) followed by spine severing according to the requirements of the EU Directive 2010/63/EU for animal experiments. At day 30, the body weight of the remaining animals was recorded, and growing parameters were calculated as indicated in Section 2.5 (see below in the text). The abdomen was opened, and the digestive tract and liver were removed and weighed to determine viscerosomatic and hepatosomatic indices (VI and HSI, respectively). The carcasses were freeze-dried and stored at −80 °C for further proximate composition analysis. Whole intestines were aseptically removed and kept at −80 °C for microbiota analysis. Additionally, at the end of the experiment (day 30), the muscle and liver were aseptically removed and kept at −80 °C for lipid and fatty acid analysis.

2.5. Growth Performance, Nutrient Utilization, and Somatic Indices

To evaluate the growth performance and nutrient utilization, we used the following equations (Equations (1)–(8)):
Weight Gain (WG, %) = ((final fish weight − initial fish weight) × 100)
Specific Growth Rate (SGR, % day−1) = (100 × [(ln final fish weight) − (ln initial fish weight)]/experimental days)
Feed Conversion Ratio (FCR) = dry feed intake (g)/weight gain (g)
Protein Efficiency Ratio (PER) = weight gain/intake of particular protein
Carcass Yield (CY, %) = ((carcass weight/body weight) × 100)
Condition Factor (K, %) = ((fish weight/fish length3) × 100)
Viscerosomatic Index (VI, %) = ((visceral weight (g)/whole body weight (g)) × 100)
Hepatosomatic Index (HSI, %) = ((liver weight/body weight) × 100)

2.6. Chemical Composition of Algae and Fish

Total carbon and nitrogen were determined from the dry biomass of microalgae and the liver and muscle of specimens using a CNHS LECO-932 elemental analyzer (Michigan, USA) in the Research Support Central Services (SCAI, University of Malaga, Spain). Total proteins were calculated from the elemental N determination using the N-protein conversion factor [21]. Lipids were extracted according to the method described by Folch et al. [22]. The sample (150–200 mg) was homogenized in chloroform:methanol (2:1) for 5 min. The lipid fraction was separated by centrifugation, and total lipid content was calculated by gravimetry once the solvent (chloroform) was evaporated entirely from the lipid fraction. The dry matter content was determined after drying the samples in an oven at 110 °C until constant weight. The ash content was determined by combustion of the sample to constant weight in a muffle oven at 600 °C for 12 h.

2.7. Fatty Acid Composition of the Algae, Experimental Diets, and Fish

The lipid fractions were dissolved in toluene, and the fatty acids methyl esters (FAMES) were obtained by transesterification with sulfuric acid (1%) in methanol [23]. The reaction occurred at 50 °C for 16 h in a dark and molecular nitrogen atmosphere. Methyl esters were extracted with hexane:diethyl ether (1:1, v/v), washed with a solution of KHCO3 (2% w/v), and purified in a column of NH2 Sep-pack (Waters, Mildford, MA, USA) with hexane as a solvent. The FAMES were separated by Gas Chromatography using helium as a carrier gas in a GC column BPX70 (70% cyanopropylpolysilphenylene-siloxane) 60 m × 0.25 mm × 0.25 mm (SGE analytical science) (Thermo Fisher Scientific, Madrid, Spain). The initial column temperature was 140 °C for 10 min. Then it was raised to 240 °C at a rate of 2.5 °C min−1 and held at 240 °C for 10 min. FAMES detection was made through a flame detector, and the peaks were identified with a standard FAMES pattern (Supelco 37 comp. 47885-U).

2.8. Evaluation of the Intestinal Microbiota

2.8.1. DNA Extraction, PCR Amplification, and Analysis of DGGE Patterns

Total DNA was extracted from samples taken at day 0, 7, 15, and 30 according to Martínez et al. [24], with some modifications described by Tapia-Paniagua et al. [25]. The quality of the DNA was determined using agarose gel electrophoresis (1.5%) in the presence of ethidium bromide. DNA was amplified using the 16S rDNA bacterial domain-specific primers 968-GC-F (5′GAACGCGAAGAACCTTAC-3′) and 1401-R (5′CGGTGTGTACAAGACCC-3′) [26], targeting V6-V8 regions of 16S rDNA. PCR was performed as previously described by Tapia-Paniagua et al. [25]. PCR products were separated by denaturing gradient gel electrophoresis (DGGE) in a Dcode TM system (Bio-Rad Laboratories, United States), according to Rico et al. [27]. Gels were stained with AgNO3 after electrophoresis [28]. DGGE patterns of all samples were performed twice, which were analyzed using FPQuest Software version 4.0 (Applied Maths BVBA, Sint-Martens-Latem, Belgium).
Pearson correlation was used to calculate similarity indices from densitometric curves of the scanned DGGE profiles [29]. The generation of dendrograms employing the Unweighted Pair Groups Method with Arithmetic Averages (UPGMA) was used to cluster DGGE patterns. The microbial communities of the intestine were studied according to Rico et al. [27] and Abdala-Díaz et al. [30], assessing (i) the species richness (R), (ii) the range-weighted richness (Rr), (iii) the Pareto-Lorenz distribution curves, and (iv) the Gini coefficient.

2.8.2. Sequencing of DGGE Bands

The predominant bands in the DGGE gels were extracted and reamplified as previously described. The High Pure Spin Kit PCR purification kit was used to purify the products (Roche, Basel, Switzerland). The amplicons were sequenced on an ABI PRISM 377 sequencer (PerkinElmer, Waltham, MA, USA), and the nucleotide sequences were submitted to a BLAST search in GenBank (http://blast.ncbi.nlm.nih.gov/Blast.cgi, accessed on 7 September 2022) and a SINA alignment in the SILVA database (https://www.arb-silva.de/aligner/, accessed on 8 September 2022) to retrieve the closest known alignment identities for the incomplete 16S rRNA sequences [31,32]. Species-level identification was accepted at ≥97% nucleotide alignment. The Ribosomal Database Project’s CHECK CHIMERA tool was used to identify chimeric sequences [33]. The ARB software tool, Version 6.0.3 [34] was used to perform phylogenetic studies on clone libraries, and sequences were matched using the positional tree server with a data set comprising the closest related matches from the Ribosomal Database Program.

2.9. Statistical Analysis

Obtained values are expressed as means ± standard deviations (SD). Normal distribution was checked for all data with the Shapiro–Wilk test, while the homogeneity of the variances was obtained using the Levene test. When necessary, an arcsine transformation was performed. One-way analysis of variance (ANOVA) followed by Tukey’s Test was employed to determine the statistical differences between different experimental diets using the software STATISTICA version 7.0. Statistical significance of mean differences was considered to be attained with p < 0.05.

3. Results

3.1. Growth Performance, Nutrient Utilization, and Proximate Composition

No fish mortality occurred during the experimental period. The overall growth performance and nutrient utilization data are shown in Table 3. Dietary treatments that included the microalgal blend (MB-5, MB-15, and MB-25) tended to reduce WGR, SGR, and FCR compared with the control group, although differences were not significant (p > 0.05). Conversely, PER and CY were higher in specimens fed with diets including microalgae meal than in the control group, although no significant differences were observed (p > 0.05). Regarding HSI, VI, and K, no significant differences were observed between dietary treatments (p > 0.05).
The proximate composition of S. aurata specimens is presented in Table 4. The body composition of fish did not show any significant variation between treatments, except for fish fed on MB-15 and MB-25 that exhibited significantly lower lipid content than other experimental groups (p < 0.05).

3.2. Fatty Acid Composition of Fish

The liver fatty acid composition of S. aurata juveniles fed experimental diets for 30 days is presented in Table 5. The results revealed that microalgae inclusion significantly affected the fatty acid profile, especially with the highest dietary microalgal inclusion level. The saturated fraction (SFA) was significantly lower in fish fed on MB-15 and MB-25 diets (p < 0.05), mainly due to the lower value for stearic acid (18:0) observed in this fraction. On the contrary, total polyunsaturated fatty acids (PUFA) tended to increase in fish fed on microalgae-supplemented diets, although significant differences were only observed in fish fed on the MB-25 diet. Docosahexaenoic acid (DHA, 22:6n3) content was significantly higher in fish fed on MB-15 and MB-25 diets, reaching values above 15% of the total FAMEs (15.6% and 15.8%, respectively; p < 0.05). The proportion of eicosapentaenoic acid (EPA, 20:5n3) was significantly higher in MB-25-fed fish compared to the control group (p < 0.05). MB-15 and MB-25 fish showed significant n-3 fatty acids content and higher n3/n6 ratio (p < 0.05).
The muscle fatty acid composition of S. aurata juveniles is presented in Table 6. Polyunsaturated fatty acids (PUFA) were the predominant lipids in muscle tissue (42.3–49.6%), followed by saturated (SFA) (27.9–33.3%) and monounsaturated fatty acids (MUFA) (24.4–25.2%), regardless of dietary treatment. Similar to that observed in hepatic tissue, the main effect of microalgae inclusion was the significant increase in the muscle PUFA content and the decrease in SFA fraction (p < 0.05), whereas MUFA content remained unaffected (p > 0.05). The inclusion of microalgae induced a significant reduction of myristic acid (C14:0) and palmitic acid (C16:0) compared to control fish (p < 0.05). On the other hand, the proportion of ARA and DHA was significantly higher in fish fed the higher microalgae inclusion levels (MB-15 and MB-25 diets), reaching values above 11% and 27% of the total fatty acids, respectively (p < 0.05).

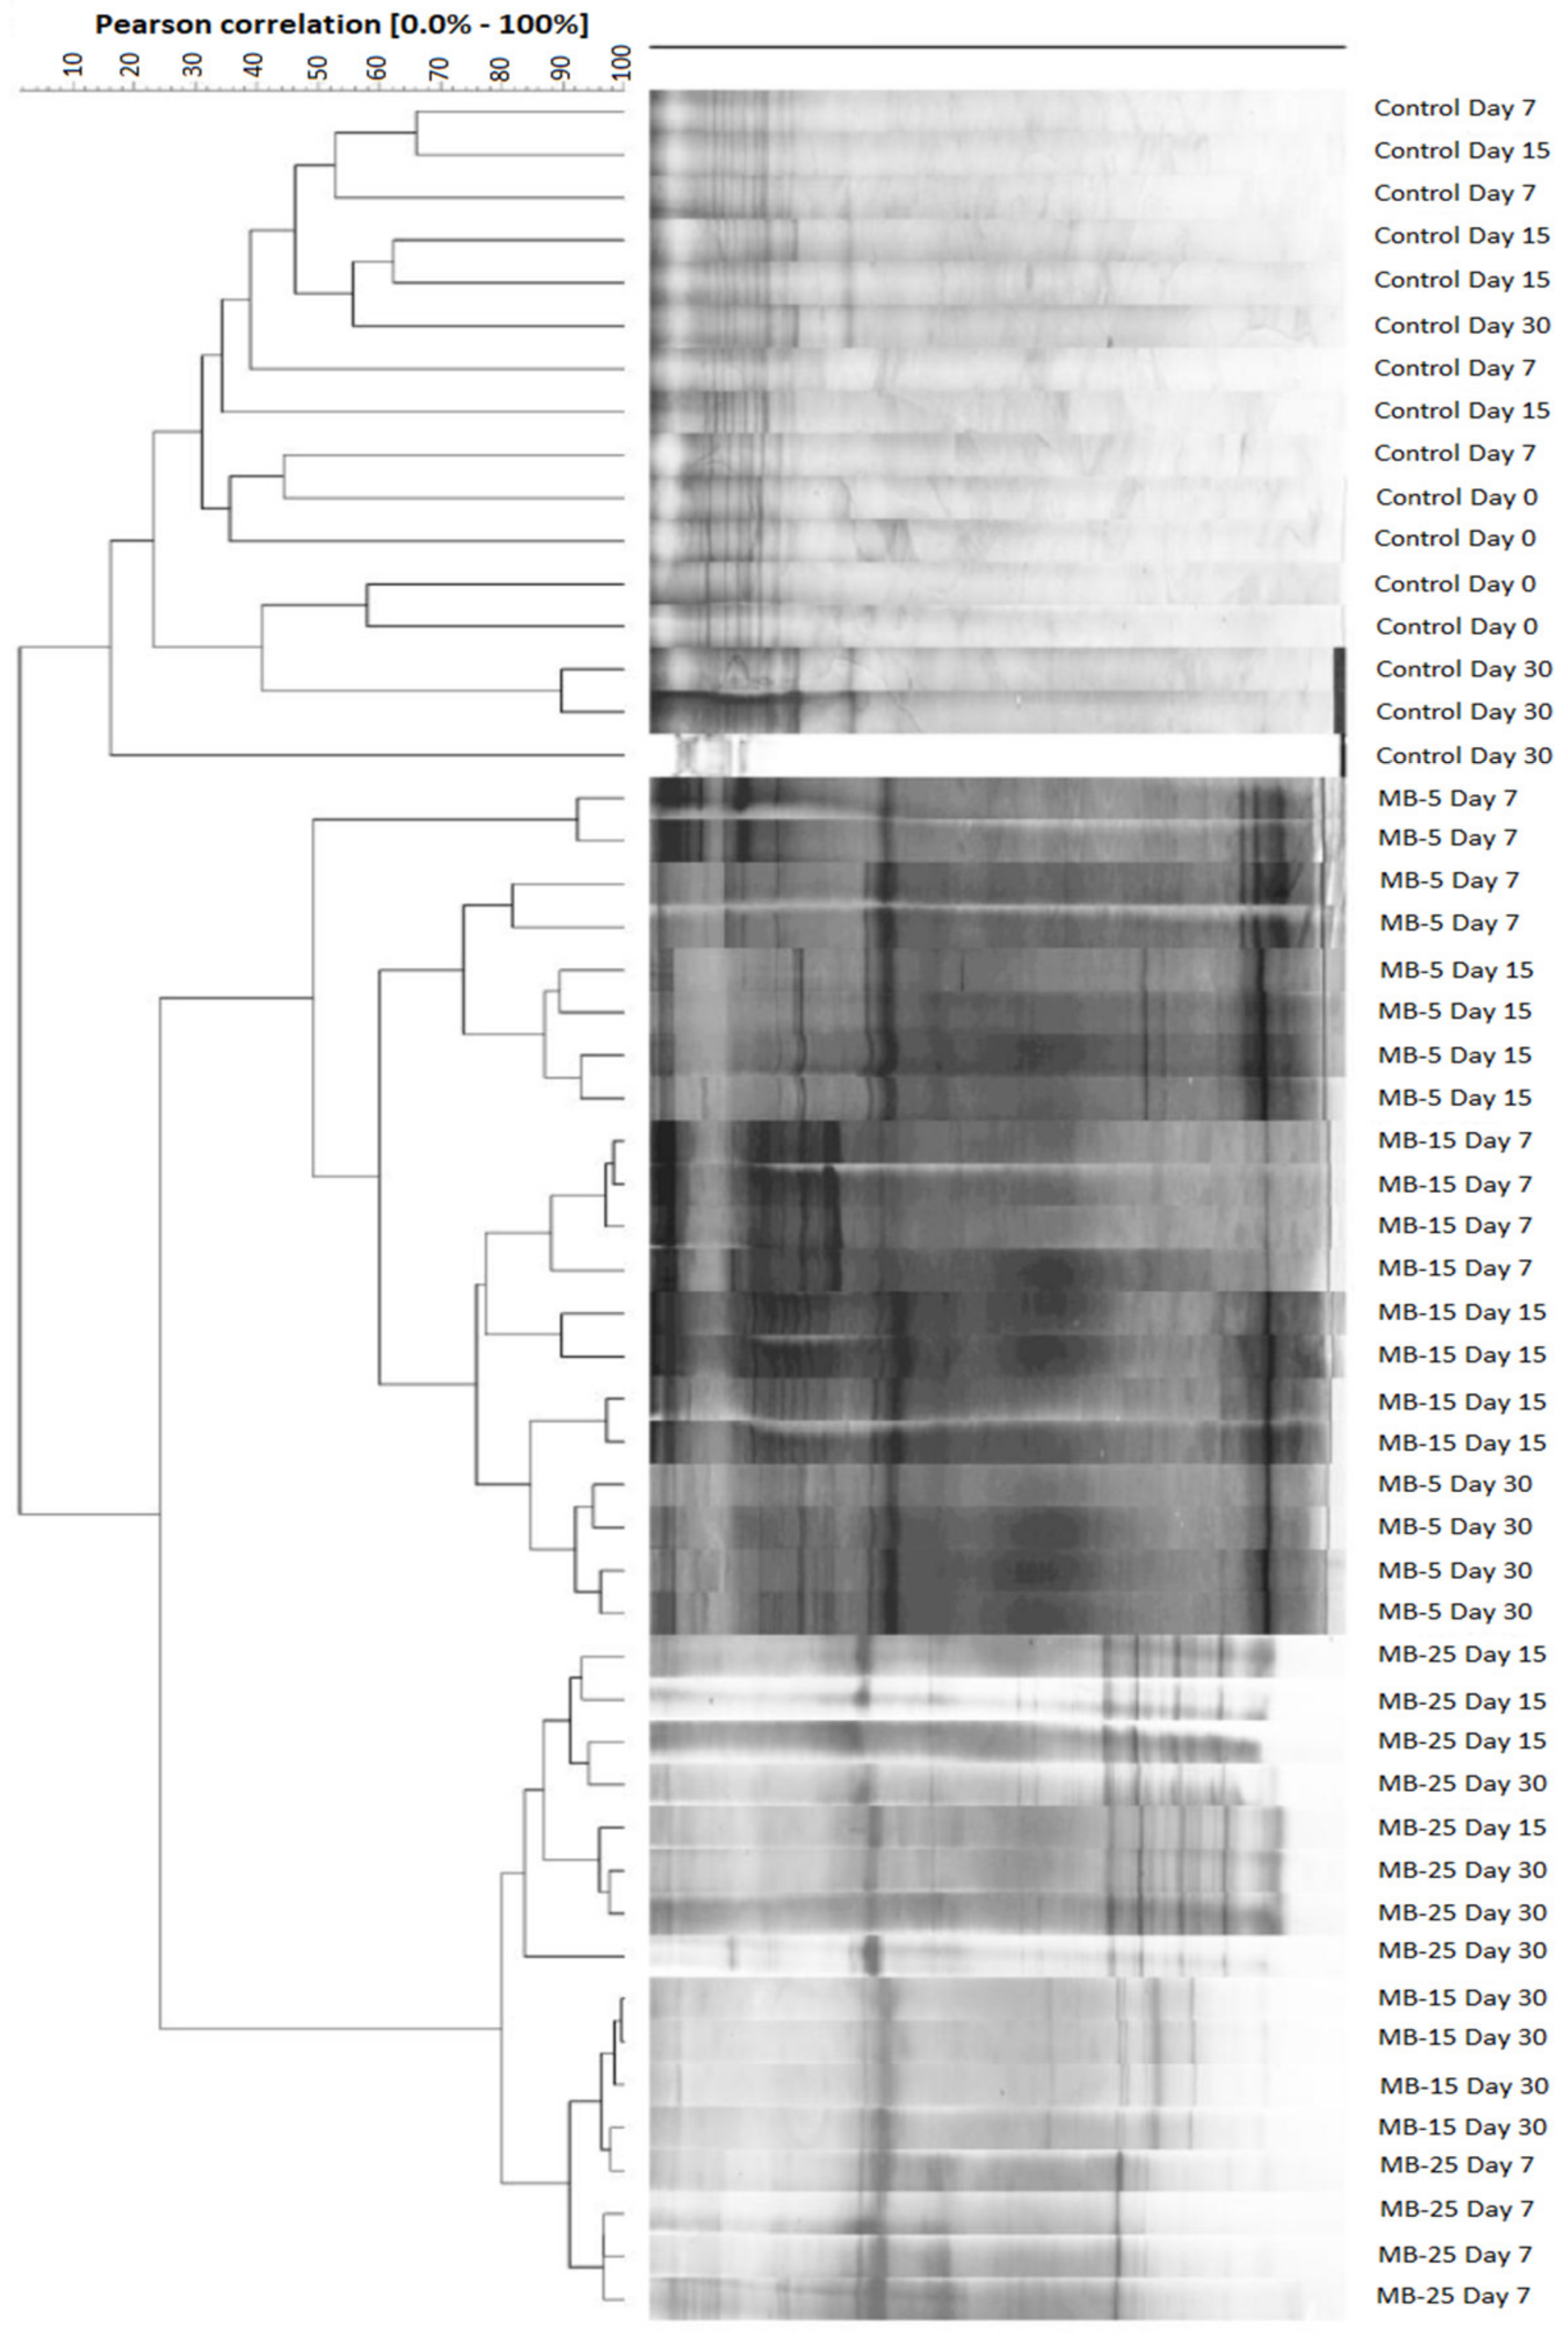
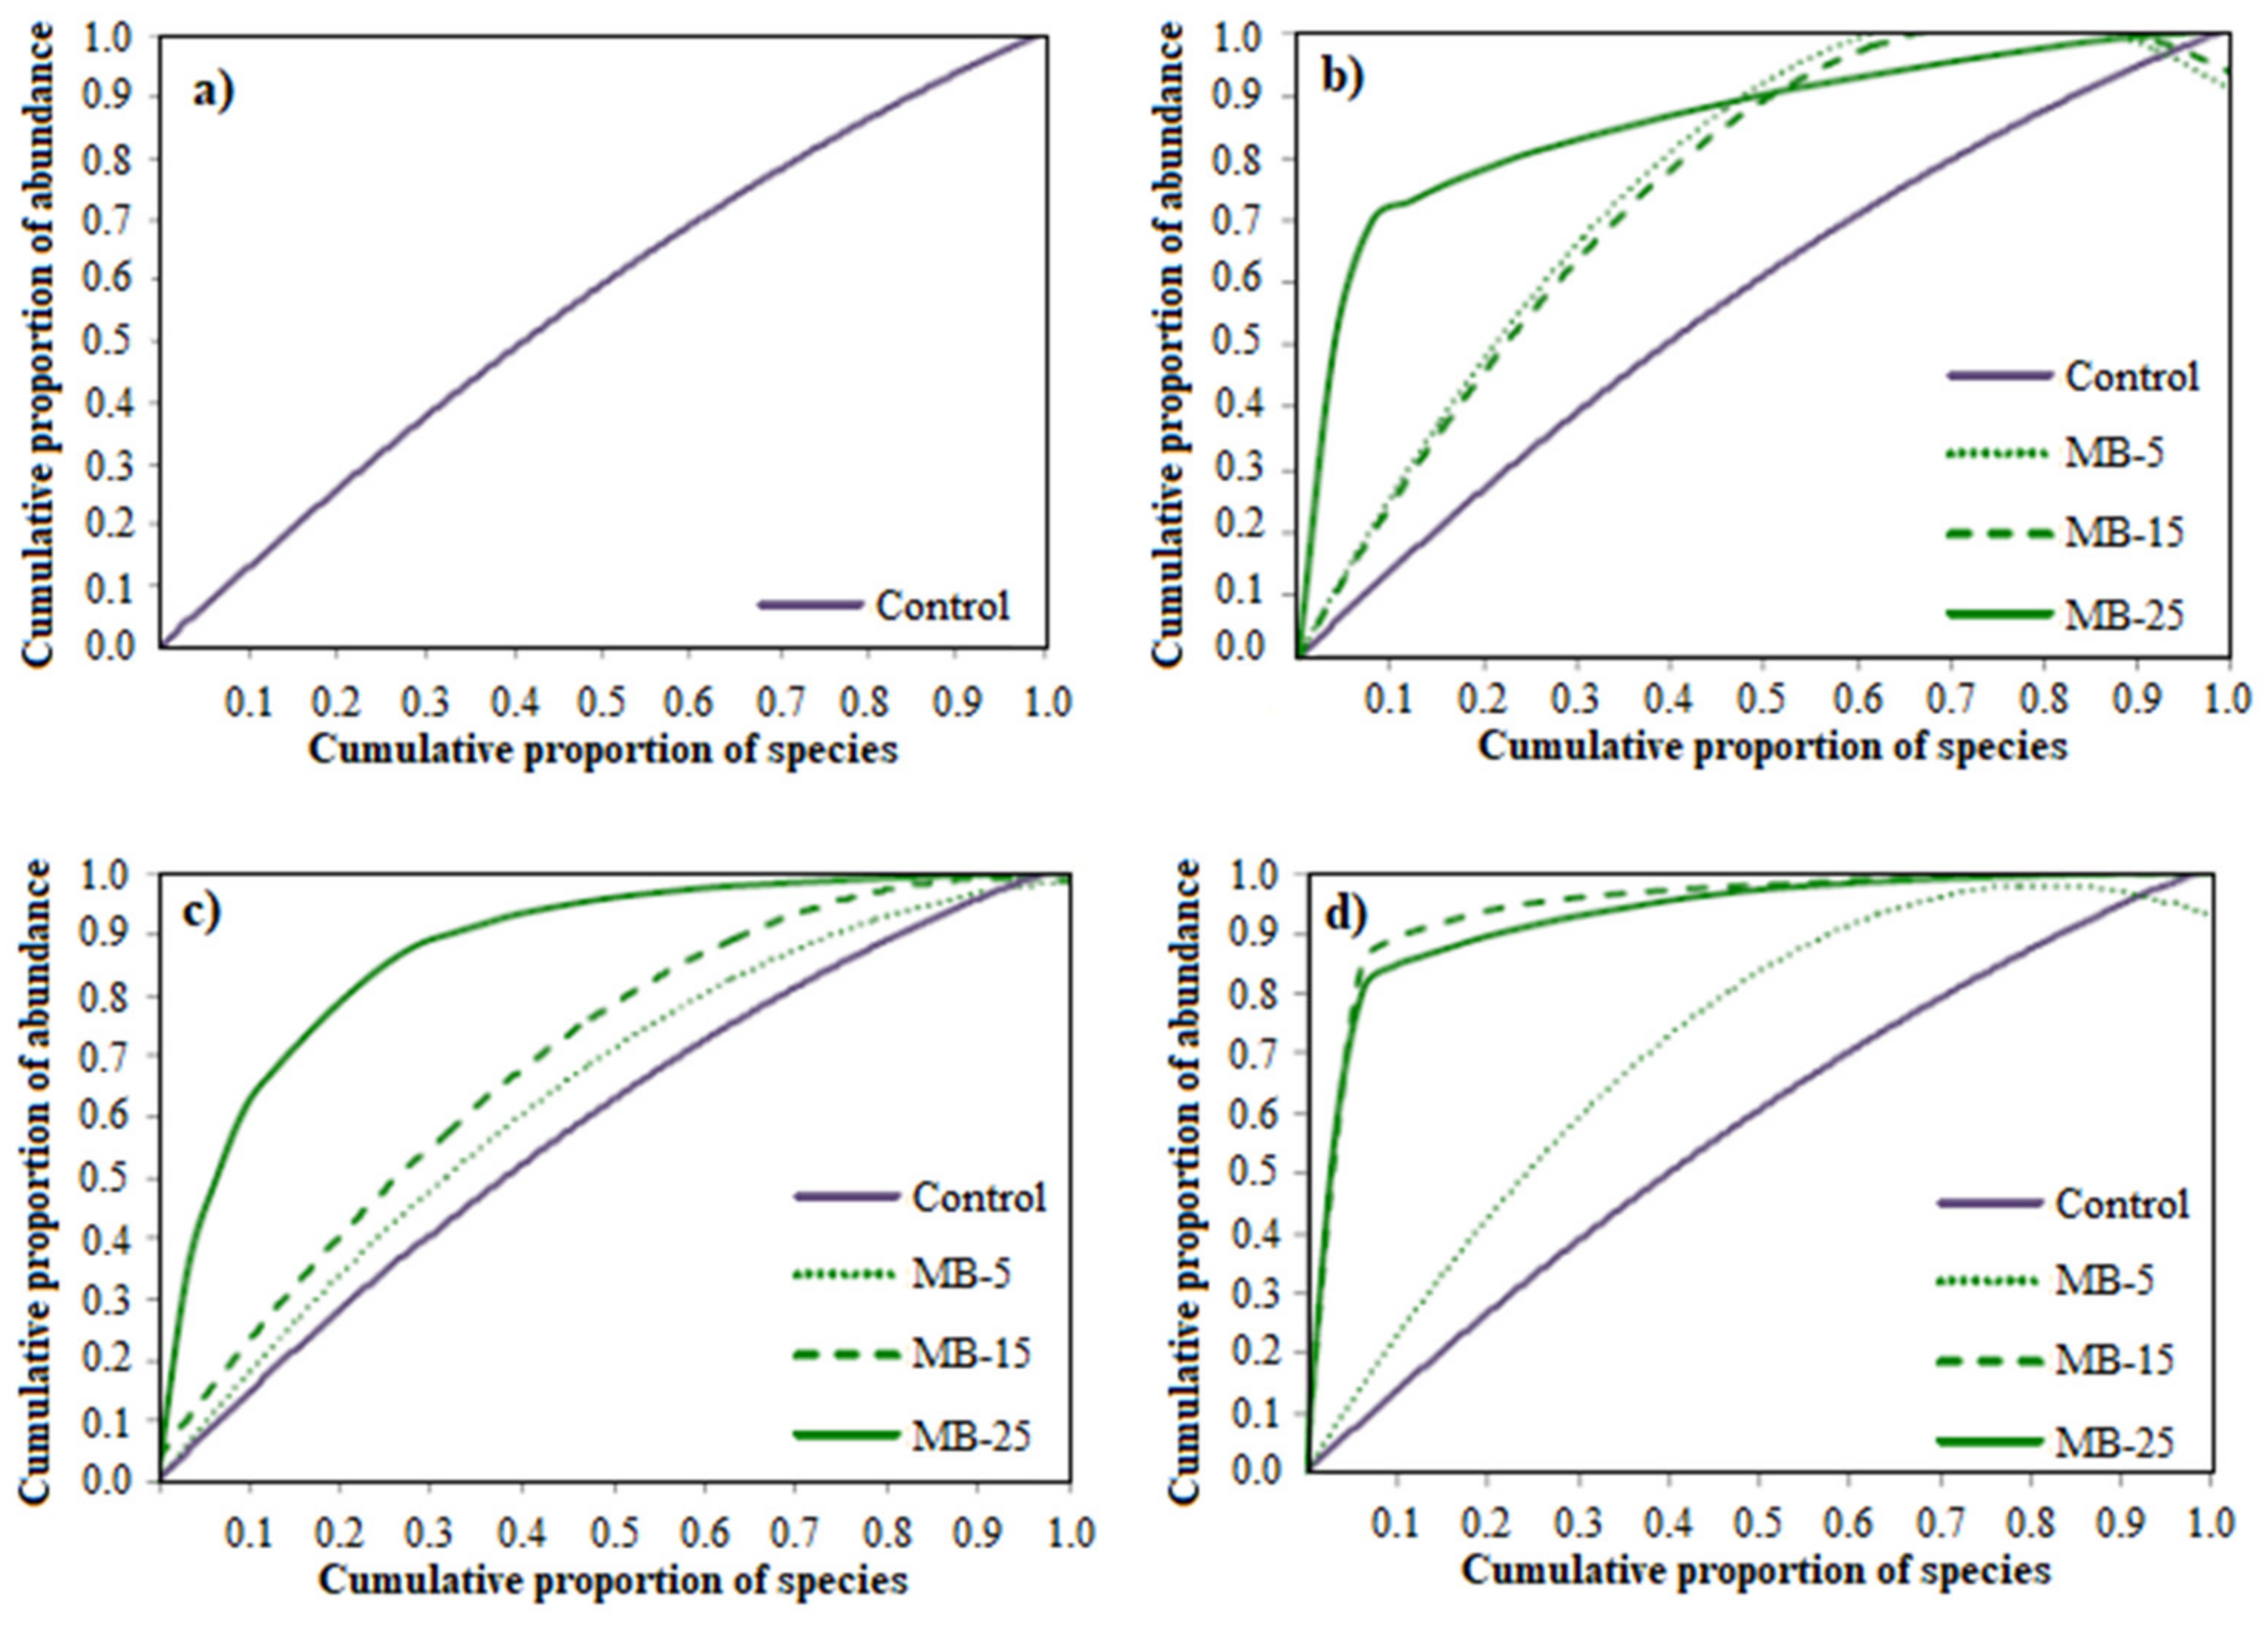
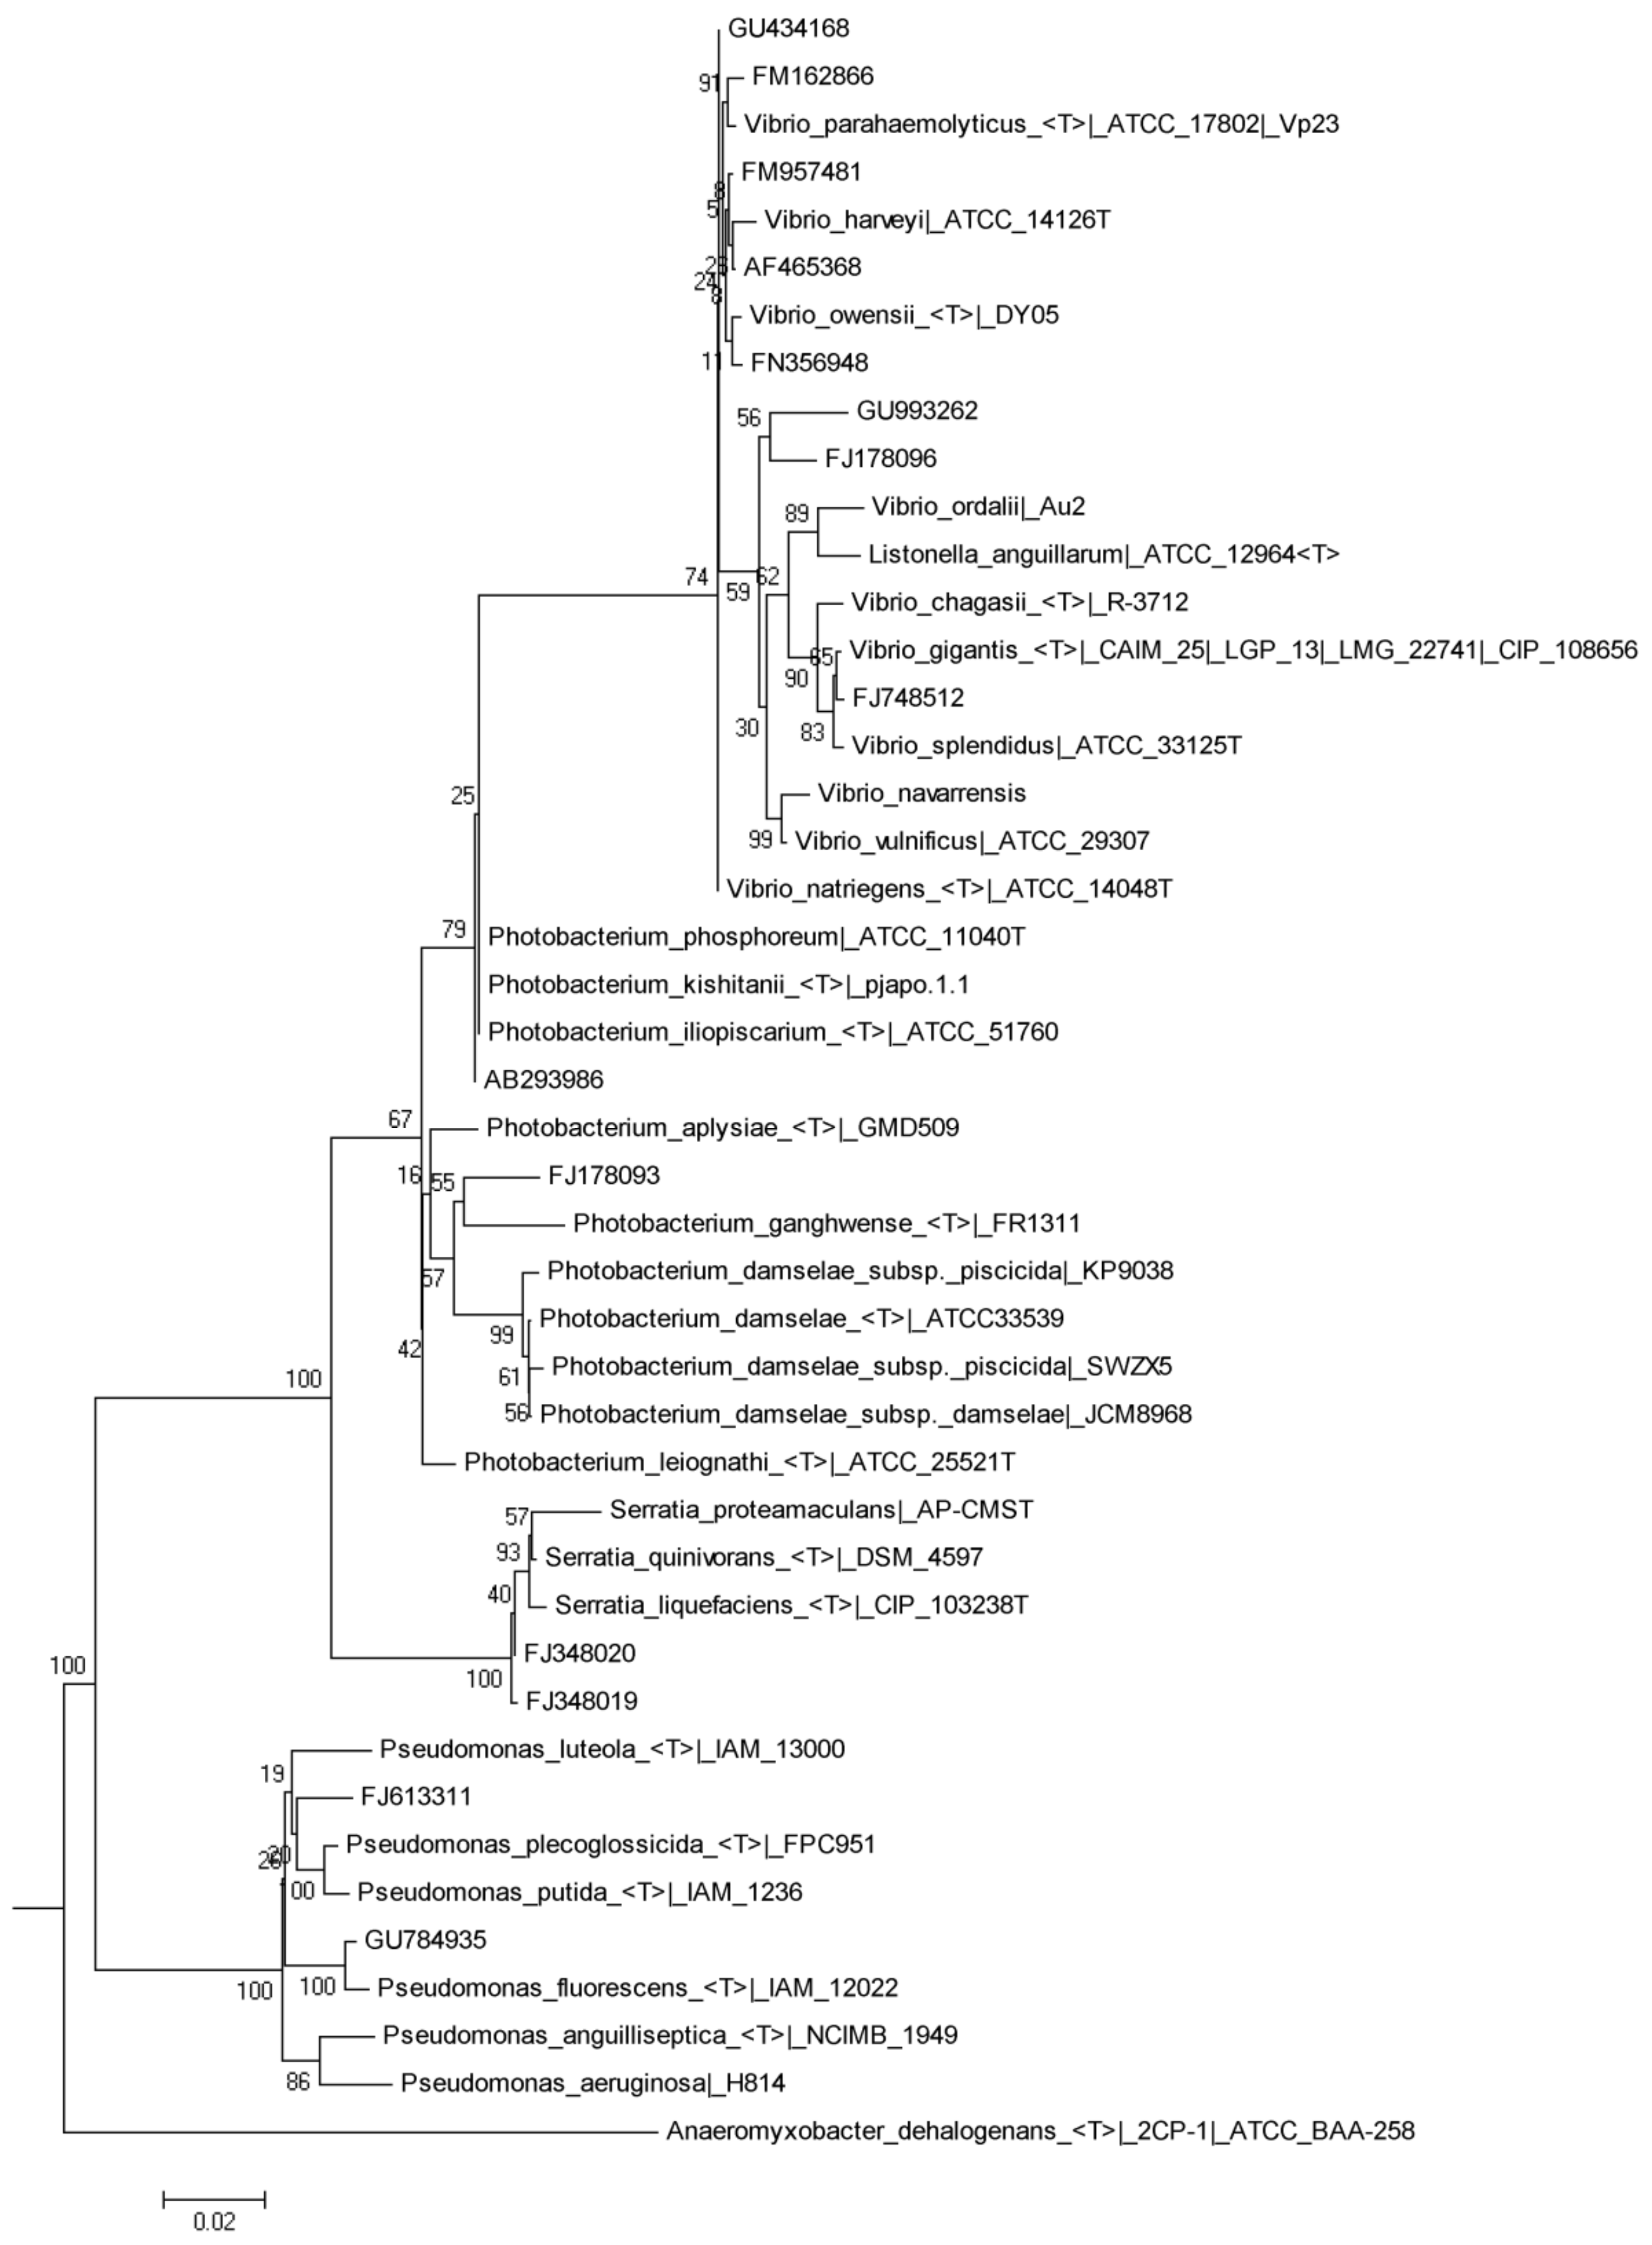
3.3. Evaluation of Intestinal Microbiota

A clustering analysis of the PCR-DGGE patterns from intestinal microbiota revealed two different clusters. The first corresponded to the Control group at different sampling times. The second corresponded to the specimens fed with diets including microalgae at all sampling times, showing a similarity index of less than 10% (Figure 1). Within the Control group, no defined group was observed; on the contrary, the PCR-DGGE patterns appeared mixed regardless of the sampling time. On the other hand, within the group of diets containing microalgal meal, two well-differentiated groups were observed, corresponding to fish fed (1) MB-25 at all sampling times and MB-15 at day 30 (about 80% similarity) and (2) MB-5 at all sampling times and MB-15 at days 7 and 15 (48% similarity).
Average numbers of species richness (R) as determined by PCR-DGGE bands ranged from 7.75 ± 2.22 to 36.50 ± 6.40 bands in all intestinal samples (Table 7). Significant differences were observed in species richness at all sampling times, where fish fed MB-25 were statistically higher than the other groups (Table 7; p < 0.05). On the other hand, species richness of the MB-15 group varied over time, observing a significant reduction at day 15 (7.75 ± 2.22; p < 0.05). The distribution (evenness) of bacterial species within the control and the MB groups were not significantly different on the sampling days, except for day 30, on which the MB-15 diet was significantly reduced (Gini coefficient = 0.11) when compared to the other groups (p < 0.05). In addition, range-weighted richness (Rr) was used to study the environment’s carrying capacity based on the number of PCR-DGGE bands and the percentage of denaturing gradient in the DGGE gel needed to describe the total diversity of the sample analyzed. Rr values ranged from 7.97 ± 2.65 to 374.00 ± 180.47 (Table 7). The group fed the MB-25 diet always presented Rr values significantly higher than the rest of the treatments for all times (p < 0.05).
A Pareto–Lorenz distribution curve was constructed to assess the functional organization and evenness of the distribution of the bacterial population in each group investigated. It was observed that 20% (0.2 proportions on the x-axis) of the bacterial species were responsible for 20 to 25% of the functional interaction within the bacterial community structure of the fish fed the control diet (Figure 2). As for diets containing the microalgae blend, MB-5 and MB-15 groups presented a similar distribution curve at days 7 and 15, corresponding to 50% of the accumulated intensities. After 15 days of MB-25 diet administration, 20% of the bacterial species accumulated over 80% of the total intensity of the bands. At day 30, the distribution curves of MB-15 and MB-25 groups corresponded to 90% of accumulated intensities, higher than MB-5 and control groups (40 and 25%, respectively).
The dietary inclusion of the microalgae blend induced changes in the fish’s predominant bacteria of the intestinal microbiota (Table 8). The predominant bands sequenced from the PCR-DGGE patterns of the fish fed with the control diet for the different times corresponded to an uncultured cyanobacterium and to isolates of the genera Vibrio and Photobacterium, phylogenetically related to Vibrio alginolyticus, Vibrio harveyi, and Vibrio sp., and Photobacterium sp., respectively. A bacterium from the Enterobacteriaceae group phylogenetically related to Serratia proteomaculan was also sequenced (Figure 3). The inclusion of microalgae blend meal produced the appearance of new predominant bands. Thus, sequences related to the genera Shewanella and Comamonas were obtained, as well as lactic acid bacteria (LAB), such as Lactobacillus delbrueckii. A band related to the Thalassomonas genus also appeared as a predominant group of the intestinal microbiota of fish fed the MB-25 diet at days 15 and 30. At day 30, it was also observed that MB-15 and MB-25 diets increased the number of bands related to the genus Vibrio, phylogenetically related to species such as V. harveyi, Vibrio ichthyoenteri, Vibrio ordalii, Vibrio parahaemolyticus and Vibrio vulnificus (Figure 3).

4. Discussion

4.1. Growth Performance, Nutrient Utilization, and Proximate Composition

Fishmeal usage in diets for carnivorous fish has drawn criticism for the aquaculture sector. However, using alternative protein sources has the potential to reduce important nutrients such as essential amino acids and highly unsaturated fatty acids, which might have detrimental impacts on general fish health [35], and lead to a product with worse nutritional quality for the consumer. Furthermore, consumers expect high-quality products, which is frequently confronted by the economic requirement of producing more economical aquafeeds to operate a more lucrative business [36], which may be accomplished by employing low-cost alternative feedstuffs. Our results prove that replacing up to 25% of fishmeal with microalgae blend in feeds for S. aurata is possible without affecting survival or growth.
Due to their well-balanced nutritional composition, microalgae meals are becoming more and more significant in the aquafeed business [8]. For instance, the combination of Schizochytrium limacinum meal and Haematococcus pluvialis lipid-extracted meal could replace fishmeal by 80% without producing any negative effects on long-fin yellowtail (Seriola rivoliana) [37]. According to Vizcaíno et al. [15], including S. almeriensis meal (up to 39%) in practical diets had no discernible negative impacts on gilthead seabream’s growth performance (S. aurata). For several species, however, only a small percentage of microalgal replacement led to growth outcomes comparable to those of control diets. For European sea bass (Dicentrarchus labrax), a 20% fishmeal replacement of Isochrysis sp. had no negative effect on feed intake or growth performance [38]. For Atlantic salmon (Salmo salar), only 6% of fishmeal replacement by Phaeodactylum tricornutum was recommended to avoid adverse effects on feed conversion ratio (FCR) and digestibility [39]. Since higher levels of fishmeal replacement reduced growth performance, only 5% of the freeze-dried biomass of Tetraselmis suecica was indicated for S. aurata [13]. Thus, it seems that the farmed fish species and the microalgae meal have an impact on fish development in response to fishmeal replacement with microalgae meals.
In the present study, although not significantly, the hepatosomatic index (HSI) decreased in microalgae-fed specimens, especially with high inclusion levels. Similar results were obtained by other authors [13,15] who detected that high inclusion of microalgae meal induced lower HSI compared to microalgae-free control diets. According to Nakagawa [40] and Ergün et al. [41], this finding appears to indicate that the better effectiveness of mobilizing lipids in the fish liver is thought to be directly correlated with the quantity of microalgae inclusion. As a result, the higher lipid mobilization efficiency shown in fish given the highest levels of microalgae appears to be associated with the lower HSI values, which may change the fish’s body lipid content [42].
Proximate body composition means the determination of the fish’s water, protein, fat, and ash content [43], which is thought to be a reliable predictor of its health and physiological state [44]. Although none of the diets modified protein content, fish fed 15% and 25% microalgae blends showed statistically decreased body lipids. By enhancing the utilization of lipids as an energy source in fish metabolism, increased lipid mobilization can decrease its storage [13,15]. This mechanism might explain our findings in S. aurata specimens fed on microalgae diets.

4.2. Fatty Acid Composition of Fish

Since fishmeal was replaced with microalgae, it is essential to ensure that the animal’s essential fatty acid requirements were met. The evaluation of fatty acid composition offers relevant information about the feed’s influence on the fish’s chemical profile [45]. According to Fountoulaki et al. [46], dietary fatty acid composition changes are reflected in the fatty acid composition of marine fish tissues. As expected, the significant reduction of the proportion of SFA and the increase in the incidence of 18:1n9 observed in the liver and muscle tissue of fish fed on microalgae-supplemented diets reflected the fatty acid profile of experimental feeds. Tibaldi et al. [38] pointed out that dietary use of microalgae seemed responsible for a certain degree of selective retention of specific fatty acids in fish tissues. In this regard, the results obtained in the present study revealed that the proportion of EPA and DHA in the liver and ARA and DHA in the muscle of fish fed the microalgae-supplemented diets were significantly higher than their respective dietary concentrations. Inadequate intake of these fatty acids, which are essential for cellular membrane structure and function, results in decreased growth and increased fish mortality as well as other pathologies such as liver or intestine steatosis [47].
The observed selective retention has been previously reported in other marine fish species fed with algae-supplemented diets [10,48,49], pointing to a relationship between the algae inclusion level and the higher efficiency of mobilization of lipids in fish liver. Indeed, fish fed the higher level of microalgae tended to show low HSI values, though no significant difference was found. It is widely known that EPA and DHA have different physiological functions and can be metabolized and incorporated into tissues differently [50]. Bell et al. [51] and Tocher [52] related this phenomenon to the higher catabolic use of EPA and/or to preferential retention of ARA and DHA during the biosynthesis and remodeling of phospholipids. Other authors, such as Peng et al. [53] and Alhazzaa et al. [54], pointed out that dietary fatty acid composition could affect the gene expression and activities of specific enzymes involved in lipid metabolism yielding the accumulation of specific fatty acids in the fish tissues. Therefore, these results indicate noticeable effects of dietary inclusion of a microalgae blend on fish lipid metabolism, though the processes concerning this relationship remain to be fully ascertained.

4.3. Evaluation of Predominant Intestinal Microbiota

Given the functional role of the gut microbiome in host physiology, general development, and health, microbiome regulation may be a practical way to reduce fish diseases in aquaculture [55]. Dietary changes in the microbiome may also impact the immunological response, as well as fish susceptibility and possible resistance to diseases [56]. Here, we reported that the effects of the microalgae blend meal on the gut microbiome of gilthead seabream significantly varied depending on the inclusion levels.
The dendrogram from the cluster analysis of the intestinal microbiota showed two well-differentiated clusters (control and specimens fed with microalgae) after 7 days of feeding, indicating that the microalgae blend supplementation modified the intestinal microbiota. These results are consistent with those published by Abdala-Díaz et al. [30], who reported comparable differentiated clusters after 7 days of feeding the control and 25% Ulva rigida diet. The specific richness (R) and Rr values were systematically higher in fish-fed 25% microalgae blend at all sampling times. Moreover, at the end of the feeding trial, Rr values were higher than 30 in all groups fed microalgae meal, reflecting a habitable environment in which many different microorganisms can appear [57], thus allowing quick adaptability to new conditions such as stress processes, temperature, and salinity changes, or pathogen infection [58]. Studies considering the influence of dietary microalgae on fish intestinal microbial communities reported confounding results. According to Zhang et al. [59], dietary Chlorella meal did not affect microbial diversity and richness species of largemouth bass (Micropterus salmoides) when the level of fishmeal replacement was less than 50%. In contrast, higher replacement levels resulted in a remarkable diversity loss, indicating different gut microbes’ responses to dietary inclusion levels. A reduction in intestinal microbial species richness and diversity was found in S. aurata fed a commercial feed supplemented with 10% Tetraselmis chuii or P. tricornutum [60].
On the other hand, some research has found that low-level dietary microalgae supplementation (ranging from 5 to 15%) results in an increasing trend in microbial diversity [61,62]. Our results indicate that the microalgae blend promoted an increase in bacterial species diversity and a distinct shift in microbiota fingerprinting as inclusion levels increased, implying an adaptive response to the dietary formulations and consistent with Lyons et al. [61]. Thus, a more diversified microbiota in the microalgae-fed fish might reflect additional plasticity in the microbiome to help break down, digest, and absorb the microalgal meal contained in their diet.
At the taxonomical level, the results showed that Photobacterium species were found among the detected DGGE bands of all experimental groups but not in any microalgae-fed groups at the end of the trial. This genus includes pathogenic fish species [63], whereas others have been isolated from the intestinal microbiota of S. aurata [27]. In the case of fish fed microalgae, predominant DGGE bands associated with the genus Photobacterium were not detected at day 30, which is consistent with the results of Abdala-Díaz et al. [30]. These authors did not identify DGGE bands related to Photobacterium species after 30 days of feeding with 25% of U. rigida. On the contrary, Tapia-Paniagua et al. [64] reported the presence of Photobacterium species in the microbiota of Senegalese sole (Solea senegalensis) fed 5% Ulva ohnoi. These results may indicate that the prevalence of this genus in the microbiota seems to be influenced by algal species.
Although the presence of specifical Vibrio species changed with the diet, Vibrio pathogenic species (mainly V. alginolyticus, V. harveyi, V. ichthyoenteri, and V. parahaemolyticus) appeared in the intestinal microbiota of all groups. However, in our study, Vibrio seems not to play a pathogenic role according to the absence of fish mortality and disease symptoms.
DGGE bands associated with Lactobacillus delbrueckii subspecies, specifically L. delbrueckii subsp bulgaricus, were discovered to be prevalent in the DGGE patterns of fish given MB-15 and MB-25 diets at day 30. Other studies have reported the same species in seabream fed diets enriched with U. rigida after 30 and 60 days of feeding [27,30]. Mohammadian et al. [65] proposed that increased colonization of L. delbrueckii might be due to higher probiont adhesion ability to the intestinal mucosa [66] or lower intestinal pH generated by Lactobacillus species [67], which suppresses pathogenic bacterial growth [68]. Furthermore, Lactobacillus species, including L. delbrueckii, have been shown to stimulate the innate immune response, which enhances fish resistance to diseases [65,69]. Interestingly, Lactobacillus species have antimicrobial activity against fish, and food-borne pathogens [70], including species of the Enterobacteriaceae family, which could be the cause of the absence of DGGE bands related to that family in fish fed MB-25 diets.
Some strains of the genus Pseudoalteromonas were promoted after 30 days in fish fed the MB-25 diet. In this sense, this genus includes strains with inhibitory capacity against fish-pathogenic Vibrio and Photobacterium strains [71], as well as against Gram-positive marine bacteria [72]. Thus, the promotion of Pseudoalteromonas could be related to the reduction in the presence of DGGE bands corresponding to V. harveyi and Photobacterium genus. Furthermore, they may also be used as a defense agent by the microbiota and marine fauna, suggesting that it is probiotic, at least in certain species [73].
Shewanella is an opportunistic pathogen affecting various fish species [74,75]. Several studies, however, have found that Shewanella species are helpful to the host’s intestinal health [76]. Furthermore, it has been characterized as a probiotic for farmed fish species such as S. senegalensis and S. aurata [76]. In our study, Shewanella was found in all microalgae diet groups, not the control group. On the contrary, Ma et al. [77] reported a reduction in the abundance of Shewanella in zebrafish (Danio rerio) fed with any of Schizochytrium sp., A. platensis, Chlorella sorokiniana, Chromochloris zofingiensis, and Dunaliella salina. It might be suggestive to think that the promotion/reduction in the abundance of Shewanella species may increase or decrease depending on the varied inclusion levels, the specific microalgae strain and fish species, and/or the duration of the experiment.
These results lead us to believe that the dietary inclusion of a microalgae blend for 30 days, especially a 25% inclusion, promotes an optimal microbial diversity state.

5. Conclusions

Overall, S. aurata juveniles adapted well to the nutritional formulation used in this study since survival and growth were comparable to the control group after 30 days of feeding. According to the results, a 25% microalgae blend promoted appropriate microbial diversity, favoring the presence of potentially beneficial bacteria, such as Lactobacillus, and significantly influencing fish lipid metabolism. However, more study is required to determine if the effects appear during long-term studies for attaining a compromise with fish development and assessing the response against fish pathogens.

Author Contributions

Conceptualization, M.Á.M. and R.T.A.-D.; methodology, J.G.-M. and R.M.R.; software, J.G.-M.; validation, J.G.-M., F.J.A. and M.Á.M.; formal analysis, R.M.R. and A.J.V.; investigation, R.M.R., M.Á.M. and R.T.A.-D.; resources, F.G.A., F.L.F. and M.Á.M.; data curation, R.M.R.; writing—original draft preparation, J.G.-M., A.J.V. and F.J.A.; writing—review and editing, J.G.-M., F.G.A., J.M.M., F.L.F., A.J.V., F.J.A. and M.Á.M.; visualization, J.G.-M.; supervision, M.Á.M.; project administration, F.L.F.; funding acquisition, F.L.F. All authors have read and agreed to the published version of the manuscript.

Funding

This study had the financial support of Junta de Andalucía (grant no. AGR01842) and MINECO (grant no. AGL2008-05119-C02-02) and by European Regional Development Funds. The projects SABANA (grant no. 727874) from the European Union’s Horizon 2020 Research and Innovation program of the European Commission and AquaTech4Feed (grant # PCI2020–112204) granted by MCIN/AEI/10.13039/501100011033 and the EU “NextGenerationEU”/PRTR within the ERA-NET BioBlue COFUND, are also acknowledged for the financial funding. The Servicio de Dietas Experimentales of the University of Almería was granted by EQC2018-004984-P and EQC2019-006380-P.

Data Availability Statement

Not applicable.

Conflicts of Interest

The authors declare no conflict of interest.

References

  1. Hunter, M.C.; Smith, R.G.; Schipanski, M.E.; Atwood, L.W.; Mortensen, D.A. Agriculture in 2050: Recalibrating targets for sustainable intensification. BioScience 2017, 67, 386–391. [Google Scholar] [CrossRef]
  2. FAO (Food and Agriculture Organization of the United Nations). The State of World Fisheries and Aquaculture 2022. Towards Blue Transformation; FAO: Rome, Italy, 2022. [Google Scholar] [CrossRef]
  3. Kiron, V.; Sørensen, M.; Huntley, M.; Vasanth, G.K.; Gong, Y.; Dahle, D.; Palihawadana, A.M. Defatted biomass of the microalga, Desmodesmus sp., can replace fishmeal in the feeds for Atlantic salmon. Front. Mar. Sci. 2016, 3, 67. [Google Scholar] [CrossRef]
  4. Sarker, P.K.; Kapuscinski, A.R.; Lanois, A.J.; Livesey, E.D.; Bernhard, K.P.; Coley, M.L. Towards sustainable aquafeeds: Complete substitution of fish oil with marine microalga Schizochytrium sp. improves growth and fatty acid deposition in juvenile Nile tilapia (Oreochromis niloticus). PLoS ONE 2016, 11, e0156684. [Google Scholar] [CrossRef] [PubMed]
  5. Chen, F.; Leng, Y.; Lu, Q.; Zhou, W. The application of microalgae biomass and bio-products as aquafeed for aquaculture. Algal Res. 2021, 60, 102541. [Google Scholar] [CrossRef]
  6. Ravindran, B.; Gupta, S.; Cho, W.-M.; Kim, J.; Lee, S.; Jeong, K.-H.; Lee, D.; Choi, H.-C. Microalgae Potential and Multiple Roles—Current Progress and Future Prospects—An Overview. Sustainability 2016, 8, 1215. [Google Scholar] [CrossRef]
  7. Shah, M.R.; Lutzu, G.A.; Alam, A.; Sarker, P.; Kabir Chowdhury, M.A.; Parsaeimehr, A.; Liang, Y.; Daroch, M. Microalgae in aquafeeds for a sustainable aquaculture industry. J. Appl. Phycol. 2018, 30, 197–213. [Google Scholar] [CrossRef]
  8. Tibbetts, S.M. The Potential for ‘Next-Generation’, Microalgae-Based Feed Ingredients for Salmonid Aquaculture in Context of the Blue Revolution. In Microalgal Biotechnology; IntechOpen: London, UK, 2018. [Google Scholar] [CrossRef]
  9. Sarker, P.K.; Kapuscinski, A.R.; Bae, A.Y.; Donaldson, E.; Sitek, A.J.; Fitzgerald, D.S.; Edelson, O.F. Towards sustainable aquafeeds: Evaluating substitution of fishmeal with lipid-extracted microalgal co-product (Nannochloropsis oculata) in diets of juvenile Nile tilapia (Oreochromis niloticus). PLoS ONE 2018, 13, e0201315. [Google Scholar] [CrossRef]
  10. Vizcaíno, A.J.; Rodiles, A.; López, G.; Sáez, M.I.; Herrera, M.; Hachero, I.; Martínez, T.F.; Cerón-García, M.C.; Alarcón, F.J. Growth performance, body composition, and digestive functionality of Senegalese sole (Solea senegalensis Kaup, 1858) juveniles fed diets including microalgae freeze-dried biomass. Fish Physiol. Biochem. 2018, 44, 661–677. [Google Scholar] [CrossRef]
  11. Perera, E.; Sánchez-Ruiz, D.; Sáez, M.I.; Galafat, A.; Barany, A.; Fernández-Castro, M.; Vizcaíno, A.J.; Fuentes, J.; Martínez, T.F.; Mancera, J.M.; et al. Low dietary inclusion of nutraceuticals from microalgae improves feed efficiency and modifies intermediary metabolisms in gilthead sea bream (Sparus aurata). Sci. Rep. 2020, 10, 18676. [Google Scholar] [CrossRef]
  12. Oostlander, P.C.; van Houcke, J.; Wijffels, R.H.; Barbosa, M.J. Microalgae production cost in aquaculture hatcheries. Aquaculture 2020, 525, 735310. [Google Scholar] [CrossRef]
  13. Vizcaíno, A.J.; Saéz, M.I.; López, G.; Arizcun, M.; Abellán, E.; Martínez, T.F.; Cerón-García, M.C.; Alarcón, F.J. Tetraselmis suecia and Tisochrysis lutea meal as dietary ingredients for gilthead sea bream (Sparus aurata L.) fry. J. Appl. Phycol. 2016, 28, 2843–2855. [Google Scholar] [CrossRef]
  14. García-Márquez, J.; Rico, R.M.; Sánchez-Saavedra, M.P.; Gómez-Pinchetti, J.L.; Acién, F.G.; Figueroa, F.L.; Alarcón, F.J.; Moriñigo, M.Á.; Abdala-Díaz, R.T. A short pulse of dietary algae boosts immune response and modulates fatty acid composition in juvenile Oreochromis niloticus. Aquac. Res. 2020, 51, 4397–4409. [Google Scholar] [CrossRef]
  15. Vizcaíno, A.J.; López, G.; Sáez, M.I.; Jiménez, J.A.; Barros, A.; Hidalgo, L.; Camacho-Rodríguez, J.; Martínez, T.F.; Cerón-García, M.C.; Alarcón, F.J. Effects of the microalga Scenedesmus almeriensis as fishmeal alternative in diets for gilthead sea bream, Sparus aurata, juveniles. Aquaculture 2014, 431, 34–43. [Google Scholar] [CrossRef]
  16. Gao, F.; Dominguez-Cabanelas, I.T.; Wijffels, R.H.; Barbosa, M.J. Fucoxanthin and docosahexaenoic acid production by cold-adapted Tisochrysis lutea. New Biotechnol. 2022, 66, 16–24. [Google Scholar] [CrossRef] [PubMed]
  17. Chua, E.T.; Schenk, P.M. A biorefinery for Nannochloropsis: Induction, harvesting, and extraction of EPA-rich oil and high-value protein. Bioresour. Technol. 2017, 244, 1416–1424. [Google Scholar] [CrossRef]
  18. Brown, M.R.; Jeffrey, S.W.; Volkman, J.K.; Dunstan, G.A. Nutritional properties of microalgae for mariculture. Aquaculture 1997, 151, 315–331. [Google Scholar] [CrossRef]
  19. Sánchez, J.F.; Fernández, J.M.; Acién, F.G.; Rueda, A.; Pérez-Parra, J.; Molina, E. Influence of culture conditions on the productivity and lutein content of the new strain Scenedesmus almeriensis. Process Biochem. 2008, 43, 398–405. [Google Scholar] [CrossRef]
  20. Mann, J.E.; Myers, J. On pigments, growth, and photosynthesis of Phaeodactylum tricornutum. J. Phycol. 1968, 4, 349–355. [Google Scholar] [CrossRef]
  21. Lourenço, S.O.; Barbarino, E.; De-Paula, J.C.; Pereira, L.O.D.S.; Lanfer Marquez, U.M. Amino acid composition, protein content and calculation of nitrogen-to-protein conversion factors for 19 tropical seaweeds. Phycol. Res. 2002, 50, 233–241. [Google Scholar] [CrossRef]
  22. Folch, J.; Lees, M.; Sloane Stanley, G.H. A simple method for the isolation and purification of total lipides from animal tissues. J. Biol. Chem. 1957, 226, 497–509. [Google Scholar] [CrossRef]
  23. Christie, W.W. Lipid Analysis, 3rd ed.; Pergamon Press: Oxford, UK, 2003. [Google Scholar]
  24. Martínez, G.; Shaw, E.M.; Carrillo, M.; Zanuy, S. Protein salting-out method applied to genomic DNA isolation from fish whole blood. BioTechniques 1998, 24, 238–239. [Google Scholar] [CrossRef] [PubMed]
  25. Tapia-Paniagua, S.T.; Chabrillón, M.; Díaz-Rosales, P.; de la Banda, I.G.; Lobo, C.; Balebona, M.C.; Moriñigo, M.A. Intestinal Microbiota Diversity of the Flat Fish Solea senegalensis (Kaup, 1858) Following Probiotic Administration. Microb. Ecol. 2010, 60, 310–319. [Google Scholar] [CrossRef] [PubMed]
  26. Konstantinov, S.R.; Zhu, W.-Y.; Williams, B.A.; Tamminga, S.; Vos, W.M.; Akkermans, A.D.L. Effect of fermentable carbohydrates on piglet faecal bacterial communities as revealed by denaturing gradient gel electrophoresis analysis of 16S ribosomal DNA. FEMS Microbiol. Ecol. 2003, 43, 225–235. [Google Scholar] [CrossRef] [PubMed]
  27. Rico, R.M.; Tejedor-Junco, M.T.; Tapia-Paniagua, S.T.; Alarcón, F.J.; Mancera, J.M.; López-Figueroa, F.; Balebona, M.C.; Abdala-Díaz, R.T.; Moriñigo, M.A. Influence of the dietary inclusion of Gracilaria cornea and Ulva rigida on the biodiversity of the intestinal microbiota of Sparus aurata juveniles. Aquac. Int. 2016, 24, 965–984. [Google Scholar] [CrossRef]
  28. Sanguinetti, C.J.; Neto, E.D.; Simpson, A.J.G. Rapid silver staining and recovery of PCR products separated on polyacrylamide gels. BioTechniques 1994, 17, 914–921. [Google Scholar] [PubMed]
  29. Häne, B.G.; Jäger, K.; Drexler, H.G. The Pearson product-moment correlation coefficient is better suited for identification of DNA fingerprint profiles than band matching algorithms. Electrophoresis 1993, 14, 967–972. [Google Scholar] [CrossRef] [PubMed]
  30. Abdala-Díaz, R.T.; García-Márquez, J.; Rico, R.M.; Gómez-Pinchetti, J.L.; Mancera, J.M.; Figueroa, F.L.; Alarcón, F.J.; Martínez-Manzanares, E.; Moriñigo, M.Á. Effects of a short pulse administration of Ulva rigida on innate immune response and intestinal microbiota in Sparus aurata juveniles. Aquac. Res. 2021, 52, 3038–3051. [Google Scholar] [CrossRef]
  31. Altschul, S.F.; Gish, W.; Miller, W.; Myers, E.W.; Lipman, D.J. Basic local alignment search tool. J. Mol. Biol. 1990, 215, 403–410. [Google Scholar] [CrossRef]
  32. Pruesse, E.; Peplies, J.; Glöckner, F.O. SINA: Accurate high-throughput multiple sequence alignment of ribosomal RNA genes. Bioinformatics 2012, 28, 1823–1829. [Google Scholar] [CrossRef]
  33. Maidak, B.L.; Cole, J.R.; Parker, C.T.; Garrity, G.M.; Larsen, N.; Li, B.; Lilburn, T.G.; McCaughey, M.J.; Olsen, G.J.; Overbeek, R.; et al. A new version of the RDP (Ribosomal Database Project). Nucleic Acids Res. 1999, 27, 171–173. [Google Scholar] [CrossRef]
  34. Ludwig, W.; Strunk, O.; Westram, R.; Richter, L.; Meier, H.; Yadhukumar, A.; Buchner, A.; Lai, T.; Steppi, S.; Jacob, G.; et al. ARB: A software environment for sequence data. Nucleic Acids Res. 2004, 32, 1363–1371. [Google Scholar] [CrossRef] [PubMed]
  35. Younis, E.S.M.; Al-Quffail, A.S.; Al-Asgah, N.A.; Abdel-Warith, A.W.A.; Al-Hafedh, Y.S. Effect of dietary fish meal replacement by red algae, Gracilaria arcuata, on growth performance and body composition of Nile tilapia Oreochromis niloticus. Saudi J. Biol. Sci. 2018, 25, 198–203. [Google Scholar] [CrossRef] [PubMed]
  36. González-Félix, M.L.; Maldonado-Othón, C.A.; Perez-Velazquez, M. Effect of dietary lipid level and replacement of fish oil by soybean oil in compound feeds for the shortfin corvina (Cynoscion parvipinnis). Aquaculture 2016, 454, 217–228. [Google Scholar] [CrossRef]
  37. Kissinger, K.R.; García-Ortega, A.; Trushenski, J.T. Partial fish meal replacement by soy protein concentrate, squid and algal meals in low fish-oil diets containing Schizochytrium limacinum for longfin yellowtail Seriola rivoliana. Aquaculture 2016, 452, 37–44. [Google Scholar] [CrossRef]
  38. Tibaldi, E.; Chini Zittelli, G.; Parisi, G.; Bruno, M.; Giorgi, G.; Tulli, F.; Venturini, S.; Tredici, M.R.; Poli, B.M. Growth performance and quality traits of European sea bass (D. labrax) fed diets including increasing levels of freeze-dried Isochrysis sp. (T-ISO) biomass as a source of protein and n-3 long chain PUFA in partial substitution of fish derivatives. Aquaculture 2015, 440, 60–68. [Google Scholar] [CrossRef]
  39. Sørensen, M.; Berge, G.M.; Reitan, K.I.; Ruyter, B. Microalga Phaeodactylum tricornutum in feed for Atlantic salmon (Salmo salar) -Effect on nutrient digestibility, growth and utilization of feed. Aquaculture 2016, 460, 116–123. [Google Scholar] [CrossRef]
  40. Nakagawa, H. Effect of dietary algae on improvement of lipid metabolism in fish. Biomed. Pharmacother. 1997, 51, 345–348. [Google Scholar] [CrossRef]
  41. Ergün, S.; Soyutürk, M.; Güroy, B.; Güroy, D.; Merrifield, D. Influence of Ulva meal on growth, feed utilization, and body composition of juvenile Nile tilapia (Oreochromis niloticus) at two levels of dietary lipid. Aquac. Int. 2009, 17, 355–361. [Google Scholar] [CrossRef]
  42. Ji, H.; Om, A.D.; Yoshimatsu, T.; Hayashi, M.; Umino, T.; Nakagawas, H.; Asano, M.; Nakagawa, A. Effect of dietary vitamins C and E fortification on lipid metabolism in red sea bream Pagrus major and black sea bream Acanthopagrus schlegeli. Fish. Sci. 2003, 69, 1001–1009. [Google Scholar] [CrossRef]
  43. Love, R.M. The Chemical Biology of Fishes; Academic Press: London, UK, 1980; Volume 2. [Google Scholar]
  44. Saliu, J.K.; Joy, O.; Catherine, O. Condition factor, fat and protein content of five fish species in Lekki Lagoon, Nigeria. Life Sci. J. 2007, 4, 54–57. [Google Scholar]
  45. Fernandes, T.J.R.; Alves, R.C.; Souza, T.; Silva, J.M.G.; Castro-Cunha, M.; Valente, L.M.P.; Oliveira, M.B.P.P. Lipid content and fatty acid profile of Senegalese sole (Solea senegalensis Kaup, 1858) juveniles as affected by feed containing different amounts of plant protein sources. Food Chem. 2012, 134, 1337–1342. [Google Scholar] [CrossRef] [PubMed]
  46. Fountoulaki, E.; Vasilaki, A.; Hurtado, R.; Grigorakis, K.; Karacostas, I.; Nengas, I.; Rigos, G.; Kotzamanis, Y.; Venou, B.; Alexis, M.N. Fish oil substitution by vegetable oils in commercial diets for gilthead sea bream (Sparus aurata L.); effects on growth performance, flesh quality and fillet fatty acid profile: Recovery of fatty acid profiles by a fish oil finishing diet under fluctuating water temperatures. Aquaculture 2009, 289, 317–326. [Google Scholar]
  47. Tocher, D.R. Fatty acid requirements in ontogeny of marine and freshwater fish. Aquac. Res. 2010, 41, 717–732. [Google Scholar] [CrossRef]
  48. Cardinaletti, G.; Messina, M.; Bruno, M.; Tulli, F.; Poli, B.M.; Giorgi, G.; Chini-Zittelli, G.; Tredici, M.; Tibaldi, E. Effects of graded levels of a blend of Tisochrysis lutea and Tetraselmis suecica dried biomass on growth and muscle tissue composition of European sea bass (Dicentrarchus labrax) fed diets low in fish meal and oil. Aquaculture 2018, 485, 173–182. [Google Scholar] [CrossRef]
  49. García-Márquez, J.; Galafat, A.; Vizcaíno, A.J.; Barany, A.; Martos-Sitcha, J.A.; Mancera, J.M.; Acién, G.; Figueroa, F.L.; Alarcón, F.J.; Arijo, S.; et al. Dietary Use of the Microalga Chlorella fusca Improves Growth, Metabolism, and Digestive Functionality in Thick-Lipped Grey Mullet (Chelon labrosus, Risso 1827) Juveniles. Front. Mar. Sci. 2022, 9, 902203. [Google Scholar] [CrossRef]
  50. Emery, J.A.; Norambuena, F.; Trushenski, J.; Turchini, G.M. Uncoupling EPA and DHA in fish nutrition: Dietary demand is limited in Atlantic salmon and effectively met by DHA alone. Lipids 2016, 51, 399–412. [Google Scholar] [CrossRef]
  51. Bell, J.G.; Henderson, R.J.; Tocher, D.R.; McGhee, F.; Dick, J.R.; Porter, A.; Smullen, R.P.; Sargent, J.R. Substituting fish oil with crude palm oil in the diet of Atlantic salmon (Salmo salar) affects muscle fatty acid composition and hepatic fatty acid metabolism. J. Nutr. 2002, 132, 222–230. [Google Scholar] [CrossRef]
  52. Tocher, D.R. Metabolism and functions of lipids and fatty acids in teleost fish. Rev. Fish. Sci. 2003, 11, 107–184. [Google Scholar] [CrossRef]
  53. Peng, X.; Li, F.; Lin, S.; Chen, Y. Effects of total replacement of fish oil on growth performance, lipid metabolism and antioxidant capacity in tilapia (Oreochromis niloticus). Aquac. Int. 2016, 24, 145–156. [Google Scholar] [CrossRef]
  54. Alhazzaa, R.; Bridle, A.R.; Nichols, P.D.; Carter, C.G. Replacing dietary fish oil with Echium oil enriched barramundi with C18 PUFA rather than long-chain PUFA. Aquaculture 2011, 312, 162–171. [Google Scholar] [CrossRef]
  55. Butt, R.L.; Volkoff, H. Gut microbiota and energy homeostasis in fish. Front. Endocrinol. 2019, 10, 9. [Google Scholar] [CrossRef] [PubMed]
  56. Xiong, J.-B.; Nie, L.; Chen, J. Current understanding on the roles of gut microbiota in fish disease and immunity. Zool. Res. 2019, 40, 70–76. [Google Scholar] [CrossRef] [PubMed]
  57. Marzorati, M.; Wittebolle, L.; Boon, N.; Daffonchio, D.; Verstraete, W. How to get more out of molecular fingerprints: Practical tools for microbial ecology. Environ. Microbiol. 2008, 10, 1571–1581. [Google Scholar] [CrossRef] [PubMed]
  58. Wittebolle, L.; Vervaeren, H.; Verstraete, W.; Boon, N. Quantifying community dynamics of nitrifiers in functionally stable reactors. Appl. Environ. Microbiol. 2008, 74, 286–293. [Google Scholar] [CrossRef] [PubMed]
  59. Zhang, Z.; Xi, L.; Liu, H.; Jin, J.; Yang, Y.; Zhu, X.; Han, D.; Xie, S. High replacement of fishmeal by Chlorella meal affects intestinal microbiota and the potential metabolic function in largemouth bass (Micropterus salmoides). Front. Microbiol. 2022, 13, 3772. [Google Scholar] [CrossRef]
  60. Cerezuela, R.; Guardiola, F.A.; González, P.; Meseguer, J.; Esteban, M.Á. Effects of dietary Bacillus subtilis, Tetraselmis chuii, and Phaeodactylum tricornutum, singularly or in combination, on the immune response and disease resistance of sea bream (Sparus aurata L.). Fish Shellfish Immunol. 2012, 33, 342–349. [Google Scholar] [CrossRef]
  61. Lyons, P.P.; Turnbull, J.F.; Dawson, K.A.; Crumlish, M. Effects of low-level dietary microalgae supplementation on the distal intestinal microbiome of farmed rainbow trout Oncorhynchus mykiss (Walbaum). Aquac. Res. 2016, 48, 2438–2452. [Google Scholar] [CrossRef]
  62. Jorge, S.S.; Enes, P.; Serra, C.R.; Castro, C.; Iglesias, P.; Oliva Teles, A.; Couto, A. Short-term supplementation of gilthead seabream (Sparus aurata) diets with Nannochloropsis gaditana modulates intestinal microbiota without affecting intestinal morphology and function. Aquac. Nutr. 2019, 25, 1388–1398. [Google Scholar] [CrossRef]
  63. Acerete, L.; Espinosa, E.; Josa, A.; Tort, L. Physiological response of hybrid striped bass subjected to Photobacterium damselae subsp. piscicida. Aquaculture 2009, 298, 16–23. [Google Scholar] [CrossRef]
  64. Tapia-Paniagua, S.T.; Fumanal, M.; Anguís, V.; Fernández-DÍaz, C.; Alarcón, F.J.; Moriñigo, M.A.; Balebona, M.C. Modulation of intestinal microbiota in Solea senegalensis fed low dietary level of Ulva ohnoi. Front. Microbiol. 2019, 10, 171. [Google Scholar] [CrossRef]
  65. Mohammadian, T.; Nasirpour, M.; Tabandeh, M.R.; Heidary, A.A.; Ghanei-Motlagh, R.; Hosseini, S.S. Administrations of autochthonous probiotics altered juvenile rainbow trout Oncorhynchus mykiss health status, growth performance and resistance to Lactococcus garvieae, an experimental infection. Fish Shellfish Immunol. 2019, 86, 269–279. [Google Scholar] [CrossRef]
  66. Liu, W.; Ren, P.; He, S.; Xu, L.; Yang, Y.; Gu, Z.; Zhou, Z. Comparison of adhesive gut bacteria composition, immunity, and disease resistance in juvenile hybrid tilapia fed two different Lactobacillus strains. Fish Shellfish Immunol. 2013, 35, 54–62. [Google Scholar] [CrossRef]
  67. Vendrell, D.; Balcázar, J.L.; de Blas, I.; Ruiz-Zarzuela, I.; Gironés, O.; Múzquiz, J.L. Protection of rainbow trout (Oncorhynchus mykiss) from lactococcosis by probiotic bacteria. Comp. Immunol. Microbiol. Infect. Dis. 2008, 31, 337–345. [Google Scholar] [CrossRef]
  68. Ringø, E.; Løvmo, L.; Kristiansen, M.; Bakken, Y.; Salinas, I.; Myklebust, R.; Olsen, R.E.; Mayhew, T.M. Lactic acid bacteria vs. pathogens in the gastrointestinal tract of fish: A review. Aquac. Res. 2010, 41, 451–467. [Google Scholar] [CrossRef]
  69. Mohammadian, T.; Alishahi, M.; Tabandeh, M.R.; Ghorbanpoor, M.; Gharibi, D. Changes in immunity, expression of some immune-related genes of shabot fish, Tor grypus, following experimental infection with Aeromonas hydrophila: Effects of autochthonous probiotics. Probiotics Antimicrob. Proteins 2018, 10, 616–628. [Google Scholar] [CrossRef] [PubMed]
  70. Chen, C.-C.; Lai, C.-C.; Huang, H.-L.; Su, Y.-T.; Chiu, Y.-H.; Toh, H.-S.; Chiang, S.-R.; Chuang, Y.-C.; Lu, Y.-C.; Tang, H.-J. Antimicrobial ability and mechanism analysis of Lactobacillus species against carbapenemase-producing Enterobacteriaceae. J. Microbiol. Immunol. Infect. 2021, 54, 447–456. [Google Scholar] [CrossRef] [PubMed]
  71. Richards, G.P.; Watson, M.A.; Needleman, D.S.; Uknalis, J.; Boyd, E.F.; Fay, J.P. Mechanisms for Pseudoalteromonas piscicida-Induced Killing of Vibrios and Other Bacterial Pathogens. Appl. Environ. Microbiol. 2017, 83, e00175-17. [Google Scholar] [CrossRef]
  72. Tang, B.L.; Yang, J.; Chen, X.L.; Wang, P.; Zhao, H.L.; Su, H.N.; Li, C.Y.; Yu, Y.; Zhong, S.; Wang, L.; et al. A predator-prey interaction between a marine Pseudoalteromonas sp. and Gram-positive bacteria. Nat. Commun. 2020, 11, 285. [Google Scholar] [CrossRef]
  73. Peng, L.H.; Liang, X.; Xu, J.K.; Dobretsov, S.; Yang, J.L. Monospecific Biofilms of Pseudoalteromonas Promote Larval Settlement and Metamorphosis of Mytilus coruscus. Sci. Rep. 2020, 10, 2577. [Google Scholar] [CrossRef]
  74. Paździor, E. Shewanella putrefaciens—A new opportunistic pathogen of freshwater fish. J. Vet. Res. 2016, 60, 429–434. [Google Scholar] [CrossRef]
  75. Paździor, E.; Pękala-Safińska, A.; Wasyl, D. Phenotypic diversity and potential virulence factors of the Shewanella putrefaciens group isolated from freshwater fish. J. Vet. Res. 2019, 63, 321–332. [Google Scholar] [CrossRef] [PubMed]
  76. Camara-Ruiz, M.; Balebona, M.C.; Moriñigo, M.A.; Esteban, M.A. Probiotic Shewanella putrefaciens (SpPdp11) as a fish health modulator: A review. Microorganisms 2020, 8, 1990. [Google Scholar] [CrossRef] [PubMed]
  77. Ma, K.; Chen, S.; Wu, Y.; Ma, Y.; Qiao, H.; Fan, J.; Wu, H. Dietary supplementation with microalgae enhances the zebrafish growth performance by modulating immune status and gut microbiota. Appl. Microbiol. Biotechnol. 2022, 106, 773–788. [Google Scholar] [CrossRef] [PubMed]
Figure 1. Clustering based on pairwise similarity index of DGGE patterns obtained from intestinal samples of juvenile S. aurata fed experimental diets for 30 days. Codes are: MB-5: 5% microalgae blend meal inclusion; MB-15: 15% microalgae blend meal inclusion; MB-25: 25% microalgae blend meal inclusion.
Microorganisms 11 00463 g001
Figure 2. Pareto–Lorenz distribution curves based on PCR-DGGE patterns from intestinal samples) of juvenile S. aurata fed experimental diets for 30 days at day 0, 7, 15, and 30 ((ad), respectively). Codes are: MB-5: 5% microalgae blend meal inclusion; MB-15: 15% microalgae blend meal inclusion; MB-25: 25% microalgae blend meal inclusion.
Microorganisms 11 00463 g002
Figure 3. Phylogenetic tree of clusters based on 16S rRNA sequences showing the relationships of the predominant bands obtained from intestinal samples of juvenile S. aurata with their closest species of Vibrio, Photobacterium, Pseudomonas, and Serratia genera.
Microorganisms 11 00463 g003
Table 1. Ingredient composition and nutrient composition of experimental diets.
Ingredients (g kg−1 DM)ControlMB-5MB-15MB-25
Fishmeal (LT-94)650615543471
Microalgae blend a050150250
Fish oil32302622
Soybean lecithin b10101010
Maltodextrin b245232208184
Cellulose c20202020
Choline chloride c8888
Vitamins and minerals d25252525
Sodium alginate d10101010
Proximate composition (% dry matter)
Crude protein45.244.844.945.7
Crude lipid12.412.012.111.9
Ash10.810.911.111.2
Moisture6.77.27.17.5
Codes are: MB-5: 5% microalgae blend meal inclusion; MB-15: 15% microalgae blend meal inclusion; MB-25: 25% microalgae blend meal inclusion. a Microalgae blend: 49.5% crude protein, 21.3% total carbohydrates, 12.6% crude fat, and 13.3% ash (% dry matter). b Emilio Peña S.A., aditivos alimentarios, Torrent, Valencia. Spain. c Sigma-Aldrich, Madrid. Spain. d Vitamin and mineral premix (values are g kg−1 except to those in parenthesis): Premix: 25; Choline. 10; DL-a-tocoferol. 5; ascorbic acid. 5; (PO4)2Ca3. 5. Premix composition: retinol acetate. 1,000,000 IU kg−1; calciferol. 500 IU kg−1; DL-a-tocoferol. 10; menadione sodium bisulfite. 0.8; thiamin hydrochloride. 2.3; riboflavin. 2.3; pyridoxine hydrochloride. 15; cyanocobalamin. 25; nicotinamide. 15; pantothenic acid. 6; folic acid. 0.65; biotin. 0.07; ascorbic acid. 75; inositol. 15; betaine. 100; polypeptides. 12; Zn. 5; Se. 0.02; I. 0.5; Fe. 0.2; CuO. 15; Mg. 5.75; Co. 0.02; Met. 1.2; Cys. 0.8; Lys. 1.3; Arg. 0.6; Phe. 0.4; Tryp. 0.7.
Table 2. Fatty acid composition (% fatty acids) of microalgae blend and experimental diets used in the feeding trial.
Fatty AcidsExperimental DietsMicroalgae
blend
ControlMB-5MB-15MB-25
Myristic acid (C14:0)7.203.813.873.982.81
Palmitic acid (C16:0)35.6330.2128.9224.4513.22
Palmitoleic acid (C16:1)3.947.317.417.326.32
Stearic acid (C18:0)9.075.334.283.893.78
Oleic acid (C18:1n9)6.5215.7916.2316.4215.85
Linoleic acid (C18:2n6)5.937.396.927.8810.70
α-linolenic acid (C18:3n3)0.811.721.912.145.18
Eicosenoic acid (C20:1)0.831.270.891.121.12
Eicosatrienoic acid (C20:3n3)0.400.370.410.491.31
Arachidonic acid (ARA; C20:4n6)0.250.380.410.392.44
Eicosapentaenoic acid (EPA; C20:5n3)8.179.109.2610.4812.88
Eurcic acid (C22:1n9)0.641.021.112.074.17
Docosahexaenoic acid (DHA; C22:6n3)12.1012.5313.2015.0916.33
Nervonic acid (C24:1)0.720.420.380.310.92
Saturated fatty acid (SFA)59.6942.7041.9036.2922.78
Monounsaturated fatty acid (MUFA)12.6525.8126.0227.2428.38
Polyunsaturated fatty acid (PUFA)20.6624.4925.1129.4748.84
n321.4823.7224.7828.2035.70
n66.187.777.338.2713.14
n97.1616.8117.3418.4920.02
n3/n63.473.053.383.402.71
EPA/DHA0.670.720.690.690.78
Codes are: MB-5: 5% microalgae blend meal inclusion; MB-15: 15% microalgae blend meal inclusion; MB-25: 25% microalgae blend meal inclusion.
Table 3. Growth performance, nutrient utilization, and somatic indices of juvenile S. aurata fed experimental diets for 30 days.
ParametersControlMB-5MB-15MB-25p
Growth and nutrient utilization
 Initial mean weight (g)15.9 ± 0.216.6 ± 0.615.9 ± 0.716.0 ± 1.3n.s.
 Final mean weight (g)28.7 ± 1.328.5 ± 2.327.2 ± 0.726.9 ± 1.6n.s.
 WGR (%)75.8 ± 9.171.7 ± 8.871.7 ± 6.568.8 ± 4.2n.s.
 SGR (% day−1)2.0 ± 0.21.9 ± 0.21.9 ± 0.11.8 ± 0.1n.s.
 Total feed intake (g fish−1)17.9 ± 1.815.5 ± 2.914.7 ± 0.915.3 ± 2.2n.s.
 FCR1.4 ± 0.21.3 ± 0.31.3 ± 0.21.4 ± 0.2n.s.
 PER1.1 ± 0.11.1 ± 0.11.1 ± 0.21.2 ± 0.1n.s.
 CY (%)86.3 ± 3.890.9 ± 8.187.1 ± 1.689.2 ± 2.5n.s.
Somatic indices
 HSI (%)1.9 ± 0.11.8 ± 0.32.0 ± 0.41.6 ± 0.3n.s.
 VI (%)13.7 ± 3.89.1 ± 8.112.9 ± 1.610.8 ± 2.5n.s.
 K (%)1.8 ± 0.11.9 ± 0.21.8 ± 0.11.9 ± 0.1n.s.
Values are expressed as mean ± SD (n = 3). Codes are: MB-5: 5% microalgae blend meal inclusion; MB-15: 15% microalgae blend meal inclusion; MB-25: 25% microalgae blend meal inclusion. n.s.: not significant.
Table 4. Carcass composition (% in dry weight basis) of juvenile S. aurata specimens fed experimental diets for 30 days.
ParametersControlMB-5MB-15MB-25p
Protein60.4 ± 0.759.3 ± 0.459.9 ± 0.659.0 ± 1.6n.s.
Lipid19.0 ± 0.4 a19.8 ± 1.6 a12.5 ± 1.4 c15.4 ± 1.7 b, c0.023
Ash15.3 ± 0.215.4 ± 0.715.6 ± 0.415.1 ± 0.7n.s.
Values are expressed as mean ± SD (n = 6). Values in the same row with different lowercase letters indicate significant differences (p < 0.05). Codes are: MB-5: 5% microalgae blend meal inclusion; MB-15: 15% microalgae blend meal inclusion; MB-25: 25% microalgae blend meal inclusion. n.s.: not significant.
Table 5. Liver fatty acid composition (% fatty acids) of juvenile S. aurata fed experimental diets for 30 days.
Fatty AcidsControlMB-5MB-15MB-25p
Myristic acid (C14:0)3.65 ± 0.113.58 ± 0.143.39 ± 0.213.08 ± 0.24n.s.
Palmitic acid (C16:0)19.04 ± 0.2419.11 ± 0.2919.23 ± 0.9220.94 ± 0.78n.s.
Stearic acid (C18:0)16.63 ± 0.23 a16.03 ± 0.29 a12.83 ± 0.35 b10.81 ± 0.69 c0.016
Oleic acid (C18:1n9)19.87 ± 0.46 b18.91 ± 0.31 c22.03 ± 1.23 a22.54 ± 1.41 a0.032
Linoleic acid (C18:2n6)5.88 ± 0.215.74 ± 0.195.79 ± 0.965.73 ± 0.43n.s.
α-linolenic acid (C18:3n3)1.20 ± 0.03 b1.83 ± 0.09 a0.85 ± 0.12 c0.95 ± 0.10 c0.011
Eicosanoic acid (C20:0)0.91 ± 0.08 a0.95 ± 0.05 a0.41 ± 0.09 b0.39 ± 0.06 b<0.001
Eicosatrienoic acid (C20:3n6)2.36 ± 0.17 a2.21 ± 0.16 a1.68 ± 0.11 b1.59 ± 0.06 b0.024
Arachidonic acid (ARA; C20:4n6)7.45 ± 0.117.67 ± 0.098.14 ± 1.258.15 ± 0.99n.s.
Eicosapentaenoic acid (EPA; C20:5n3)6.43 ± 0.28 b6.35 ± 0.25 b6.53 ± 0.11 b7.04 ± 0.16 a0.036
Behenic acid (C22:0)2.10 ± 0.23 a1.95 ± 0.18 b1.31 ± 0.02 c0.39 ± 0.03 d<0.001
Erucic acid (C22:1n9)0.13 ± 0.060.16 ± 0.080.25 ± 0.090.21 ± 0.03n.s.
Docosahexaenoic acid (DHA; C22:6n3)12.11 ± 0.42 b12.98 ± 0.33 b15.62 ± 0.41 a15.75 ± 0.34 a0.039
Lignoceric acid (C24:0)2.05 ± 0.112.30 ± 0.082.11 ± 0.132.14 ± 0.21n.s.
Nervonic acid (C24:1)0.19 ± 0.07 b0.23 ± 0.06 a0.25 ± 0.05 a0.29 ± 0.04 a0.041
Saturated fatty acid (SFA)44.38 ± 0.34 a43.92 ± 0.38 a39.28 ± 1.03 b37.75 ± 0.93 b0.018
Monounsaturated fatty acid (MUFA)20.19 ± 0.55 b19.30 ± 0.55 b22.53 ± 1.47 a23.04 ± 1.11 a0.009
Polyunsaturated fatty acid (PUFA)35.43 ± 0.65 c36.78 ± 0.65 c38.19 ± 0.35 b39.21 ± 0.28 a0.010
n319.74 ± 0.75 b21.16 ± 0.75 a, b22.58 ± 1.18 a23.74 ± 0.86 a0.016
n615.69 ± 0.4315.62 ± 0.4315.61 ± 1.2315.47 ± 1.13n.s.
n920.00 ± 0.50 b19.07 ± 0.35 c22.28 ± 1.30 a22.75 ± 1.41 a0.034
n3/n61.25 ± 0.17 c1.35 ± 0.17 b, c1.44 ± 0.03 b1.53 ± 0.03 a0.041
EPA/DHA0.53 ± 0.03 a0.48 ± 0.01 b0.41 ± 0.06 c0.44 ± 0.02 c0.044
Values are expressed as mean ± SD (n = 6). Values in the same row with different lowercase letters indicate significant differences (p < 0.05). Codes are: MB-5: 5% microalgae blend meal inclusion; MB-15: 15% microalgae blend meal inclusion; MB-25: 25% microalgae blend meal inclusion. n.s.: not significant.
Table 6. Muscle fatty acid composition (% fatty acids) of juvenile S. aurata fed experimental diets for 30 days.
Fatty AcidsControlMB-5MB-15MB-25p
Myristic acid (C14:0)4.50 ± 0.06 a4.11 ± 0.17 b1.98 ± 0.17 c1.90 ± 0.14 c<0.001
Palmitic acid (C16:0)16.83 ± 0.40 a16.62 ± 0.26 a16.41 ± 0.39 a15.39 ± 0.31 b0.035
Stearic acid (C18:0)4.43 ± 0.19 c4.63 ± 0.25 c6.42 ± 0.10 a5.56 ± 0.16 b0.008
Oleic acid (C18:1n9)19.83 ± 0.14 c19.69 ± 0.17 c22.58 ± 0.19 b23.45 ± 0.18 a0.034
Linoleic acid (C18:2n6)4.92 ± 0.09 b5.30 ± 0.09 a3.09 ± 0.22 c3.00 ± 0.22 c0.016
α-linolenic acid (C18:3n3)1.36 ± 0.09 a1.37 ± 0.05 a0.99 ± 0.13 b0.96 ± 0.12 b0.021
Eicosanoic acid (C20:0)1.28 ± 0.07 b1.43 ± 0.08 a0.48 ± 0.06 c0.46 ± 0.04 c0.017
Gondoic acid (C20:1n9)3.86 ± 0.66 a4.48 ± 0.72 a0.82 ± 0.19 b0.88 ± 0.19 b<0.001
Eicosatrienoic acid (C20:3n6)0.48 ± 0.06 b0.36 ± 0.06 c0.61 ± 0.04 a0.57 ± 0.05 a, b0.031
Arachidonic acid (ARA; C20:4n6)8.63 ± 0.11 b8.29 ± 0.12 c11.95 ± 0.79 a11.82 ± 0.82 a0.005
Eicosapentaenoic acid (EPA; C20:5n3)7.68 ± 0.227.29 ± 0.167.01 ± 0.517.56 ± 0.30n.s.
Behenic acid (C22:0)3.98 ± 0.52 a3.54 ± 0.60 a2.24 ± 0.63 b1.60 ± 0.06 c0.004
Erucic acid (C22:1n9)0.24 ± 0.09 b0.28 ± 0.06 b0.63 ± 0.20 a0.40 ± 0.08 a0.031
Docosahexaenoic acid (DHA; C22:6n3)19.19 ± 0.99 b19.08 ± 0.89 b21.57 ± 0.97 a23.01 ± 1.29 a0.028
Lignoceric acid (C24:0)2.23 ± 0.09 b2.25 ± 0.08 b2.86 ± 0.12 a2.96 ± 0.13 a0.045
Nervonic acid (C24:1)0.56 ± 0.32 a, b0.37 ± 0.11 b0.69 ± 0.16 a0.48 ± 0.21 b0.034
Saturated fatty acid (SFA)33.25 ± 1.01 a32.58 ± 0.36 a30.39 ± 0.74 b27.87 ± 0.53 c0.022
Monounsaturated fatty acid (MUFA)24.49 ± 1.1124.82 ± 0.8324.39 ± 1.1125.21 ± 1.05n.s.
Polyunsaturated fatty acid (PUFA)42.26 ± 1.10 b, c41.69 ± 0.97 c44.51 ± 1.62 a, b46.92 ± 1.44 a0.033
n328.23 ± 1.39 b27.74 ± 1.10 b28.86 ± 1.06 b31.53 ± 1.08 a0.039
n614.03 ± 0.25 b13.95 ± 0.08 b15.65 ± 0.71 a15.39 ± 0.74 a0.037
n923.93 ± 1.0224.45 ± 0.9424.03 ± 0.5324.73 ± 0.42n.s.
n3/n62.01 ± 0.211.98 ± 0.141.84 ± 0.162.04 ± 0.08n.s.
EPA/DHA0.40 ± 0.010.38 ± 0.010.32 ± 0.090.32 ± 0.07n.s.
Values are expressed as mean ± SD (n = 6). Values in the same row with different lowercase letters indicate significant differences (p < 0.05). Codes are: MB-5: 5% microalgae blend meal inclusion; MB-15: 15% microalgae blend meal inclusion; MB-25: 25% microalgae blend meal inclusion. n.s.: not significant.
Table 7. Species richness (R), Gini coefficient, and range-weighted richness (Rr) values of intestinal microbiota DGGE patterns of juvenile S. aurata fed experimental diets for 30 days.
DayDietRGini CoefficientRr
0Control13.25 ± 1.26 b0.27 ± 0.01 c10.44 ± 3.15 a, b
7Control13.25 ± 2.63 b0.23 ± 0.08 b7.97 ± 2.65 a
MB-512.66 ± 3.79 b0.21 ± 0.03 b20.16 ± 2.84 c
MB-1511.50 ± 4.04 a, b0.18 ± 0.03 b22.28 ± 10.18 b, c
MB-2523.33 ± 4.04 d0.25 ± 0.09 b136.29 ± 10.74 f
15Control15.50 ± 1.29 b, c0.23 ± 0.05 b24.72 ± 6.01 c
MB-511.25 ± 3.86 a, b0.25 ± 0.02 b, c51.22 ± 4.99 d
MB-157.75 ± 2.22 a0.18 ± 0.05 b14.96 ± 5.88 b, c
MB-2525.00 ± 5.57 d0.25 ± 0.05 b, c292.33 ± 15.03 h
30Control13.00 ± 1.00 b0.23 ± 0.08 b14.56 ± 3.83 b, c
MB-517.75 ± 2.63 c0.27 ± 0.03 c87.79 ± 5.41 e
MB-1527.25 ± 3.59 d0.11 ± 0.04 a161.67 ± 5.10 g
MB-2536.50 ± 6.40 e0.25 ± 0.05 b, c374.00 ± 18.47 i
p <0.001<0.001<0.001
Values are expressed as mean ± SD (n = 4). Values in the same column with different lowercase letters indicate significant differences (p < 0.05). Codes are: MB-5: 5% microalgae blend meal inclusion; MB-15: 15% microalgae blend meal inclusion; MB-25: 25% microalgae blend meal inclusion.
Table 8. 16S rDNA sequence similarities to closest relatives of DNA recovered from the respective predominant bands in the DGGE gel corresponding to juvenile S. aurata fed experimental diets for 30 days.
ControlMB-5MB-15MB-25
Closest RelativeSimilarity
(%)
Genbank
Accession
Number
Taxon0
Days
7
Days
15
Days
30
Days
7
Days
15
Days
30
Days
7
Days
15
Days
30
Days
7
Days
15
Days
30
Days
Agarivorans sp. QM34100GQ426318γ-proteobacteriaXXXXXXXX XXXX
Comamonas aquatica strain 530 100EU841527β-proteobacteria X X
Enterobacteriaceae bacterium99FJ348019γ-Proteobacteria XX X X
Lactobacillus delbrueckii subsp. bulgaricus100FJ915706Firmicutes X XX
Lactococcus sp.98FR873792Firmicutes X XX
Photobacterium sp. 99FJ178093γ-proteobacteria XX X X XX
Pseudoalteromonas sp.98HM475290γ-proteobacteria X X
Pseudoalteromonas sp. DFH4.2498FR873779γ-proteobacteria X
Pseudomonas sp.98GU784935γ-proteobacteria XXXX
Shewanella sp.100AY515438γ-proteobacteria X XXXXXXX
Sphingomonas sp. 98GU300600α-Proteobacteria X
Thalassomonas haliotis99AB369381γ-proteobacteria XX
Uncultured cyanobacterium clone O799FJ178040CyanobacteriaXXXXX X
Uncultured Firmicutes100FM225297Firmicutes X XX XX
Vibrio alginolyticus100DQ005214γ-proteobacteriaX X X X XX
Vibrio alginolyticus99EU155510γ-proteobacteriaXXXXX XX
Vibrio alginolyticus strain UST981101-03199EU833999γ-proteobacteria X
Vibrio communis strain R-4050499GU078675γ-proteobacteria X
Vibrio harveyi strain BK2100HM355956γ-proteobacteriaXX XX X X
Vibrio ichthyoenteri99EF635304γ-proteobacteria X
Vibrio pathogenic sp. 99AB274764γ-proteobacteria X
Vibrio ordalii97AF493811γ-proteobacteria XX
Vibrio parahaemolyticus97EU660313γ-proteobacteria X XX
Vibrio sp.100GU434168γ-proteobacteriaX X XX X
Vibrio vulnificus100AY245180γ-proteobacteria X
Codes are: MB-5: 5% microalgae blend meal inclusion; MB-15: 15% microalgae blend meal inclusion; MB-25: 25% microalgae blend meal inclusion.
Disclaimer/Publisher’s Note: The statements, opinions and data contained in all publications are solely those of the individual author(s) and contributor(s) and not of MDPI and/or the editor(s). MDPI and/or the editor(s) disclaim responsibility for any injury to people or property resulting from any ideas, methods, instructions or products referred to in the content.

