
A Synthetic Formula Amino Acid Diet Leads to Microbiome Dysbiosis, Reduced Colon Length, Inflammation, and Altered Locomotor Activity in C57BL/6J Mice
 , , ,
, , , 
Abstract
:1. Introduction
2. Methods and Materials
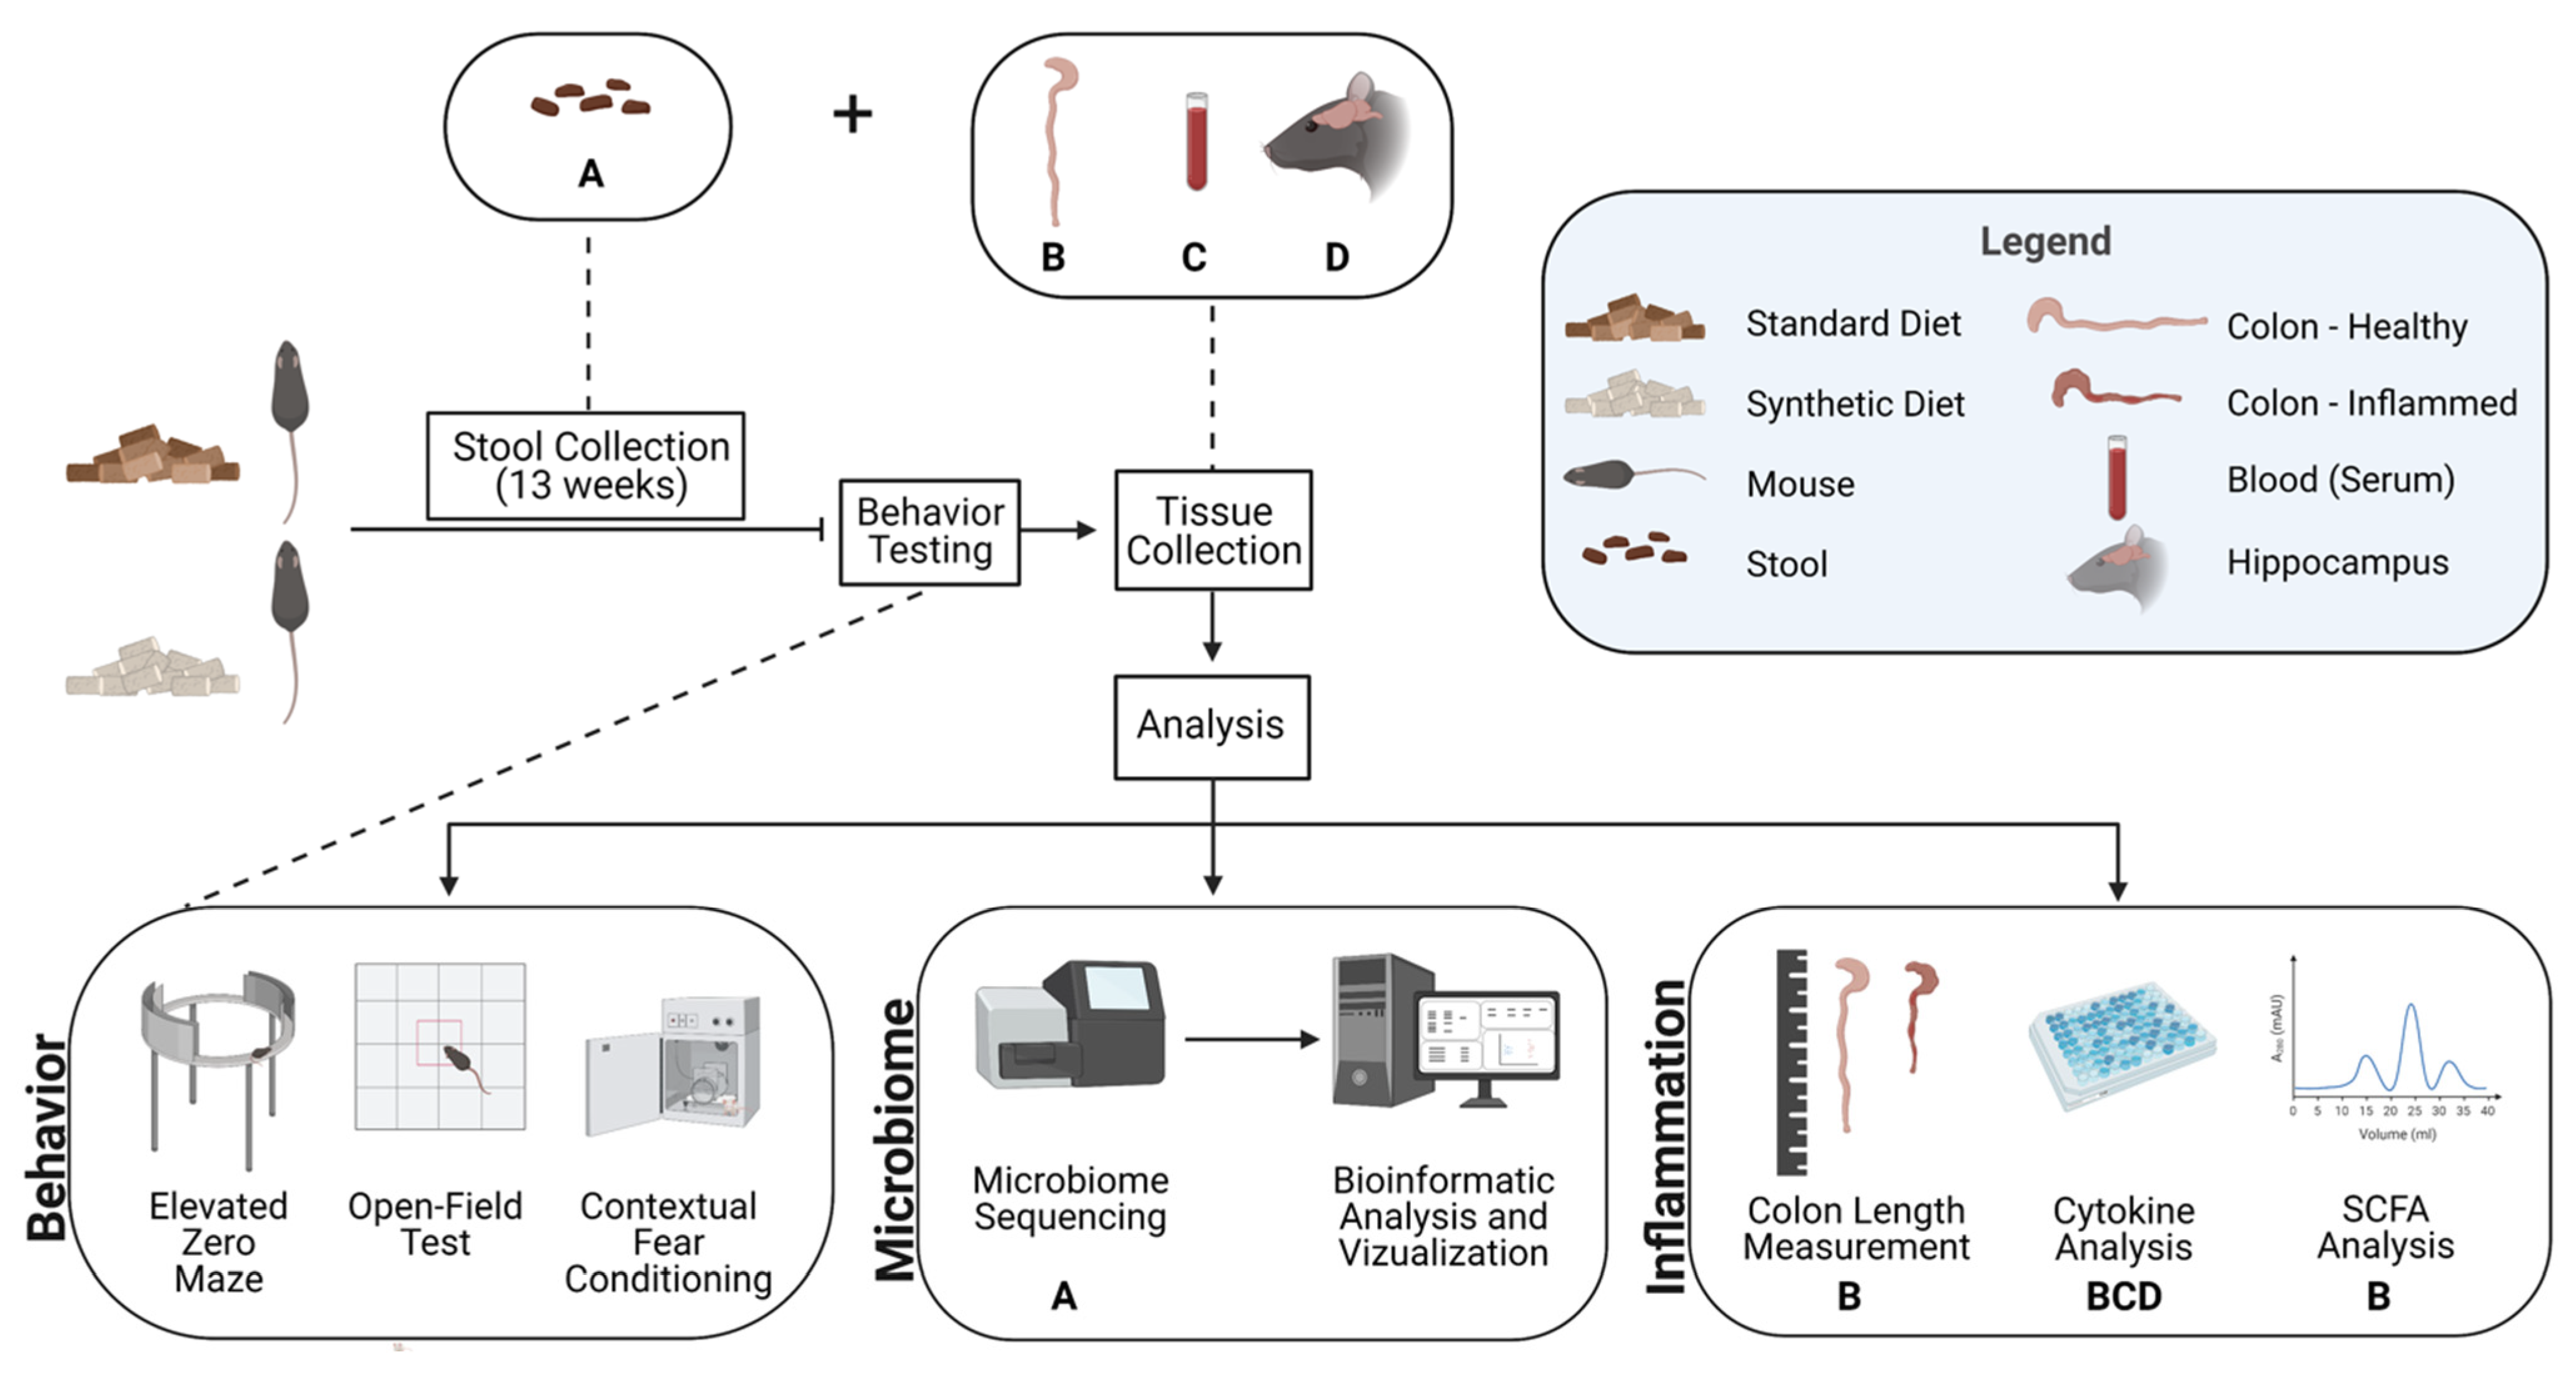
2.1. Experimental Design
2.2. Microbiome Sample Collection
2.3. DNA Extraction and 16S rRNA Gene Amplification
2.4. Library Preparation and Sequencing
2.5. Controlling for Contamination
2.6. Data Processing
2.7. Microbiome Analysis
2.8. Tissue Collection
2.9. Short Chain Fatty Acid Analysis
2.10. Cytokine Analysis
2.11. Open Field
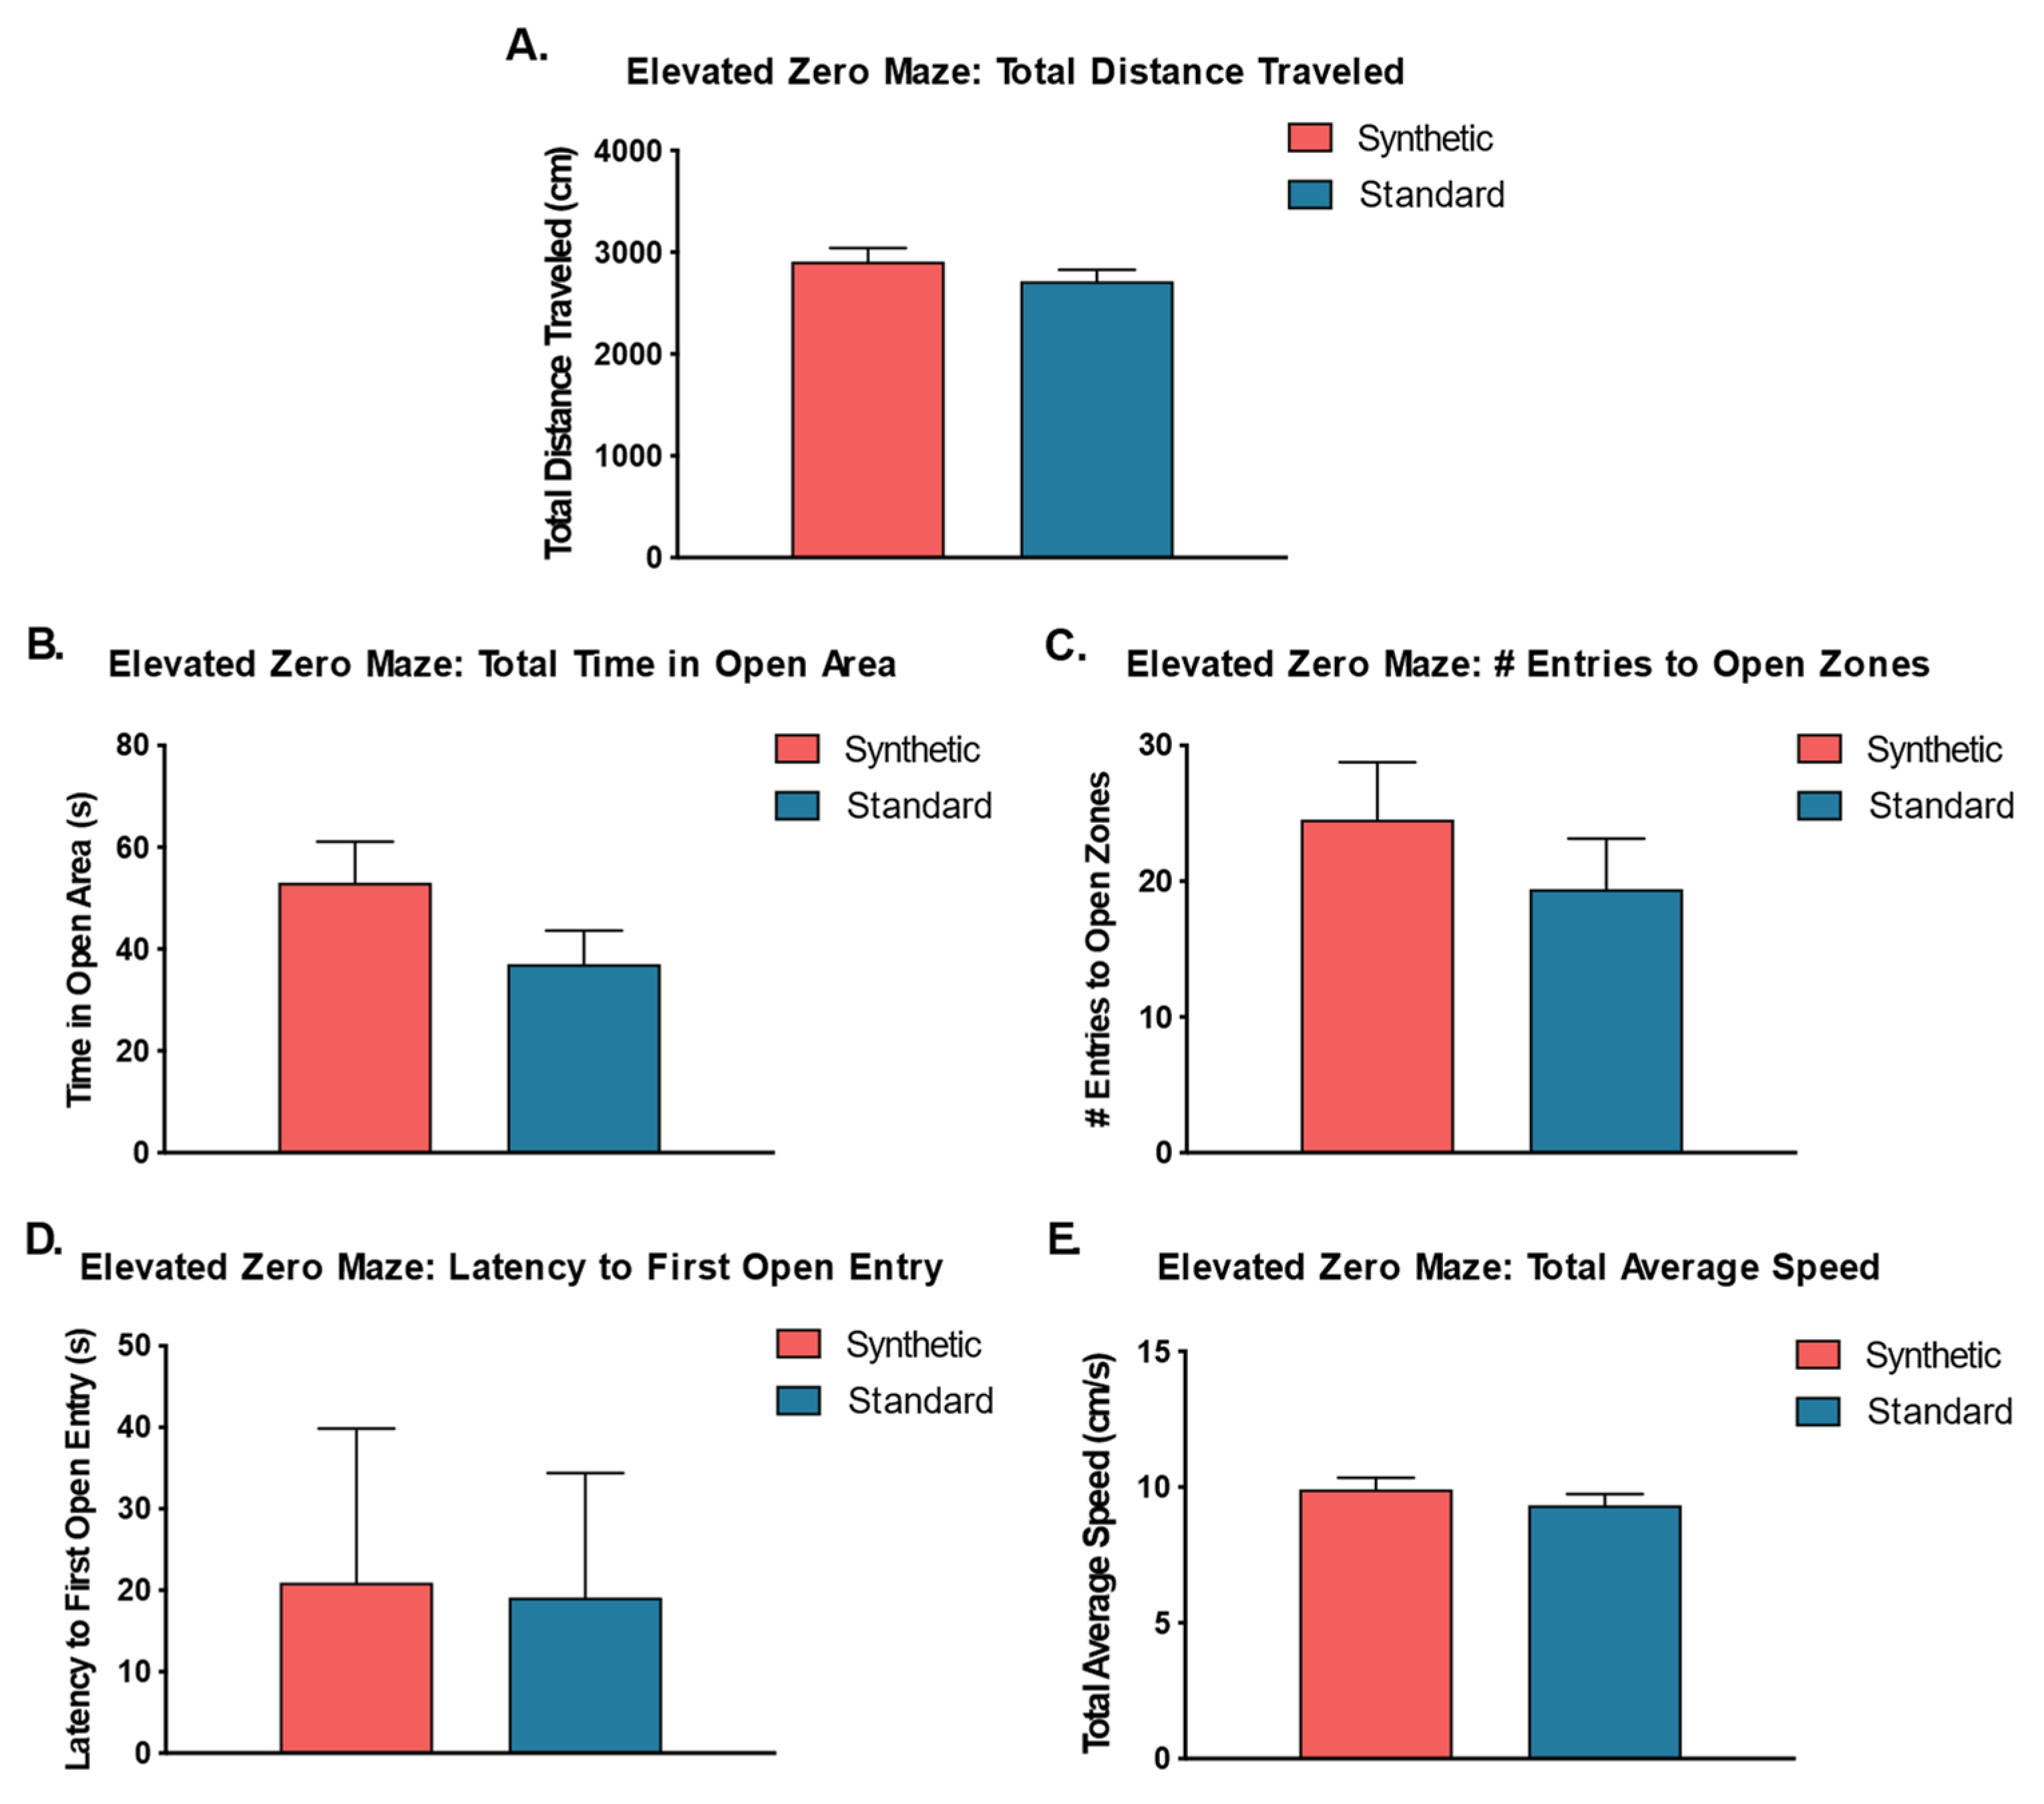
2.12. Elevated Zero
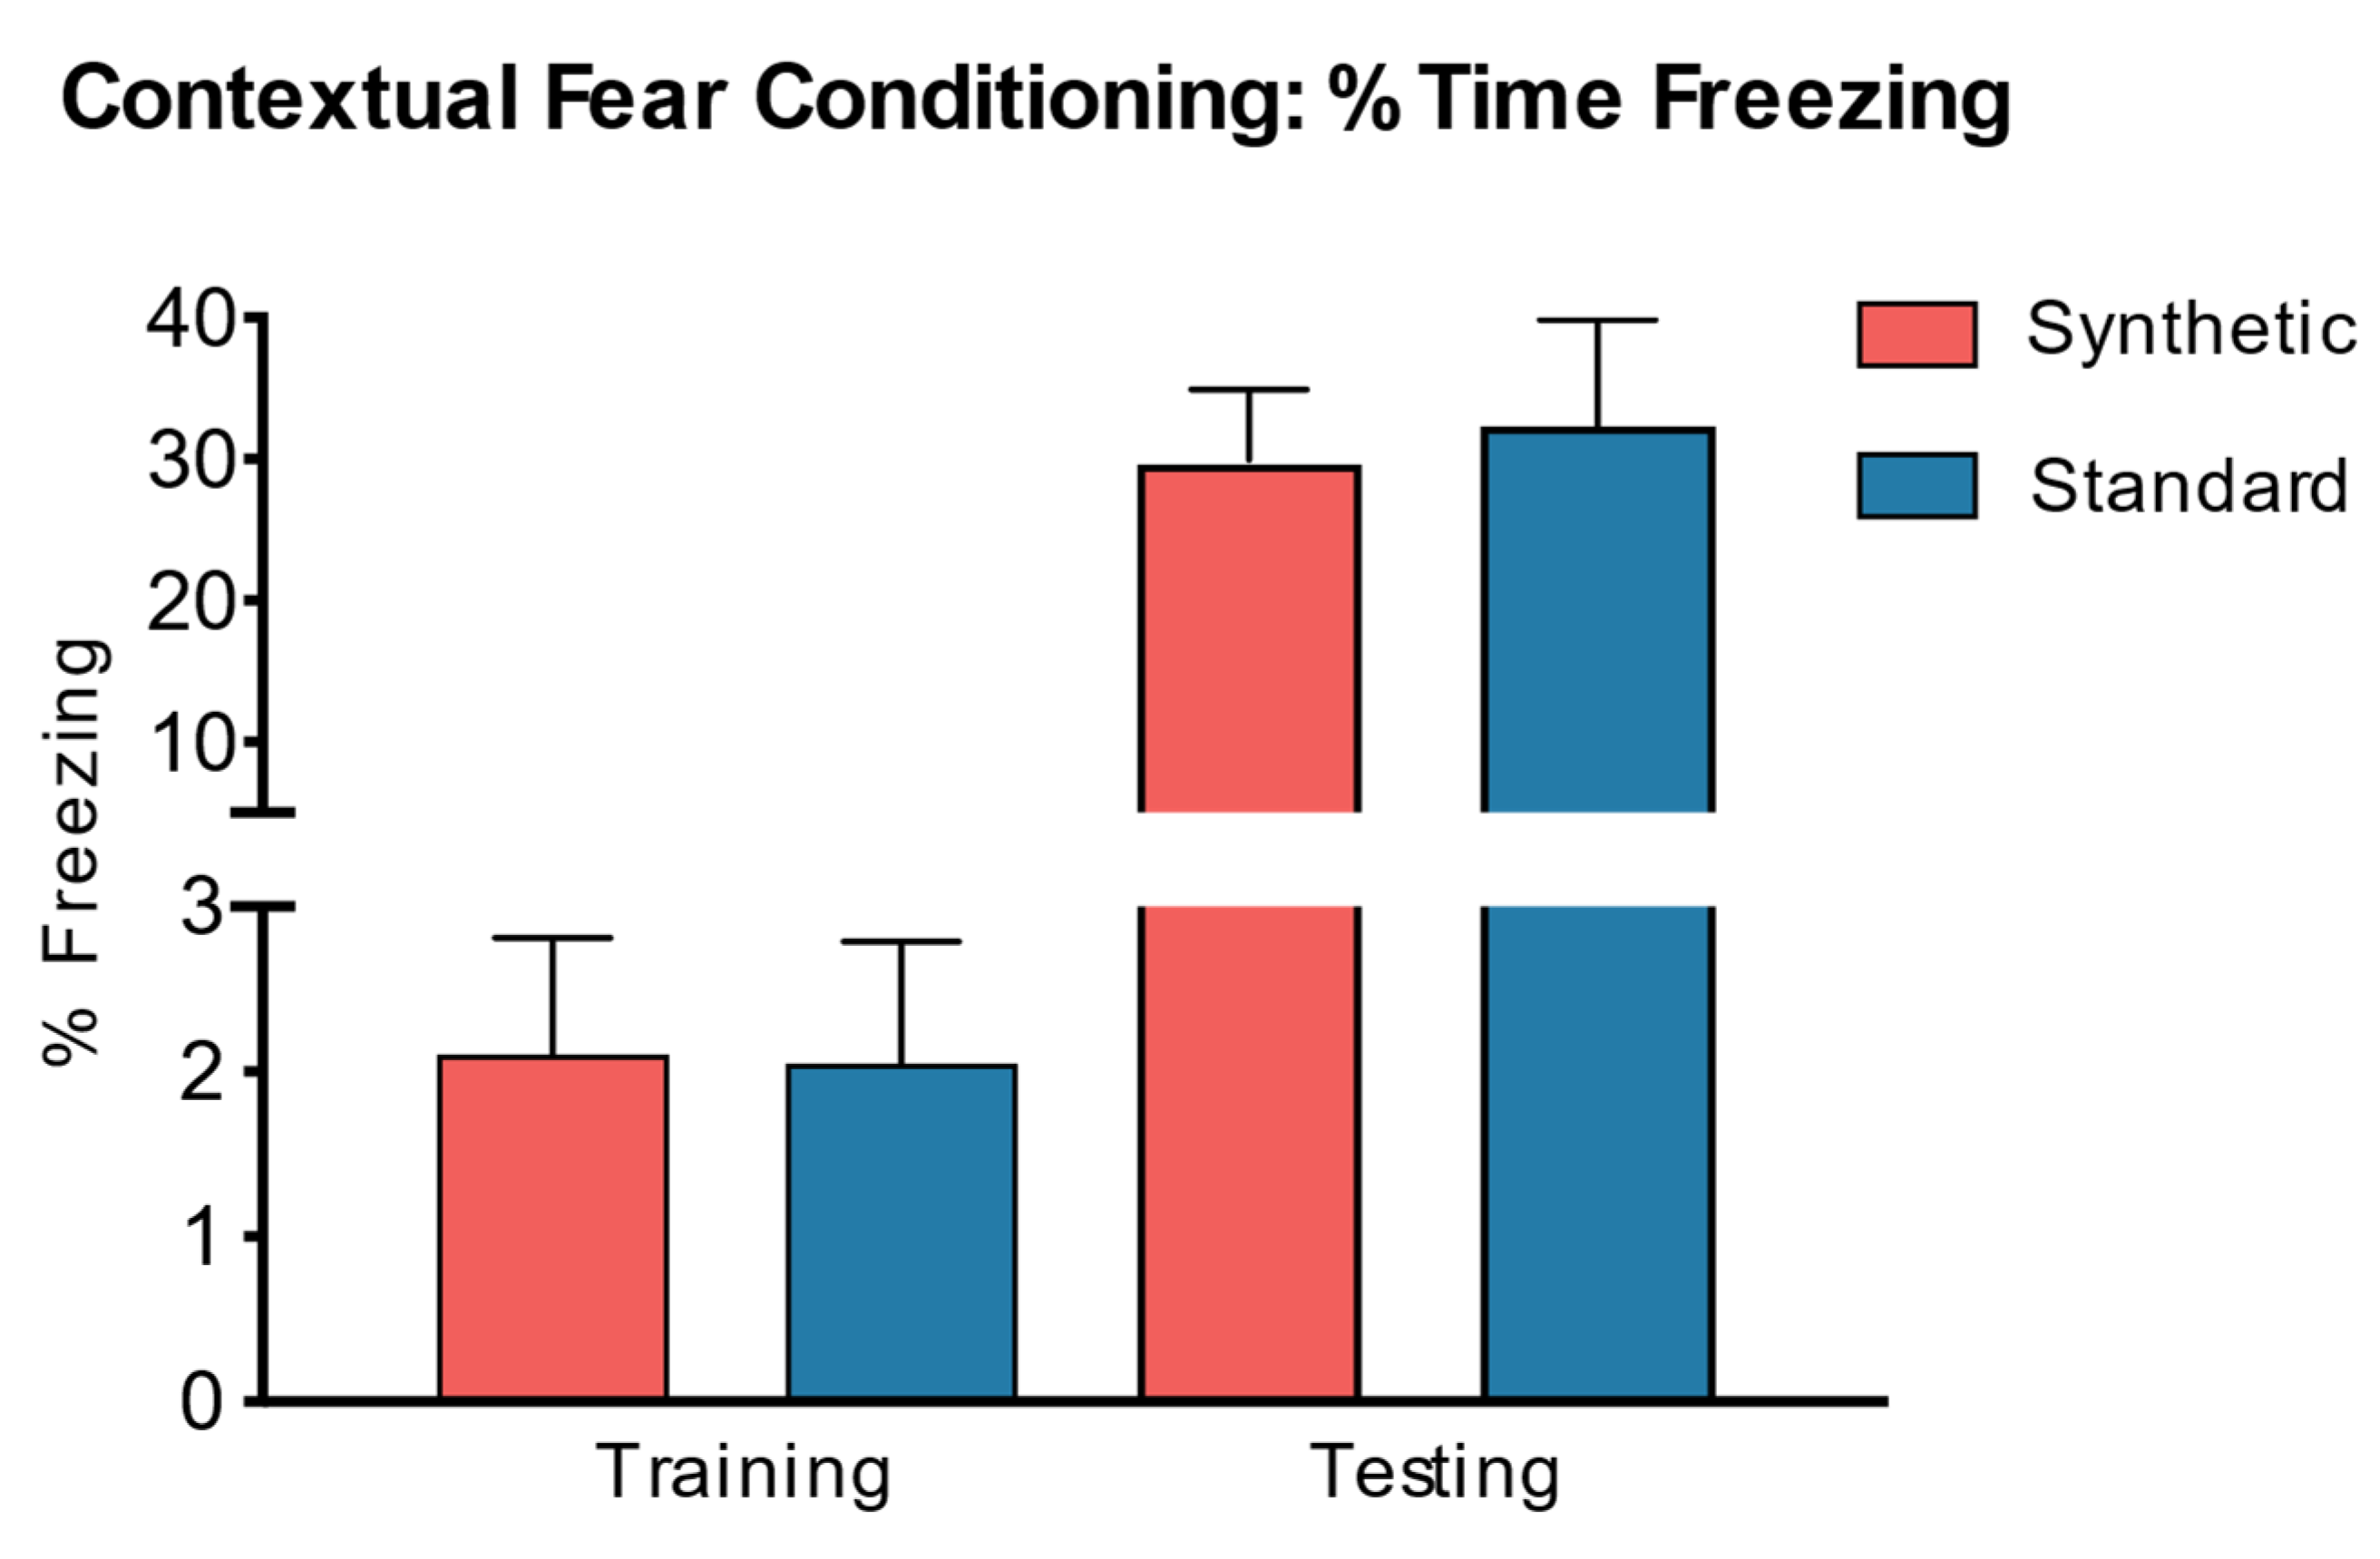
2.13. Contextual Fear Conditioning
3. Results
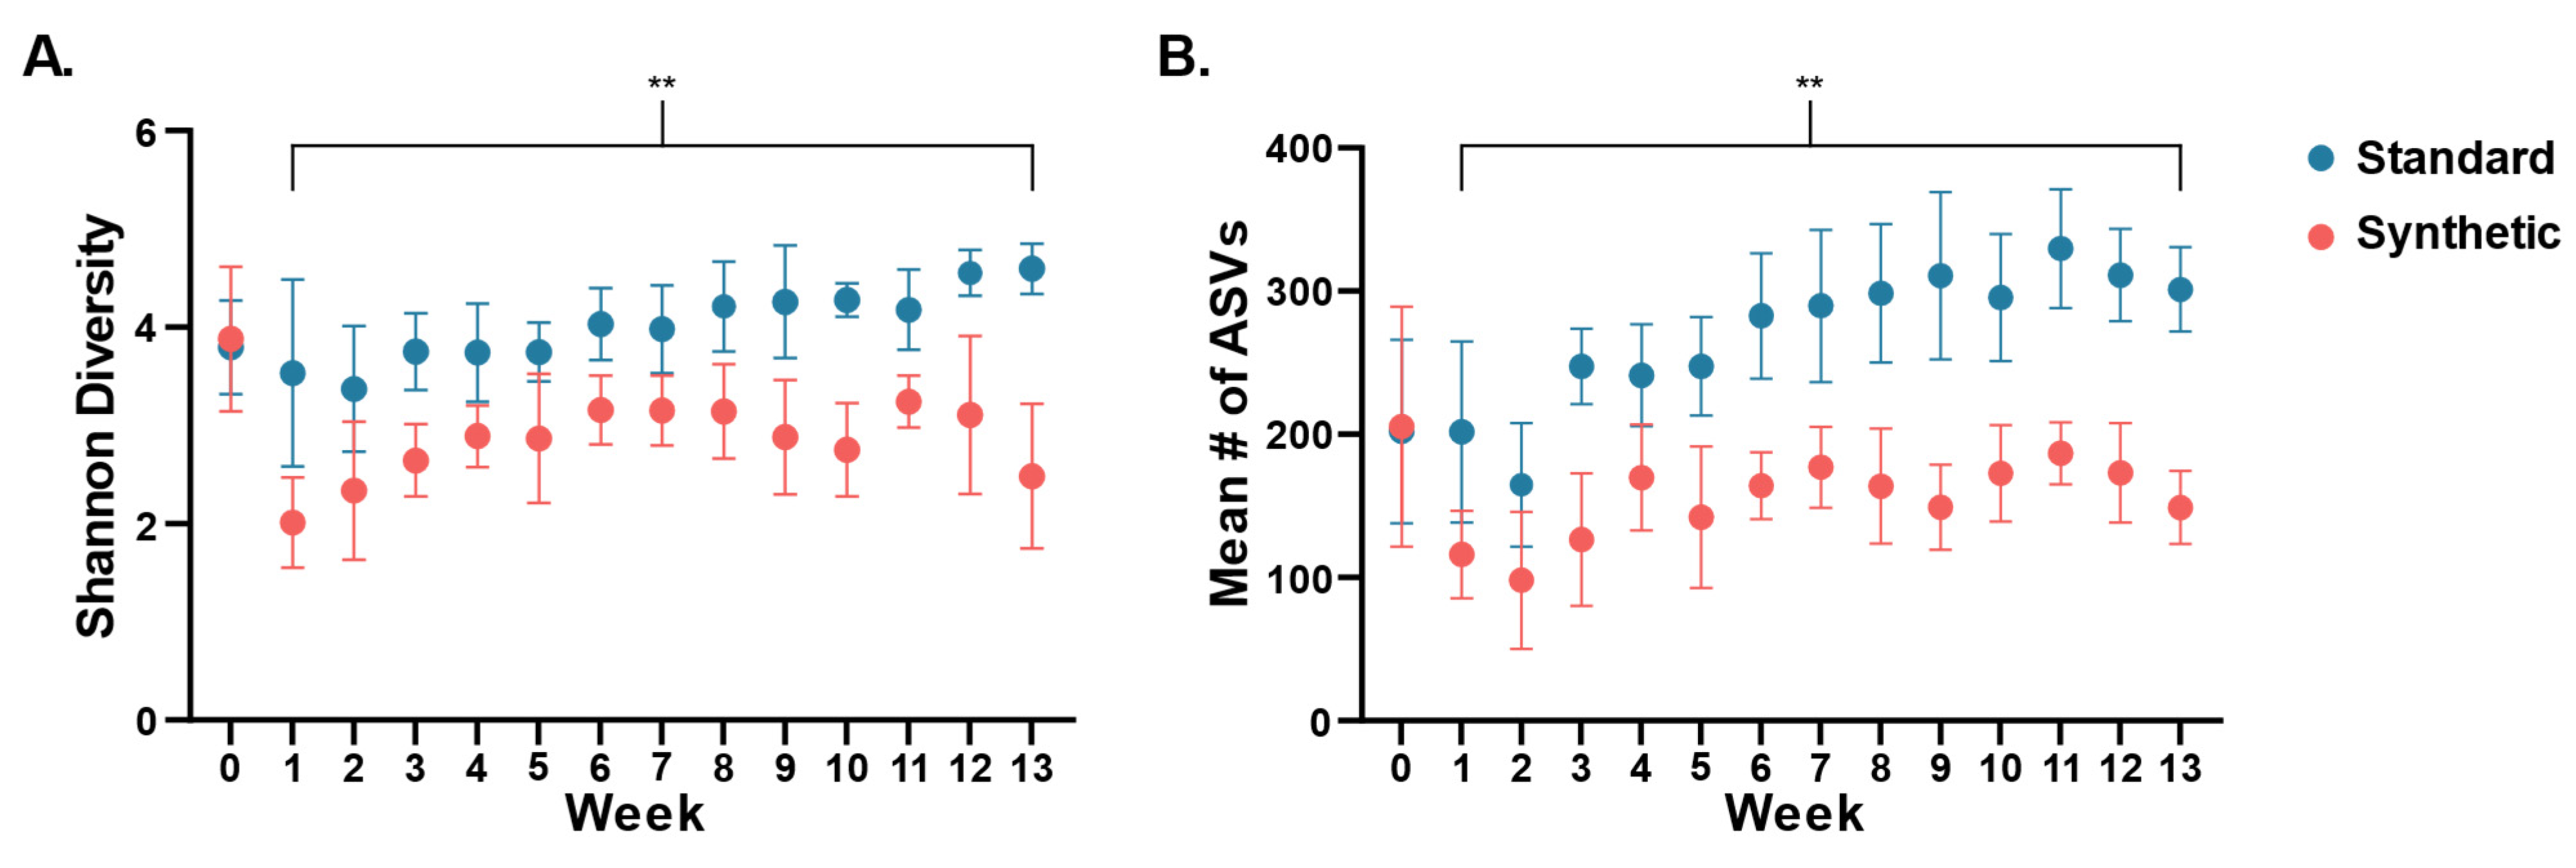
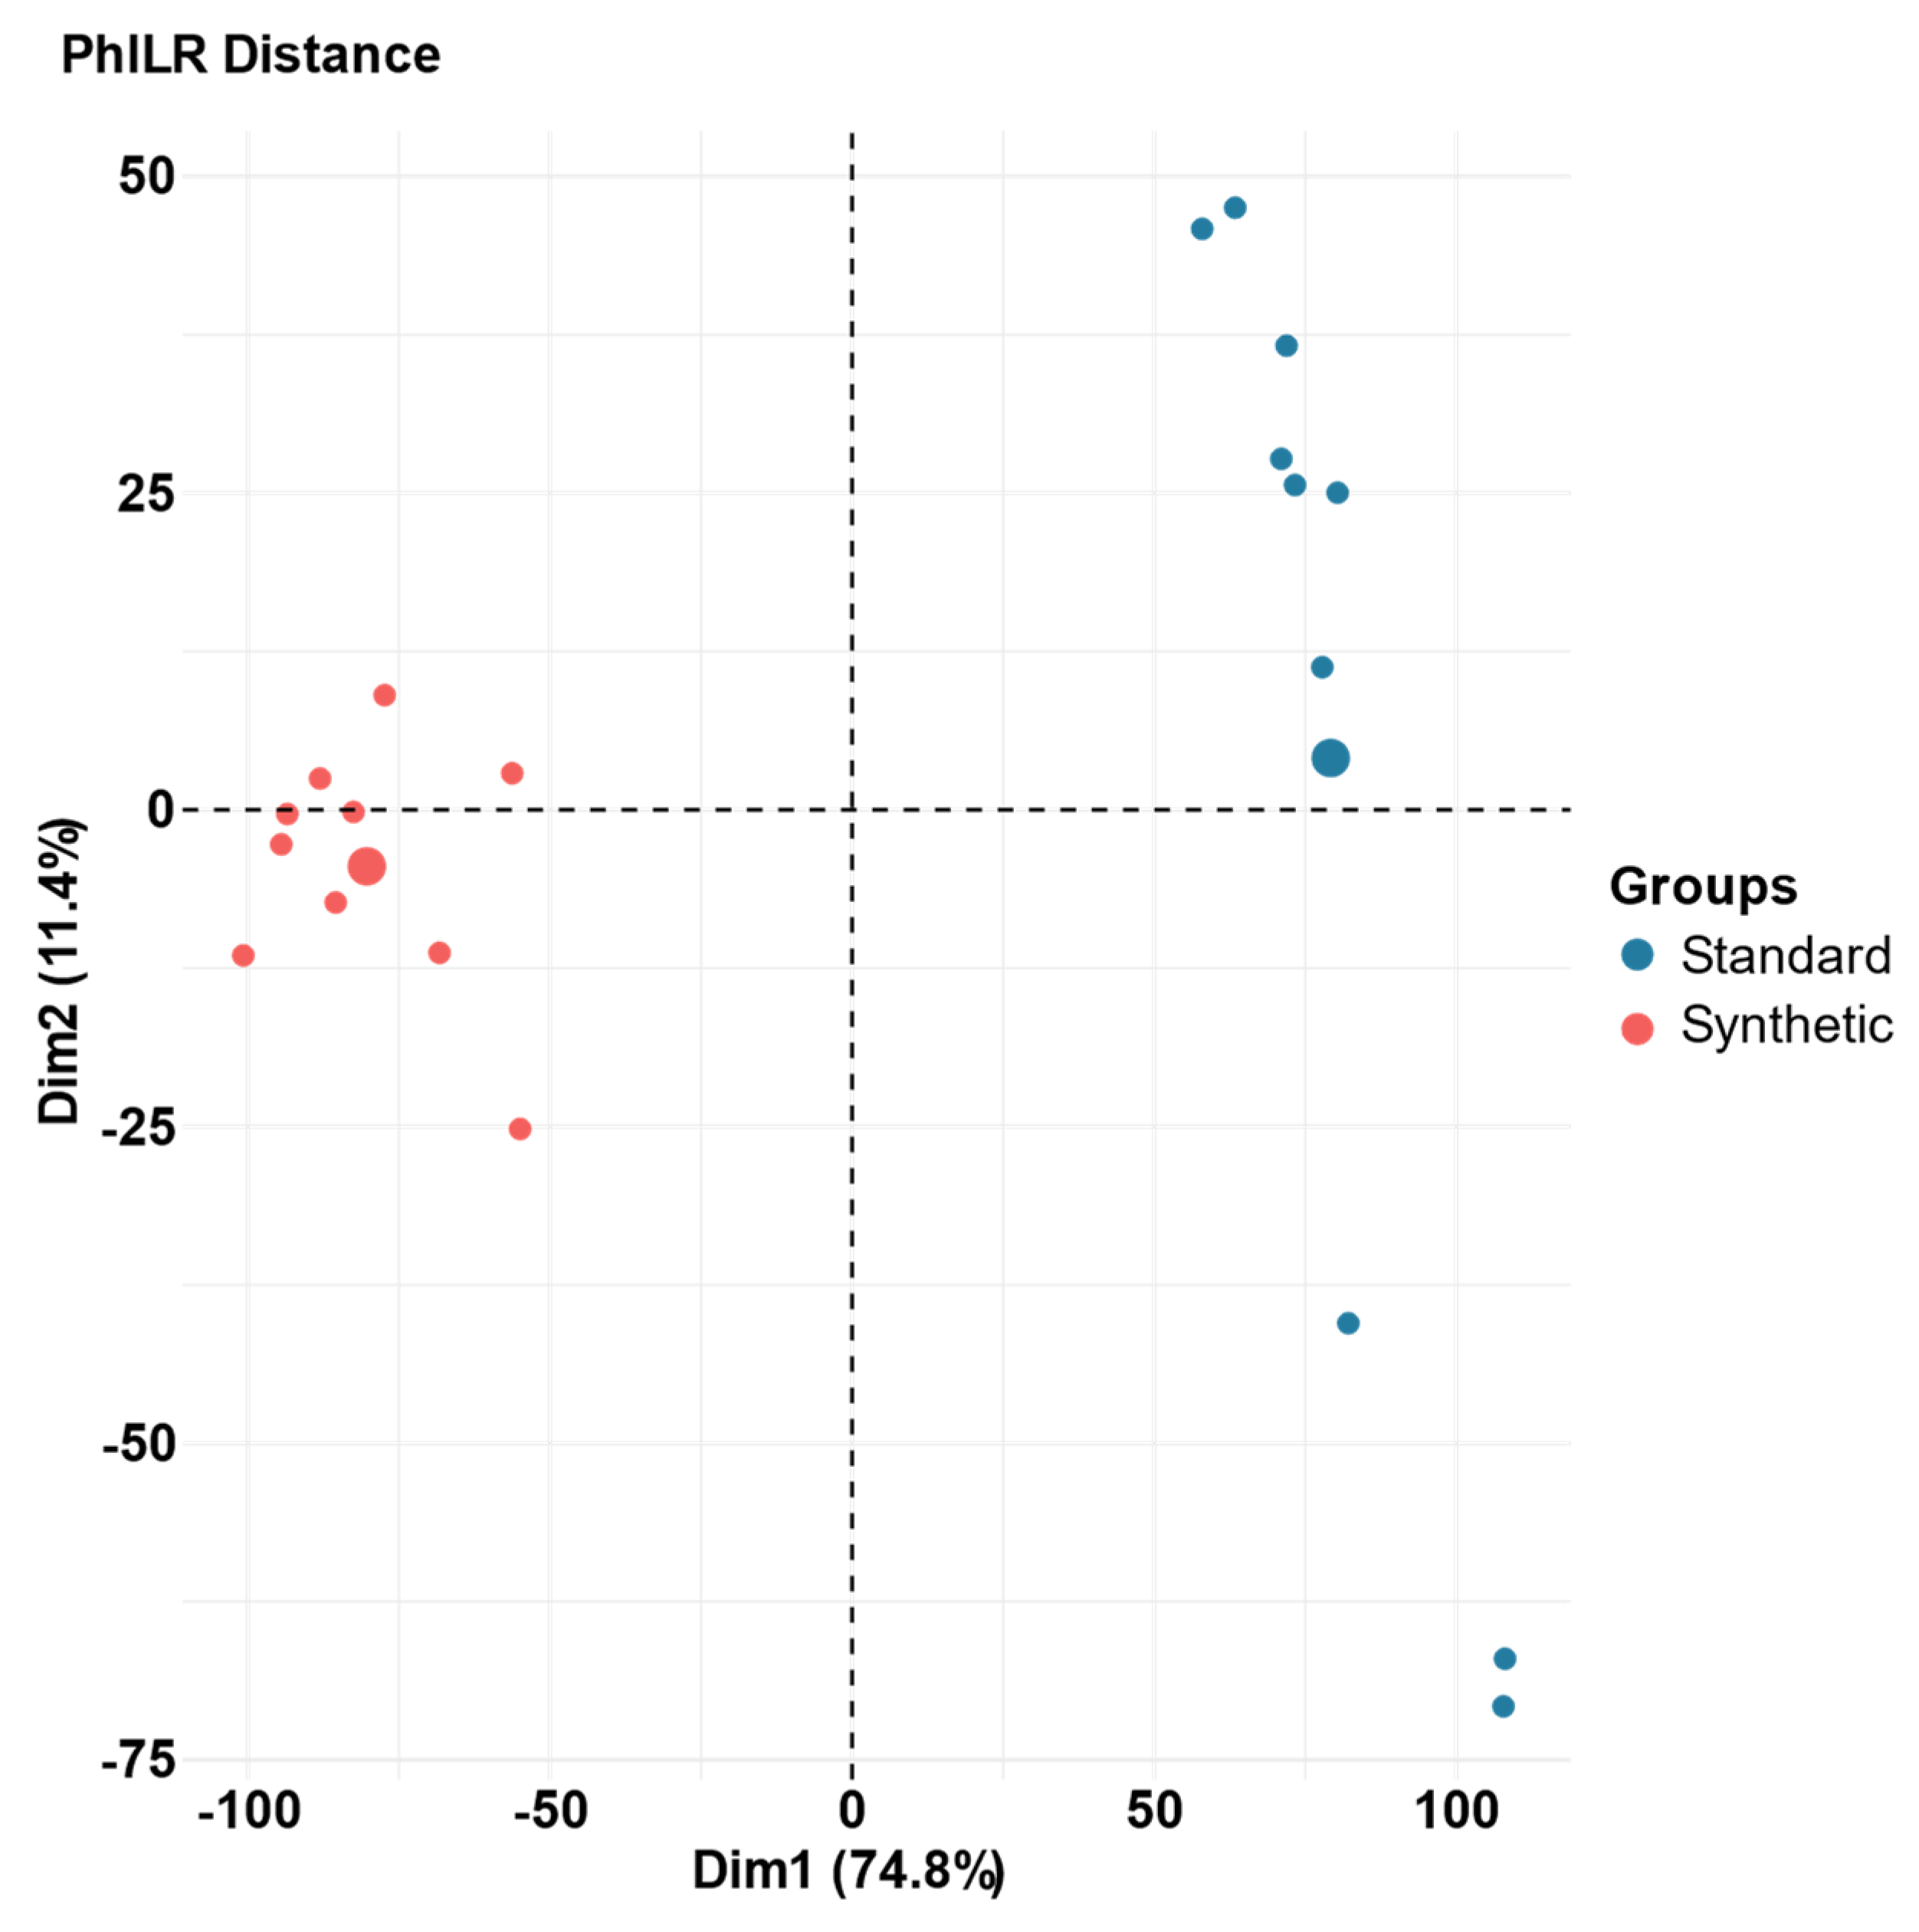
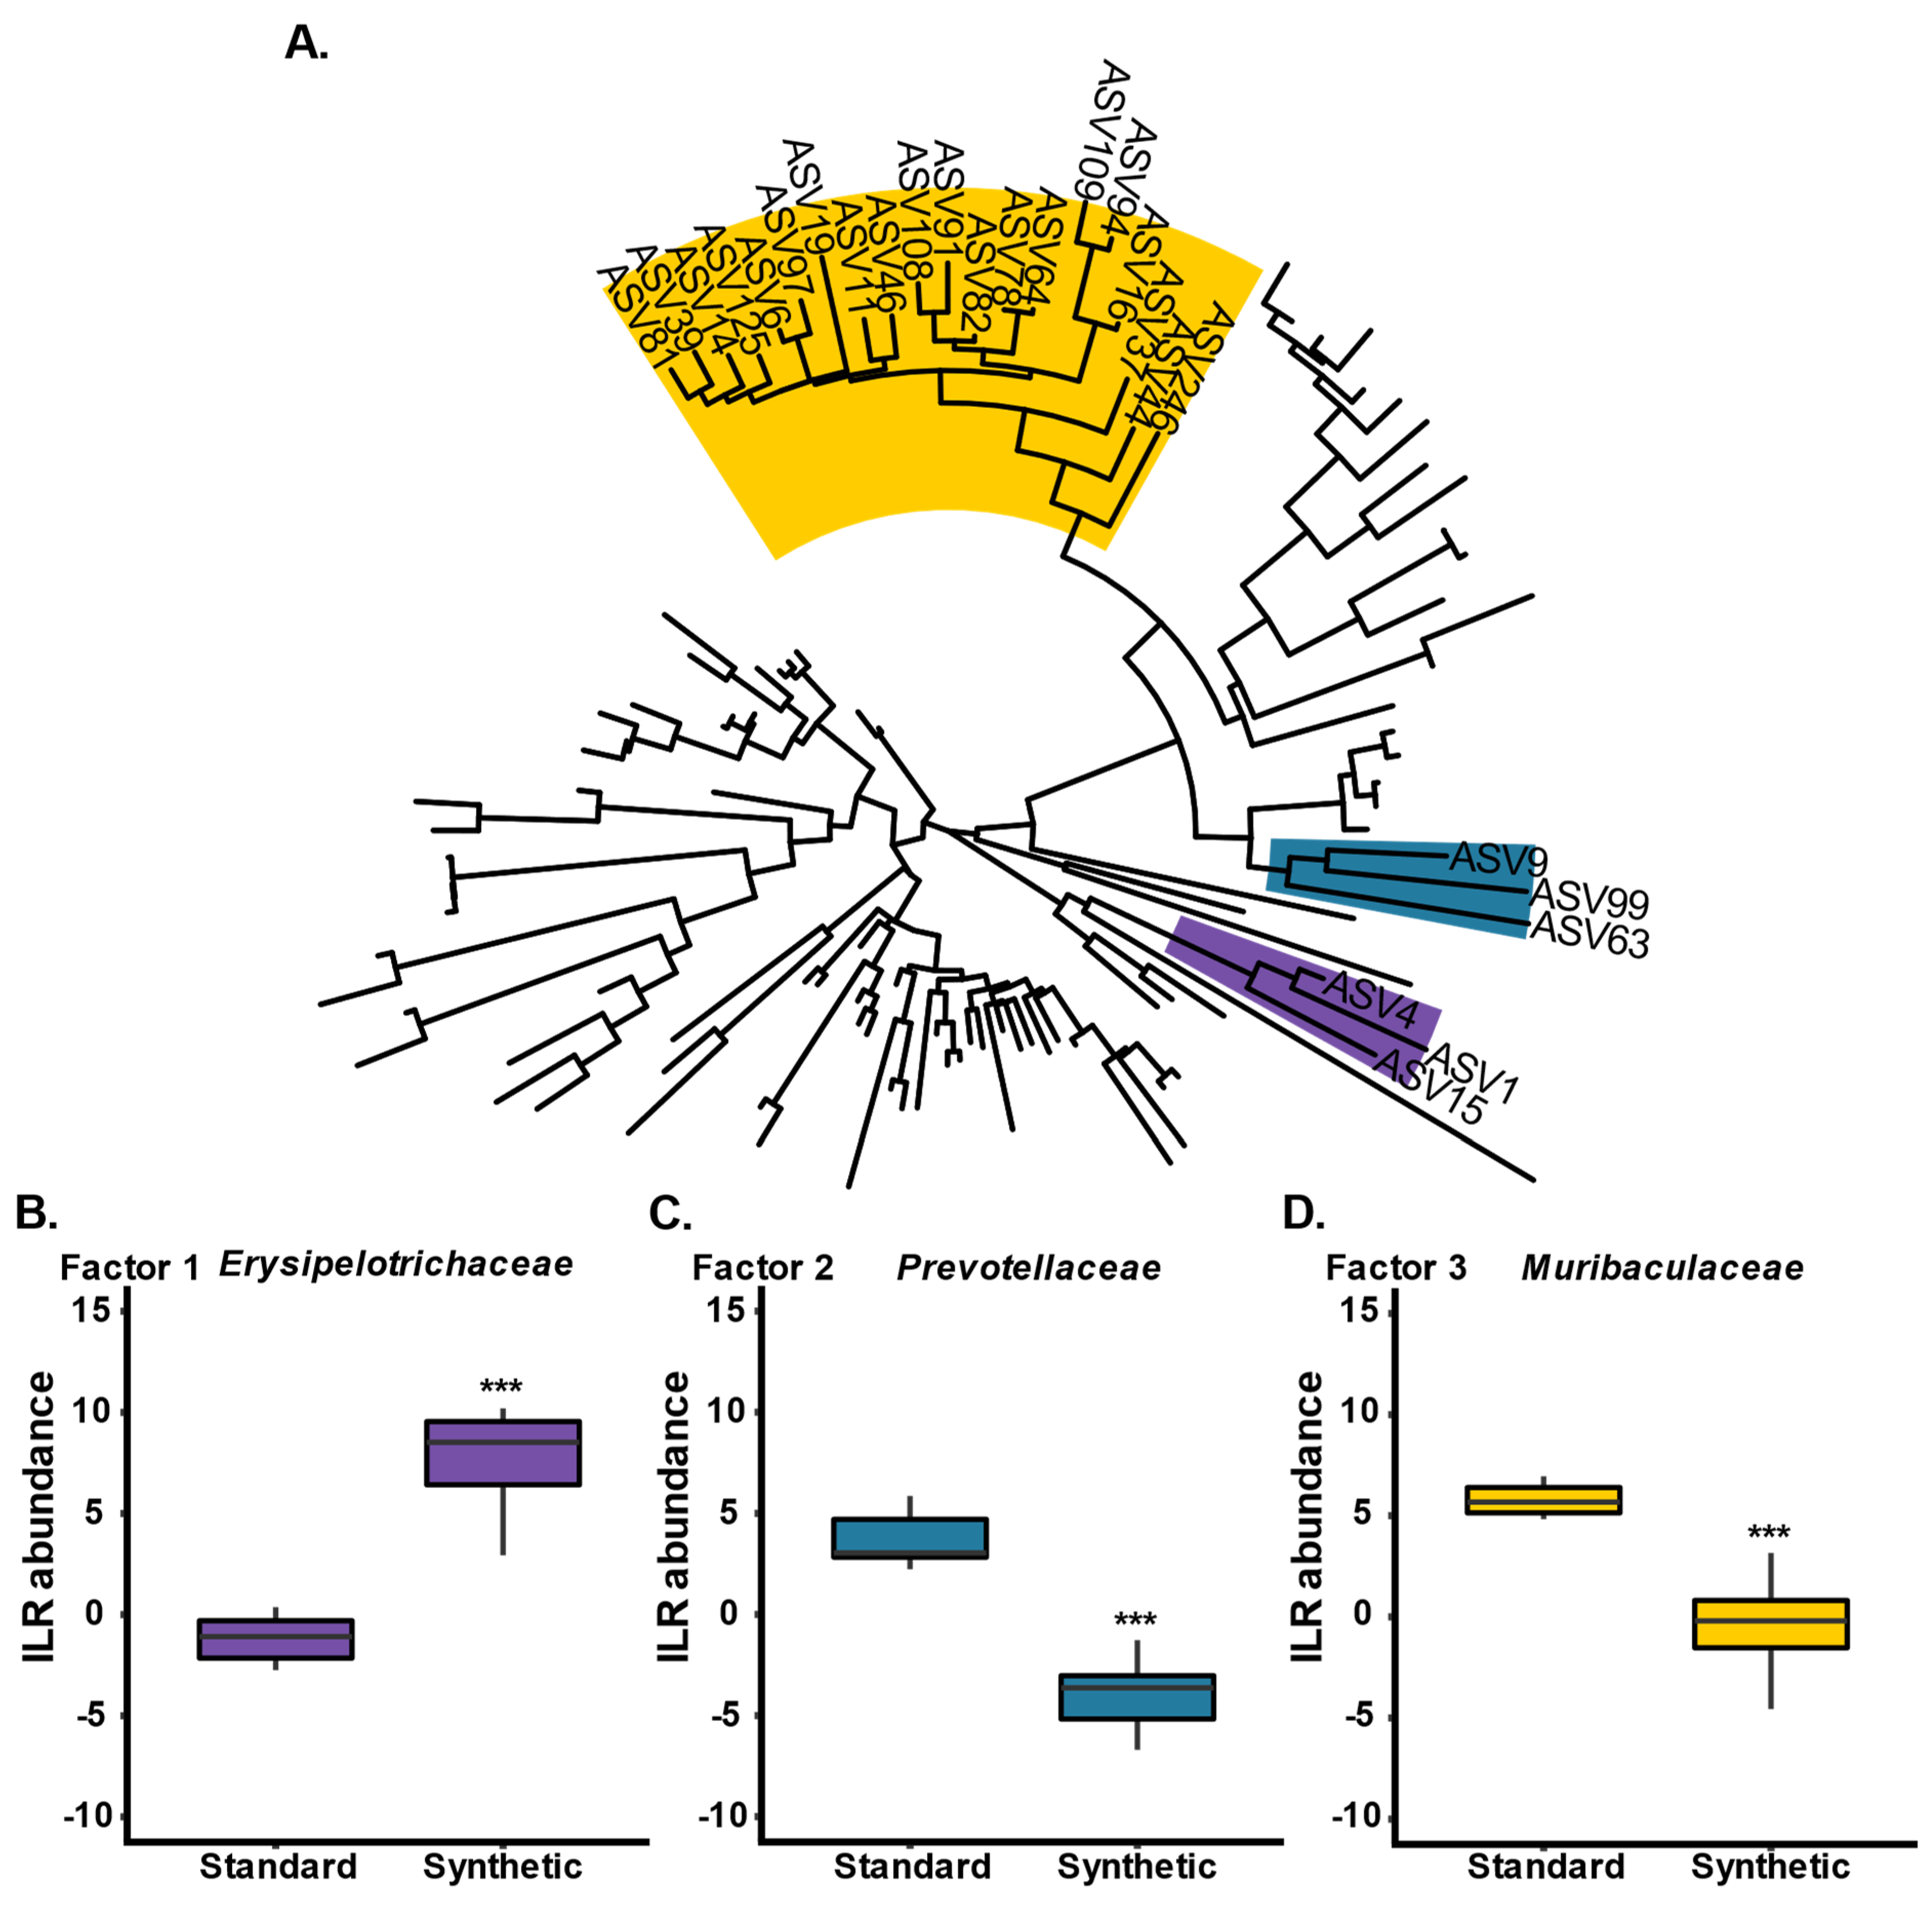
3.1. Gut Microbiome Diversity Decreased with Consumption of the Synthetic Diet
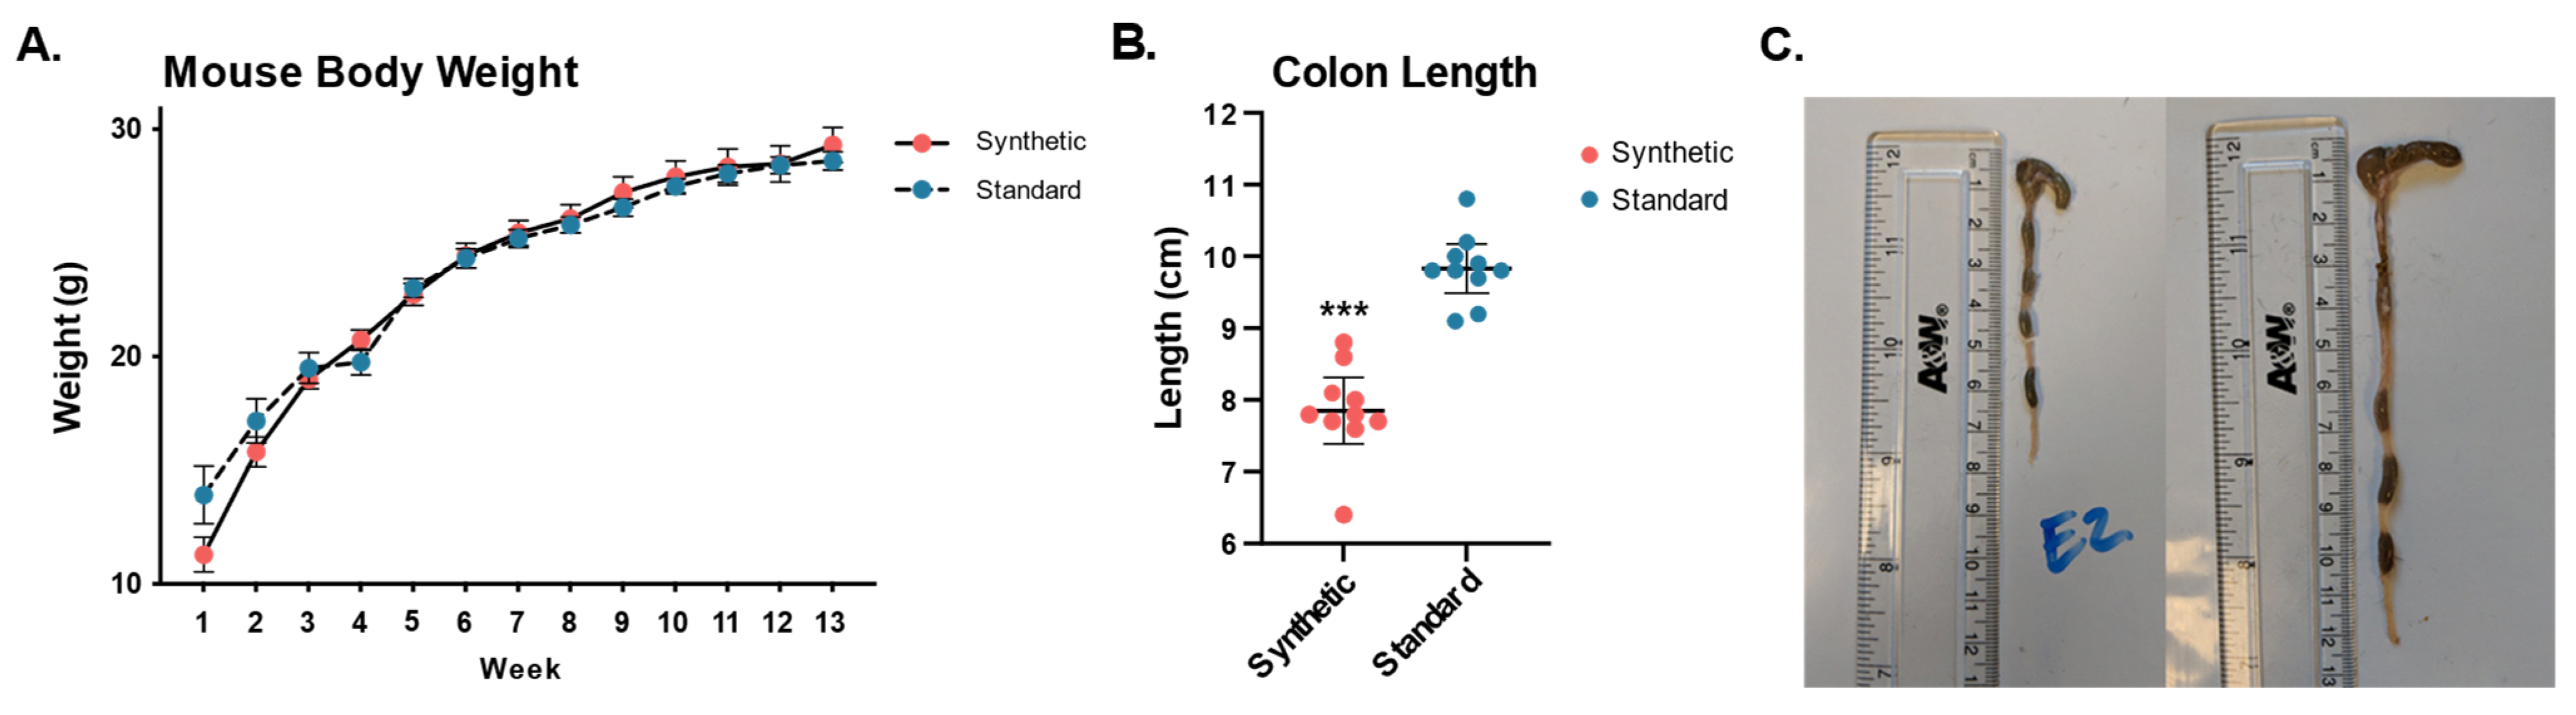
3.2. Shortened Colon Length in Synthetic Diet Group
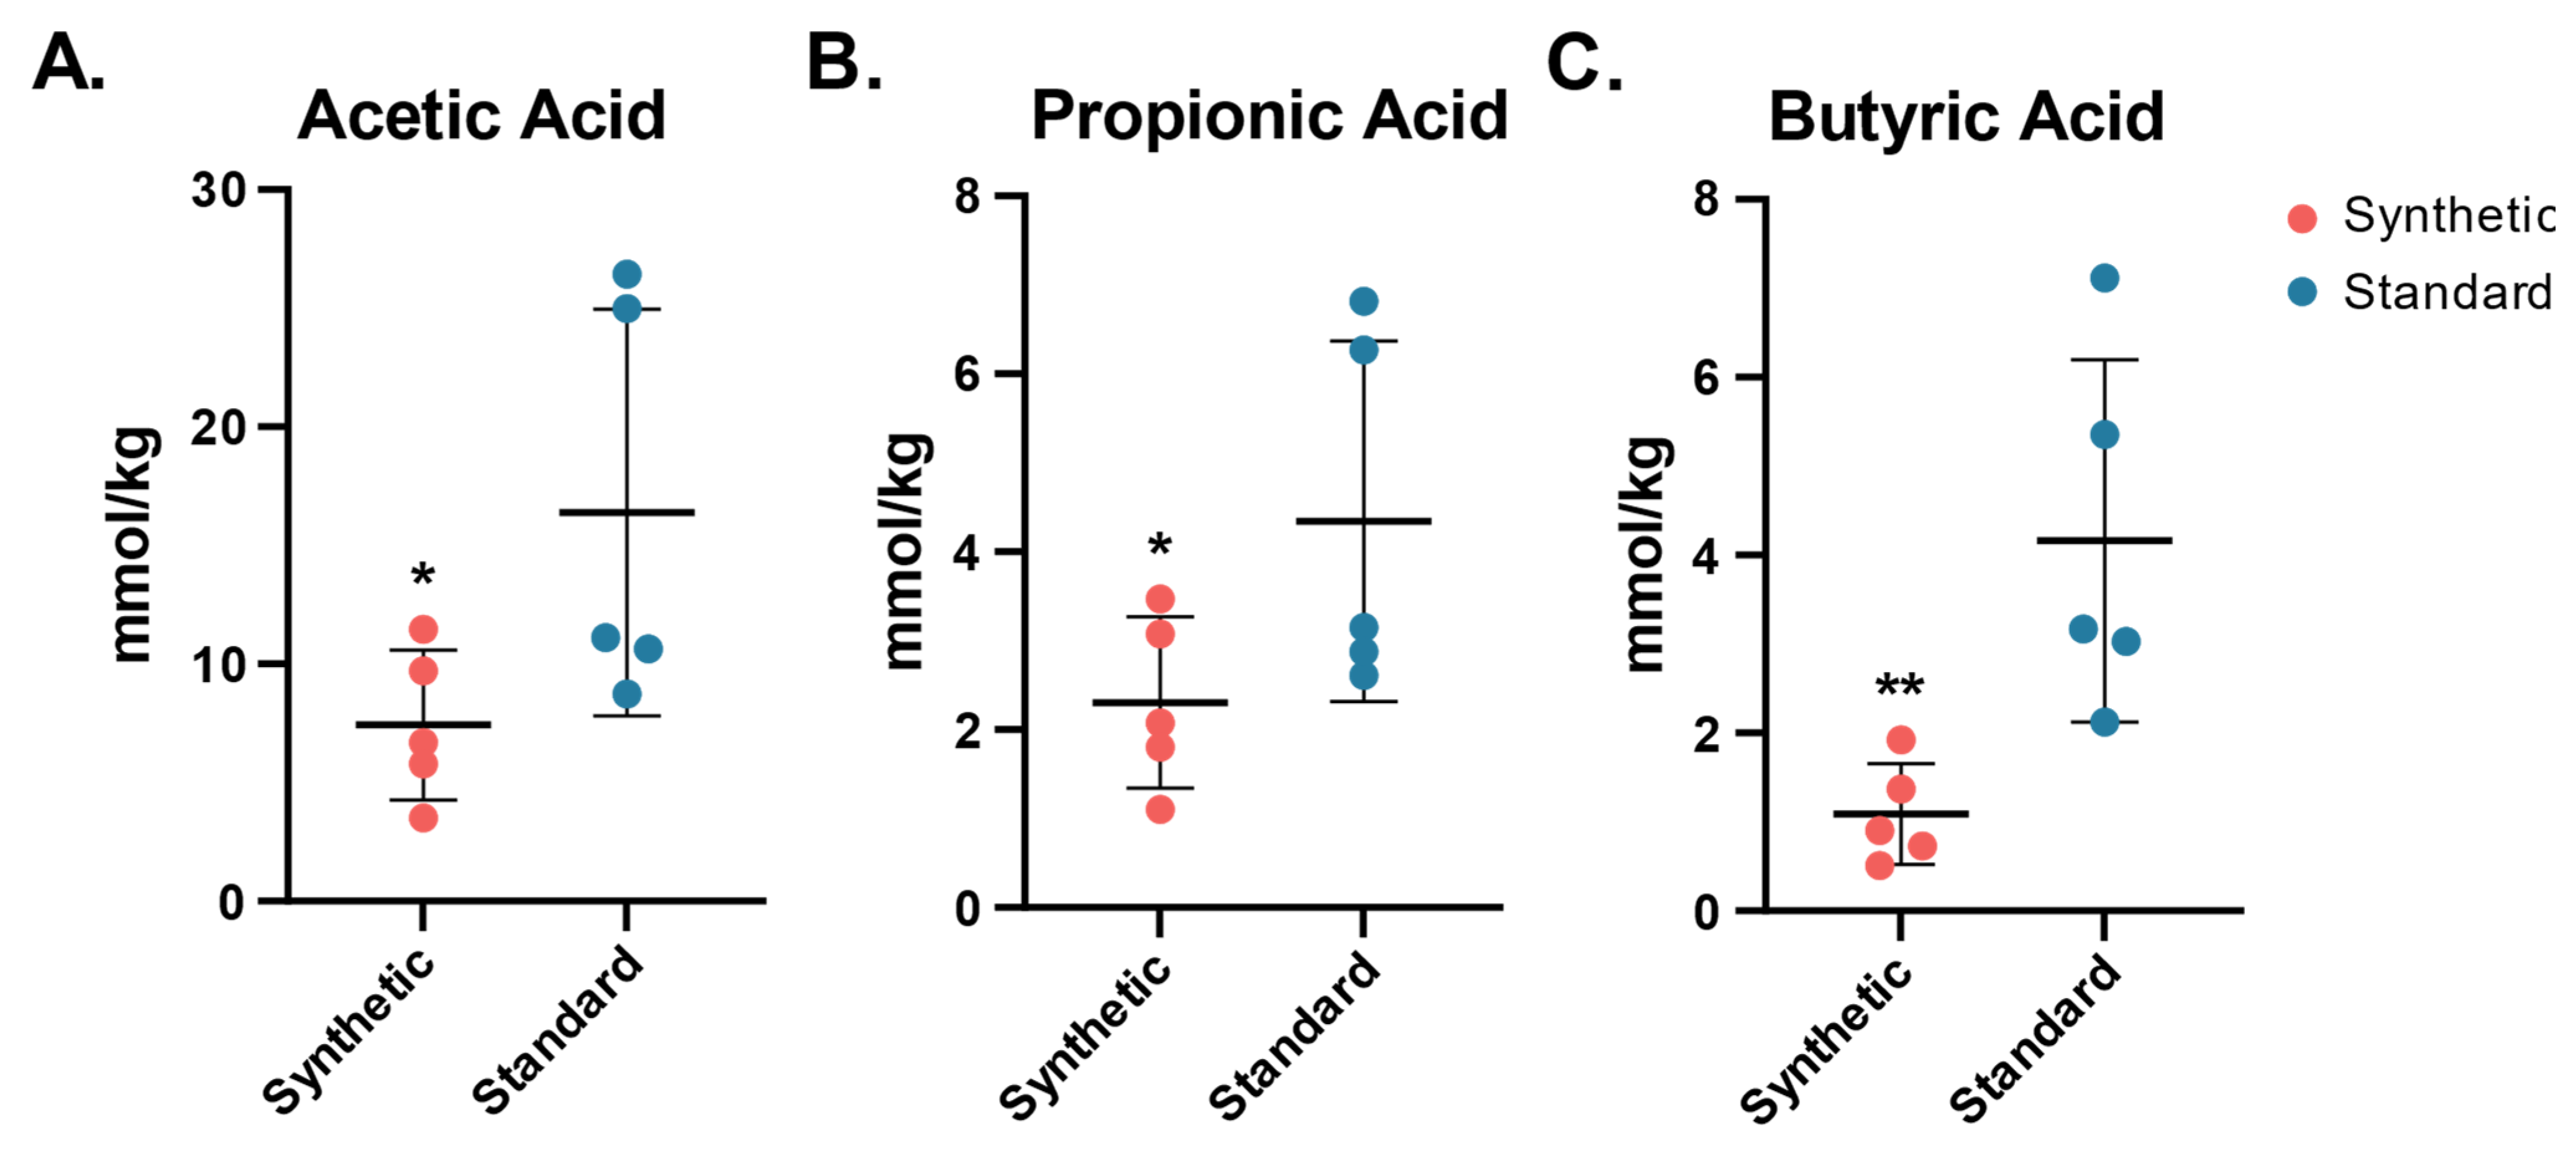
3.3. Decreased Short Chain Fatty Acid Levels in Synthetic Diet Group
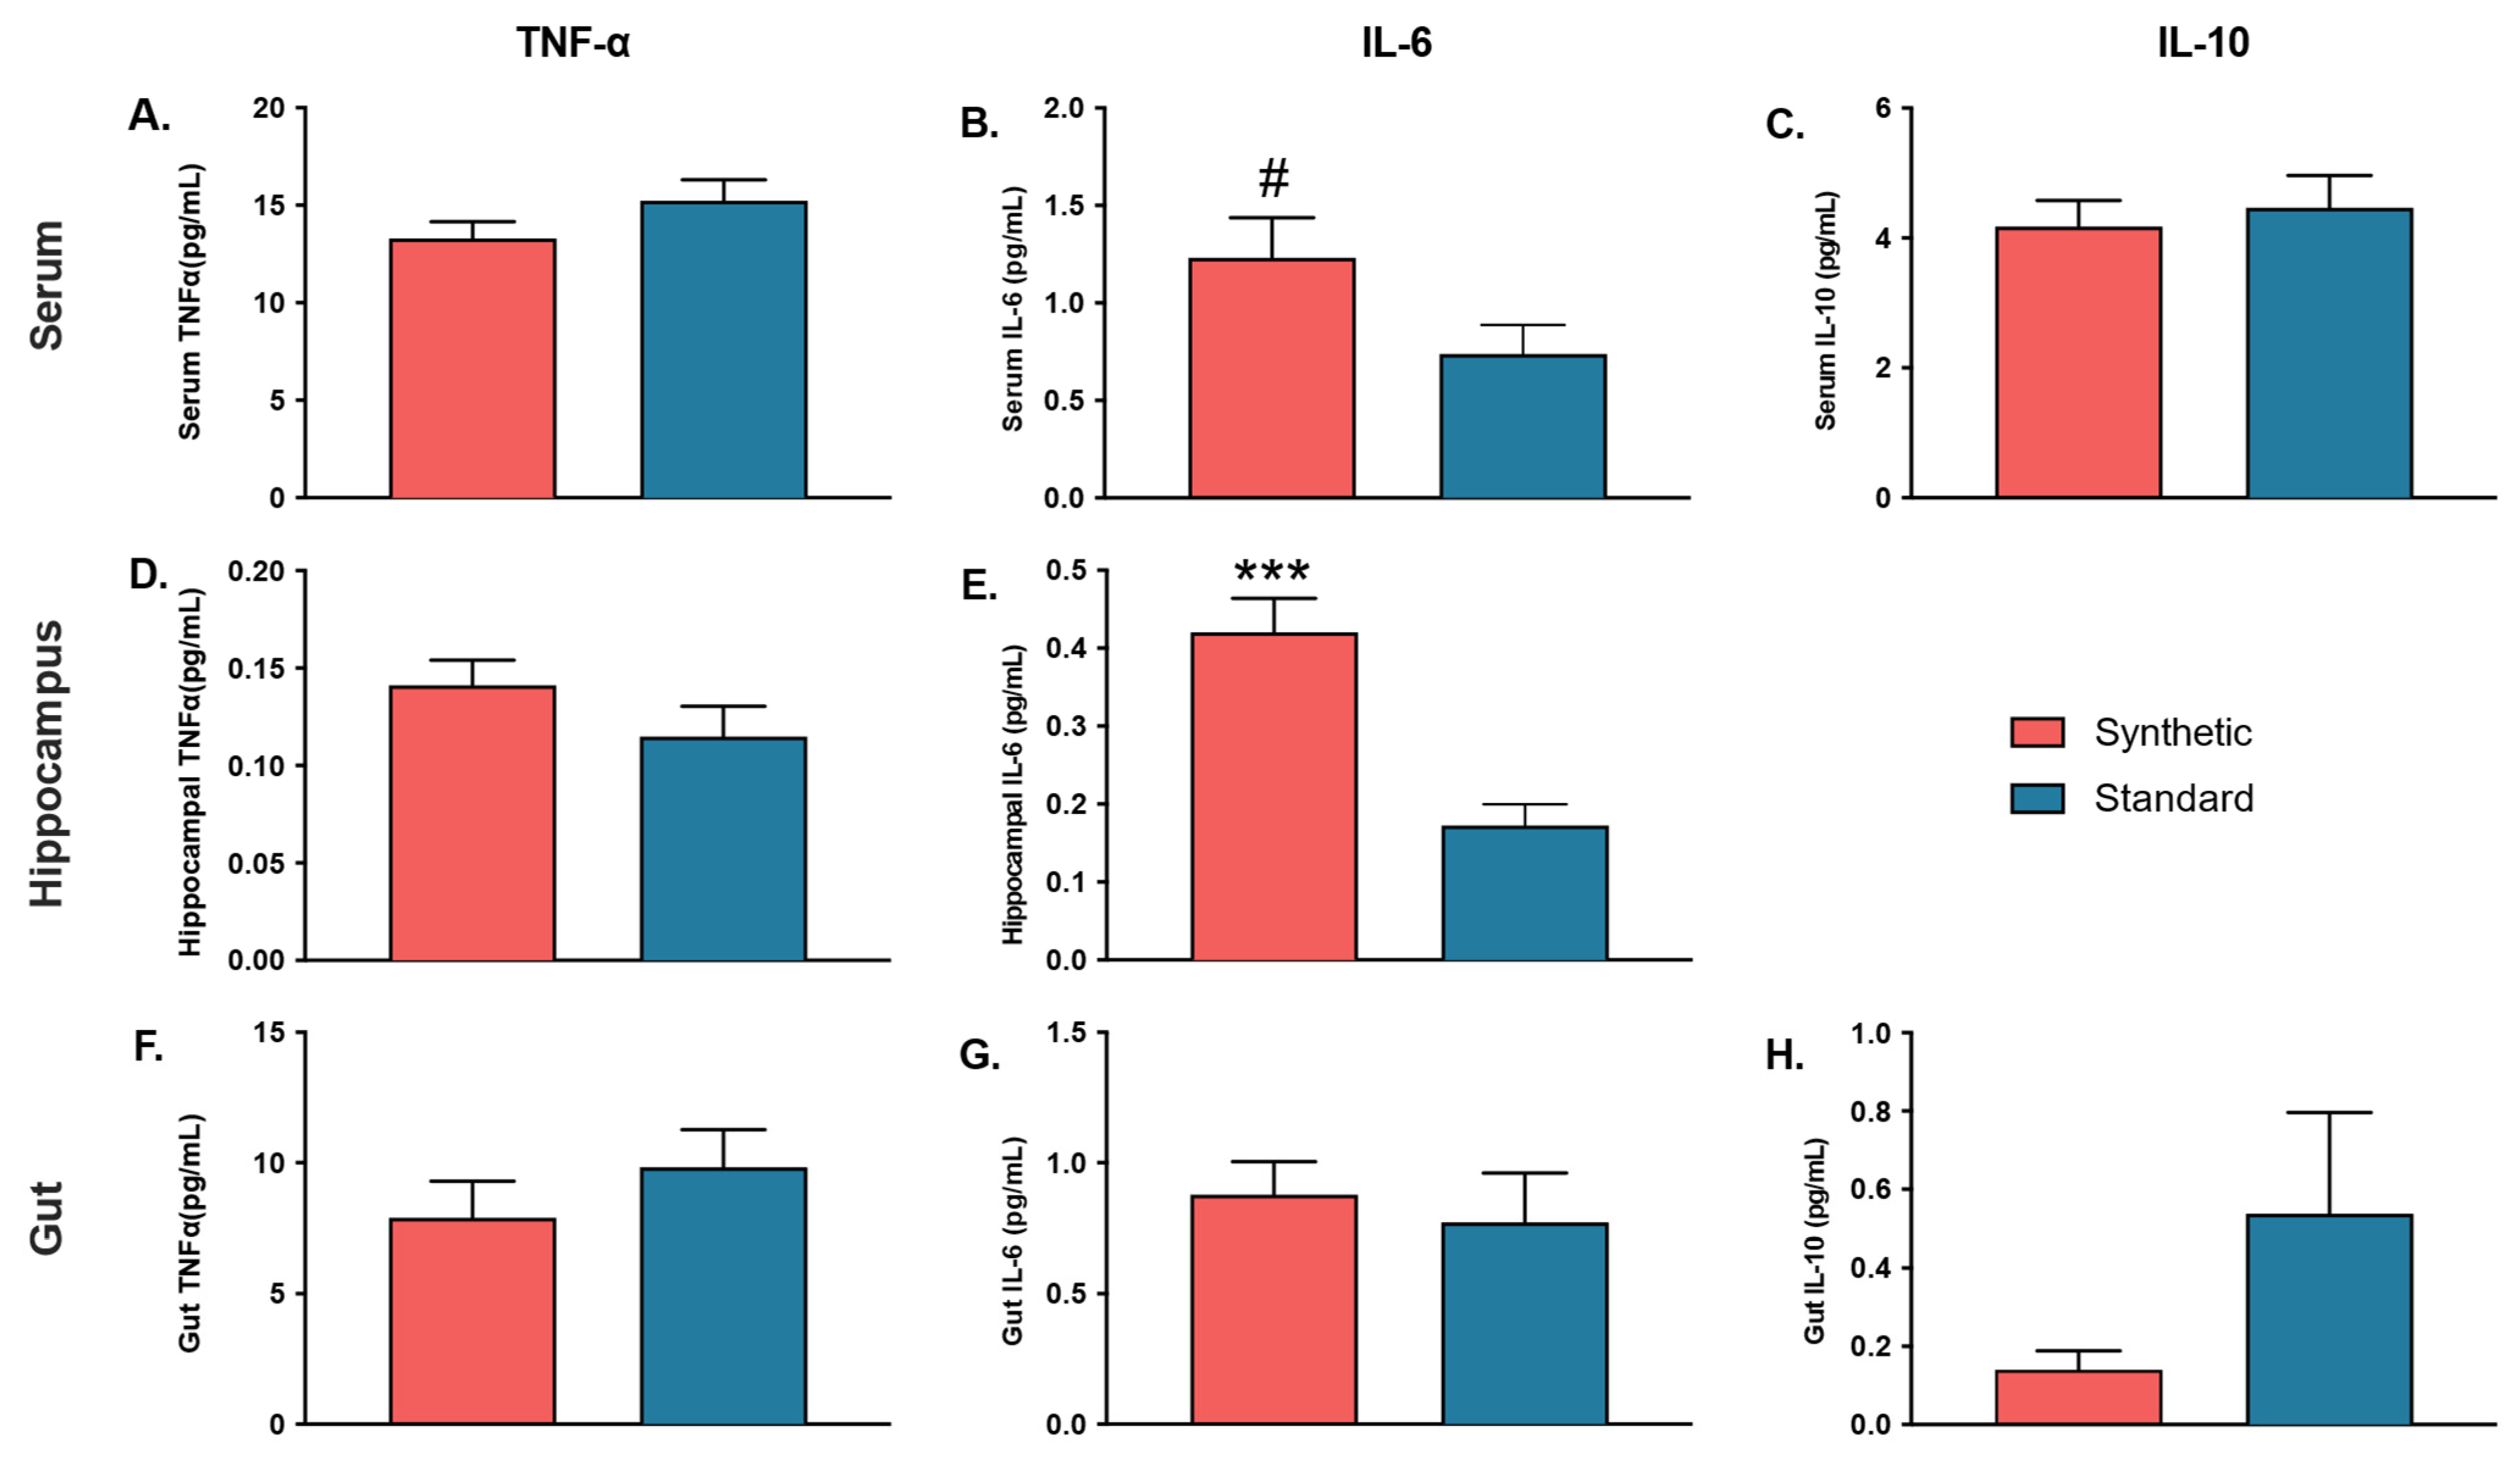
3.4. Altered Cytokine Profiles in Synthetic Diet Group
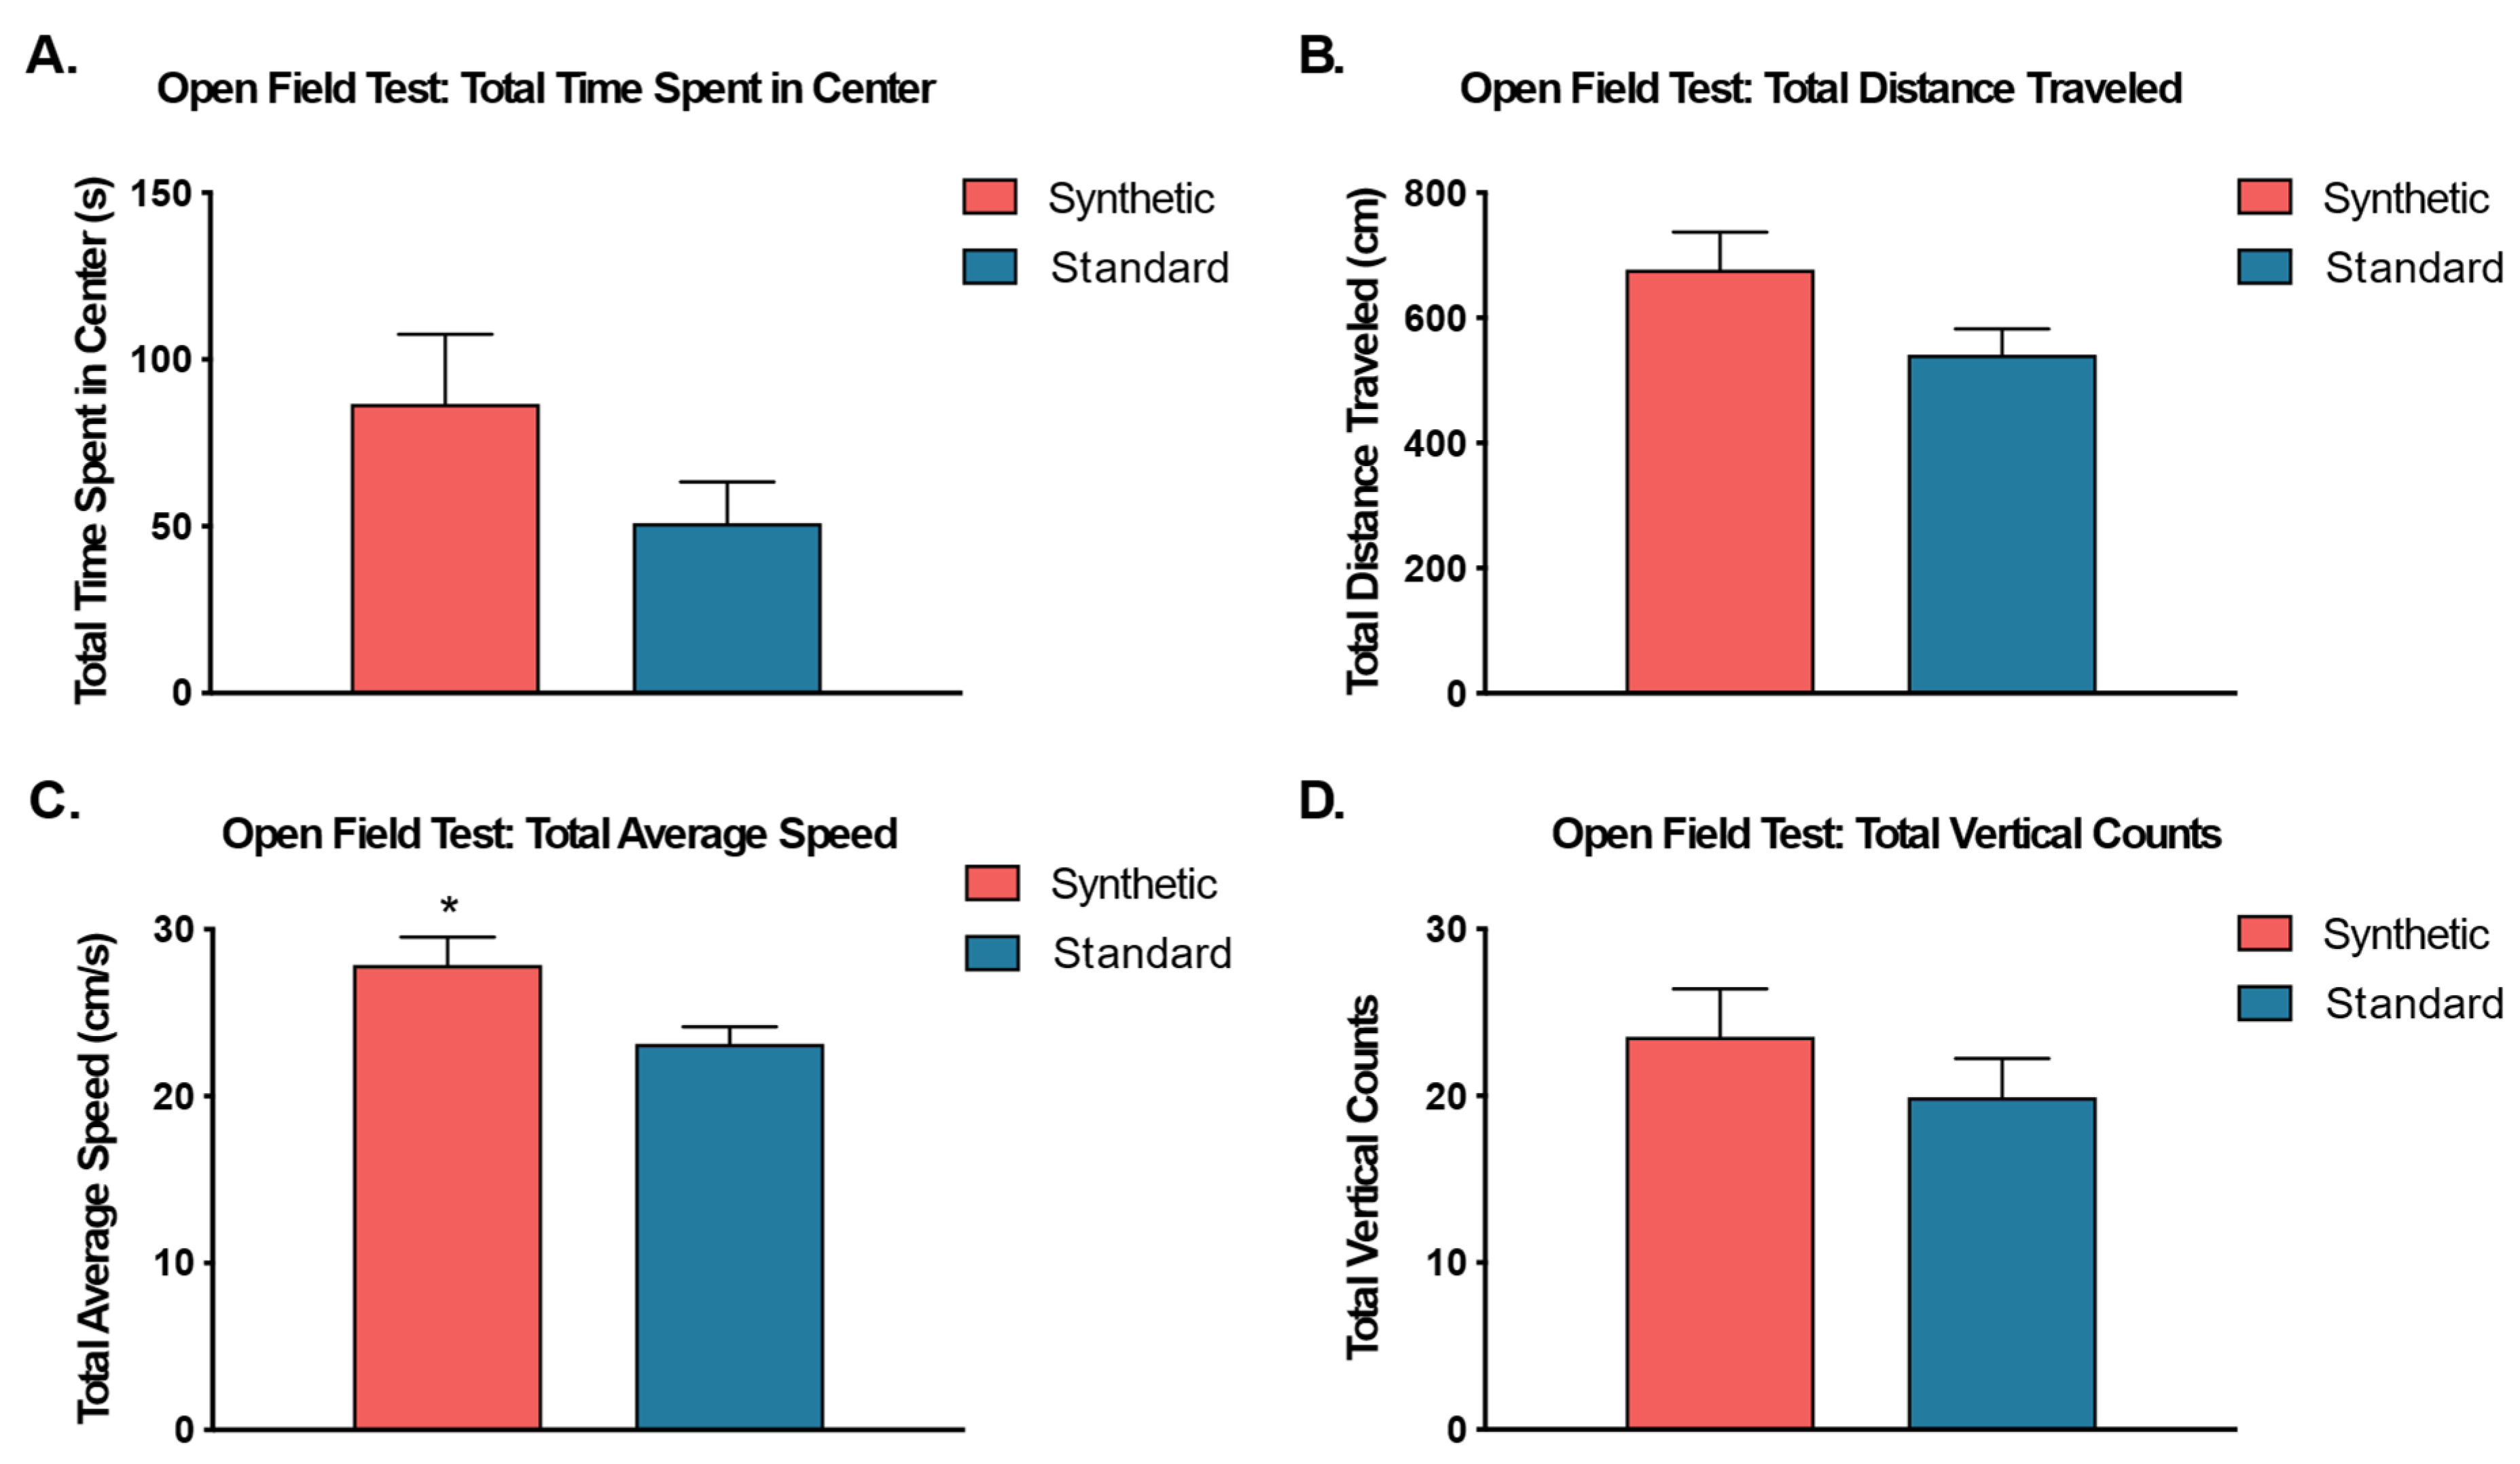
3.5. Modestly Increased Ambulation in Synthetic Diet Group
3.6. Synthetic Diet Had No Effect on Other Motor and Cognitive Functions
4. Discussion
Supplementary Materials
Author Contributions
Funding
Data Availability Statement
Acknowledgments
Conflicts of Interest
Abbreviations
| SCFAs | short chain fatty acids |
| MACs | microbiota-accessible carbohydrates |
| IBD | including inflammatory bowel disease |
| PKU | phenylketonuria |
| MHP | mild hyperphenylalaninemia |
| PCR | polymerase chain reaction |
| ASVs | Amplicon Sequencing Variants |
| PCA | Principal Component Analysis |
| PhILR | Phylogenetic isometric log-ratio |
| PERMANOVA | permutational multivariate analysis of variance |
| PICRUSt2 | Phylogenetic Investigation of Communities by Reconstruction of Unobserved States |
| STAMP | STatistical Analysis of Metagenomic Profiles |
| GC | gas chromatography |
| US | unconditioned stimulus |
| CS | conditioned stimulus |
References
- Candela, M.; Perna, F.; Carnevali, P.; Vitali, B.; Ciati, R.; Gionchetti, P.; Rizzello, F.; Campieri, M.; Brigidi, P. Interaction of probiotic Lactobacillus and Bifidobacterium strains with human intestinal epithelial cells: Adhesion properties, competition against enteropathogens and modulation of IL-8 production. Int. J. Food Microbiol. 2008, 125, 286–292. [Google Scholar] [CrossRef] [PubMed]
- Fukuda, S.; Toh, H.; Hase, K.; Oshima, K.; Nakanishi, Y.; Yoshimura, K.; Tobe, T.; Clarke, J.M.; Topping, D.L.; Suzuki, T.; et al. Bifidobacteria can protect from enteropathogenic infection through production of acetate. Nature 2011, 469, 543–547. [Google Scholar] [CrossRef] [PubMed]
- Olszak, T.; An, D.; Zeissig, S.; Vera, M.P.; Richter, J.; Franke, A.; Glickman, J.N.; Siebert, R.; Baron, R.M.; Kasper, D.L.; et al. Microbial Exposure During Early Life Has Persistent Effects on Natural Killer T Cell Function. Science 2012, 336, 489–493. [Google Scholar] [CrossRef] [PubMed]
- Sonnenburg, J.L.; Xu, J.; Leip, D.D.; Chen, C.H.; Westover, B.P.; Weatherford, J.; Buhler, J.D.; Gordon, J.I. Glycan foraging in vivo by an intestine-adapted bacterial symbiont. Science 2005, 307, 1955–1959. [Google Scholar] [CrossRef] [PubMed]
- Zhang, Y.; Li, Y.; Xia, Q.; Liu, L.; Wu, Z.; Pan, D. Recent advances of cereal β-glucan on immunity with gut microbiota regulation functions and its intelligent gelling application. Crit. Rev. Food Sci. Nutr. 2023, 63, 3895–3911. [Google Scholar] [CrossRef] [PubMed]
- Arpaia, N.; Campbell, C.; Fan, X.; Dikiy, S.; Van Der Veeken, J.; DeRoos, P.; Liu, H.; Cross, J.R.; Pfeffer, K.; Coffer, P.J.; et al. Metabolites produced by commensal bacteria promote peripheral regulatory T-cell generation. Nature 2013, 504, 451–455. [Google Scholar] [CrossRef]
- Bercik, P.; Collins, S.M.; Verdu, E.F. Microbes and the gut-brain axis. Neurogastroenterol. Motil. 2012, 24, 405–413. [Google Scholar] [CrossRef]
- Cryan, J.F.; O’mahony, S.M. The microbiome-gut-brain axis: From bowel to behavior. Neurogastroenterol. Motil. 2011, 23, 187–192. [Google Scholar] [CrossRef]
- Foster, J.A.; McVey Neufeld, K.-A. Gut–brain axis: How the microbiome influences anxiety and depression. Trends Neurosci. 2013, 36, 305–312. [Google Scholar] [CrossRef]
- Matt, S.M.; Allen, J.M.; Lawson, M.A.; Mailing, L.J.; Woods, J.A.; Johnson, R.W. Butyrate and Dietary Soluble Fiber Improve Neuroinflammation Associated with Aging in Mice. Front. Immunol. 2018, 9, 1832. [Google Scholar] [CrossRef]
- Neufeld, K.-A.M.; Kang, N.; Bienenstock, J.; A Foster, J. Effects of intestinal microbiota on anxiety-like behavior. Commun. Integr. Biol. 2011, 4, 492–494. [Google Scholar] [CrossRef] [PubMed]
- Opazo, M.C.; Ortega-Rocha, E.M.; Coronado-Arrázola, I.; Bonifaz, L.C.; Boudin, H.; Neunlist, M.; Bueno, S.M.; Kalergis, A.M.; Riedel, C.A. Intestinal Microbiota Influences Non-intestinal Related Autoimmune Diseases. Front. Microbiol. 2018, 9, 432. [Google Scholar] [CrossRef] [PubMed]
- Sarkar, A.; Lehto, S.M.; Harty, S.; Dinan, T.G.; Cryan, J.F.; Burnet, P.W. Psychobiotics and the Manipulation of Bacte-ria-Gut-Brain Signals. Trends Neurosci 2016, 39, 763–781. [Google Scholar] [CrossRef] [PubMed]
- Silva, Y.P.; Bernardi, A.; Frozza, R.L. The Role of Short-Chain Fatty Acids from Gut Microbiota in Gut-Brain Communication. Front. Endocrinol. 2020, 11, 25. [Google Scholar] [CrossRef]
- Dinan, T.G.; Stilling, R.M.; Stanton, C.; Cryan, J.F. Collective unconscious: How gut microbes shape human behavior. J. Psychiatr. Res. 2015, 63, 1–9. [Google Scholar] [CrossRef]
- Liu, X.; Li, X.; Xia, B.; Jin, X.; Zou, Q.; Zeng, Z.; Zhao, W.; Yan, S.; Li, L.; Yuan, S.; et al. High-fiber diet mitigates maternal obesity-induced cognitive and social dysfunction in the offspring via gut-brain axis. Cell Metab. 2021, 33, 923–938.e6. [Google Scholar] [CrossRef]
- Gill, S.R.; Pop, M.; Deboy, R.T.; Eckburg, P.B.; Turnbaugh, P.J.; Samuel, B.S.; Gordon, J.I.; Relman, D.A.; Fraser-Liggett, C.M.; Nelson, K.E. Metagenomic analysis of the human distal gut microbiome. Science 2006, 312, 1355–1359. [Google Scholar] [CrossRef]
- Muegge, B.D.; Kuczynski, J.; Knights, D.; Clemente, J.C.; González, A.; Fontana, L.; Henrissat, B.; Knight, R.; Gordon, J.I. Diet Drives Convergence in Gut Microbiome Functions Across Mammalian Phylogeny and within Humans. Science 2011, 332, 970–974. [Google Scholar] [CrossRef]
- Turnbaugh, P.J.; Ridaura, V.K.; Faith, J.J.; Rey, F.E.; Knight, R.; Gordon, J.I. The effect of diet on the human gut mi-crobiome: A metagenomic analysis in humanized gnotobiotic mice. Sci. Transl. Med. 2009, 1, 6ra14. [Google Scholar] [CrossRef]
- Zhao, L.; Zhang, F.; Ding, X.; Wu, G.; Lam, Y.Y.; Wang, X.; Fu, H.; Xue, X.; Lu, C.; Ma, J.; et al. Gut bacteria selectively promoted by dietary fibers alleviate type 2 diabetes. Science 2018, 359, 1151–1156. [Google Scholar] [CrossRef]
- Louis, P.; Scott, K.P.; Duncan, S.H.; Flint, H.J. Understanding the effects of diet on bacterial metabolism in the large intestine. J. Appl. Microbiol. 2007, 102, 1197–1208. [Google Scholar] [CrossRef] [PubMed]
- Trumbo, P.; Schlicker, S.; Yates, A.A.; Poos, M.; Food and Nutrition Board of the Institute of Medicine (Eds.) Dietary Reference Intakes for Energy, Carbohydrate, Fiber, Fat, Fatty Acids, Cholesterol, Protein, and Amino Acids; The National Academies Press: Washington, DC, USA, 2005. [Google Scholar]
- Wright, J.D.; Wang, C.-Y. Trends in Intake of Energy and Macronutrients in Adults from 1999–2000 through 2007–2008; NCHS Data Brief; National Center for Health Statistics: Hyattsville, MD, USA, 2010.
- Christ, A.; Lauterbach, M.; Latz, E. Western Diet and the Immune System: An Inflammatory Connection. Immunity 2019, 51, 794–811. [Google Scholar] [CrossRef] [PubMed]
- Statovci, D.; Aguilera, M.; MacSharry, J.; Melgar, S. The Impact of Western Diet and Nutrients on the Microbiota and Immune Response at Mucosal Interfaces. Front. Immunol. 2017, 8, 838. [Google Scholar] [CrossRef] [PubMed]
- Temba, G.S.; Kullaya, V.; Pecht, T.; Mmbaga, B.T.; Aschenbrenner, A.C.; Ulas, T.; Kibiki, G.; Lyamuya, F.; Boahen, C.K.; Kumar, V.; et al. Urban living in healthy Tanzanians is associated with an inflammatory status driven by dietary and metabolic changes. Nat. Immunol. 2021, 22, 287–300. [Google Scholar] [CrossRef]
- Li, X.-Y.; Liu, Y.-H.; Wang, B.; Chen, C.-Y.; Zhang, H.-M.; Kang, J.X. Identification of a sustainable two-plant diet that effectively prevents age-related metabolic syndrome and extends lifespan in aged mice. J. Nutr. Biochem. 2018, 51, 16–26. [Google Scholar] [CrossRef]
- Den Besten, G.; van Eunen, K.; Groen, A.K.; Venema, K.; Reijngoud, D.-J.; Bakker, B.M. The role of short-chain fatty acids in the interplay between diet, gut microbiota, and host energy metabolism. J. Lipid Res. 2013, 54, 2325–2340. [Google Scholar] [CrossRef]
- Litvak, Y.; Byndloss, M.X.; Bäumler, A.J. Colonocyte metabolism shapes the gut microbiota. Science 2018, 362, eaat9076. [Google Scholar] [CrossRef]
- Sonnenburg, E.D.; Sonnenburg, J.L. Starving our Microbial Self: The Deleterious Consequences of a Diet Deficient in Microbiota-Accessible Carbohydrates. Cell Metab. 2014, 20, 779–786. [Google Scholar] [CrossRef]
- Desai, M.S.; Seekatz, A.M.; Koropatkin, N.M.; Kamada, N.; Hickey, C.A.; Wolter, M.; Pudlo, N.A.; Kitamoto, S.; Muller, A.; Young, V.B.; et al. A dietary fiber-deprived gut microbiota degrades the colonic mucus barrier and enhances pathogen susceptibility. Cell 2017, 167, 1339–1353. [Google Scholar] [CrossRef]
- Trompette, A.; Gollwitzer, E.S.; Yadava, K.; Sichelstiel, A.K.; Sprenger, N.; Ngom-Bru, C.; Blanchard, C.; Junt, T.; Nicod, L.P.; Harris, N.L.; et al. Gut microbiota metabolism of dietary fiber influences allergic airway disease and hema-topoiesis. Nat. Med. 2014, 20, 159–166. [Google Scholar] [CrossRef]
- Luhrs, H.; Gerke, T.; Muller, J.G.; Melcher, R.; Schauber, J.; Boxberge, F.; Scheppach, W.; Menzel, T. Butyrate inhibits Nf-kappaB activation in lamina propria macrophages of patients with ulcerative colitis. Scand. J. Gastroenterol. 2002, 37, 458–466. [Google Scholar] [CrossRef] [PubMed]
- Verduci, E.; Moretti, F.; Bassanini, G.; Banderali, G.; Rovelli, V.; Casiraghi, M.C.; Morace, G.; Borgo, F.; Borghi, E. Phe-nylketonuric diet negatively impacts on butyrate production. Nutr. Metab. Cardiovasc. Dis. 2018, 28, 385–392. [Google Scholar] [CrossRef] [PubMed]
- Benus, R.F.; Van Der Werf, T.S.; Welling, G.W.; Judd, P.A.; Taylor, M.A.; Harmsen, H.J.; Whelan, K. Association between Faecalibacterium prausnitzii and dietary fibre in colonic fermentation in healthy human subjects. Br. J. Nutr. 2010, 104, 693–700. [Google Scholar] [CrossRef] [PubMed]
- Mancilla, V.J.; Mann, A.E.; Zhang, Y.; Allen, M.S. The Adult Phenylketonuria (PKU) Gut Microbiome. Microorganisms 2021, 9, 530. [Google Scholar] [CrossRef] [PubMed]
- Benninghoff, A.D.; Hintze, K.J.; Monsanto, S.P.; Rodriguez, D.M.; Hunter, A.H.; Phatak, S.; Pestka, J.J.; Van Wettere, A.J.; Ward, R.E. Consumption of the Total Western Diet Promotes Colitis and Inflammation-Associated Colorectal Cancer in Mice. Nutrients 2020, 12, 544. [Google Scholar] [CrossRef]
- Caporaso, J.G.; Lauber, C.L.; Walters, W.A.; Berg-Lyons, D.; Lozupone, C.A.; Turnbaugh, P.J.; Fierer, N.; Knight, R. Global patterns of 16S rRNA diversity at a depth of millions of sequences per sample. Proc. Natl. Acad. Sci. USA 2011, 108 (Supp. S1), 4516–4522. [Google Scholar] [CrossRef]
- Martin, M. Cutadapt removes adapter sequences from high-throughput sequencing reads. EMBnet. J. 2011, 17, 10–12. [Google Scholar] [CrossRef]
- Callahan, B.J.; Mcmurdie, P.J.; Rosen, M.J.; Han, A.W.; Johnson, A.J.A.; Holmes, S.P. DADA2: High-resolution sample inference from Illumina amplicon data. Nat. Methods 2016, 13, 581–583. [Google Scholar] [CrossRef]
- Rognes, T.; Flouri, T.; Nichols, B.; Quince, C.; Mahé, F. VSEARCH: A versatile open source tool for metagenomics. PeerJ 2016, 2016, e2584. [Google Scholar] [CrossRef]
- Yoon, S.-H.; Ha, S.-M.; Kwon, S.; Lim, J.; Kim, Y.; Seo, H.; Chun, J. Introducing EzBioCloud: A taxonomically united database of 16S rRNA gene sequences and whole-genome assemblies. Int. J. Syst. Evol. Microbiol. 2017, 67, 1613–1617. [Google Scholar] [CrossRef]
- R Core Team. R: A Language and Environment for Statistical Computing; R Foundation for Statistical Computing: Vienna, Austria, 2018. [Google Scholar]
- Mann, A.E.; Mitchell, E.A.; Zhang, Y.; Curtis-Robles, R.; Thapa, S.; Hamer, S.A.; Allen, M.S. Comparison of the Bacterial Gut Microbiome of North American Triatoma spp. with and without Trypanosoma cruzi. Front. Microbiol. 2020, 11, 364. [Google Scholar] [CrossRef] [PubMed]
- McMurdie, P.J.; Holmes, S. phyloseq: An R package for reproducible interactive analysis and graphics of microbiome census data. PLoS ONE 2013, 8, e61217. [Google Scholar] [CrossRef] [PubMed]
- Silverman, J.D.; Washburne, A.D.; Mukherjee, S.; David, L.A. A phylogenetic transform enhances analysis of compo-sitional microbiota data. Elife 2017, 6, e21887. [Google Scholar] [CrossRef] [PubMed]
- Oksanen, J.; Simpson, G.L.; Blanchet, F.G.; Kindt, R.; Legendre, P.; Minchin, P.R.; O’Hara, R.B.; Solymos, P.; Stevens, M.H.H.; Szoecs, E.; et al. Vegan: Community Ecology Package. 2019. Available online: https://github.com/vegandevs/vegan (accessed on 29 October 2023).
- Anderson, M.J. Permutational Multivariate Analysis of Variance (PERMANOVA); Balakrishnan, N., Colton, T., Everitt, B., Piegorsch, W., Ruggeri, F., Teugels, J.L., Eds.; John Wiley & Sons, Ltd.: Hoboken, NJ, USA, 2017; pp. 1–15. [Google Scholar] [CrossRef]
- Washburne, A.D.; Silverman, J.D.; Leff, J.W.; Bennett, D.J.; Darcy, J.L.; Mukherjee, S.; Fierer, N.; David, L.A. Phylogenetic factorization of compositional data yields lineage-level associations in microbiome datasets. PeerJ 2017, 5, e2969. [Google Scholar] [CrossRef]
- Love, M.I.; Huber, W.; Anders, S. Moderated estimation of fold change and dispersion for Rna-seq data with DESeq2. Genome Biol. 2014, 15, 550. [Google Scholar] [CrossRef]
- Douglas, G.M.; Maffei, V.J.; Zaneveld, J.R.; Yurgel, S.N.; Brown, J.R.; Taylor, C.M.; Huttenhower, C.; Langille, M.G.I. PICRUSt2 for prediction of metagenome functions. Nat. Biotechnol. 2020, 38, 685–688. [Google Scholar] [CrossRef]
- Parks, D.H.; Beiko, R.G. Identifying biologically relevant differences between metagenomic communities. Bioinformatics 2010, 26, 715–721. [Google Scholar] [CrossRef]
- Seibenhener, M.L.; Wooten, M.C. Use of the Open Field Maze to measure locomotor and anxiety-like behavior in mice. J. Vis. Exp. 2015, 96, e52434. [Google Scholar]
- Shepherd, J.K.; Grewal, S.S.; Fletcher, A.; Bill, D.J.; Dourish, C.T. Behavioural and pharmacological characterisation of the elevated “zero-maze” as an animal model of anxiety. Psychopharmacology 1994, 116, 56–64. [Google Scholar] [CrossRef]
- Kranjac, D.; McLinden, K.A.; Deodati, L.E.; Papini, M.R.; Chumley, M.J.; Boehm, G.W. Peripheral bacterial endotoxin administration triggers both memory consolidation and reconsolidation deficits in mice. Brain Behav. Immun. 2012, 26, 109–121. [Google Scholar] [CrossRef]
- Rudy, J.; Huff, N.; Matus-Amat, P. Understanding contextual fear conditioning: Insights from a two-process model. Neurosci. Biobehav. Rev. 2004, 28, 675–685. [Google Scholar] [CrossRef] [PubMed]
- Carding, S.; Verbeke, K.; Vipond, D.T.; Corfe, B.M.; Owen, L.J. Dysbiosis of the gut microbiota in disease. Microb. Ecol. Health Dis. 2015, 26, 26191. [Google Scholar] [CrossRef] [PubMed]
- Bassanini, G.; Ceccarani, C.; Borgo, F.; Severgnini, M.; Rovelli, V.; Morace, G.; Verduci, E.; Borghi, E. Phenylketonuria Diet Promotes Shifts in Firmicutes Populations. Front. Cell. Infect. Microbiol. 2019, 9, 101. [Google Scholar] [CrossRef]
- de Oliveira, F.P.; Mendes, R.H.; Dobbler, P.T.; Mai, V.; Pylro, V.S.; Waugh, S.G.; Vairo, F.; Refosco, L.F.; Roesch, L.F.W.; Schwartz, I.V.D. Phenylketonuria and Gut Microbiota: A Controlled Study Based on Next-Generation Sequencing. PLoS ONE 2016, 11, e0157513. [Google Scholar] [CrossRef] [PubMed]
- Yatsunenko, T.; Rey, F.E.; Manary, M.J.; Trehan, I.; Dominguez-Bello, M.G.; Contreras, M.; Magris, M.; Hidalgo, G.; Baldassano, R.N.; Anokhin, A.P.; et al. Human gut microbiome viewed across age and geography. Nature 2012, 486, 222–227. [Google Scholar] [CrossRef]
- Zhang, C.; Zhang, M.; Pang, X.; Zhao, Y.; Wang, L.; Zhao, L. Structural resilience of the gut microbiota in adult mice under high-fat dietary perturbations. ISME J. 2012, 6, 1848–1857. [Google Scholar] [CrossRef]
- Lozupone, C.A.; Stombaugh, J.I.; Gordon, J.I.; Jansson, J.K.; Knight, R. Diversity, stability and resilience of the human gut microbiota. Nature 2012, 489, 220–230. [Google Scholar] [CrossRef]
- Moya, A.; Ferrer, M. Functional Redundancy-Induced Stability of Gut Microbiota Subjected to Disturbance. Trends Microbiol. 2016, 24, 402–413. [Google Scholar] [CrossRef]
- Cotillard, A.; Kennedy, S.P.; Kong, L.C.; Prifti, E.; Pons, N.; Le Chatelier, E.; Almeida, M.; Quinquis, B.; Levenez, F.; Galleron, N.; et al. Dietary intervention impact on gut microbial gene richness. Nature 2013, 500, 585–588. [Google Scholar] [CrossRef]
- Iljazovic, A.; Roy, U.; Gálvez, E.J.C.; Lesker, T.R.; Zhao, B.; Gronow, A.; Amend, L.; Will, S.E.; Hofmann, J.D.; Pils, M.C.; et al. Perturbation of the gut microbiome by Prevotella spp. enhances host susceptibility to mucosal inflammation. Mucosal. Immunol. 2020, 14, 113–124. [Google Scholar] [CrossRef]
- Vieira, A.T.; Teixeira, M.M.; Martins, F.S. The Role of Probiotics and Prebiotics in Inducing Gut Immunity. Front. Immunol. 2013, 4, 445. [Google Scholar] [CrossRef] [PubMed]
- Scheppach, W. Effects of short chain fatty acids on gut morphology and function. Gut 1994, 35, S35–S38. [Google Scholar] [CrossRef]
- Miquel, S.; Leclerc, M.; Martin, R.; Chain, F.; Lenoir, M.; Raguideau, S.; Hudault, S.; Bridonneau, C.; Northen, T.; Bowen, B.; et al. Identification of metabolic signatures linked to anti-inflammatory effects of Faecalibacterium prausnitzii. MBio 2015, 6, 10–1128. [Google Scholar] [CrossRef]
- Meijer, K.; De Vos, P.; Priebe, M.G. Butyrate and other short-chain fatty acids as modulators of immunity: What relevance for health? Curr. Opin. Clin. Nutr. Metab. Care 2010, 13, 715–721. [Google Scholar] [CrossRef] [PubMed]
- Kawasaki, Y.; Isoda, H.; Tanimoto, M.; Dosako, S.; Idota, T.; Ahiko, K. Inhibition by lactoferrin and kappa-casein gly-comacropeptide of binding of Cholera toxin to its receptor. Biosci. Biotechnol. Biochem. 1992, 56, 195–198. [Google Scholar] [CrossRef] [PubMed]
- Macfarlane, G.T.; Macfarlane, S. Fermentation in the human large intestine: Its physiologic consequences and the potential contribution of prebiotics. J. Clin. Gastroenterol. 2011, 45, S120–S127. [Google Scholar] [CrossRef] [PubMed]
- Slavin, J. Fiber and Prebiotics: Mechanisms and Health Benefits. Nutrients 2013, 5, 1417–1435. [Google Scholar] [CrossRef]
- Peng, L.; Li, Z.-R.; Green, R.S.; Holzmanr, I.R.; Lin, J. Butyrate Enhances the Intestinal Barrier by Facilitating Tight Junction Assembly via Activation of AMP-Activated Protein Kinase in Caco-2 Cell Monolayers. J. Nutr. 2009, 139, 1619–1625. [Google Scholar] [CrossRef]
- Takiishi, T.; Fenero, C.I.M.; Câmara, N.O.S. Intestinal barrier and gut microbiota: Shaping our immune responses throughout life. Tissue Barriers 2017, 5, e1373208. [Google Scholar] [CrossRef]
- Valenzano, M.C.; DiGuilio, K.; Mercado, J.; Teter, M.; To, J.; Ferraro, B.; Mixson, B.; Manley, I.; Baker, V.; Moore, B.A.; et al. Remodeling of Tight Junctions and Enhancement of Barrier Integrity of the CACO-2 Intestinal Epithelial Cell Layer by Micronutrients. PLoS ONE 2015, 10, e0133926. [Google Scholar] [CrossRef]
- Kim, Y.; Hwang, S.W.; Kim, S.; Lee, Y.-S.; Kim, T.-Y.; Lee, S.-H.; Kim, S.J.; Yoo, H.J.; Na Kim, E.; Kweon, M.-N. Dietary cellulose prevents gut inflammation by modulating lipid metabolism and gut microbiota. Gut Microbes 2020, 11, 944–961. [Google Scholar] [CrossRef] [PubMed]
- McIntyre, A.; Gibson, P.R.; Young, G.P. Butyrate production from dietary fibre and protection against large bowel cancer in a rat model. Gut 1993, 34, 386–391. [Google Scholar] [CrossRef] [PubMed]
- Smith, P.M.; Howitt, M.R.; Panikov, N.; Michaud, M.; Gallini, C.A.; Bohlooly-Y, M.; Glickman, J.N.; Garrett, W.S. The Microbial Metabolites, Short-Chain Fatty Acids, Regulate Colonic Treg Cell Homeostasis. Science 2013, 341, 569–573. [Google Scholar] [CrossRef] [PubMed]
- Bourin, M.; Petit-Demoulière, B.; Nic Dhonnchadha, B.; Hascöet, M. Animal models of anxiety in mice. Fundam. Clin. Pharmacol. 2007, 21, 567–574. [Google Scholar] [CrossRef] [PubMed]


Disclaimer/Publisher’s Note: The statements, opinions and data contained in all publications are solely those of the individual author(s) and contributor(s) and not of MDPI and/or the editor(s). MDPI and/or the editor(s) disclaim responsibility for any injury to people or property resulting from any ideas, methods, instructions or products referred to in the content. |
© 2023 by the authors. Licensee MDPI, Basel, Switzerland. This article is an open access article distributed under the terms and conditions of the Creative Commons Attribution (CC BY) license (https://creativecommons.org/licenses/by/4.0/).
Share and Cite
Mancilla, V.J.; Braden-Kuhle, P.N.; Brice, K.N.; Mann, A.E.; Williams, M.T.; Zhang, Y.; Chumley, M.J.; Barber, R.C.; White, S.N.; Boehm, G.W.; et al. A Synthetic Formula Amino Acid Diet Leads to Microbiome Dysbiosis, Reduced Colon Length, Inflammation, and Altered Locomotor Activity in C57BL/6J Mice. Microorganisms 2023, 11, 2694. https://doi.org/10.3390/microorganisms11112694
Mancilla VJ, Braden-Kuhle PN, Brice KN, Mann AE, Williams MT, Zhang Y, Chumley MJ, Barber RC, White SN, Boehm GW, et al. A Synthetic Formula Amino Acid Diet Leads to Microbiome Dysbiosis, Reduced Colon Length, Inflammation, and Altered Locomotor Activity in C57BL/6J Mice. Microorganisms. 2023; 11(11):2694. https://doi.org/10.3390/microorganisms11112694
Chicago/Turabian StyleMancilla, Viviana J., Paige N. Braden-Kuhle, Kelly N. Brice, Allison E. Mann, Megan T. Williams, Yan Zhang, Michael J. Chumley, Robert C. Barber, Sabrina N. White, Gary W. Boehm, and et al. 2023. "A Synthetic Formula Amino Acid Diet Leads to Microbiome Dysbiosis, Reduced Colon Length, Inflammation, and Altered Locomotor Activity in C57BL/6J Mice" Microorganisms 11, no. 11: 2694. https://doi.org/10.3390/microorganisms11112694