
Bacteria Associated with the Roots of Common Bean (Phaseolus vulgaris L.) at Different Development Stages: Diversity and Plant Growth Promotion
 , , , , and
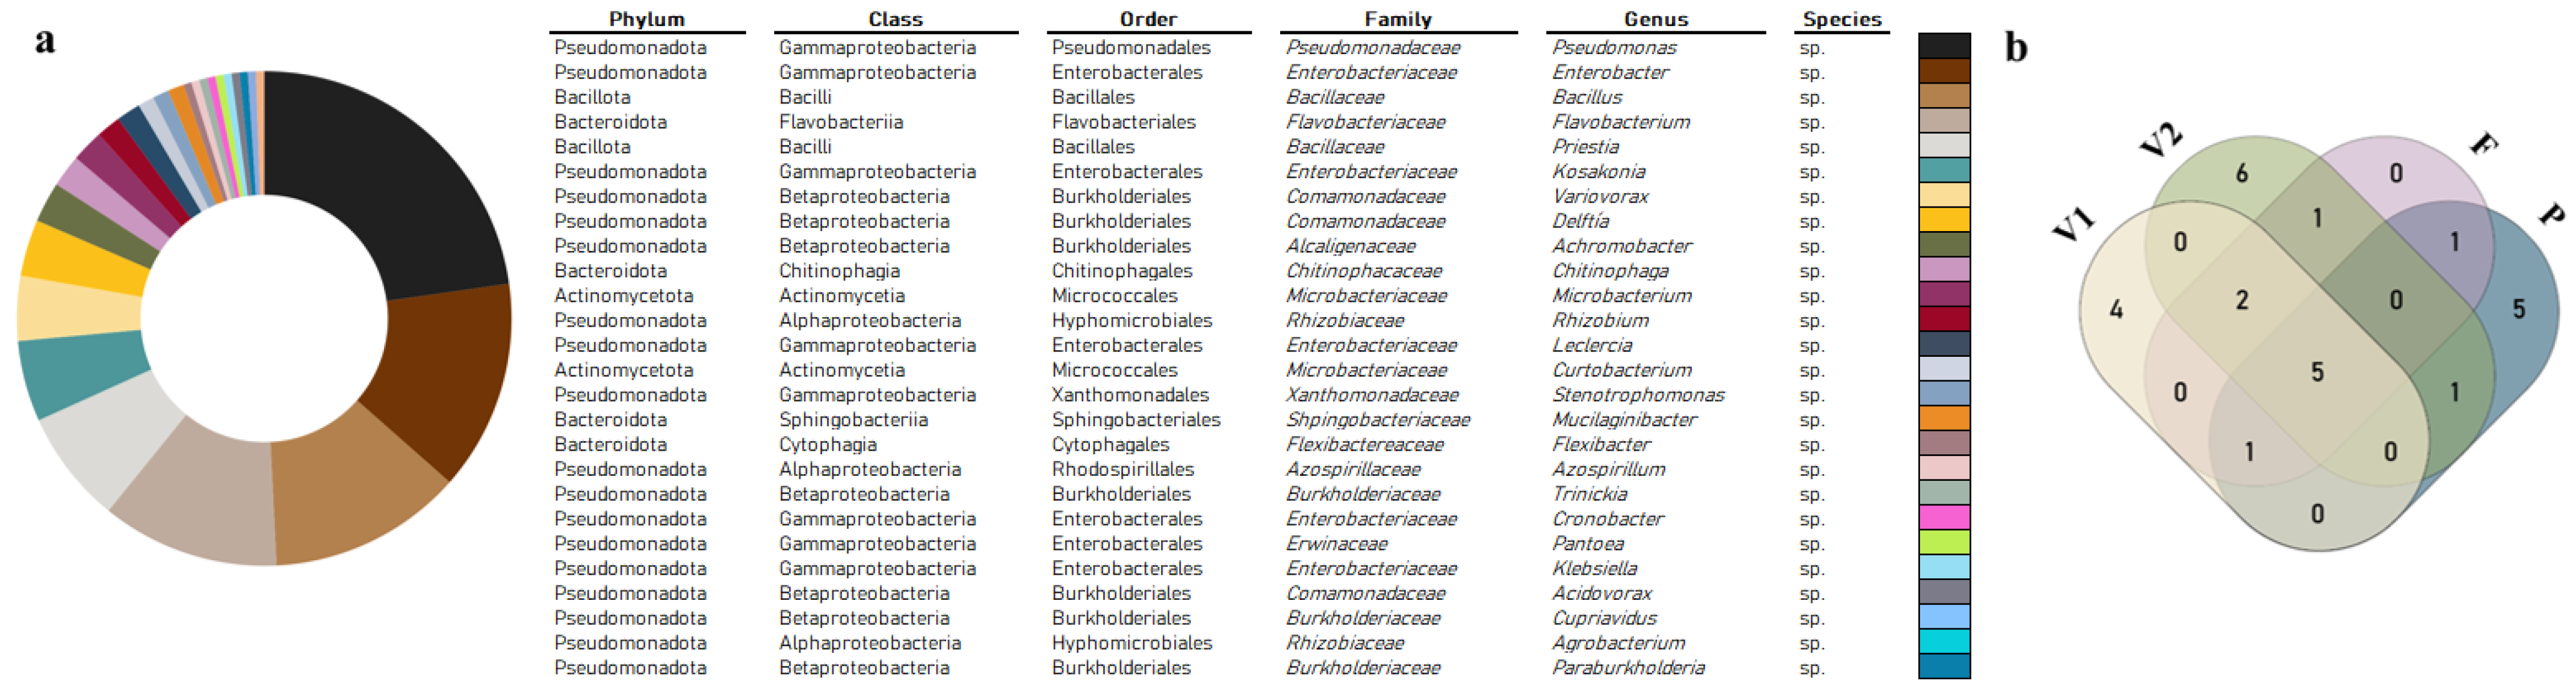
Abstract
:1. Introduction
2. Materials and Methods
2.1. Plant Growth Conditions
2.2. Plant Harvesting
2.3. Isolation of Bacteria
Preservation of Bacterial Isolates
2.4. Bacteria Identification
2.4.1. PCR-Based Fingerprinting
2.4.2. 16S rRNA Gene Amplification and Phylogenetic Analysis
2.5. Plant Growth Promotion Abilities
2.5.1. Production of Siderophores
2.5.2. Production of Indole-3-Acetic Acid (IAA)
2.5.3. Screening Antifungal Capacity
2.6. Statistical Analysis
3. Results
3.1. Diversity
3.1.1. Total Diversity
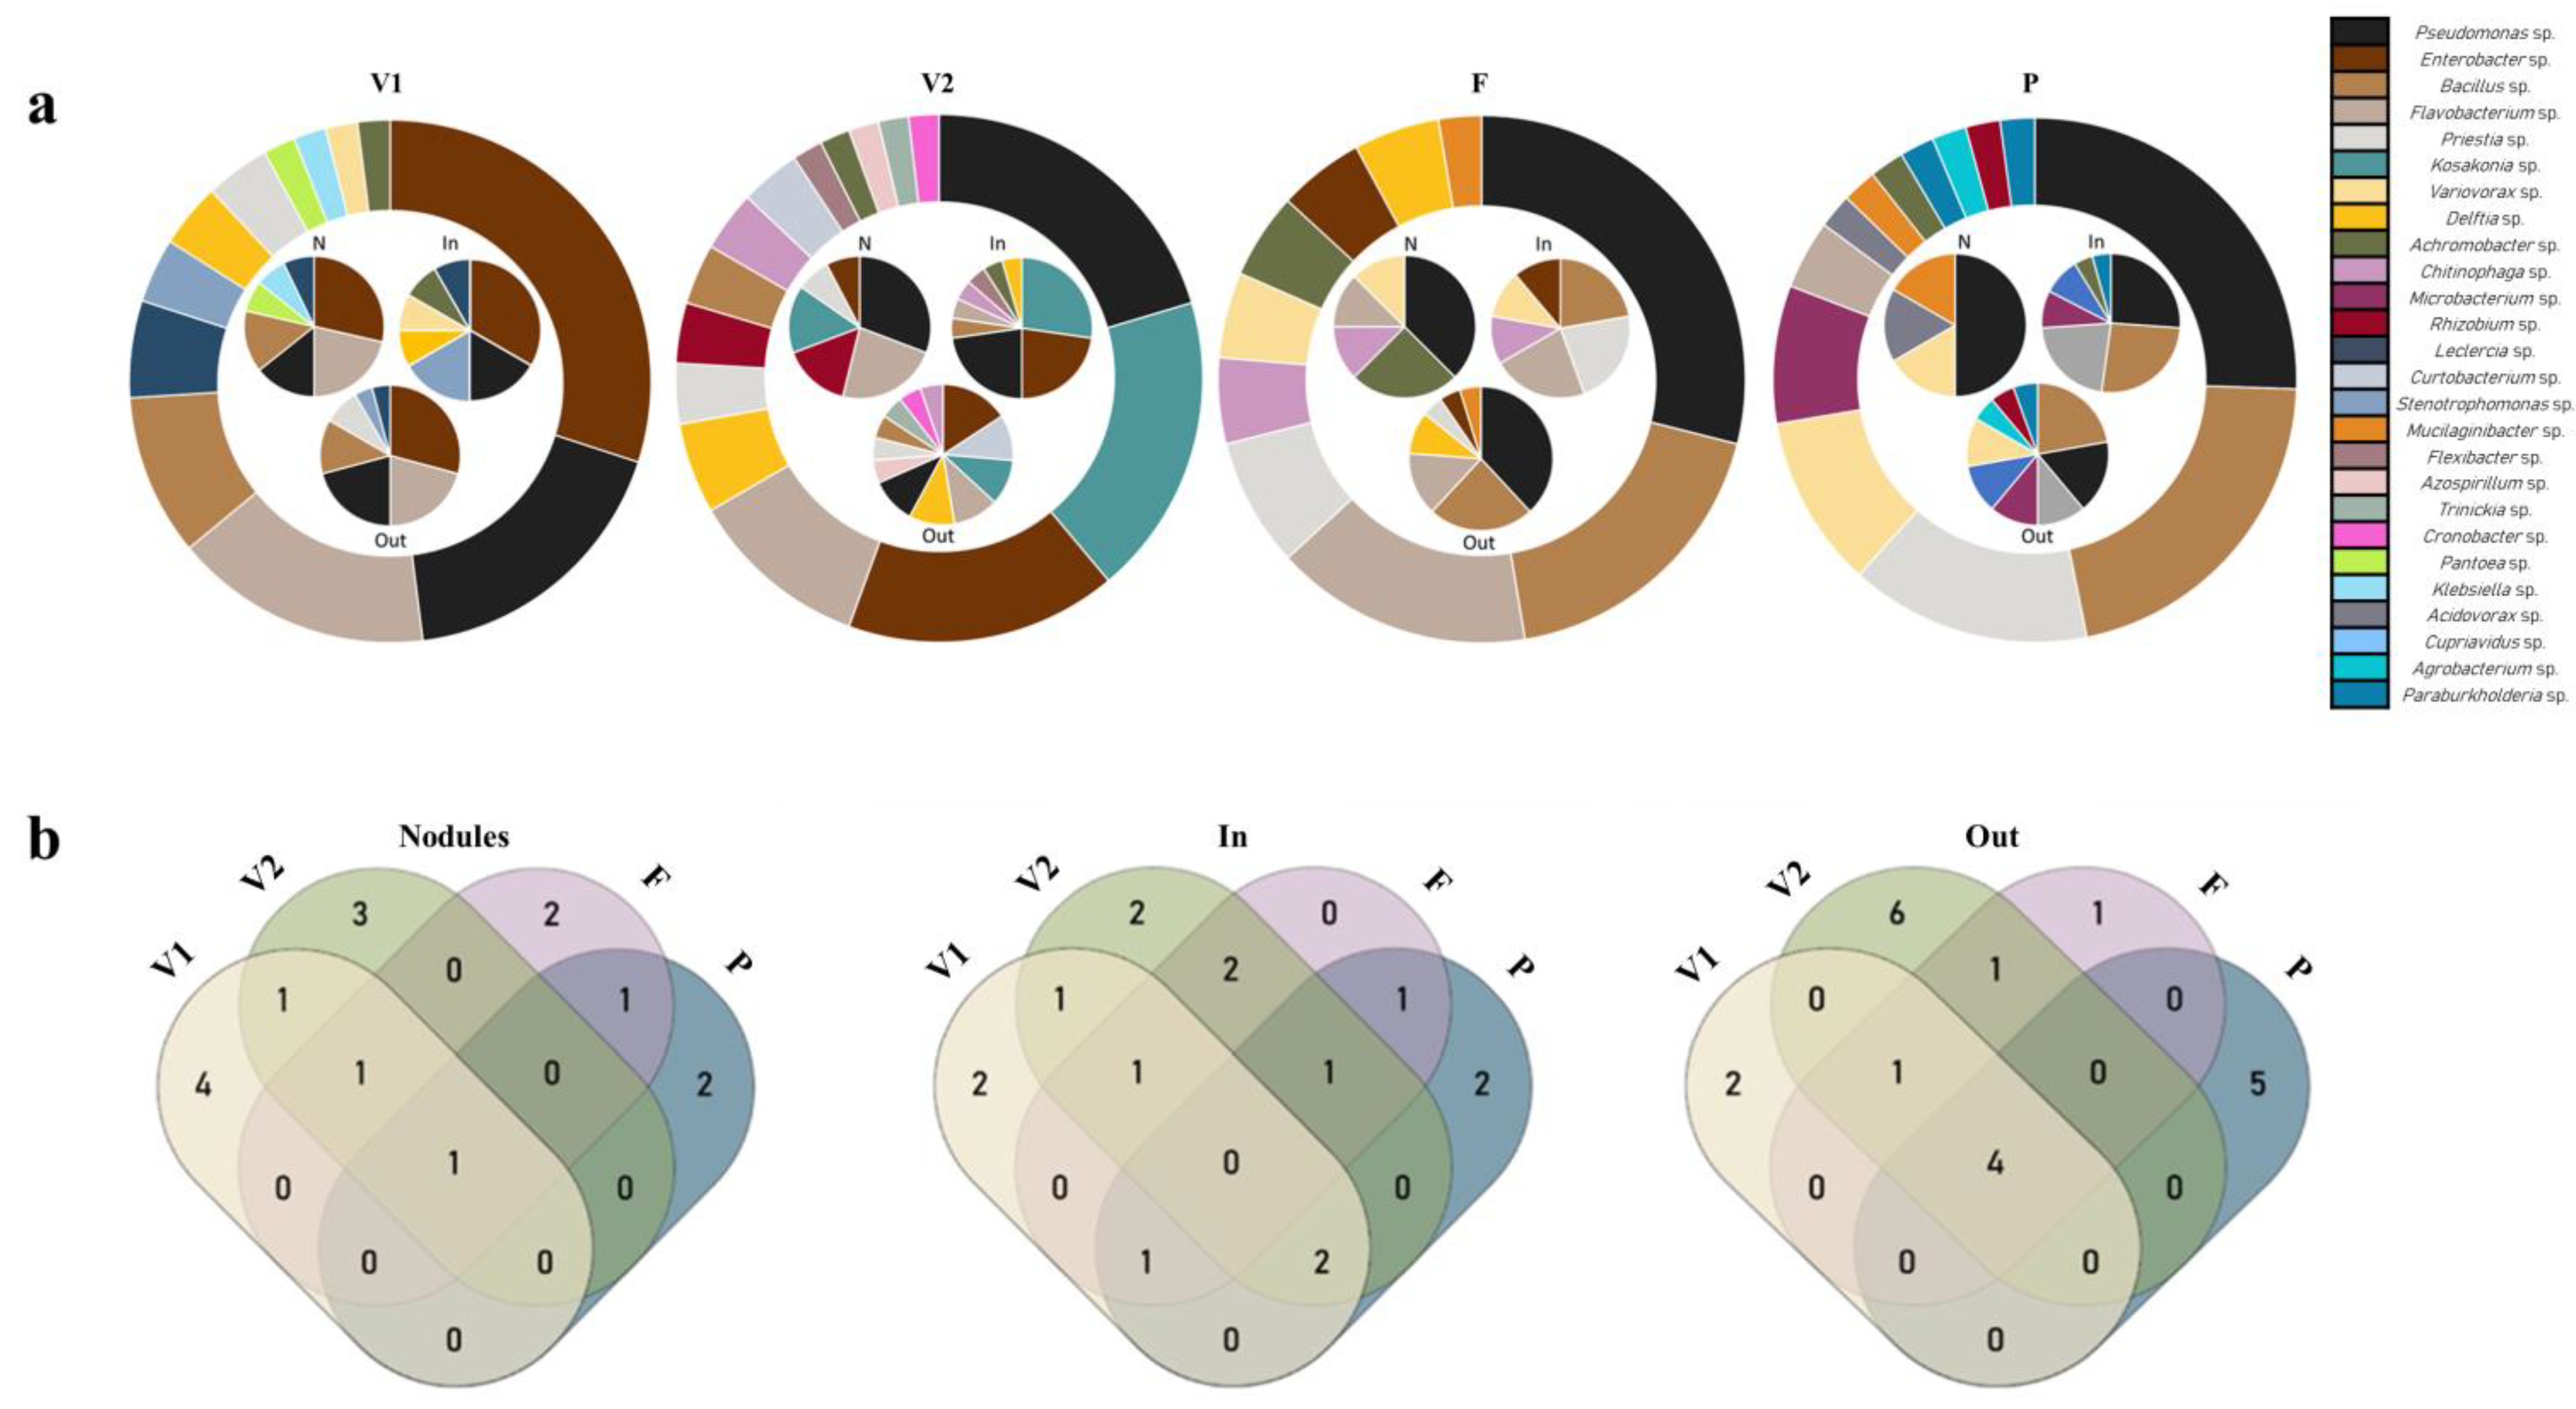
3.1.2. Diversity at Different Growth Stages
3.2. Plant Growth Promotion
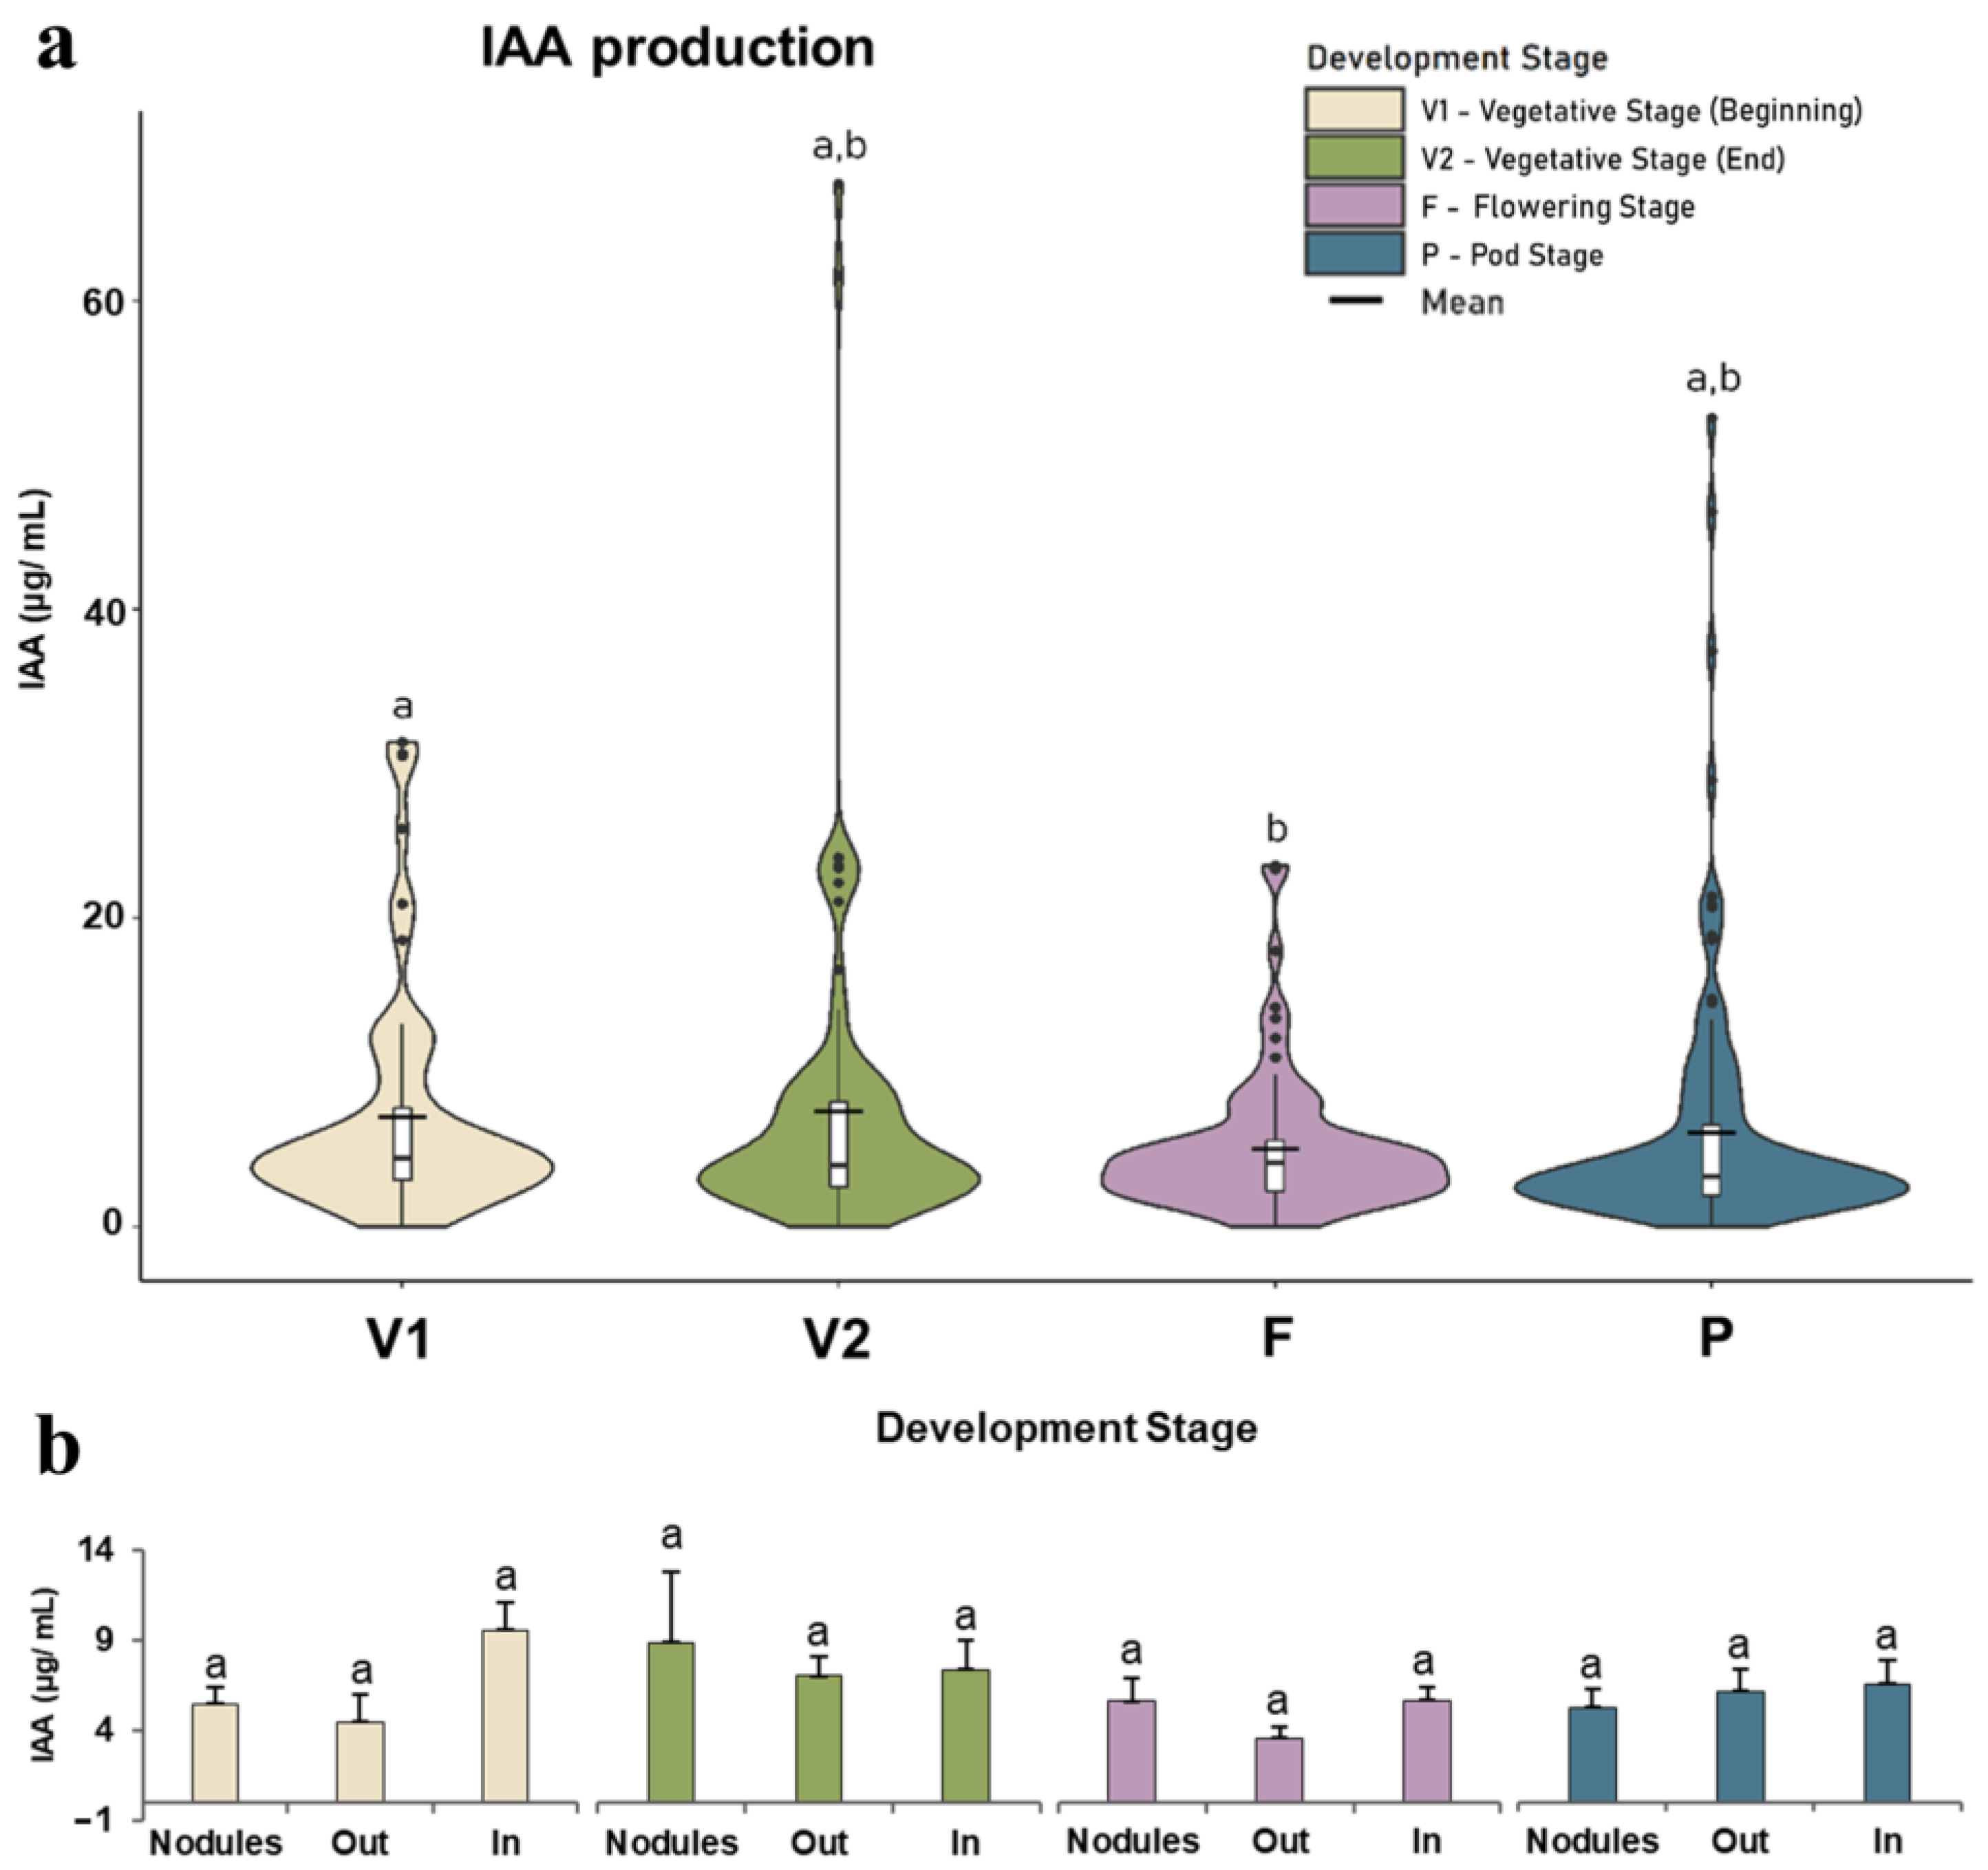
3.2.1. IAA Production
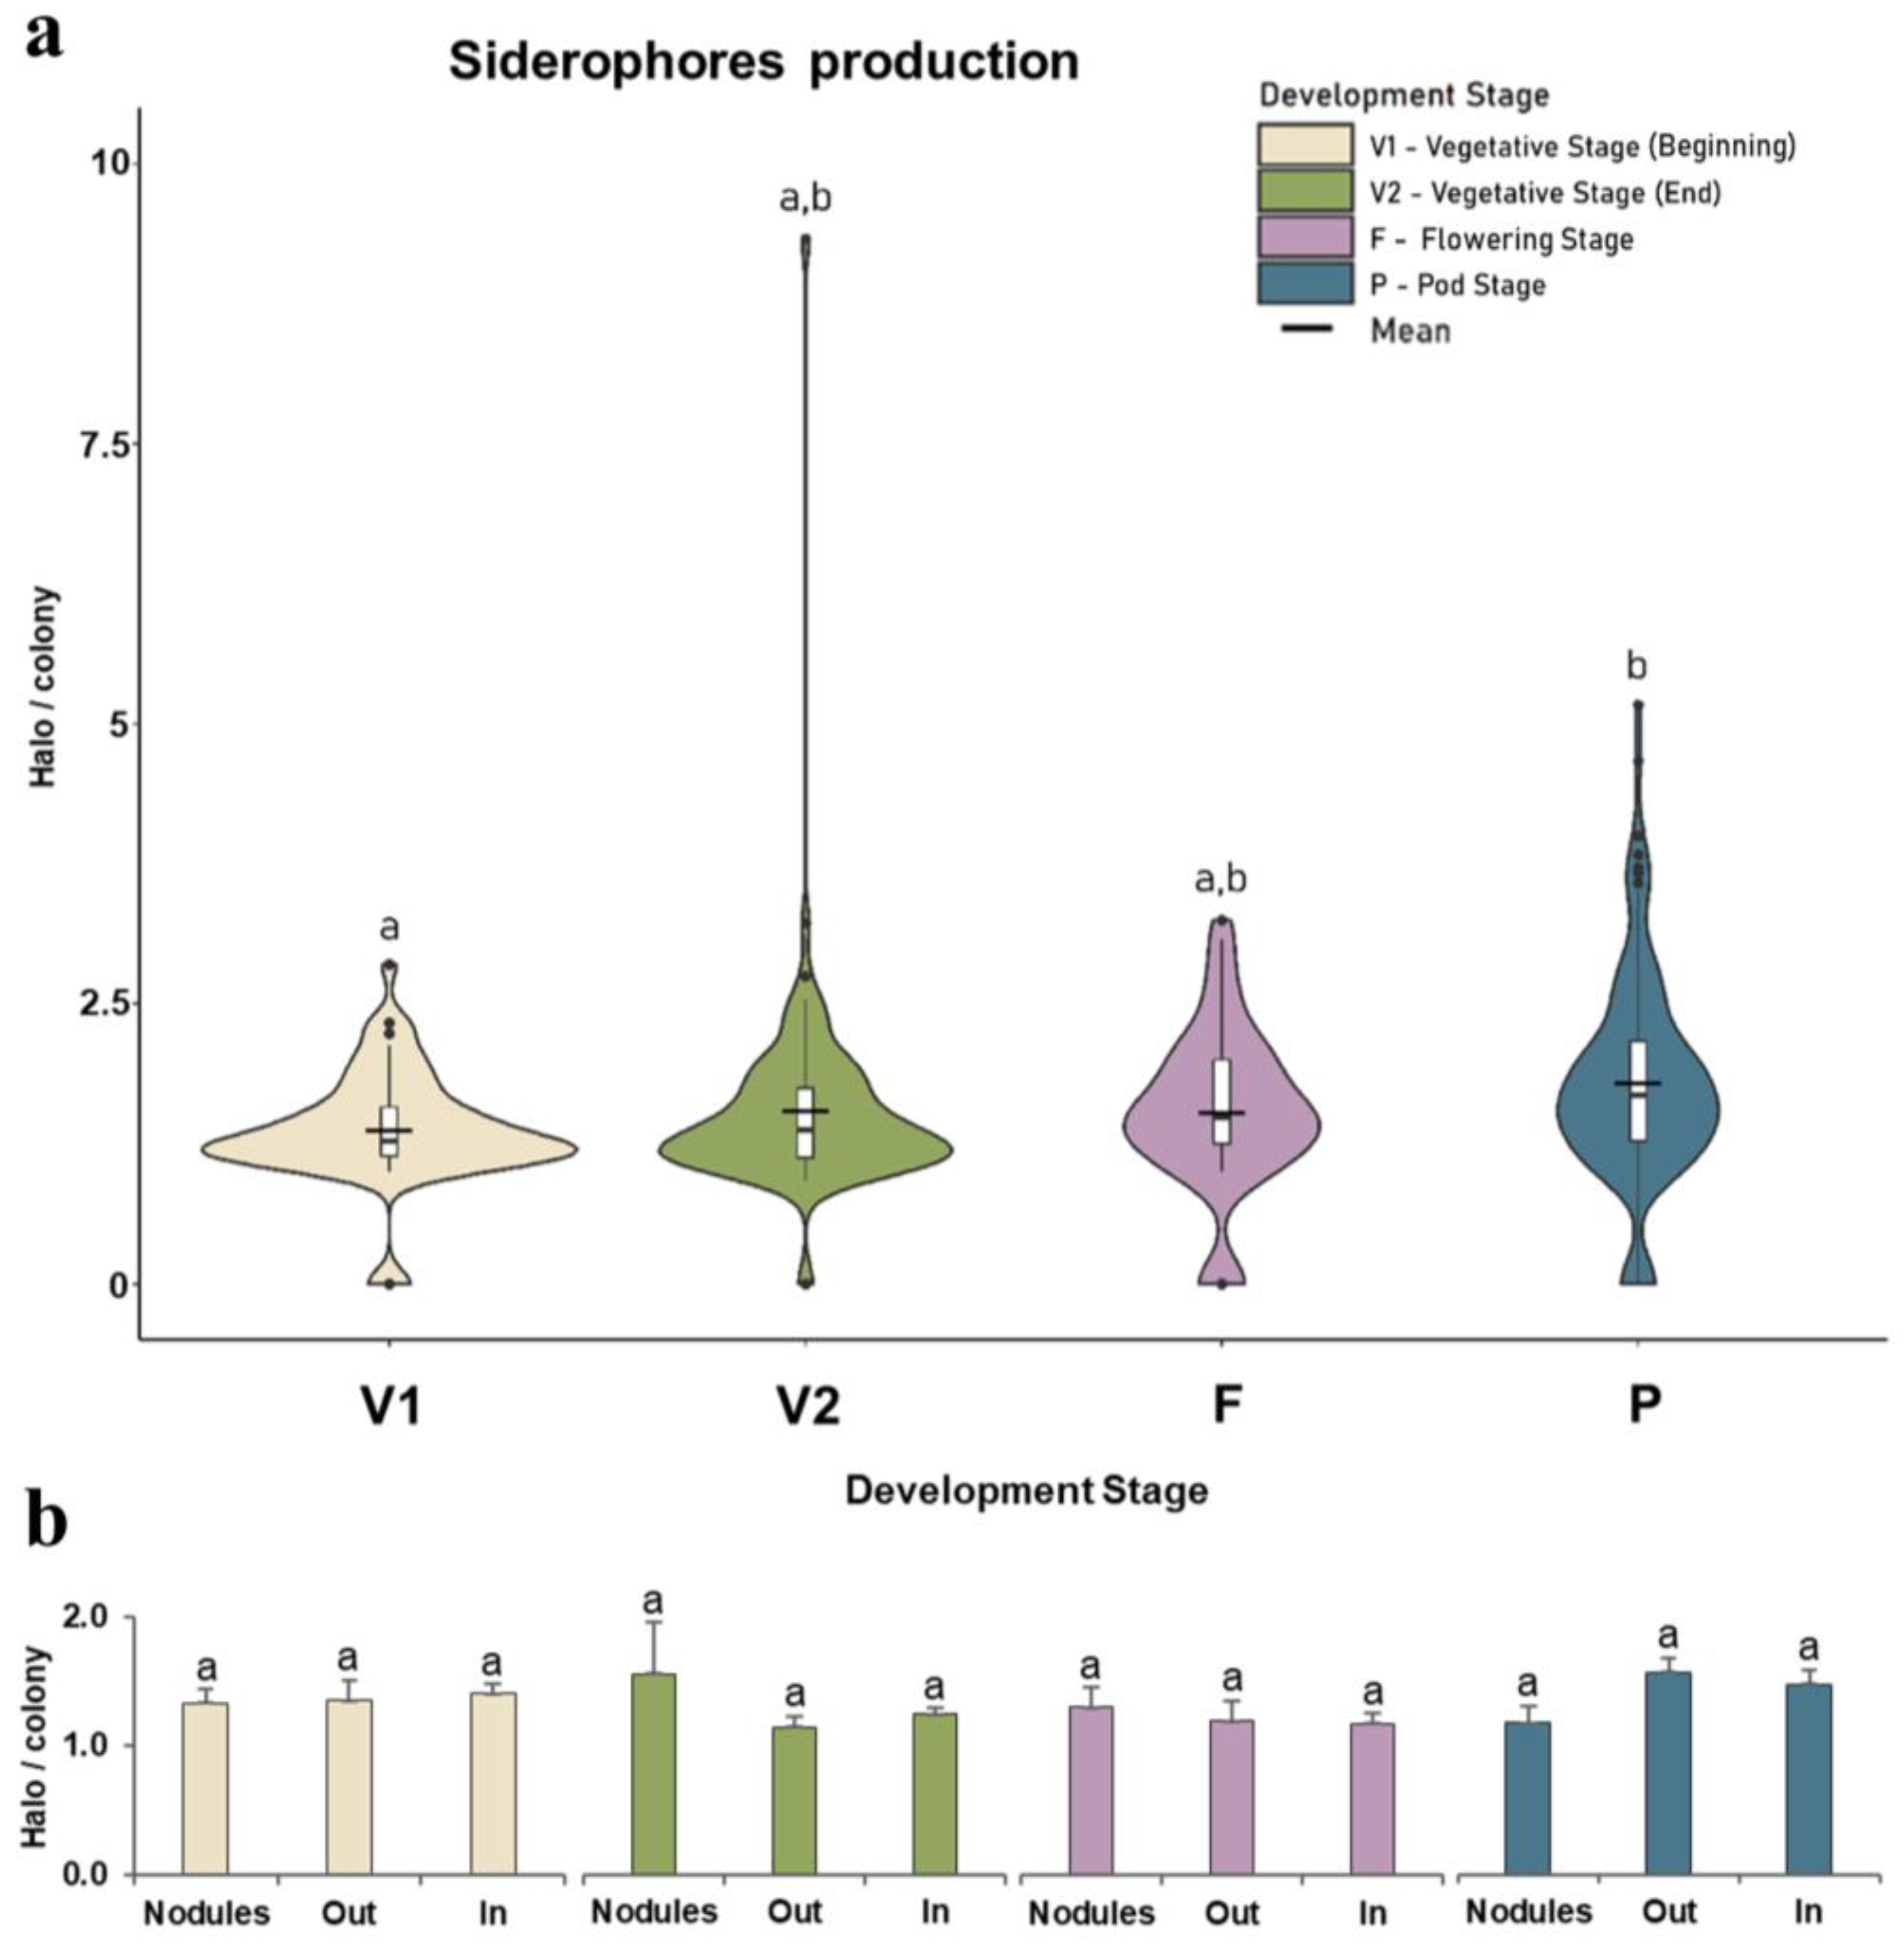
3.2.2. Siderophores
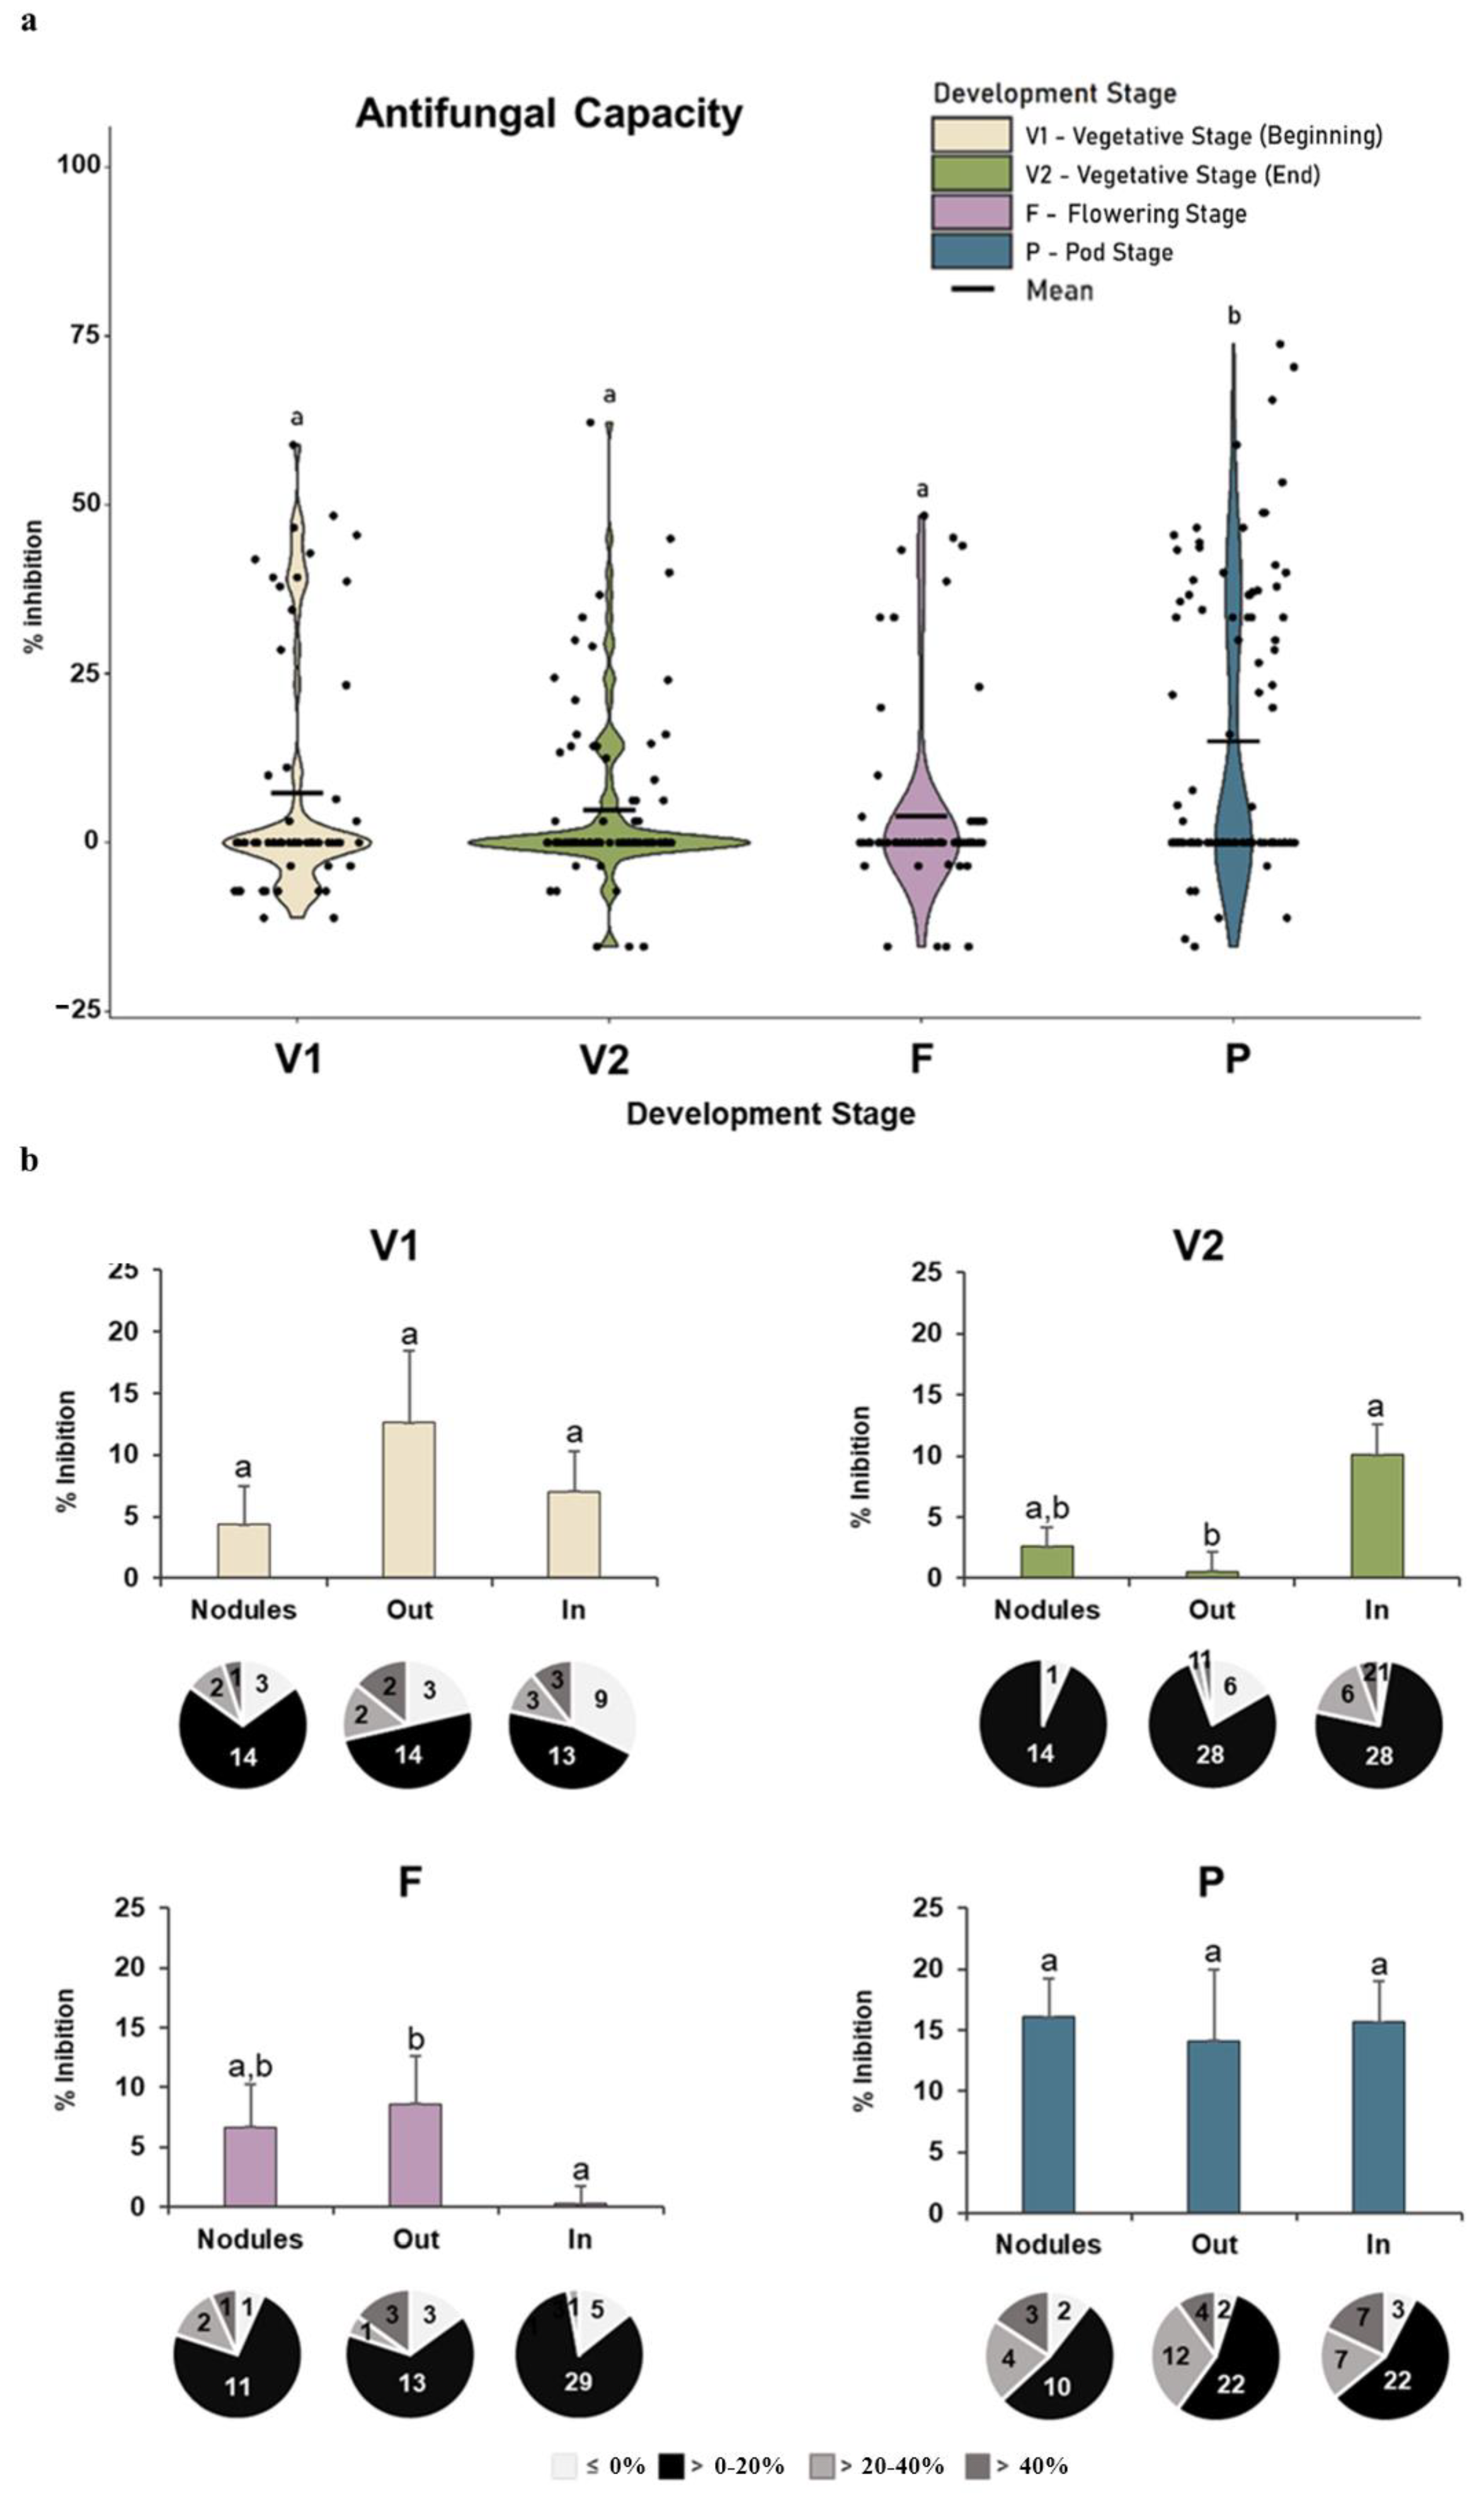
3.2.3. Antifungal Capacity
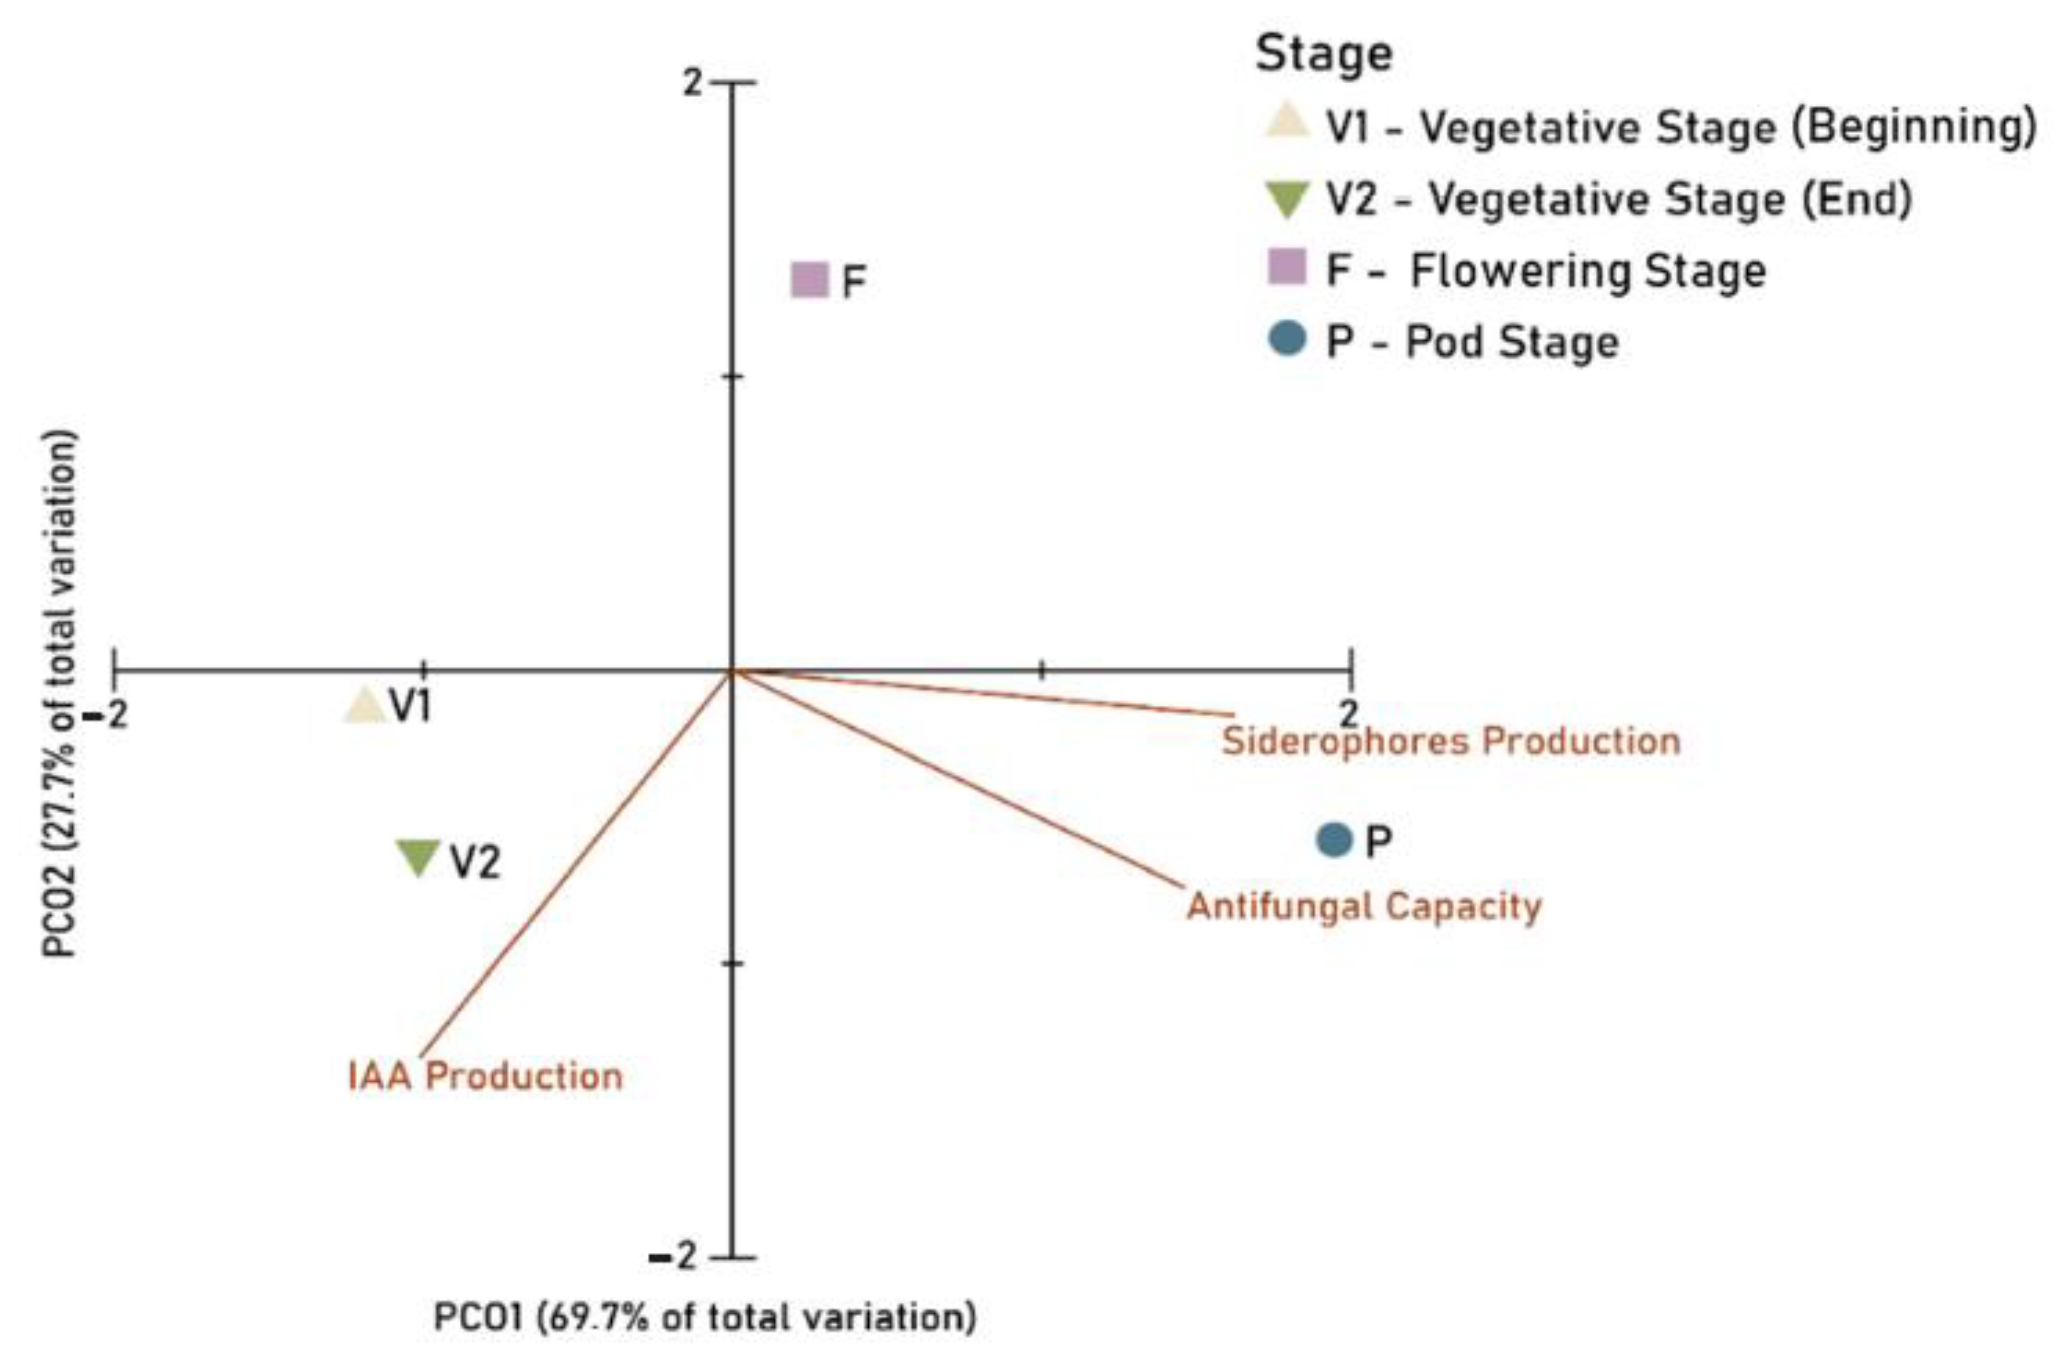
3.3. Principal Components Ordination (PCO)
4. Discussion
5. Conclusions
Supplementary Materials
Author Contributions
Funding
Institutional Review Board Statement
Informed Consent Statement
Data Availability Statement
Conflicts of Interest
References
- Vollset, S.E.; Goren, E.; Yuan, C.W.; Cao, J.; Smith, A.E.; Hsiao, T.; Bisignano, C.; Azhar, G.S.; Castro, E.; Chalek, J.; et al. Fertility, Mortality, Migration, and Population Scenarios for 195 Countries and Territories from 2017 to 2100: A Forecasting Analysis for the Global Burden of Disease Study. Lancet 2020, 396, 1285–1306. [Google Scholar] [CrossRef] [PubMed]
- Fukase, E.; Martin, W. Economic Growth, Convergence, and World Food Demand and Supply. World Dev. 2020, 132, 104954. [Google Scholar] [CrossRef]
- Hamish, F.; Tom, Q.; Clementine, O. Food Waste Index Report 2021. United Nations Environment Programme: Nairobi, Kenya, 2021; ISBN 9789280738513. [Google Scholar]
- Hernández-Guerrero, C.J.; Villa-Ruano, N.; Zepeda-Vallejo, L.G.; Hernández-Fuentes, A.D.; Ramirez-Estrada, K.; Zamudio-Lucero, S.; Hidalgo-Martínez, D.; Becerra-Martínez, E. Bean Cultivars (Phaseolus vulgaris L.) under the Spotlight of NMR Metabolomics. Food Res. Int. 2021, 150, 110805. [Google Scholar] [CrossRef] [PubMed]
- Wiesinger, J.A.; Osorno, J.M.; McClean, P.E.; Hart, J.J.; Glahn, R.P. Faster Cooking Times and Improved Iron Bioavailability Are Associated with the down Regulation of Procyanidin Synthesis in Slow-Darkening Pinto Beans (Phaseolus vulgaris L.). J. Funct. Foods 2021, 82, 104444. [Google Scholar] [CrossRef]
- Ganugi, P.; Martinelli, E.; Lucini, L. Microbial Biostimulants as a Sustainable Approach to Improve the Functional Quality in Plant-Based Foods: A Review. Curr. Opin. Food Sci. 2021, 41, 217–223. [Google Scholar] [CrossRef]
- Helaly, A.A.; Hassan, S.M.; Craker, L.E.; Mady, E. Effects of Growth-Promoting Bacteria on Growth, Yield and Nutritional Value of Collard Plants. Ann. Agric. Sci. 2020, 65, 77–82. [Google Scholar] [CrossRef]
- Zhang, J.; Cook, J.; Nearing, J.T.; Zhang, J.; Raudonis, R.; Glick, B.R.; Langille, M.G.I.; Cheng, Z. Harnessing the Plant Microbiome to Promote the Growth of Agricultural Crops. Microbiol. Res. 2021, 245, 126690. [Google Scholar] [CrossRef]
- Dolatabadian, A. Plant–Microbe Interaction. Biology 2021, 10, 15. [Google Scholar] [CrossRef]
- Glick, B.R. Bacteria with ACC Deaminase Can Promote Plant Growth and Help to Feed the World. Microbiol. Res. 2014, 169, 30–39. [Google Scholar] [CrossRef]
- Galloway, J.N.; Dentener, F.J.; Capone, D.G.; Boyer, E.W.; Howarth, R.W.; Seitzinger, S.P.; Asner, G.P.; Cleveland, C.C.; Green, P.A.; Holland, E.A.; et al. Nitrogen Cycles: Past, Present and Future. Biogeochemistry 2004, 70, 153–226. [Google Scholar] [CrossRef]
- Alaylar, B.; Egamberdieva, D.; Gulluce, M.; Karadayi, M.; Arora, N.K. Integration of Molecular Tools in Microbial Phosphate Solubilization Research in Agriculture Perspective. World J. Microbiol. Biotechnol. 2020, 36, 1–12. [Google Scholar] [CrossRef] [PubMed]
- Cardoso, P.; Santos, M.; Freitas, R.; Rocha, S.M.; Figueira, E. Response of Rhizobium to Cd Exposure: A Volatile Perspective. Environ. Pollut. 2017, 231, 802–811. [Google Scholar] [CrossRef] [PubMed]
- Ferreira, C.M.H.; Vilas-Boas, Â.; Sousa, C.A.; Soares, H.M.V.M.; Soares, E.V. Comparison of Five Bacterial Strains Producing Siderophores with Ability to Chelate Iron under Alkaline Conditions. AMB Express 2019, 9, 78. [Google Scholar] [CrossRef] [PubMed] [Green Version]
- Jiang, H.; Qi, P.; Wang, T.; Chi, X.; Wang, M.; Chen, M.; Chen, N.; Pan, L. Role of Halotolerant Phosphate-Solubilising Bacteria on Growth Promotion of Peanut (Arachis hypogaea) under Saline Soil. Ann. Appl. Biol. 2019, 174, 20–30. [Google Scholar] [CrossRef] [Green Version]
- Chi, Z.; Wang, Y.; Deng, Q.; Zhang, H.; Pan, C.; Yang, Z. Endogenous Phytohormones and the Expression of Flowering Genes Synergistically Induce Flowering in Loquat. J. Integr. Agric. 2020, 19, 2247–2256. [Google Scholar] [CrossRef]
- Etesami, H.; Alikhani, H.A.; Hosseini, H.M. Indole-3-Acetic Acid (IAA) Production Trait, a Useful Screening to Select Endophytic and Rhizosphere Competent Bacteria for Rice Growth Promoting Agents. MethodsX 2015, 2, 72–78. [Google Scholar] [CrossRef]
- Kim, J.S.; Ezura, K.; Lee, J.; Kojima, M.; Takebayashi, Y.; Sakakibara, H.; Ariizumi, T.; Ezura, H. The Inhibition of SlIAA9 Mimics an Increase in Endogenous Auxin and Mediates Changes in Auxin and Gibberellin Signalling during Parthenocarpic Fruit Development in Tomato. J. Plant Physiol. 2020, 252, 153238. [Google Scholar] [CrossRef]
- Liu, N. Effects of IAA and ABA on the Immature Peach Fruit Development Process. Hortic. Plant J. 2019, 5, 145–154. [Google Scholar] [CrossRef]
- Roskova, Z.; Skarohlid, R.; McGachy, L. Siderophores: An Alternative Bioremediation Strategy? Sci. Total Environ. 2022, 819, 153144. [Google Scholar] [CrossRef]
- Harrison, P.M.; Arosio, P. The Ferritins: Molecular Properties, Iron Storage Function and Cellular Regulation. Biochim. Biophys. Acta Bioenerg. 1996, 1275, 161–203. [Google Scholar] [CrossRef]
- Kumar, D.; Punetha, A.; Verma, P.P.S.; Padalia, R.C. Micronutrient Based Approach to Increase Yield and Quality of Essential Oil in Aromatic Crops. J. Appl. Res. Med. Aromat. Plants 2022, 26, 100361. [Google Scholar] [CrossRef]
- Nazarov, P.A.; Baleev, D.N.; Ivanova, M.I.; Sokolova, L.M.; Karakozova, M.V. Infectious Plant Diseases: Etiology, Current Status, Problems and Prospects in Plant Protection. Acta Nat. 2020, 12, 46–59. [Google Scholar] [CrossRef]
- Abbey, J.A.; Percival, D.; Asiedu, S.K.; Prithiviraj, B.; Schilder, A. Management of Botrytis Blossom Blight in Wild Blueberries by Biological Control Agents under Field Conditions. Crop Prot. 2020, 131, 105078. [Google Scholar] [CrossRef]
- Somasegaran, P.; Hoben, H.J. Handbook for Rhizobia; Springer Laboratory: New York, NY, USA, 1994; ISBN 9781461383758. [Google Scholar]
- Versalovic, J.; Schneider, G.M.; De Bruijn, F.; Lupski, J.R. Genomic Fingerprinting of Bacteria Using Repetitive Sequence-Based Polymerase Chain Reaction. Methods Mol. Cell Biol. 1994, 5, 25–40. [Google Scholar]
- Cardoso, P.; Alves, A.; Silveira, P.; Sá, C.; Fidalgo, C.; Freitas, R.; Figueira, E. Bacteria from Nodules of Wild Legume Species: Phylogenetic Diversity, Plant Growth Promotion Abilities and Osmotolerance. Sci. Total Environ. 2018, 645, 1094–1102. [Google Scholar] [CrossRef] [PubMed]
- Lane, D.J. 16S/23S RRNA Sequencing. Nucleic Acid Tech. Bact. Syst. 1991, 125, 115–175. [Google Scholar]
- Alexander, B.; Zuberer, D.A. Use of chrome azurol S reagents to evaluate siderophore production by rhizosphere bacteria. Biol Fertl Soils 1991, 12, 39–45. [Google Scholar] [CrossRef]
- Asghar, H.N.; Zahir, Z.A.; Arshad, M.; Khaliq, A. Relationship between in Vitro Production of Auxins by Rhizobacteria and Their Growth-Promoting Activities in Brassica juncea L. Biol. Fertil. Soils 2002, 35, 231–237. [Google Scholar] [CrossRef]
- Montenegro, O.; Gonz, P. Diseases Caused by Fungi and Fungus-Like Organisms. Plant Dis. 2021, 105, 2725. [Google Scholar]
- Anderson, M.J. Permutational Multivariate Analysis of Variance ( PERMANOVA). Wiley StatsRef Stat. Ref. Online 2017, 1–15. [Google Scholar] [CrossRef]
- Anderson, M.J.; Walsh, D.C.I. PERMANOVA, ANOSIM, and the Mantel Test in the Face of Heterogeneous Dispersions: What Null Hypothesis Are You Testing? Ecol. Monogr. 2013, 83, 557–574. [Google Scholar] [CrossRef]
- Jeewani, P.H.; Gunina, A.; Tao, L.; Zhu, Z.; Kuzyakov, Y.; Van Zwieten, L.; Guggenberger, G.; Shen, C.; Yu, G.; Singh, B.P.; et al. Rusty Sink of Rhizodeposits and Associated Keystone Microbiomes. Soil Biol. Biochem. 2020, 147, 107840. [Google Scholar] [CrossRef]
- Chaparro, J.M.; Badri, D.V.; Vivanco, J.M. Rhizosphere Microbiome Assemblage Is Affected by Plant Development. ISME J. 2014, 8, 790–803. [Google Scholar] [CrossRef] [PubMed]
- Santos-Medellín, C.; Liechty, Z.; Edwards, J.; Nguyen, B.; Huang, B.; Weimer, B.C.; Sundaresan, V. Prolonged Drought Imparts Lasting Compositional Changes to the Rice Root Microbiome. Nat. Plants 2021, 7, 1065–1077. [Google Scholar] [CrossRef]
- Bashan, Y.; Kamnev, A.A.; de-Bashan, L.E. A Proposal for Isolating and Testing Phosphate-Solubilizing Bacteria That Enhance Plant Growth. Biol. Fertil. Soils 2013, 49, 1–2. [Google Scholar] [CrossRef]
- Bergottini, V.M.; Filippidou, S.; Junier, T.; Johnson, S.; Chain, P.S.; Otegui, M.B.; Zapata, P.D.; Junier, P. Genome Sequence of Kosakonia radicincitans Strain YD4, a Plant Growth-Promoting Rhizobacterium Isolated from Yerba Mate (Ilex paraguariensis St. Hill.). Genome Announc. 2016, 3, 6964. [Google Scholar] [CrossRef] [Green Version]
- Glick, B.R. Plant Growth-Promoting Bacteria: Mechanisms and Applications. Scientifica 2012, 2012, 963401. [Google Scholar] [CrossRef] [Green Version]
- Sasse, J.; Martinoia, E.; Northen, T. Feed Your Friends: Do Plant Exudates Shape the Root Microbiome? Trends Plant Sci. 2018, 23, 25–41. [Google Scholar] [CrossRef] [Green Version]
- Abdel-Rahman, H.M.; Salem, A.A.; Moustafa, M.M.A.; El-Garhy, H.A.S. A Novice Achromobacter sp. EMCC1936 Strain Acts as a Plant-Growth-Promoting Agent. Acta Physiol. Plant. 2017, 39, 61. [Google Scholar] [CrossRef]
- Sun, S.; Yang, W.; Fang, W.; Zhao, Y.; Guo, L.; Dai, Y. The Plant Growth-Promoting Rhizobacterium Variovorax boronicumulans CGMCC 4969 Regulates the Level of Indole-3-Acetic Acid Synthesized from Indole-3-Acetonitrile. Appl Environ Microbiol. 2018, 84, 1–14. [Google Scholar] [CrossRef] [Green Version]
- Prasannakumar, S.P.; Gowtham, H.G.; Hariprasad, P.; Shivaprasad, K.; Niranjana, S.R. Delftia tsuruhatensis WGR-UOM-BT1, a Novel Rhizobacterium with PGPR Properties from Rauwolfia serpentina (L.) Benth. Ex Kurz Also Suppresses Fungal Phytopathogens by Producing a New Antibiotic-AMTM. Lett. Appl. Microbiol. 2015, 61, 460–468. [Google Scholar] [CrossRef] [PubMed]
- Whipps, J.M. Microbial Interactions and Biocontrol in the Rhizosphere. J. Exp. Bot. 2001, 52, 487–511. [Google Scholar] [CrossRef] [PubMed]
- Kaushalya Madhavi, B.G.; Khan, F.; Bhujel, A.; Jaihuni, M.; Kim, N.E.; Moon, B.E.; Kim, H.T. Influence of Different Growing Media on the Growth and Development of Strawberry Plants. Heliyon 2021, 7, e07170. [Google Scholar] [CrossRef] [PubMed]
- Santoyo, G. How Plants Recruit Their Microbiome? New Insights into Beneficial Interactions. J. Adv. Res. 2021, 40, 45–58. [Google Scholar] [CrossRef]
- Barber, S.A. Root Growth and Nutrient Uptake. American Society of Agronomy: Madison, WI, USA, 2015; Volume 8, pp. 95–99. ISBN 9780891182467. [Google Scholar]
- Das, K.; Prasanna, R.; Saxena, A.K. Rhizobia: A Potential Biocontrol Agent for Soilborne Fungal Pathogens. Folia Microbiol. (Praha) 2017, 62, 425–435. [Google Scholar] [CrossRef] [PubMed]
- Deepika, K.V.; Ramu Sridhar, P.; Bramhachari, P.V. Characterization and Antifungal Properties of Rhamnolipids Produced by Mangrove Sediment Bacterium Pseudomonas aeruginosa Strain KVD-HM52. Biocatal. Agric. Biotechnol. 2015, 4, 608–615. [Google Scholar] [CrossRef]
- Gotor-Vila, A.; Teixidó, N.; Di Francesco, A.; Usall, J.; Ugolini, L.; Torres, R.; Mari, M. Antifungal Effect of Volatile Organic Compounds Produced by Bacillus amyloliquefaciens CPA-8 against Fruit Pathogen Decays of Cherry. Food Microbiol. 2017, 64, 219–225. [Google Scholar] [CrossRef] [Green Version]
- Marfetán, J.A.; Greslebin, A.G.; Taccari, L.E.; Vélez, M.L. Rhizospheric Microorganisms as Potential Biocontrol Agents against Phytophthora austrocedri. Eur. J. Plant Pathol. 2020, 158, 721–732. [Google Scholar] [CrossRef]
- Savi, D.C.; Shaaban, K.A.; Gos, F.M.W.; Thorson, J.S.; Glienke, C.; Rohr, J. Secondary Metabolites Produced by Microbacterium sp. LGMB471 with Antifungal Activity against the Phytopathogen Phyllosticta citricarpa. Folia Microbiol. (Praha) 2018, 453–460. [Google Scholar] [CrossRef]
- Tian, D.; Song, X.; Li, C.; Zhou, W.; Qin, L.; Wei, L.; Di, W.; Huang, S.; Li, B.; Huang, Q.; et al. Antifungal Mechanism of Bacillus amyloliquefaciens Strain GKT04 against Fusarium Wilt Revealed Using Genomic and Transcriptomic Analyses. Microbiologyopen 2021, 10, e1192. [Google Scholar] [CrossRef]
- Wu, X.J.; Wang, G.L.; Song, X.; Xu, Z.S.; Wang, F.; Xiong, A.S. Regulation of Auxin Accumulation and Perception at Different Developmental Stages in Carrot. Plant Growth Regul. 2016, 80, 243–251. [Google Scholar] [CrossRef]
- Souza, J.A.; Bettoni, J.C.; Costa, M.D.; Baldissera, T.C.; dos Passos, J.F.M.; Primieri, S. In Vitro Rooting and Acclimatization of ‘Marubakaido’ Apple Rootstock Using Indole-3-Acetic Acid from Rhizobacteria. Commun. Plant Sci. 2022, 12, 16–23. [Google Scholar] [CrossRef]
- Biedendieck, R.; Knuuti, T.; Moore, S.J.; Jahn, D. The “Beauty in the Beast”—The Multiple Uses of Priestia megaterium in Biotechnology. Appl. Microbiol. Biotechnol. 2021, 105, 5719–5737. [Google Scholar] [CrossRef] [PubMed]
- Carolina, K.K.; de Santi Ferrara, F.I.; Eny, I.S.F.; Marcos, P.M.A.; Heloiza, R.B. Sugarcane Growth Promotion by Kosakonia sp. ICB117 an Endophytic and Diazotrophic Bacterium. African J. Microbiol. Res. 2018, 12, 105–114. [Google Scholar] [CrossRef] [Green Version]
- Chaudhary, T.; Yadav, D.; Chhabra, D.; Gera, R.; Shukla, P. Low-Cost Media Engineering for Phosphate and IAA Production by Kosakonia pseudosacchari TCPS-4 Using Multi-Objective Genetic Algorithm (MOGA) Statistical Tool. 3 Biotech 2021, 11, 1–11. [Google Scholar] [CrossRef]
- Corsini, A.; Colombo, M.; Gardana, C.; Zecchin, S.; Simonetti, P.; Cavalca, L. Characterization of As(III) Oxidizing Achromobacter sp. Strain N2: Effects on Arsenic Toxicity and Translocation in Rice. Ann. Microbiol. 2018, 68, 295–304. [Google Scholar] [CrossRef]
- Eid, A.M.; Fouda, A.; Abdel-rahman, M.A.; Salem, S.S.; Elsaied, A.; Oelmüller, R.; Hijri, M.; Bhowmik, A.; Elkelish, A.; El-Din Hassan, S. Harnessing Bacterial Endophytes for Promotion of Plant Growth and Biotechnological Applications: An Overview. Plants 2021, 10, 935. [Google Scholar] [CrossRef]
- Kang, S.M.; Shahzad, R.; Bilal, S.; Khan, A.L.; Park, Y.G.; Lee, K.E.; Asaf, S.; Khan, M.A.; Lee, I.J. Indole-3-Acetic-Acid and ACC Deaminase Producing Leclercia adecarboxylata MO1 Improves Solanum lycopersicum L. Growth and Salinity Stress Tolerance by Endogenous Secondary Metabolites Regulation. BMC Microbiol. 2019, 19, 80. [Google Scholar] [CrossRef] [Green Version]
- Lebrazi, S.; Fadil, M.; Chraibi, M.; Fikri-Benbrahim, K. Screening and Optimization of Indole-3-Acetic Acid Production by Rhizobium sp. Strain Using Response Surface Methodology. J. Genet. Eng. Biotechnol. 2020, 18, 21. [Google Scholar] [CrossRef]
- Singh, V.K.; Singh, A.K.; Singh, P.P.; Kumar, A. Interaction of Plant Growth Promoting Bacteria with Tomato under Abiotic Stress: A Review. Agric. Ecosyst. Environ. 2018, 267, 129–140. [Google Scholar] [CrossRef]
- Snak, A.; Vendruscolo, E.C.G.; Dos Santos, M.F.; Fiorini, A.; Mesa, D. Genome Sequencing and Analysis of Plant Growth-Promoting Attributes from Leclercia adecarboxylata. Genet. Mol. Biol. 2021, 44, 44. [Google Scholar] [CrossRef] [PubMed]
- Vimal, S.R.; Patel, V.K.; Singh, J.S. Plant Growth Promoting Curtobacterium albidum Strain SRV4: An Agriculturally Important Microbe to Alleviate Salinity Stress in Paddy Plants. Ecol. Indic. 2019, 105, 553–562. [Google Scholar] [CrossRef]
- Uheda, E.; Syono, K. Physiological Role of Leghaemoglobin Heterogeneity in Pea Root Nodule Development. Plant Cell Physiol. 1982, 23, 75–84. [Google Scholar] [CrossRef]
- Ivleva, N.B.; Groat, J.; Staub, J.M.; Stephens, M. Expression of Active Subunit of Nitrogenase via Integration into Plant Organelle Genome. PLoS ONE 2016, 11, e0160951. [Google Scholar] [CrossRef] [Green Version]
- Rai, S.; Singh, P.K.; Mankotia, S.; Swain, J.; Satbhai, S.B. Iron Homeostasis in Plants and Its Crosstalk with Copper, Zinc, and Manganese. Plant Stress 2021, 1, 100008. [Google Scholar] [CrossRef]
- Berraho, E.L.; Lesueur, D.; Diem, H.G.; Sasson, A. Iron Requirement and Siderophore Production in Rhizobium ciceri during Growth on an Iron-Deficient Medium. World J. Microbiol. Biotechnol. 1997, 13, 501–510. [Google Scholar] [CrossRef]
- Lambrese, Y.; Guiñez, M.; Calvente, V.; Sansone, G.; Cerutti, S.; Raba, J.; Sanz, M.I. Production of Siderophores by the Bacterium Kosakonia radicincitans and Its Application to Control of Phytopathogenic Fungi. Bioresour. Technol. Reports 2018, 3, 82–87. [Google Scholar] [CrossRef] [Green Version]
- Lurthy, T.; Cantat, C.; Jeudy, C.; Declerck, P.; Gallardo, K.; Barraud, C.; Leroy, F.; Ourry, A.; Lemanceau, P.; Salon, C.; et al. Impact of Bacterial Siderophores on Iron Status and Ionome in Pea. Front. Plant Sci. 2020, 11, 730. [Google Scholar] [CrossRef] [PubMed]
- Pérez-Miranda, S.; Cabirol, N.; George-Téllez, R.; Zamudio-Rivera, L.S.; Fernández, F.J. O-CAS, a Fast and Universal Method for Siderophore Detection. J. Microbiol. Methods 2007, 70, 127–131. [Google Scholar] [CrossRef]
- Santos, S.; Neto, I.F.F.; Machado, M.D.; Soares, H.M.V.M.; Soares, E.V. Siderophore Production by Bacillus megaterium: Effect of Growth Phase and Cultural Conditions. Appl. Biochem. Biotechnol. 2014, 172, 549–560. [Google Scholar] [CrossRef] [Green Version]
- Vindeirinho, J.M.; Soares, H.M.V.M.; Soares, E.V. Modulation of Siderophore Production by Pseudomonas fluorescens Through the Manipulation of the Culture Medium Composition. Appl. Biochem. Biotechnol. 2021, 193, 607–618. [Google Scholar] [CrossRef] [PubMed]
- Yu, X.; Ai, C.; Xin, L.; Zhou, G. The Siderophore-Producing Bacterium, Bacillus subtilis CAS15, Has a Biocontrol Effect on Fusarium Wilt and Promotes the Growth of Pepper. Eur. J. Soil Biol. 2011, 47, 138–145. [Google Scholar] [CrossRef]


Disclaimer/Publisher’s Note: The statements, opinions and data contained in all publications are solely those of the individual author(s) and contributor(s) and not of MDPI and/or the editor(s). MDPI and/or the editor(s) disclaim responsibility for any injury to people or property resulting from any ideas, methods, instructions or products referred to in the content. |
© 2022 by the authors. Licensee MDPI, Basel, Switzerland. This article is an open access article distributed under the terms and conditions of the Creative Commons Attribution (CC BY) license (https://creativecommons.org/licenses/by/4.0/).
Share and Cite
Rocha, R.; Lopes, T.; Fidalgo, C.; Alves, A.; Cardoso, P.; Figueira, E. Bacteria Associated with the Roots of Common Bean (Phaseolus vulgaris L.) at Different Development Stages: Diversity and Plant Growth Promotion. Microorganisms 2023, 11, 57. https://doi.org/10.3390/microorganisms11010057
Rocha R, Lopes T, Fidalgo C, Alves A, Cardoso P, Figueira E. Bacteria Associated with the Roots of Common Bean (Phaseolus vulgaris L.) at Different Development Stages: Diversity and Plant Growth Promotion. Microorganisms. 2023; 11(1):57. https://doi.org/10.3390/microorganisms11010057
Chicago/Turabian StyleRocha, Ricardo, Tiago Lopes, Cátia Fidalgo, Artur Alves, Paulo Cardoso, and Etelvina Figueira. 2023. "Bacteria Associated with the Roots of Common Bean (Phaseolus vulgaris L.) at Different Development Stages: Diversity and Plant Growth Promotion" Microorganisms 11, no. 1: 57. https://doi.org/10.3390/microorganisms11010057