
ecBSU1: A Genome-Scale Enzyme-Constrained Model of Bacillus subtilis Based on the ECMpy Workflow
 , , ,
, , , 
Abstract
:1. Introduction
2. Methods
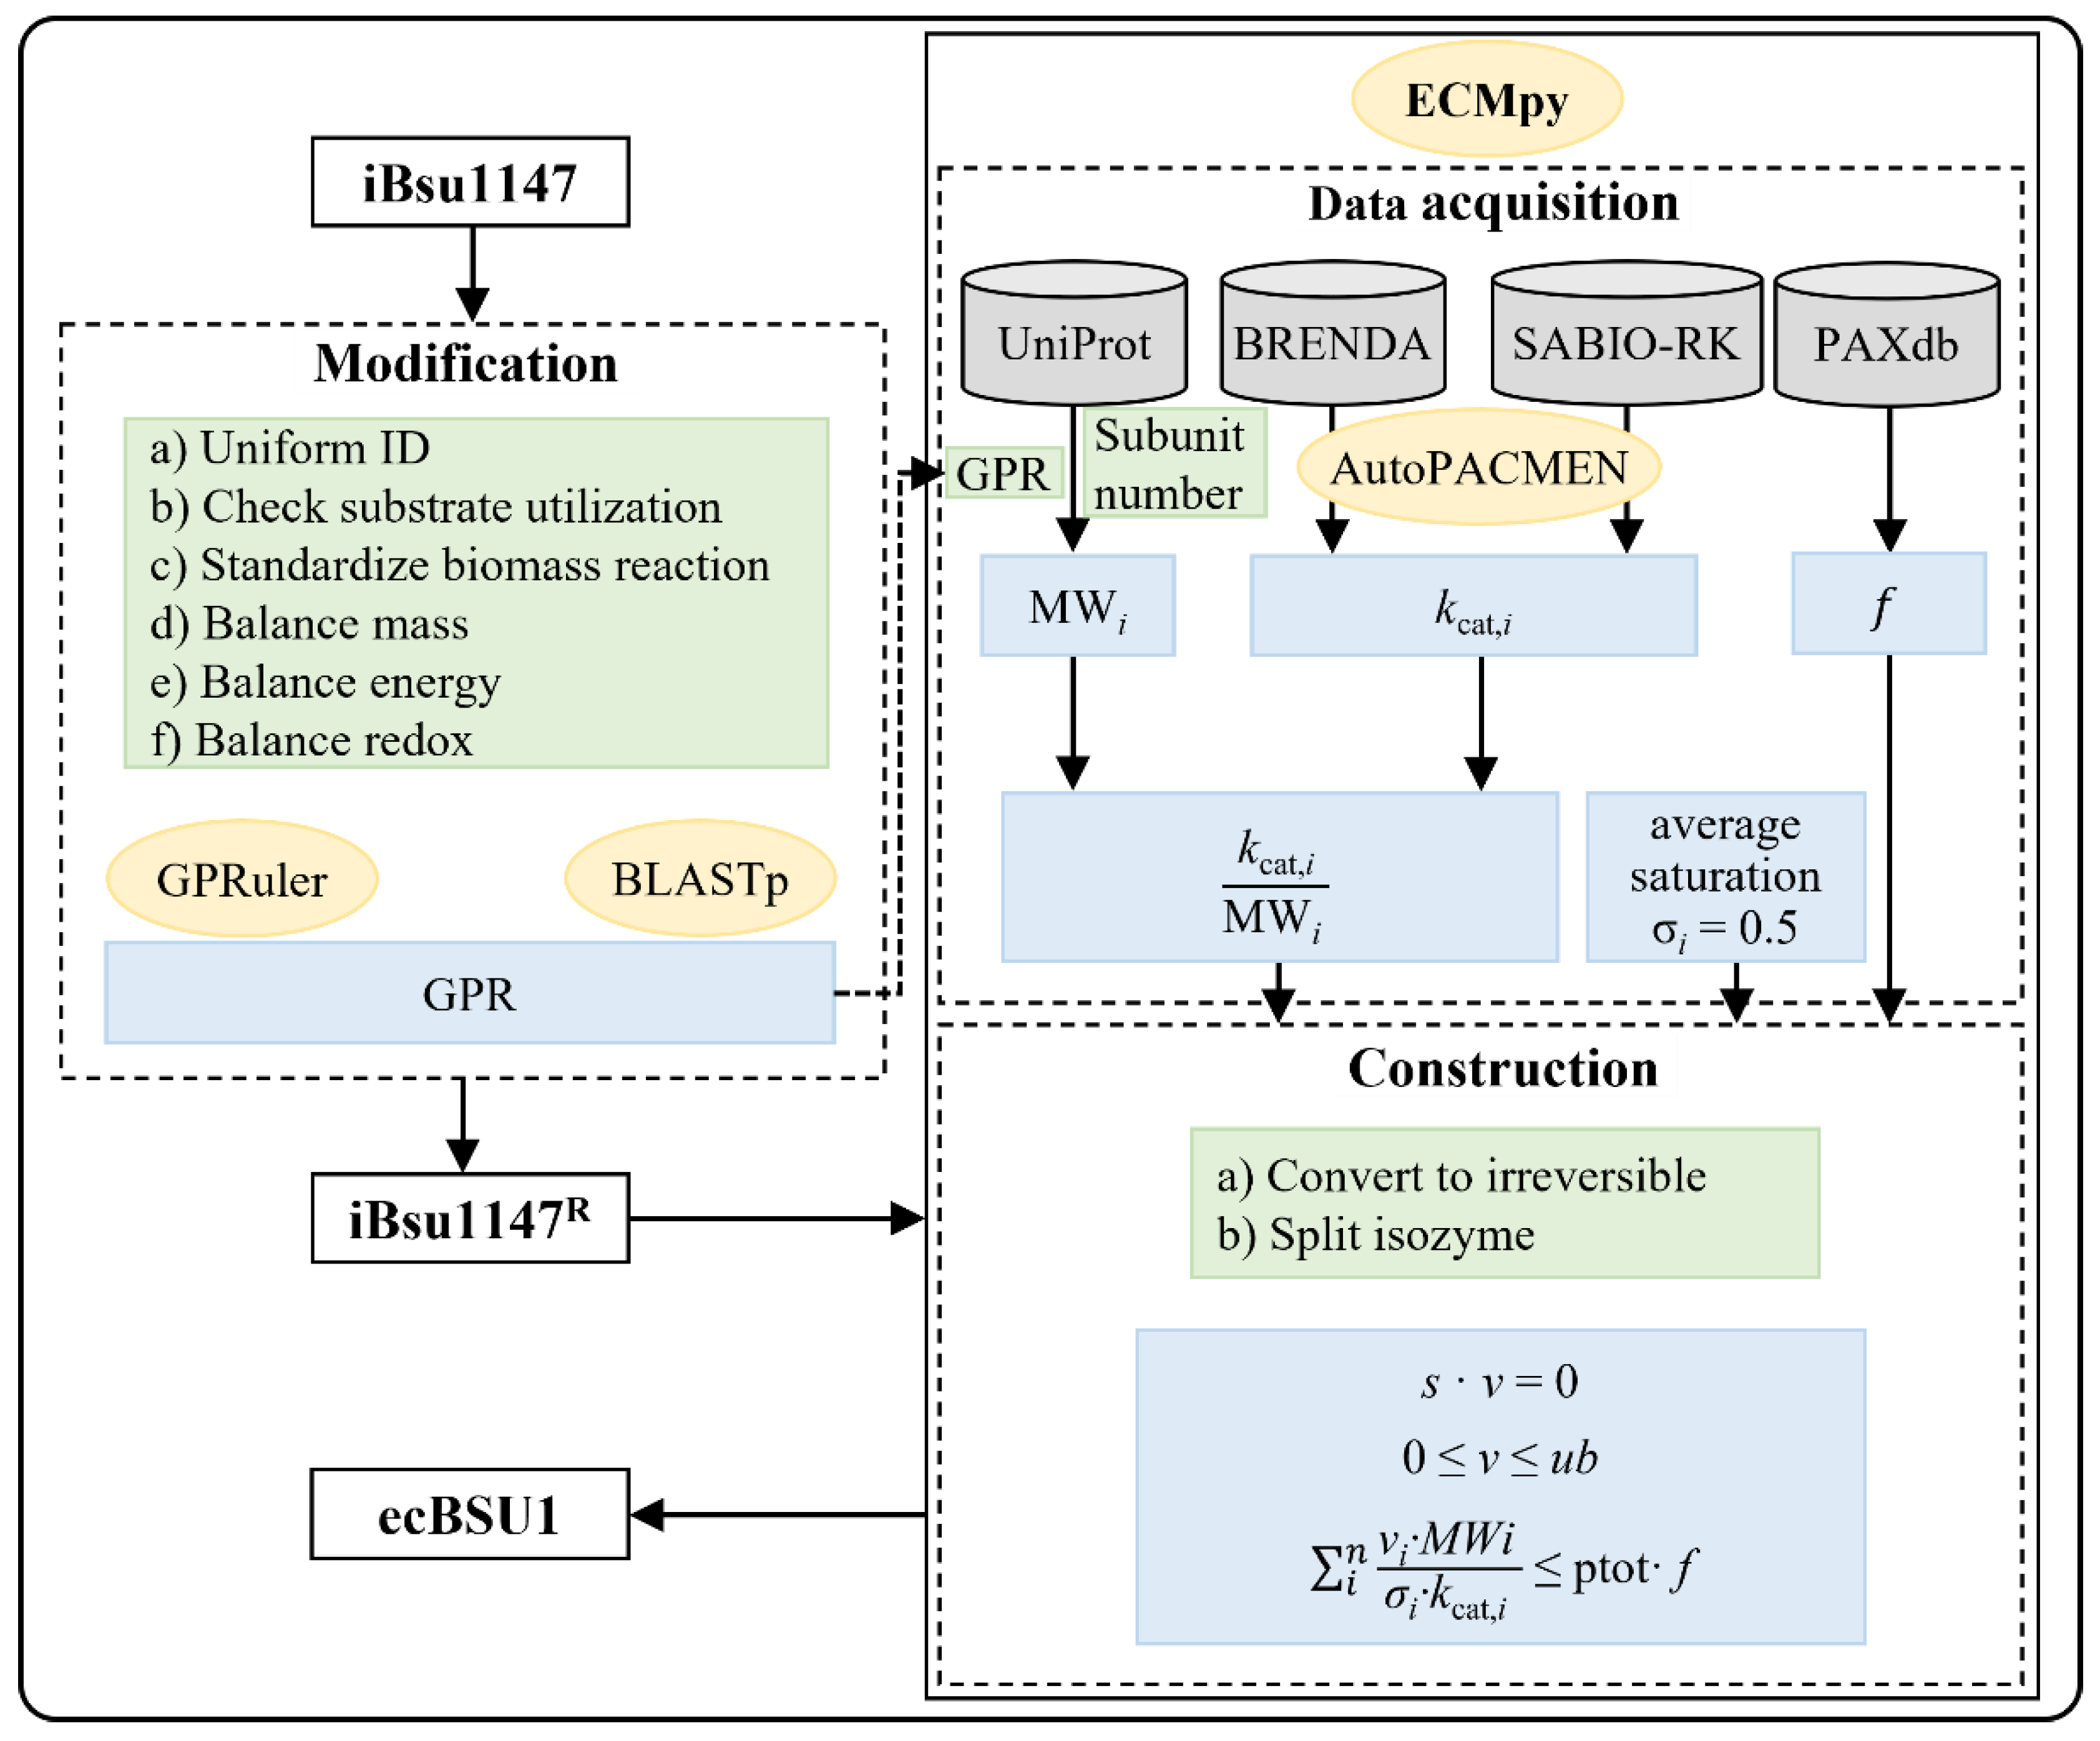
2.1. Model Update
2.2. Data Acquisition
2.3. Construction of ecBSU1
2.4. Calibration of Enzyme Kinetic Parameters
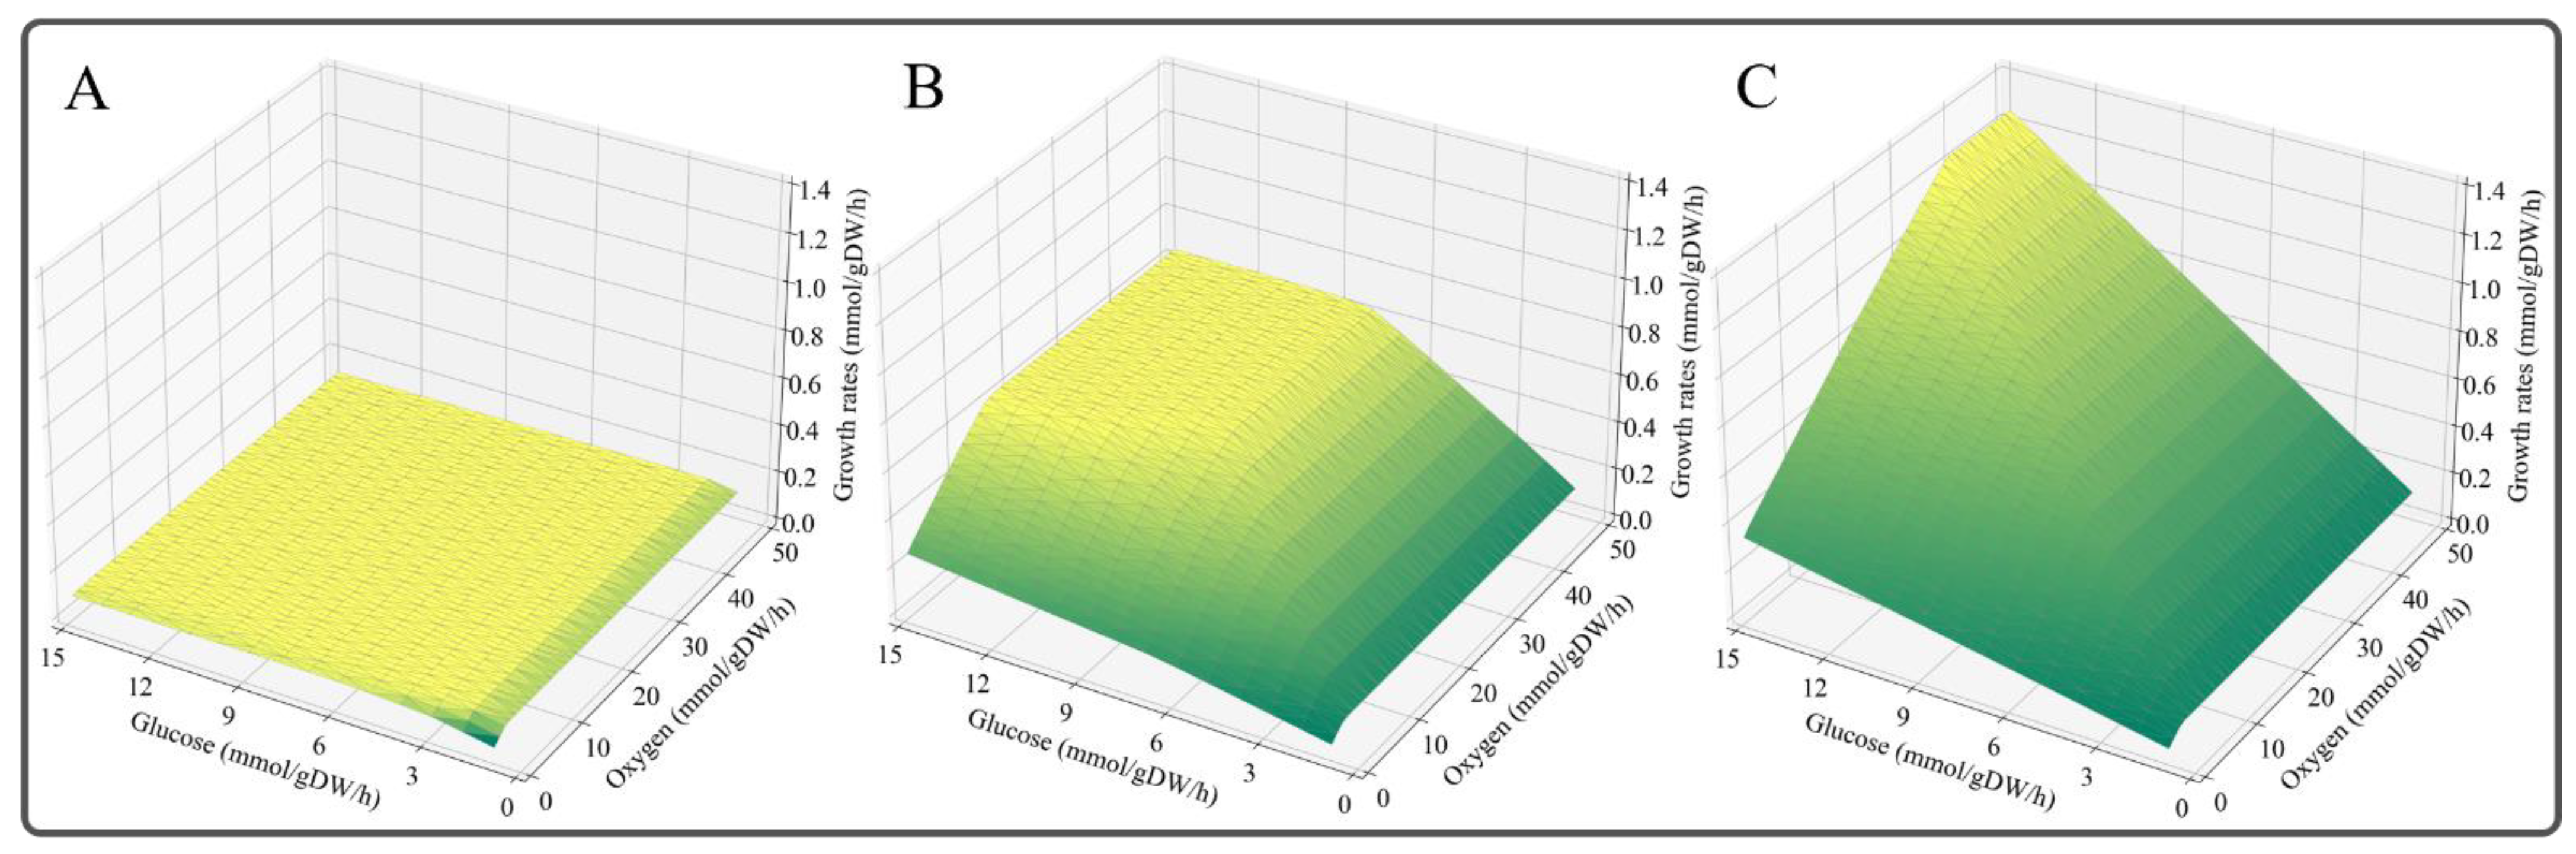
2.5. Phenotype Phase Plane (PhPP) Analysis
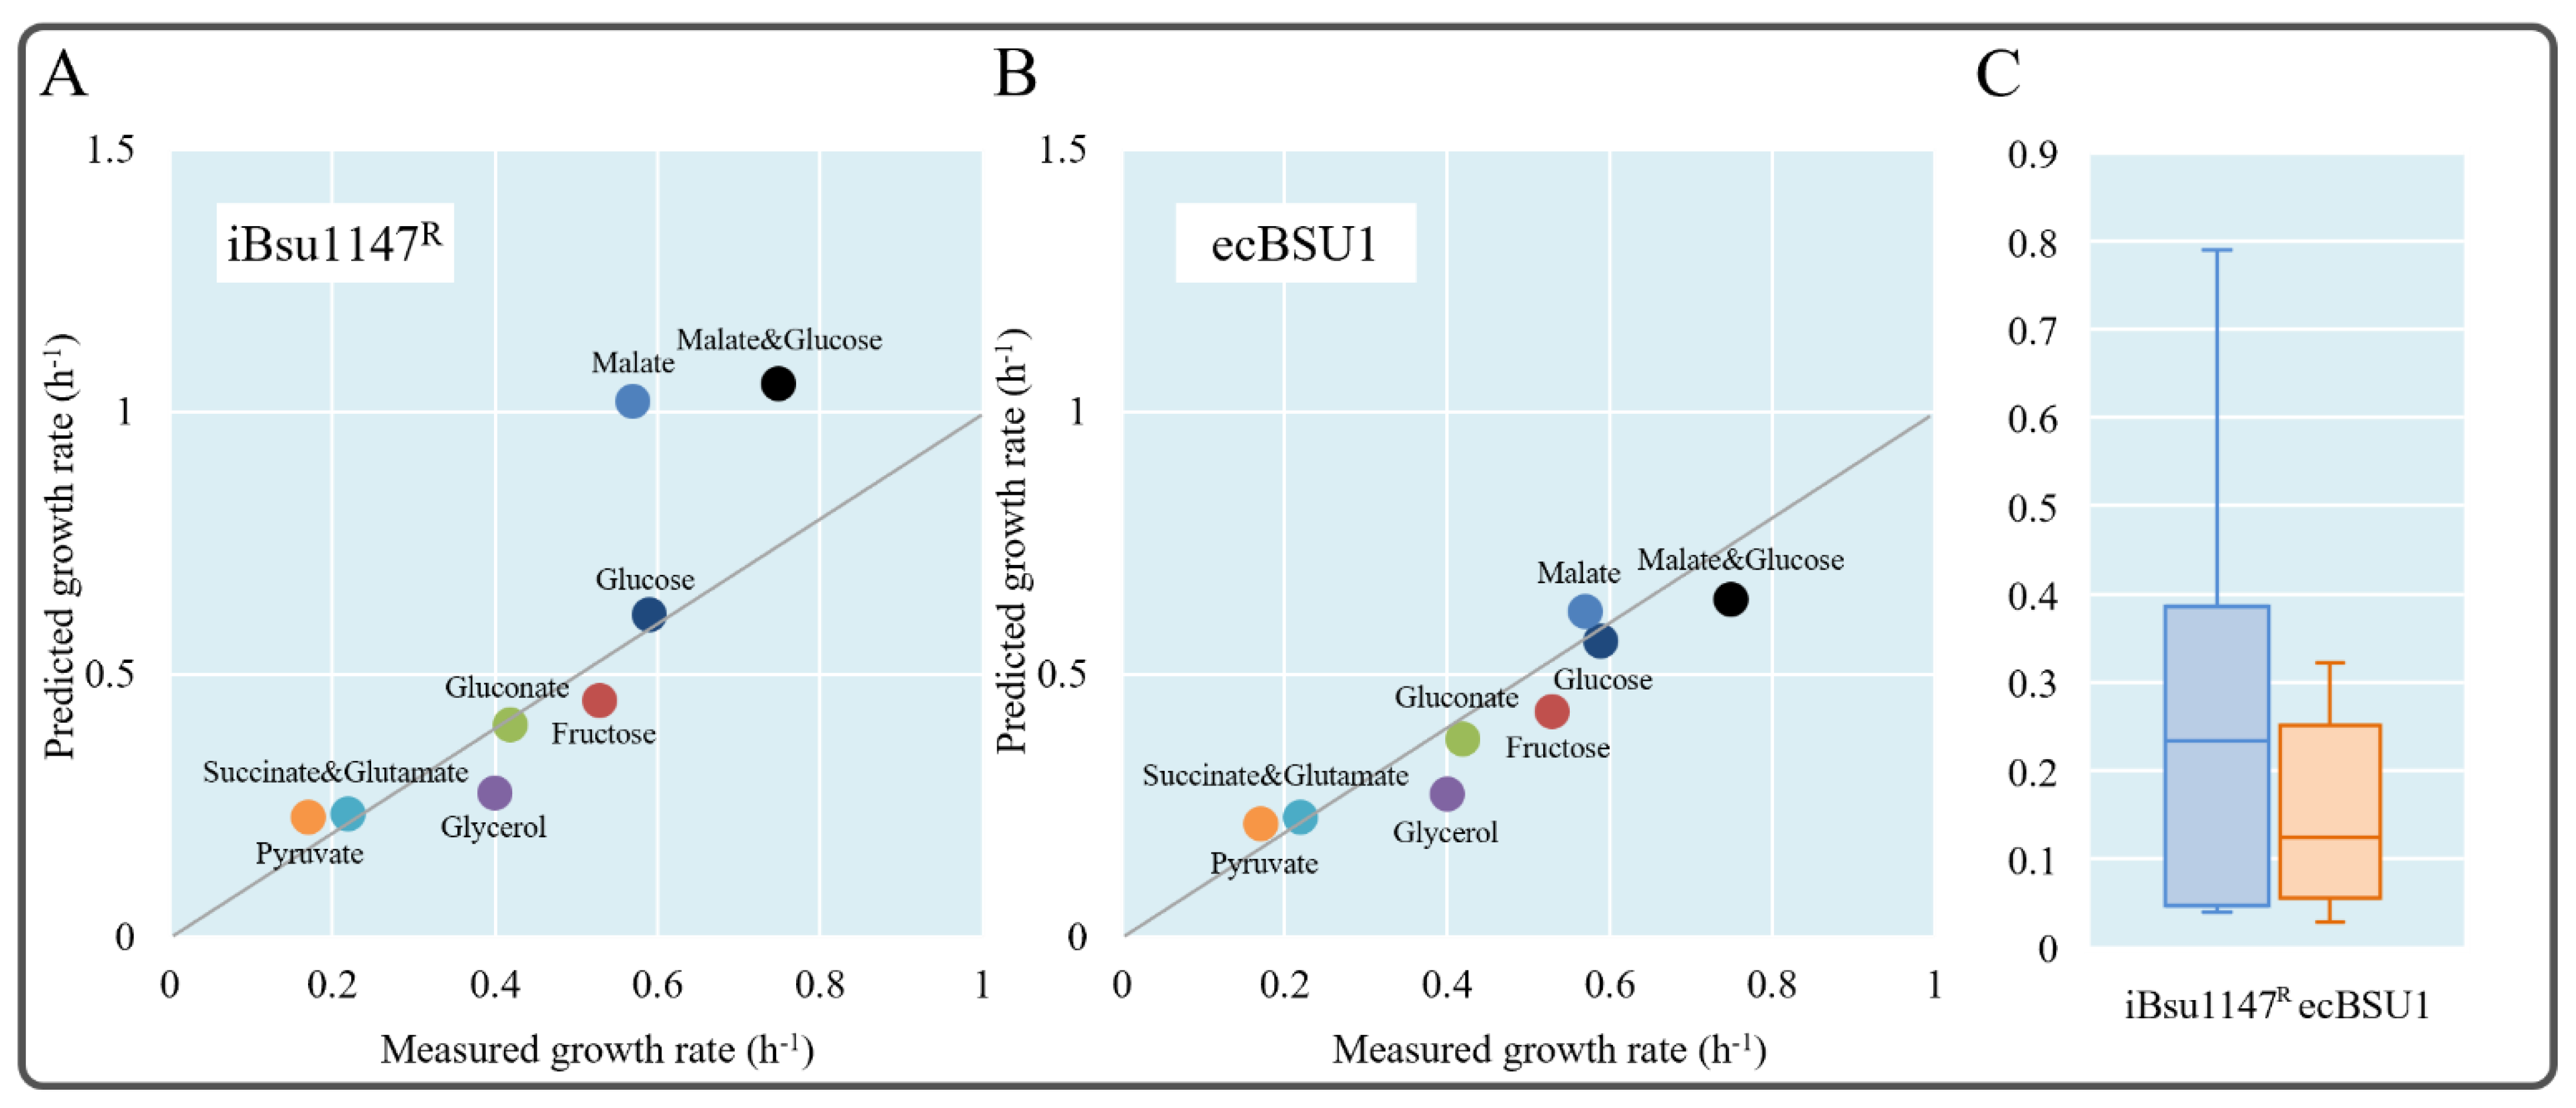
2.6. Prediction of Growth Rates on Different Carbon Sources
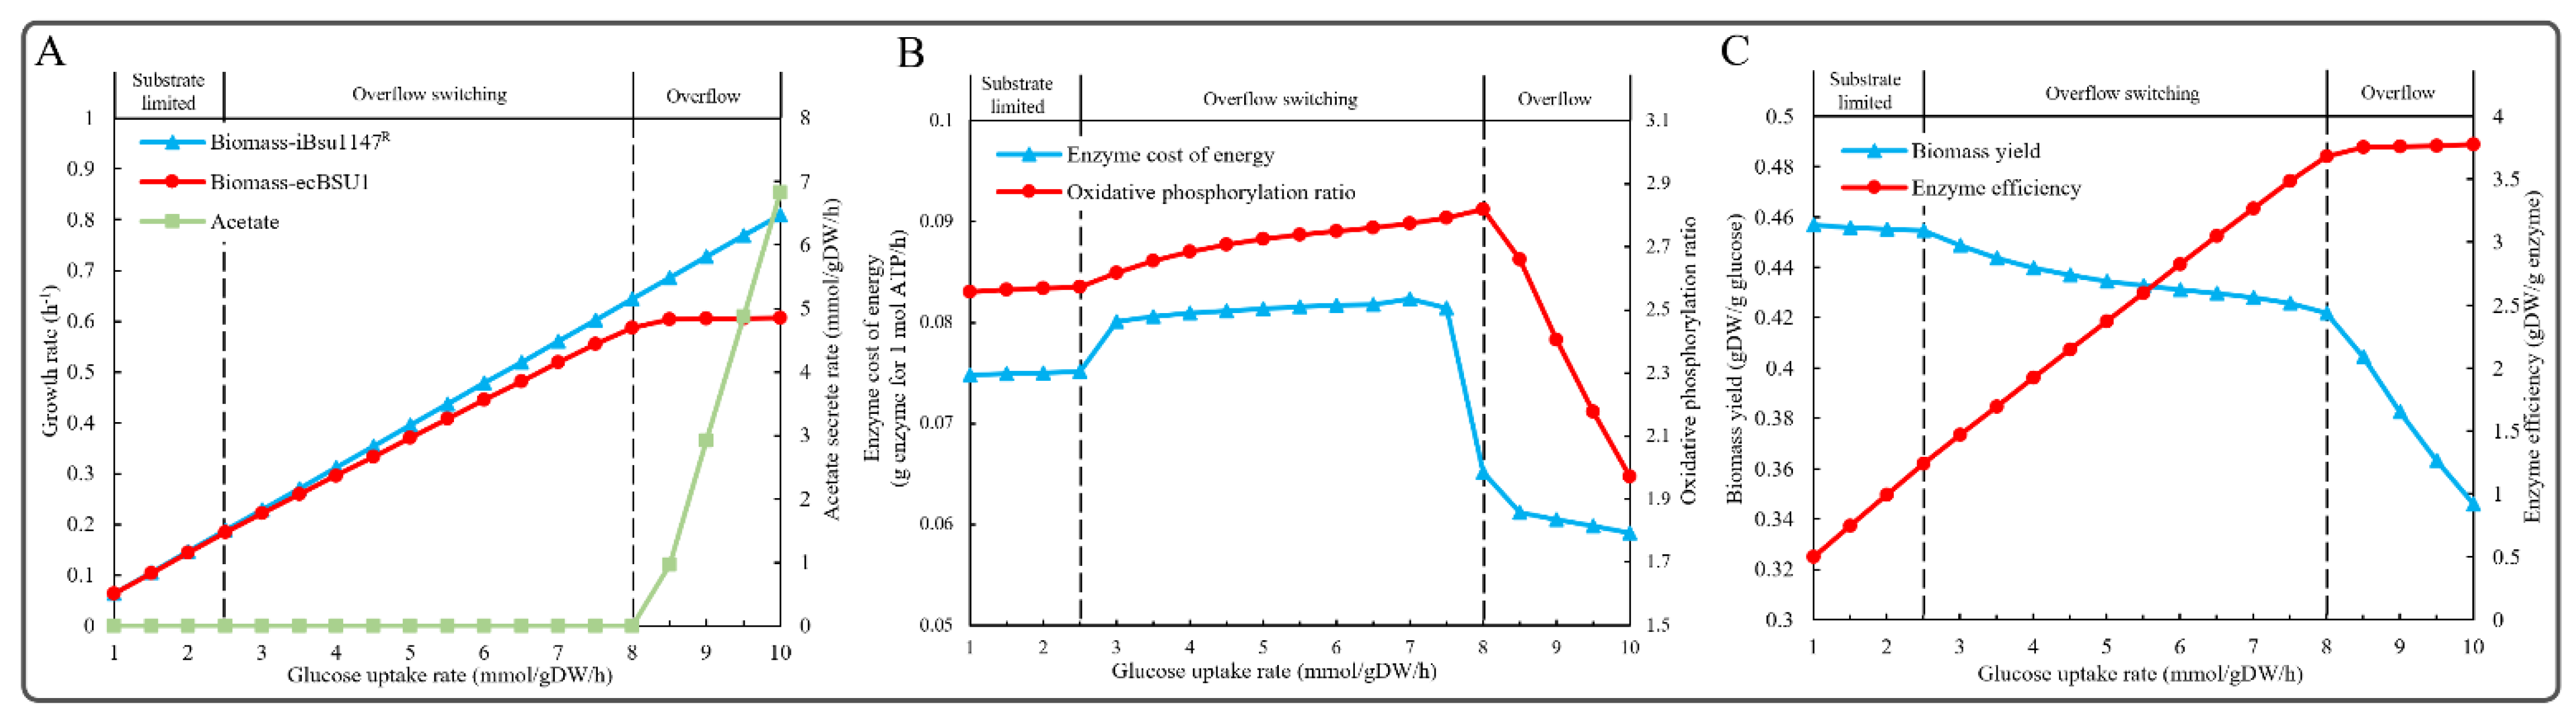
2.7. Simulation of Overflow Metabolism
2.8. Prediction of Metabolic Engineering Targets
2.9. Software
3. Results
3.1. GPR Correction of iBsu1147
3.2. Other Modifications of iBsu1147
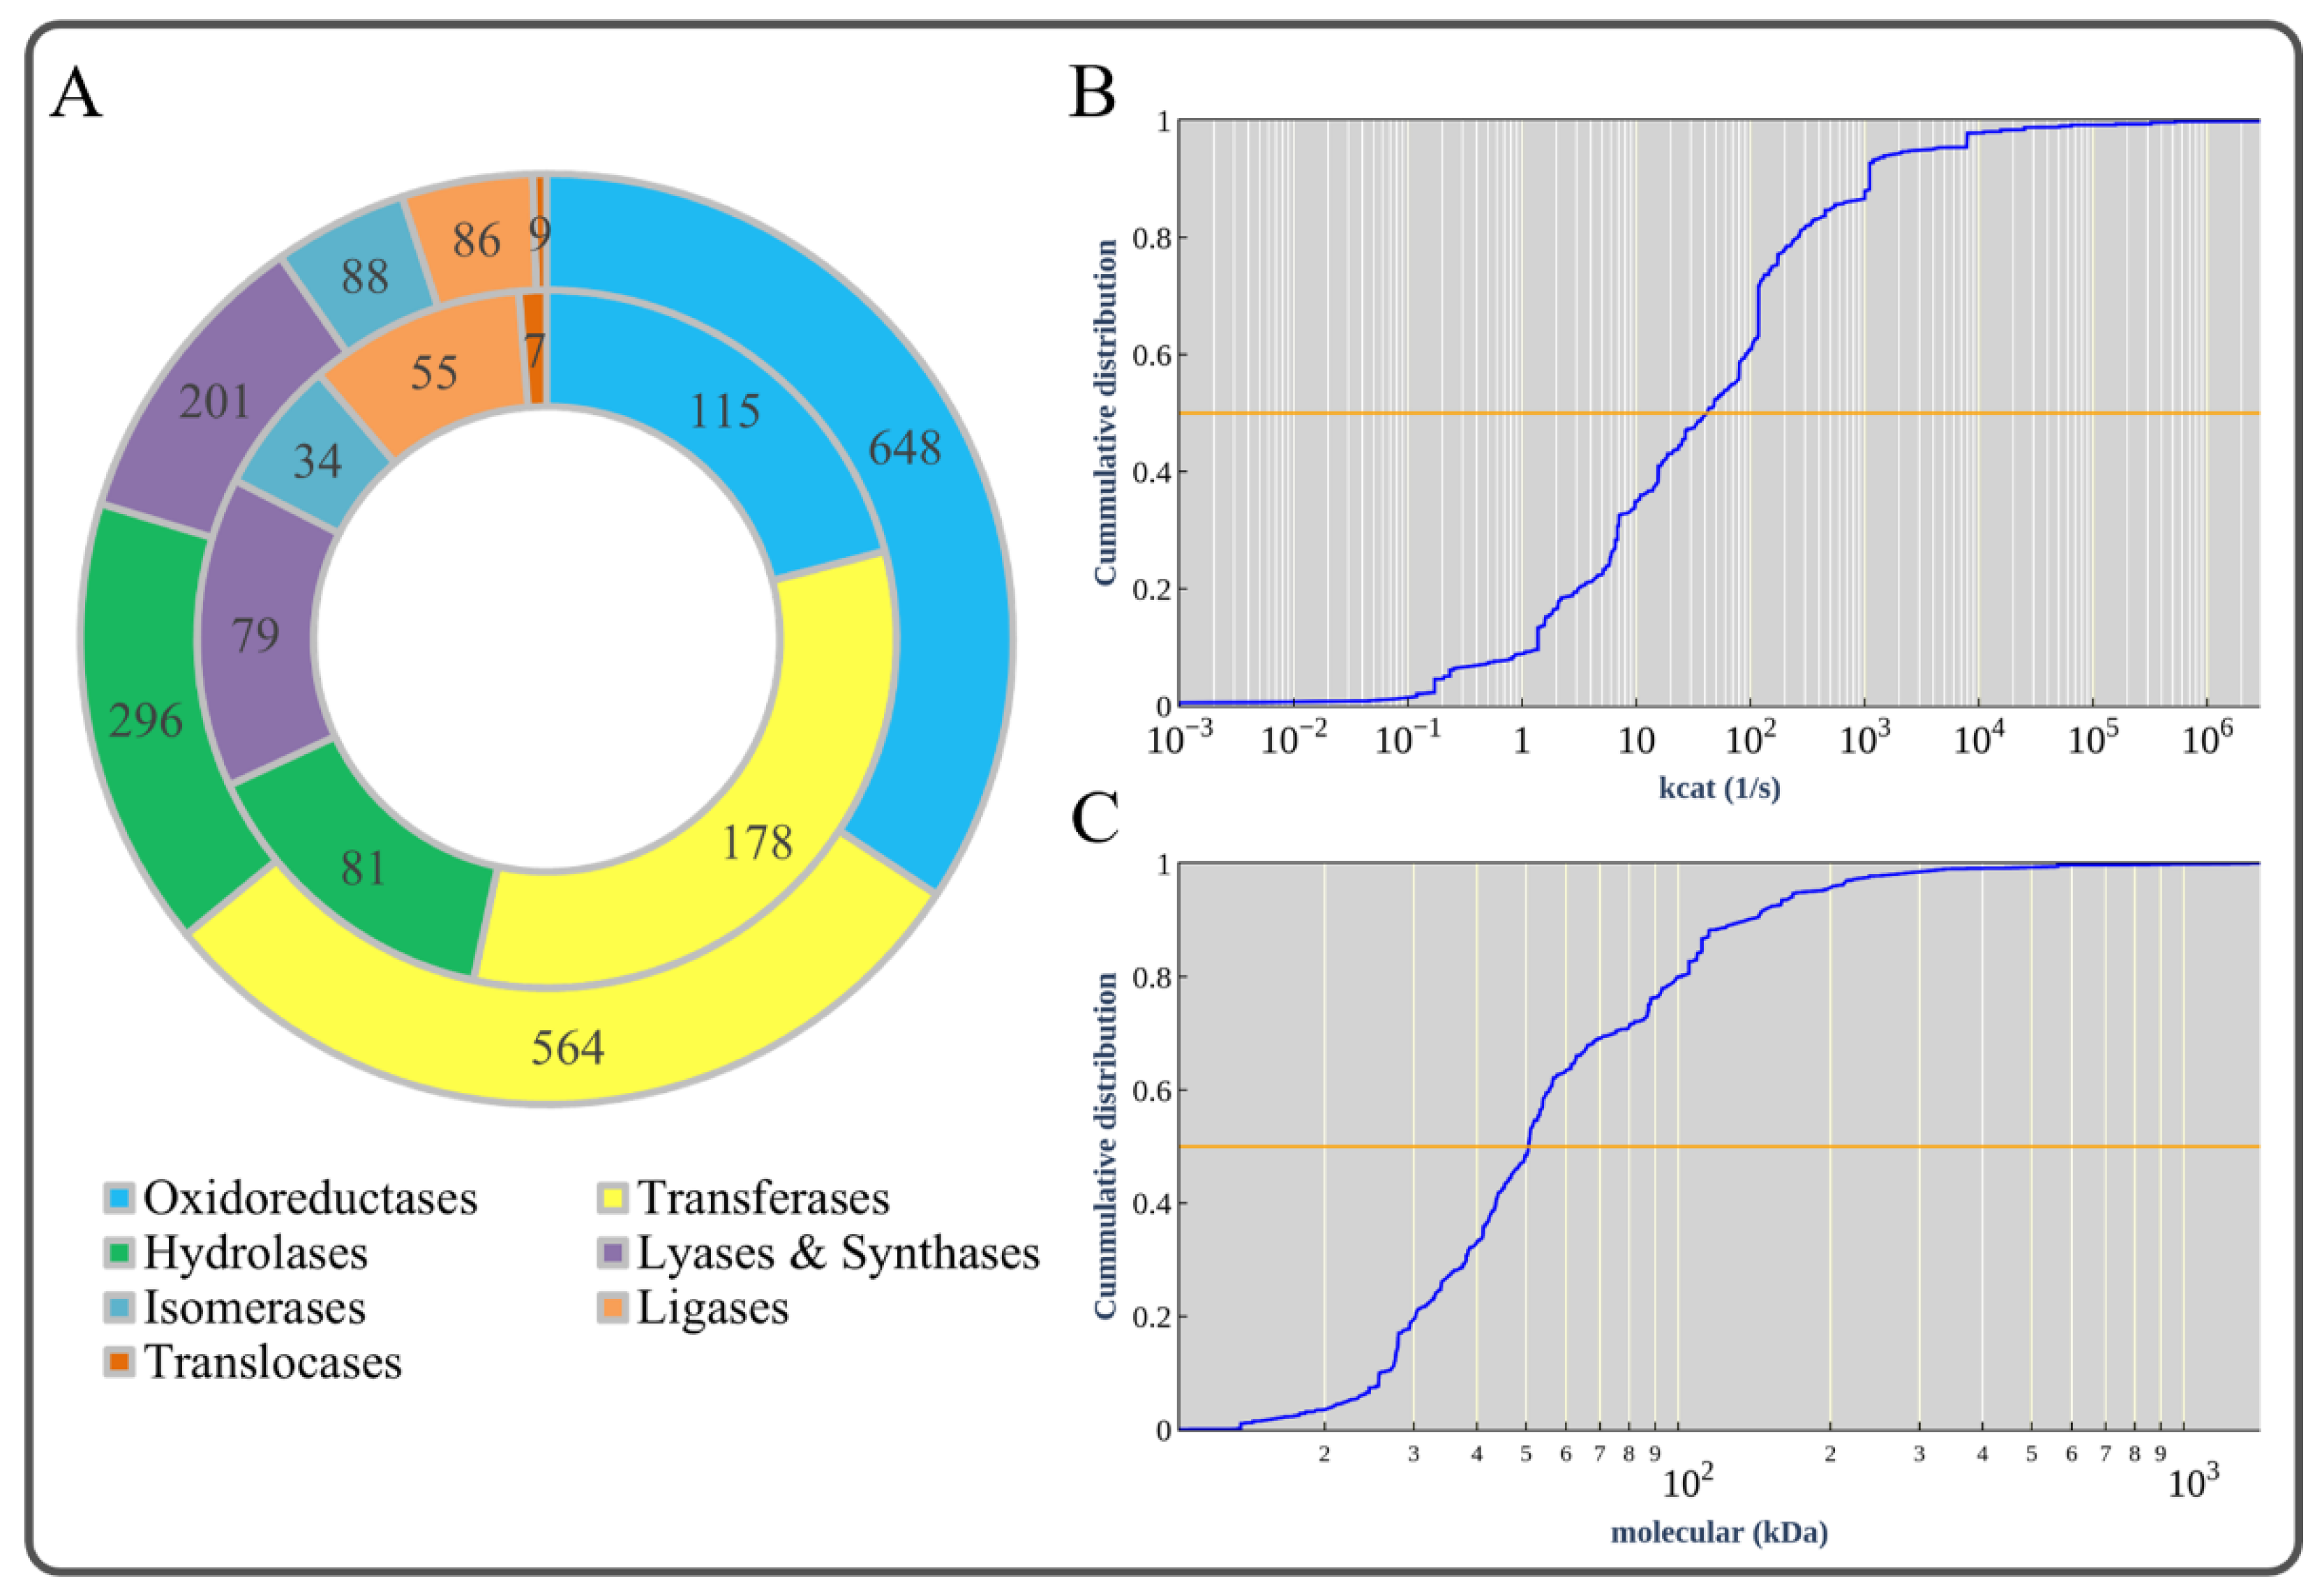
3.3. Basic Information of ecBSU1
3.4. Correction of Enzyme Kinetic Parameters to Overcome Model Over-Constraint
3.5. Simulation of Overflow Metabolism
3.6. Enzyme-Constrained Integration Improved the Phenotype Prediction
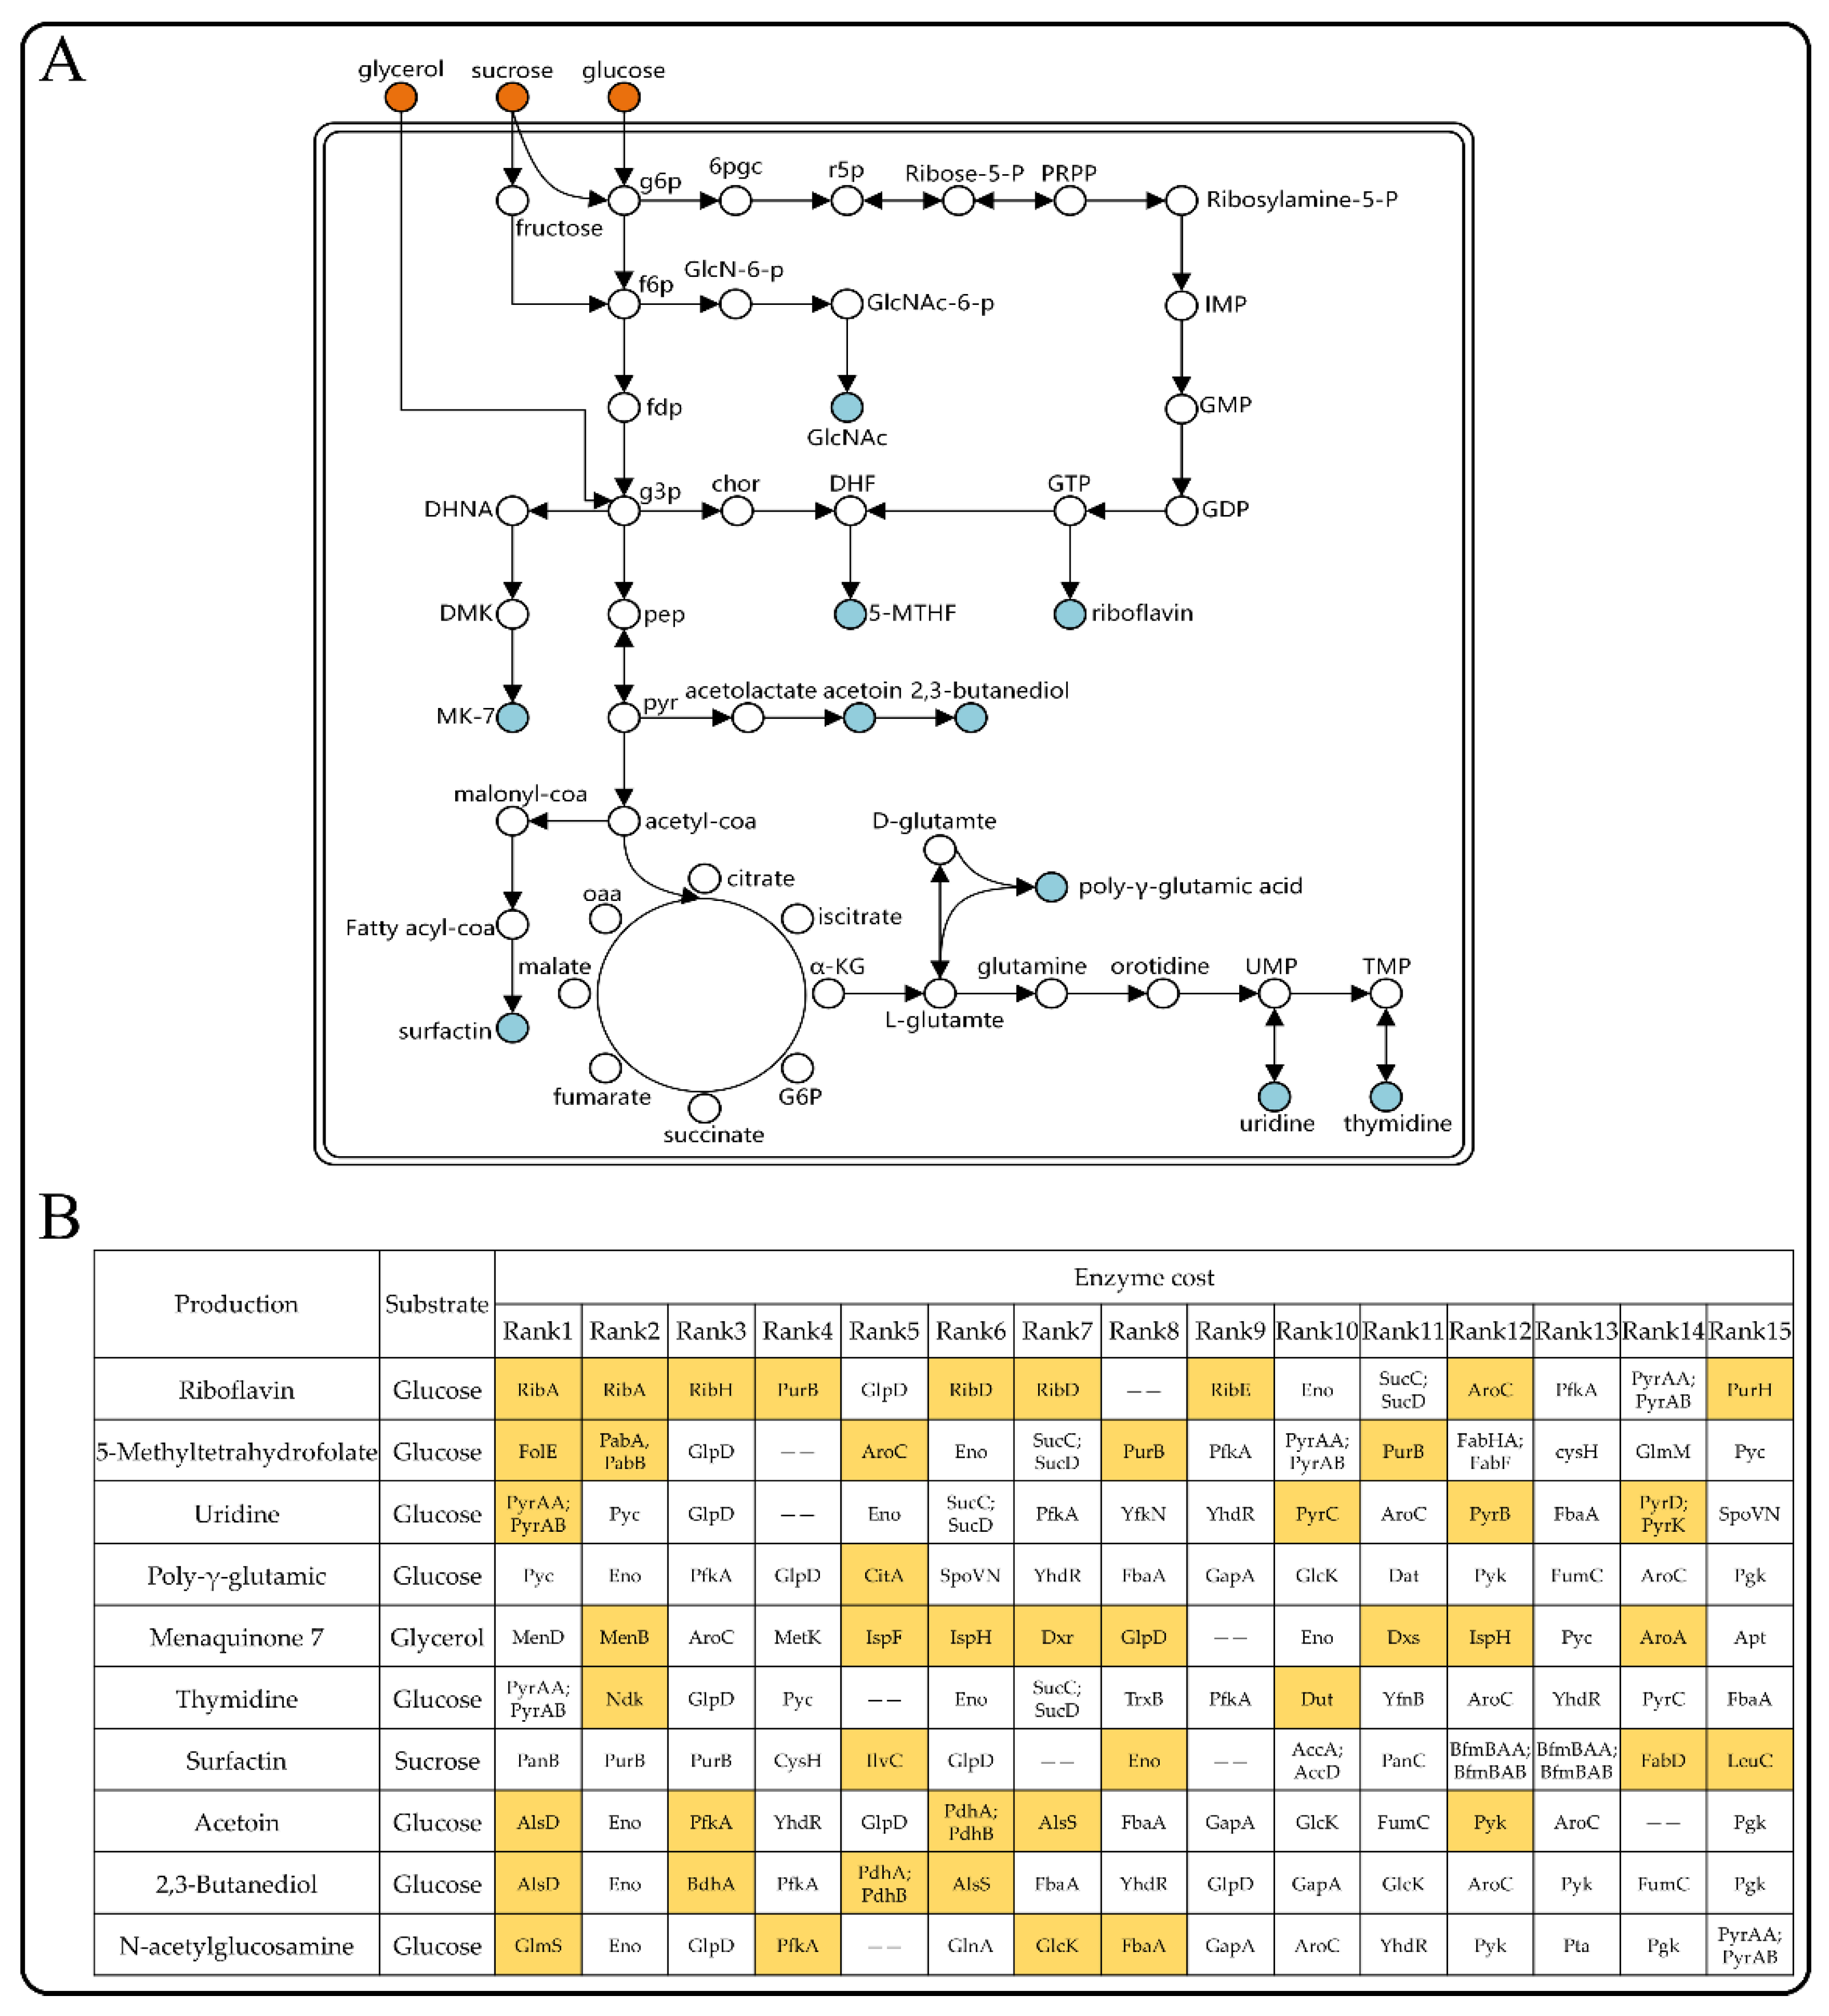
3.7. The Enzyme-Constrained Model Predicted Target Genes for Improving the Production of Chemicals
4. Discussion
5. Conclusions
Supplementary Materials
Author Contributions
Funding
Institutional Review Board Statement
Informed Consent Statement
Data Availability Statement
Conflicts of Interest
References
- Gu, Y.; Xu, X.H.; Wu, Y.K.; Niu, T.F.; Liu, Y.F.; Li, J.H.; Du, G.C.; Liu, L. Advances and prospects of Bacillus subtilis cellular factories: From rational design to industrial applications. Metab. Eng. 2018, 50, 109–121. [Google Scholar] [CrossRef]
- Hao, T.; Han, B.; Ma, H.; Fu, J.; Wang, H.; Wang, Z.; Tang, B.; Chen, T.; Zhao, X. In silico metabolic engineering of Bacillus subtilis for improved production of riboflavin, Egl-237, (R,R)-2,3-butanediol and isobutanol. Mol. Biosyst. 2013, 9, 2034–2044. [Google Scholar] [CrossRef]
- Vikromvarasiri, N.; Shirai, T.; Kondo, A. Metabolic engineering design to enhance (R,R)-2,3-butanediol production from glycerol in Bacillus subtilis based on flux balance analysis. Microb. Cell Factories 2021, 20, 196. [Google Scholar] [CrossRef]
- Kalantari, A.; Chen, T.; Ji, B.; Stancik, I.A.; Ravikumar, V.; Franjevic, D.; Saulou-Berion, C.; Goelzer, A.; Mijakovic, I. Conversion of Glycerol to 3-Hydroxypropanoic Acid by Genetically Engineered Bacillus subtilis. Front. Microbiol. 2017, 8, 638. [Google Scholar] [CrossRef]
- Oh, Y.-K.; Palsson, B.O.; Park, S.M.; Schilling, C.H.; Mahadevan, R. Genome-scale reconstruction of metabolic network in Bacillus subtilis based on high-throughput phenotyping and gene essentiality data. J. Biol. Chem. 2007, 282, 28791–28799. [Google Scholar] [CrossRef] [Green Version]
- Henry, C.S.; Zinner, J.F.; Cohoon, M.P.; Stevens, R.L. iBsu1103: A new genome-scale metabolic model of Bacillus subtilis based on SEED annotations. Genome Biol. 2009, 10, R69. [Google Scholar] [CrossRef] [Green Version]
- Tanaka, K.; Henry, C.S.; Zinner, J.F.; Jolivet, E.; Cohoon, M.P.; Xia, F.; Bidnenko, V.; Ehrlich, S.D.; Stevens, R.L.; Noirot, P. Building the repertoire of dispensable chromosome regions in Bacillus subtilis entails major refinement of cognate large-scale metabolic model. Nucleic Acids Res. 2013, 41, 687–699. [Google Scholar] [CrossRef]
- Kocabas, P.; Calik, P.; Calik, G.; Ozdamar, T.H. Analyses of extracellular protein production in Bacillus subtilis—I: Genome-scale metabolic model reconstruction based on updated gene-enzyme-reaction data. Biochem. Eng. J. 2017, 127, 229–241. [Google Scholar] [CrossRef]
- Ye, C.; Luo, Q.; Guo, L.; Gao, C.; Xu, N.; Zhang, L.; Liu, L.; Chen, X. Improving lysine production through construction of an Escherichia coli enzyme-constrained model. Biotechnol. Bioeng. 2020, 117, 3533–3544. [Google Scholar] [CrossRef]
- Massaiu, I.; Pasotti, L.; Sonnenschein, N.; Rama, E.; Cavaletti, M.; Magni, P.; Calvio, C.; Herrgard, M.J. Integration of enzymatic data in Bacillus subtilis genome-scale metabolic model improves phenotype predictions and enables in silico design of poly-glutamic acid production strains. Microb. Cell Factories 2019, 18, 3. [Google Scholar] [CrossRef]
- Ishchuk, O.P.; Domenzain, I.; Sánchez, B.J.; Muñiz-Paredes, F.; Martínez, J.L.; Nielsen, J.; Petranovic, D. Genome-scale modeling drives 70-fold improvement of intracellular heme production in Saccharomyces cerevisiae. Proc. Natl. Acad. Sci. USA 2022, 119, e2108245119. [Google Scholar] [CrossRef]
- Zhang, Z.-X.; Wang, Y.-Z.; Nong, F.-T.; Xu, Y.; Ye, C.; Gu, Y.; Sun, X.-M.; Huang, H. Developing a dynamic equilibrium system in Escherichia coli to improve the production of recombinant proteins. Appl. Microbiol. Biotechnol. 2022, 106, 6125–6137. [Google Scholar] [CrossRef]
- Sanchez, B.J.; Zhang, C.; Nilsson, A.; Lahtvee, P.-J.; Kerkhoven, E.J.; Nielsen, J. Improving the phenotype predictions of a yeast genome-scale metabolic model by incorporating enzymatic constraints. Mol. Syst. Biol. 2017, 13, 935. [Google Scholar] [CrossRef]
- Bekiaris, P.S.; Klamt, S. Automatic construction of metabolic models with enzyme constraints. Bmc Bioinform. 2020, 21, 19. [Google Scholar] [CrossRef] [PubMed]
- Mao, Z.; Zhao, X.; Yang, X.; Zhang, P.; Du, J.; Yuan, Q.; Ma, H. ECMpy, a Simplified Workflow for Constructing Enzymatic Constrained Metabolic Network Model. Biomolecules 2022, 12, 65. [Google Scholar] [CrossRef]
- Zhou, J.; Zhuang, Y.; Xia, J. Integration of enzyme constraints in a genome-scale metabolic model of Aspergillus niger improves phenotype predictions. Microb. Cell Factories 2021, 20, 125. [Google Scholar] [CrossRef]
- Niu, J.; Mao, Z.; Mao, Y.; Wu, K.; Shi, Z.; Yuan, Q.; Cai, J.; Ma, H. Construction and Analysis of an Enzyme-Constrained Metabolic Model of Corynebacterium glutamicum. Biomolecules 2022, 12, 1499. [Google Scholar] [CrossRef]
- Di Filippo, M.; Damiani, C.; Pescini, D. GPRuler: Metabolic gene-protein-reaction rules automatic reconstruction. PLoS Comput Biol 2021, 17, e1009550. [Google Scholar] [CrossRef] [PubMed]
- Seaver, S.M.D.; Liu, F.; Zhang, Q.; Jeffryes, J.; Faria, J.P.; Edirisinghe, J.N.; Mundy, M.; Chia, N.; Noor, E.; Beber, M.E.; et al. The ModelSEED Biochemistry Database for the integration of metabolic annotations and the reconstruction, comparison and analysis of metabolic models for plants, fungi and microbes. Nucleic Acids Res. 2020, 49, D575–D588. [Google Scholar] [CrossRef] [PubMed]
- King, Z.A.; Lu, J.; Dräger, A.; Miller, P.; Federowicz, S.; Lerman, J.A.; Ebrahim, A.; Palsson, B.O.; Lewis, N.E. BiGG Models: A platform for integrating, standardizing and sharing genome-scale models. Nucleic Acids Res. 2015, 44, D515–D522. [Google Scholar] [CrossRef]
- Chang, A.; Jeske, L.; Ulbrich, S.; Hofmann, J.; Koblitz, J.; Schomburg, I.; Neumann-Schaal, M.; Jahn, D.; Schomburg, D. BRENDA, the ELIXIR core data resource in 2021: New developments and updates. Nucleic Acids Res. 2020, 49, D498–D508. [Google Scholar] [CrossRef] [PubMed]
- Wittig, U.; Kania, R.; Golebiewski, M.; Rey, M.; Shi, L.; Jong, L.; Algaa, E.; Weidemann, A.; Sauer-Danzwith, H.; Mir, S.; et al. SABIO-RK—Database for biochemical reaction kinetics. Nucleic Acids Res. 2011, 40, D790–D796. [Google Scholar] [CrossRef] [Green Version]
- Wang, M.; Herrmann, C.J.; Simonovic, M.; Szklarczyk, D.; von Mering, C. Version 4.0 of PaxDb: Protein abundance data, integrated across model organisms, tissues, and cell-lines. Proteomics 2015, 15, 3163–3168. [Google Scholar] [CrossRef] [Green Version]
- Domenzain, I.; Sánchez, B.; Anton, M.; Kerkhoven, E.J.; Millán-Oropeza, A.; Henry, C.; Siewers, V.; Morrissey, J.P.; Sonnenschein, N.; Nielsen, J. Reconstruction of a catalogue of genome-scale metabolic models with enzymatic constraints using GECKO 2.0. Nat. Commun. 2022, 13, 3766. [Google Scholar] [CrossRef] [PubMed]
- Chubukov, V.; Uhr, M.; Le Chat, L.; Kleijn, R.J.; Jules, M.; Link, H.; Aymerich, S.; Stelling, J.; Sauer, U. Transcriptional regulation is insufficient to explain substrate-induced flux changes in Bacillus subtilis. Mol. Syst. Biol. 2013, 9, 709. [Google Scholar] [CrossRef]
- Basan, M.; Hui, S.; Okano, H.; Zhang, Z.; Shen, Y.; Williamson, J.R.; Hwa, T. Overflow metabolism in Escherichia coli results from efficient proteome allocation. Nature 2015, 528, 99–104. [Google Scholar] [CrossRef] [PubMed] [Green Version]
- van Hoek, M.J.A.; Merks, R.M.H. Redox balance is key to explaining full vs. partial switching to low-yield metabolism. BMC Syst. Biol. 2012, 6, 22. [Google Scholar] [CrossRef] [PubMed] [Green Version]
- Ebrahim, A.; Lerman, J.A.; Palsson, B.O.; Hyduke, D.R. COBRApy: COnstraints-Based Reconstruction and Analysis for Python. BMC Syst. Biol. 2013, 7, 74. [Google Scholar] [CrossRef] [Green Version]
- Lewis, N.E.; Hixson, K.K.; Conrad, T.M.; Lerman, J.A.; Charusanti, P.; Polpitiya, A.D.; Adkins, J.N.; Schramm, G.; Purvine, S.O.; Lopez-Ferrer, D.; et al. Omic data from evolved E. coli are consistent with computed optimal growth from genome-scale models. Mol. Syst. Biol. 2010, 6, 390. [Google Scholar] [CrossRef]
- Karp, P.D.; Billington, R.; Caspi, R.; Fulcher, C.A.; Latendresse, M.; Kothari, A.; Keseler, I.M.; Krummenacker, M.; Midford, P.E.; Ong, Q.; et al. The BioCyc collection of microbial genomes and metabolic pathways. Brief. Bioinform. 2017, 20, 1085–1093. [Google Scholar] [CrossRef]
- Chan, S.H.J.; Cai, J.; Wang, L.; Simons-Senftle, M.N.; Maranas, C.D. Standardizing biomass reactions and ensuring complete mass balance in genome-scale metabolic models. Bioinformatics 2017, 33, 3603–3609. [Google Scholar] [CrossRef] [PubMed]
- Orth, J.D.; Conrad, T.M.; Na, J.; Lerman, J.A.; Nam, H.; Feist, A.M.; Palsson, B.O. A comprehensive genome-scale reconstruction of Escherichia coli metabolism-2011. Mol. Syst. Biol. 2011, 7, 535. [Google Scholar] [CrossRef]
- Lu, X.; Liu, Y.; Yang, Y.; Wang, S.; Wang, Q.; Wang, X.; Yan, Z.; Cheng, J.; Liu, C.; Yang, X.; et al. Constructing a synthetic pathway for acetyl-coenzyme A from one-carbon through enzyme design. Nat. Commun. 2019, 10, 1378. [Google Scholar] [CrossRef] [Green Version]
- Dauner, M.; Storni, T.; Sauer, U. Bacillus subtilis Metabolism and Energetics in Carbon-Limited and Excess-Carbon Chemostat Culture. J. Bacteriol. 2001, 183, 7308–7317. [Google Scholar] [CrossRef] [PubMed] [Green Version]
- Kleijn, R.J.; Buescher, J.M.; Le Chat, L.; Jules, M.; Aymerich, S.; Sauer, U. Metabolic Fluxes during Strong Carbon Catabolite Repression by Malate in Bacillus subtilis. J. Biol. Chem. 2010, 285, 1587–1596. [Google Scholar] [CrossRef] [Green Version]
- Zhang, Q.; Wu, Y.; Gong, M.; Zhang, H.; Liu, Y.; Lv, X.; Li, J.; Du, G.; Liu, L. Production of proteins and commodity chemicals using engineered Bacillus subtilis platform strain. Essays Biochem. 2021, 65, 173–185. [Google Scholar] [CrossRef]
- Hümbelin, M.; Griesser, V.; Keller, T.; Schurter, W.; Haiker, M.; Hohmann, H.P.; Ritz, H.; Richter, G.; Bacher, A.; van Loon, A.P.G.M. GTP cyclohydrolase II and 3,4-dihydroxy-2-butanone 4-phosphate synthase are rate-limiting enzymes in riboflavin synthesis of an industrial Bacillus subtilis strain used for riboflavin production. J. Ind. Microbiol. Biotechnol. 1999, 22, 1–7. [Google Scholar] [CrossRef]
- Wang, Y.; Ma, R.; Liu, L.; He, L.; Ban, R. Improvement of uridine production in Bacillus subtilis by metabolic engineering. Biotechnol. Lett. 2018, 40, 151–155. [Google Scholar] [CrossRef]
- Lehmann, M.; Degen, S.; Hohmann, H.-P.; Wyss, M.; Bacher, A.; Schramek, N. Biosynthesis of riboflavin. FEBS J. 2009, 276, 4119–4129. [Google Scholar] [CrossRef]
- Yang, H.; Liu, Y.; Li, J.; Liu, L.; Du, G.; Chen, J. Systems metabolic engineering of Bacillus subtilis for efficient biosynthesis of 5-methyltetrahydrofolate. Biotechnol. Bioeng. 2020, 117, 2116–2130. [Google Scholar] [CrossRef]
- Davidi, D.; Milo, R. Lessons on enzyme kinetics from quantitative proteomics. Curr. Opin. Biotechnol. 2017, 46, 81–89. [Google Scholar] [CrossRef] [PubMed]
- Kerkhoven, E.J. Advances in constraint-based models: Methods for improved predictive power based on resource allocation constraints. Curr. Opin. Microbiol. 2022, 68, 102168. [Google Scholar] [CrossRef] [PubMed]
- Heckmann, D.; Lloyd, C.J.; Mih, N.; Ha, Y.; Zielinski, D.C.; Haiman, Z.B.; Desouki, A.A.; Lercher, M.J.; Palsson, B.O. Machine learning applied to enzyme turnover numbers reveals protein structural correlates and improves metabolic models. Nat. Commun. 2018, 9, 5252. [Google Scholar] [CrossRef] [Green Version]
- Li, F.; Yuan, L.; Lu, H.; Li, G.; Chen, Y.; Engqvist, M.K.M.; Kerkhoven, E.J.; Nielsen, J. Deep learning-based kcat prediction enables improved enzyme-constrained model reconstruction. Nat. Catal. 2022, 5, 662–672. [Google Scholar] [CrossRef]
- Yang, X.; Mao, Z.; Zhao, X.; Wang, R.; Zhang, P.; Cai, J.; Xue, C.; Ma, H. Integrating thermodynamic and enzymatic constraints into genome-scale metabolic models. Metab. Eng. 2021, 67, 133–144. [Google Scholar] [CrossRef]
- Salvy, P.; Hatzimanikatis, V. The ETFL formulation allows multi-omics integration in thermodynamics-compliant metabolism and expression models. Nat. Commun. 2020, 11, 30. [Google Scholar] [CrossRef] [Green Version]
- Shen, F.; Sun, R.; Yao, J.; Li, J.; Liu, Q.; Price, N.D.; Liu, C.; Wang, Z. OptRAM: In-silico strain design via integrative regulatory-metabolic network modeling. PLoS Comput Biol 2019, 15, e1006835. [Google Scholar] [CrossRef] [PubMed] [Green Version]
- Macklin, D.N.; Ahn-Horst, T.A.; Choi, H.; Ruggero, N.A.; Carrera, J.; Mason, J.C.; Sun, G.; Agmon, E.; DeFelice, M.M.; Maayan, I.; et al. Simultaneous cross-evaluation of heterogeneous E. coli datasets via mechanistic simulation. Science 2020, 369, eaav3751. [Google Scholar] [CrossRef]


Disclaimer/Publisher’s Note: The statements, opinions and data contained in all publications are solely those of the individual author(s) and contributor(s) and not of MDPI and/or the editor(s). MDPI and/or the editor(s) disclaim responsibility for any injury to people or property resulting from any ideas, methods, instructions or products referred to in the content. |
© 2023 by the authors. Licensee MDPI, Basel, Switzerland. This article is an open access article distributed under the terms and conditions of the Creative Commons Attribution (CC BY) license (https://creativecommons.org/licenses/by/4.0/).
Share and Cite
Wu, K.; Mao, Z.; Mao, Y.; Niu, J.; Cai, J.; Yuan, Q.; Yun, L.; Liao, X.; Wang, Z.; Ma, H. ecBSU1: A Genome-Scale Enzyme-Constrained Model of Bacillus subtilis Based on the ECMpy Workflow. Microorganisms 2023, 11, 178. https://doi.org/10.3390/microorganisms11010178
Wu K, Mao Z, Mao Y, Niu J, Cai J, Yuan Q, Yun L, Liao X, Wang Z, Ma H. ecBSU1: A Genome-Scale Enzyme-Constrained Model of Bacillus subtilis Based on the ECMpy Workflow. Microorganisms. 2023; 11(1):178. https://doi.org/10.3390/microorganisms11010178
Chicago/Turabian StyleWu, Ke, Zhitao Mao, Yufeng Mao, Jinhui Niu, Jingyi Cai, Qianqian Yuan, Lili Yun, Xiaoping Liao, Zhiwen Wang, and Hongwu Ma. 2023. "ecBSU1: A Genome-Scale Enzyme-Constrained Model of Bacillus subtilis Based on the ECMpy Workflow" Microorganisms 11, no. 1: 178. https://doi.org/10.3390/microorganisms11010178