
Lactulose Ingestion Induces a Rapid Increase in Genus Bifidobacterium in Healthy Japanese: A Randomised, Double-Blind, Placebo-Controlled Crossover Trial


Abstract
:1. Introduction
2. Materials and Methods
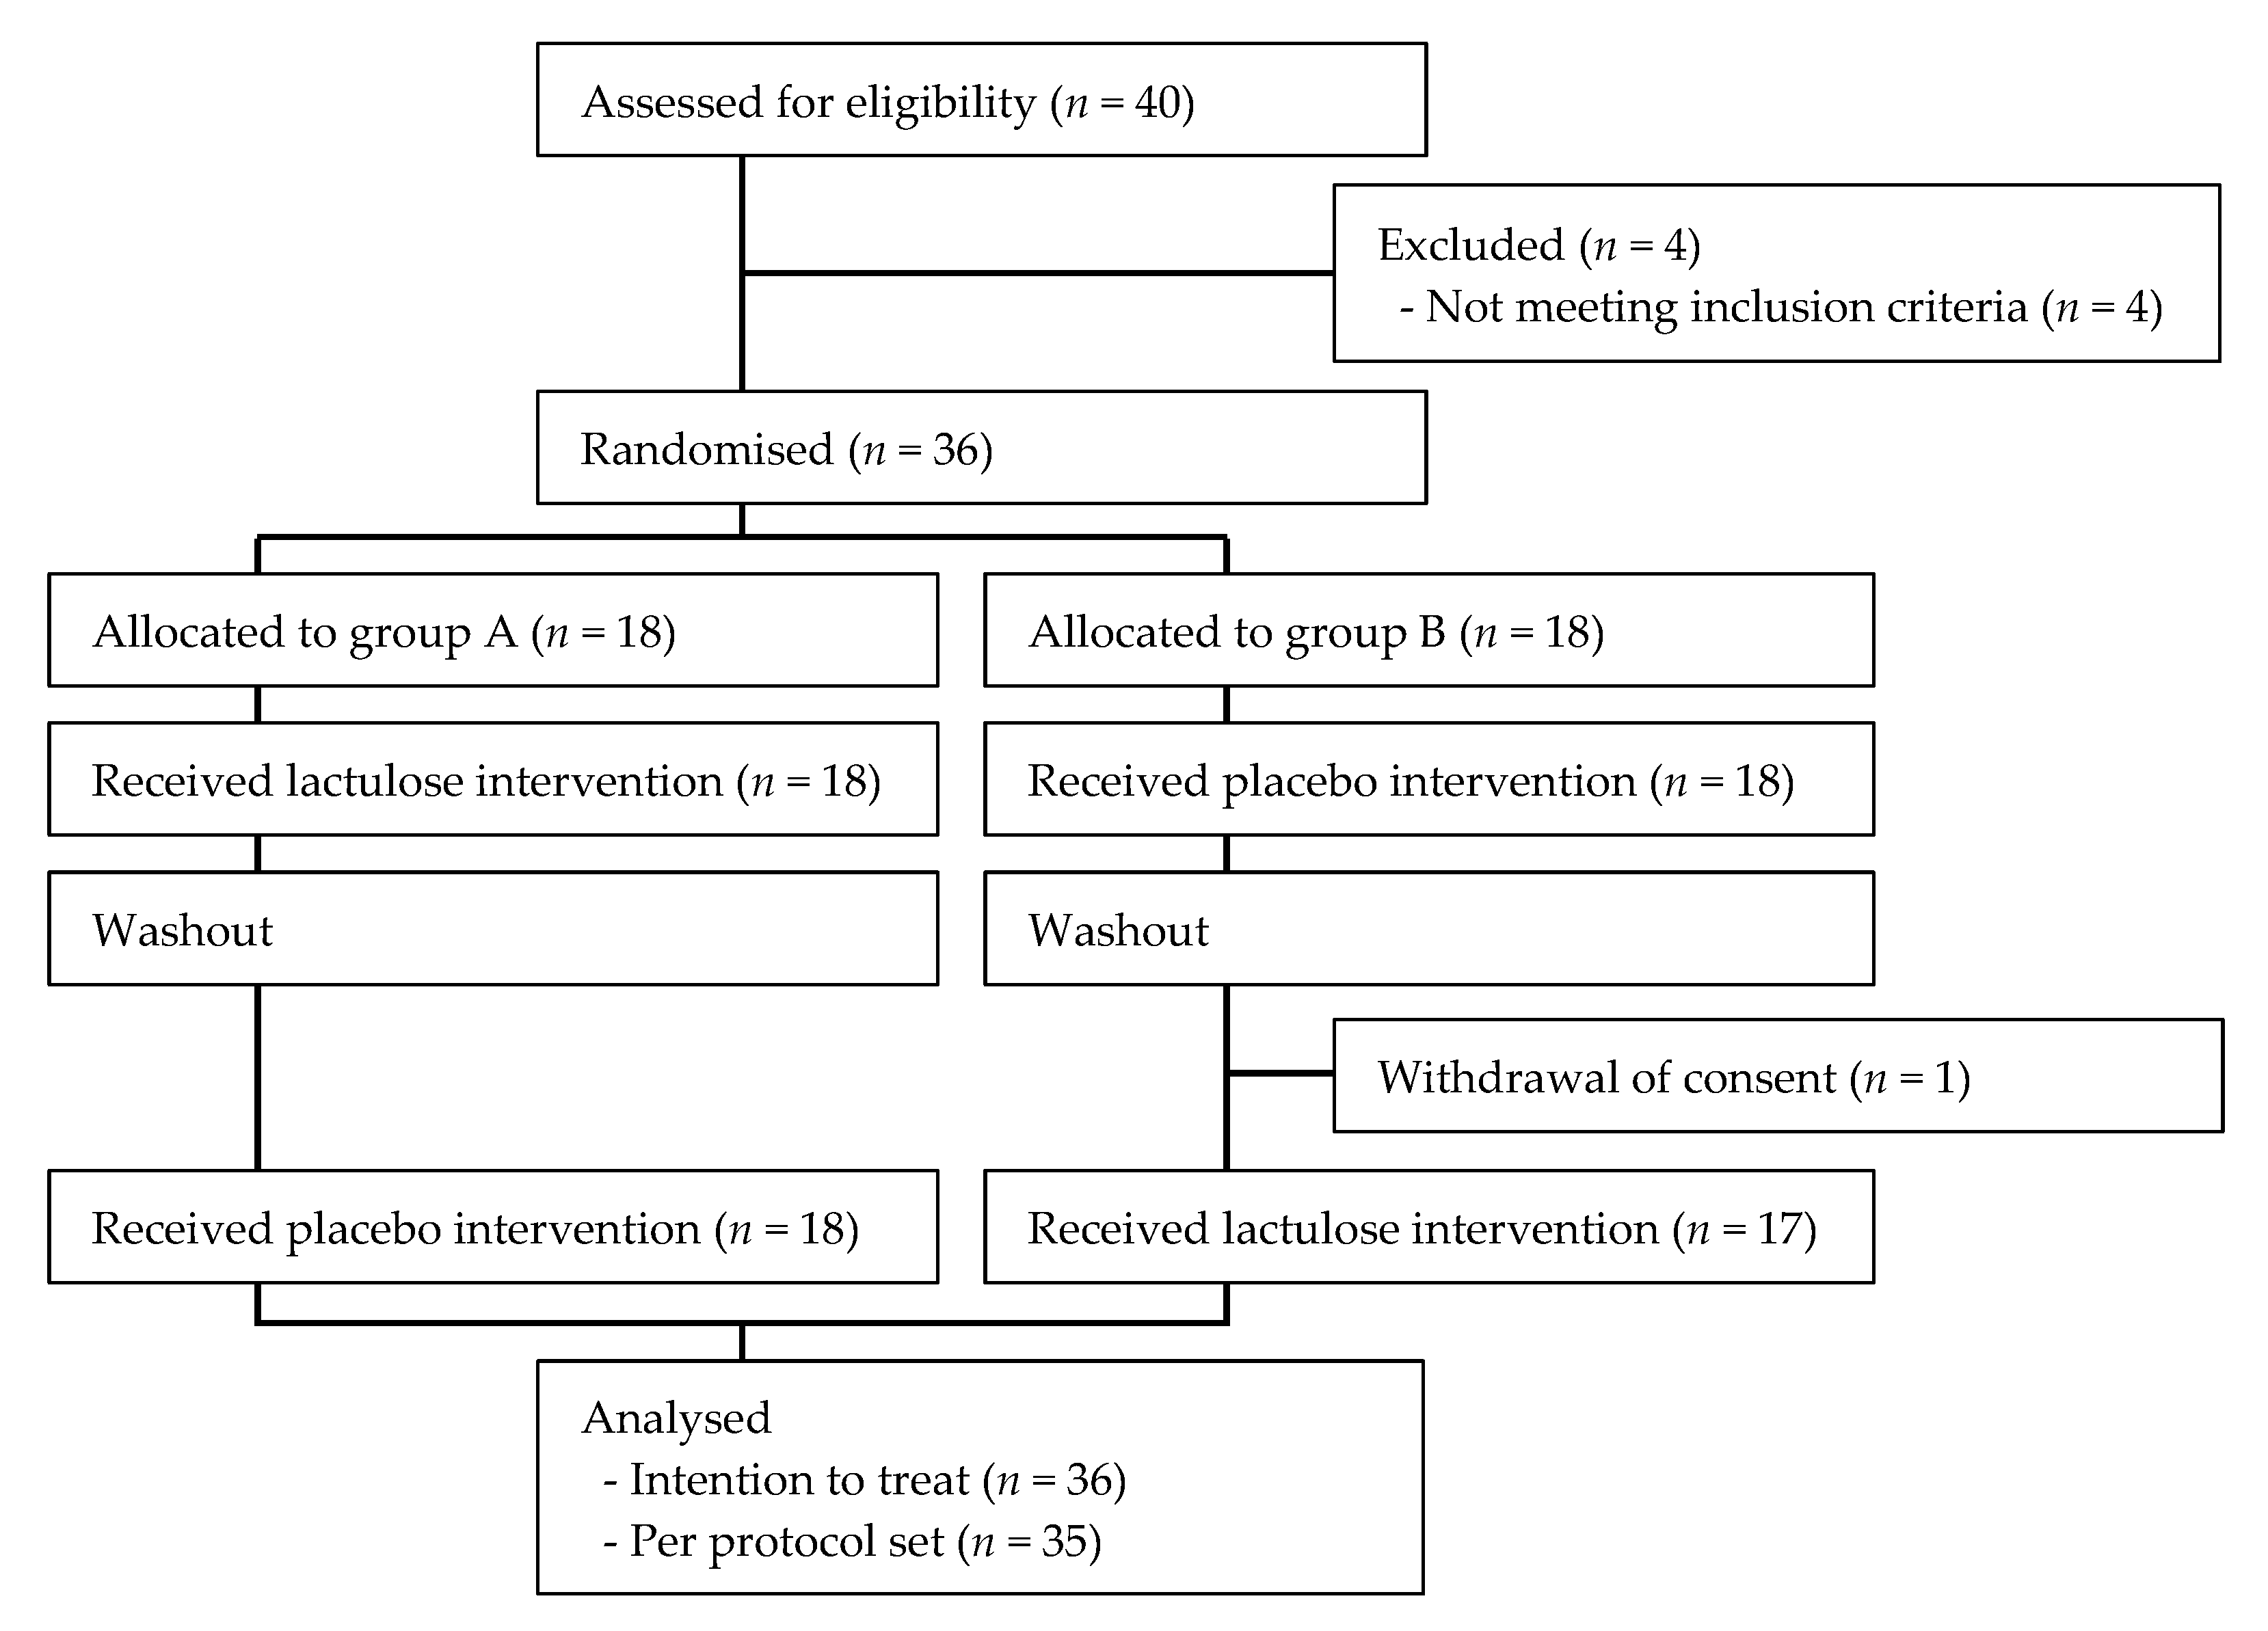
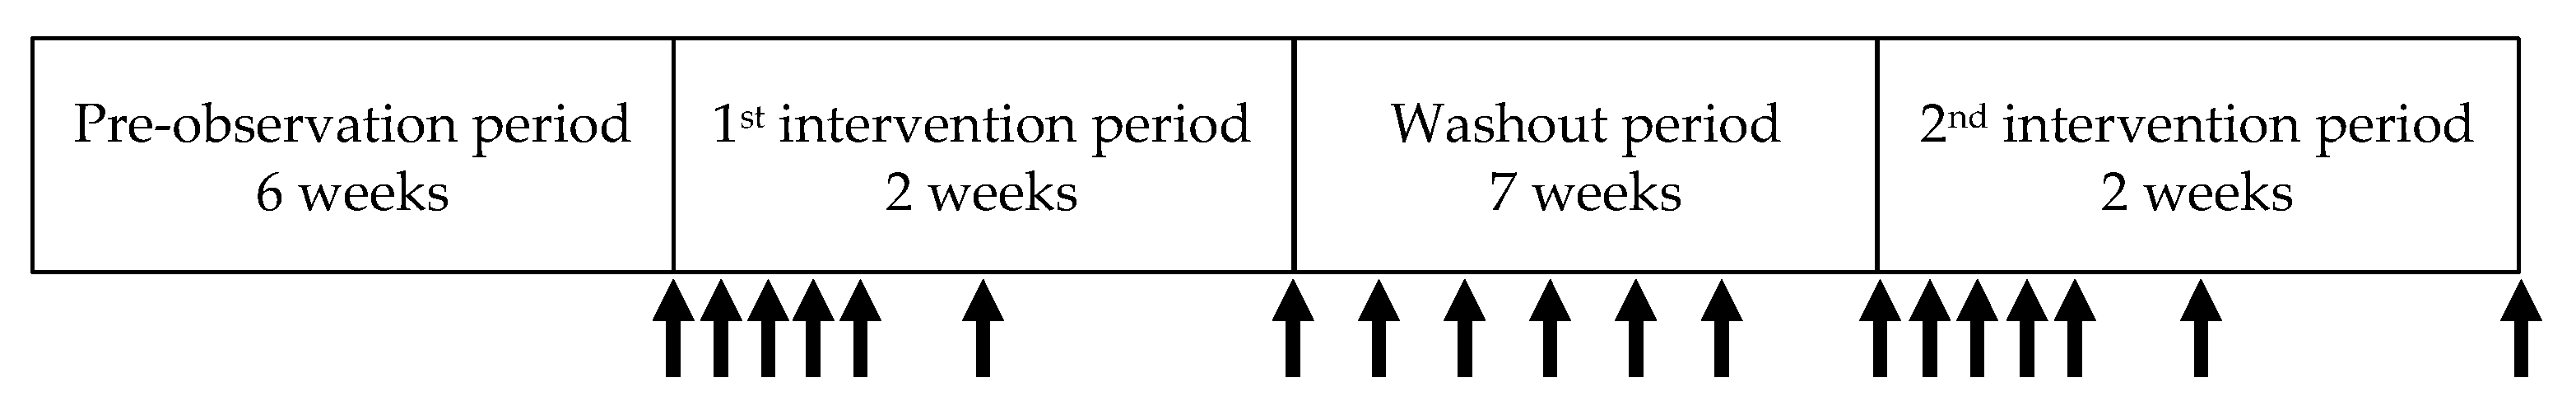
2.1. Trial Design
2.2. Participants
2.3. Randomisation
2.4. Intervention
2.5. Outcomes
2.6. Faecal Sample Collection
2.7. DNA Extraction
2.8. Percentage of Bifidobacterium in the Faecal Microbiome
2.9. Cell Numbers of Bifidobacterium
2.10. Recording of Other Outcomes
2.11. Statistical Methods
3. Results
3.1. Participants
3.2. Compliance
3.3. Diet Survey
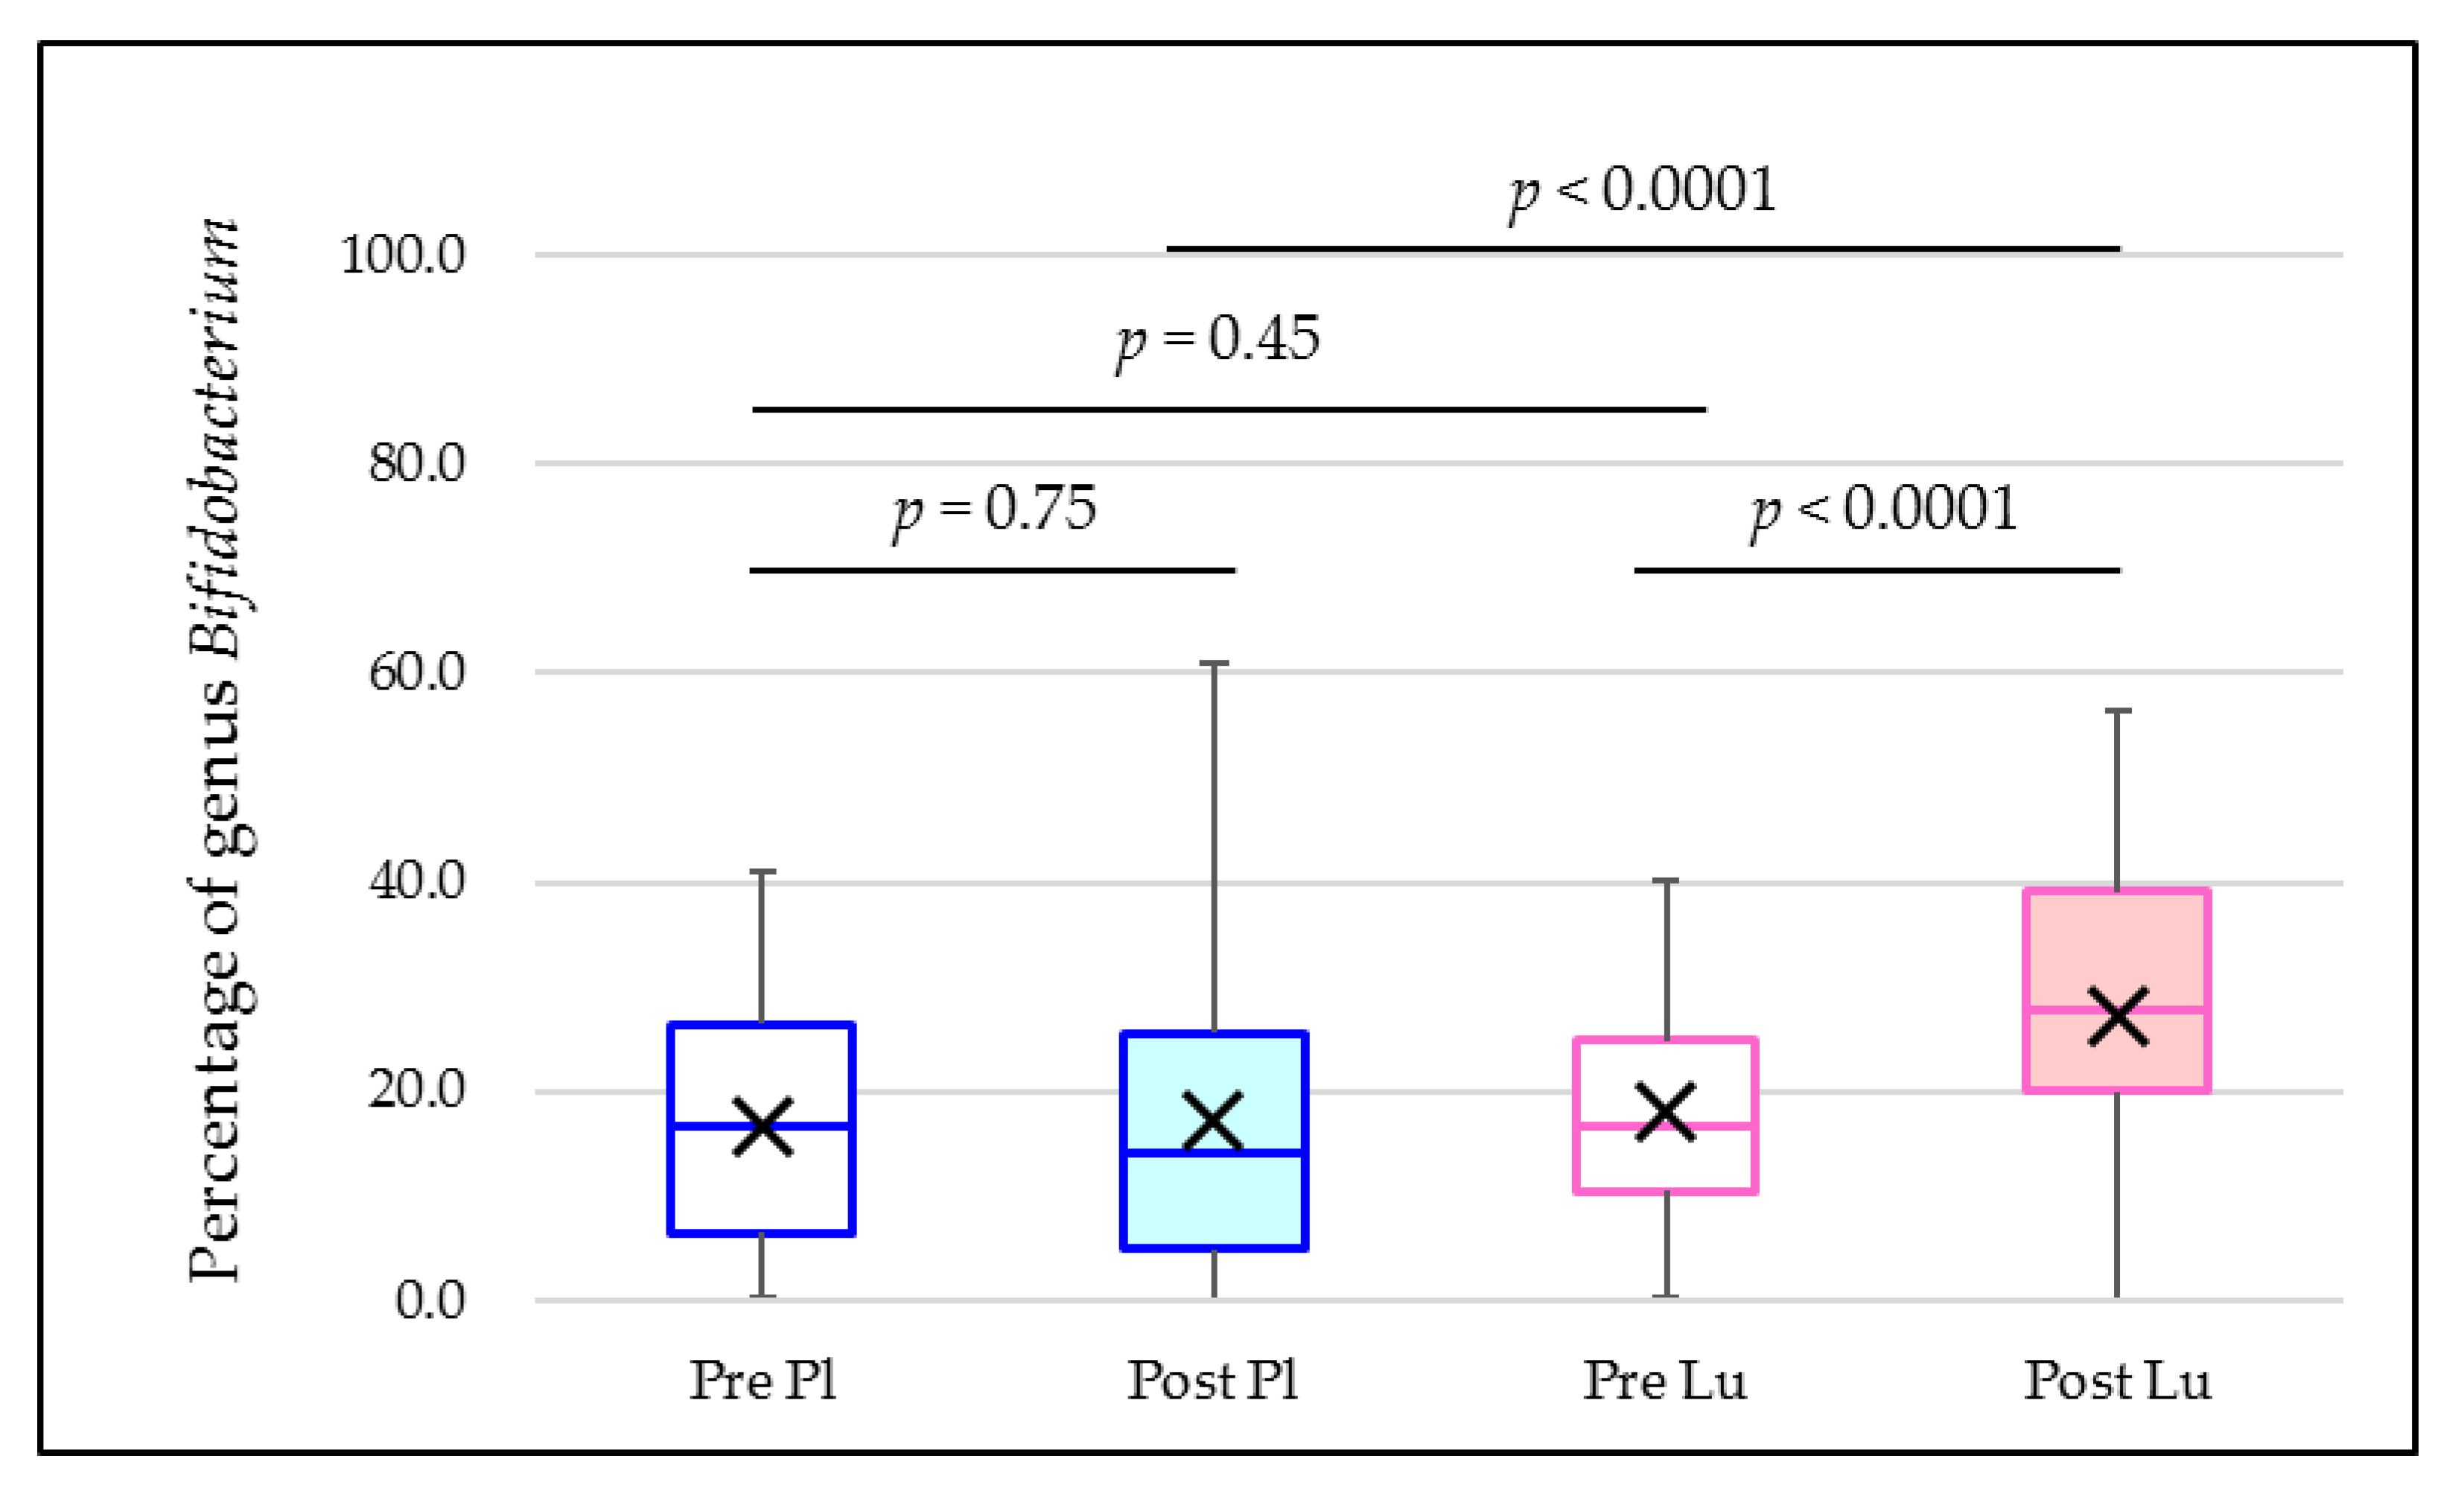
3.4. Percentage of Bifidobacterium in the Faecal Microbiome
3.5. Sensitivity Analysis
3.6. Other Outcomes
3.7. Adverse Events
4. Discussion
5. Conclusions
Author Contributions
Funding
Institutional Review Board Statement
Informed Consent Statement
Data Availability Statement
Acknowledgments
Conflicts of Interest
Appendix A

| Genus (A) | n | Placebo | Lactulose | Difference 2 (95% CI 3) | p-Value |
|---|---|---|---|---|---|
| Blautia | 36 | 23.3 ± 1.2 | 23.3 ± 1.2 | - | - |
| Bifidobacterium | 36 | 17.4 ± 1.4 | 17.4 ± 1.4 | - | - |
| Coprococcus | 36 | 7.6 ± 0.9 | 7.6 ± 0.9 | - | - |
| Lachnospiraceae genus (Ruminococcus) 4 | 36 | 6.6 ± 0.8 | 6.6 ± 0.8 | - | - |
| Streptococcus | 36 | 6.5 ± 1.4 | 6.5 ± 1.4 | - | - |
| Lachnospiraceae gen. 4 | 36 | 4.2 ± 0.4 | 4.2 ± 0.4 | - | - |
| Faecalibacterium | 36 | 4.2 ± 0.6 | 4.2 ± 0.6 | - | - |
| Ruminococcus | 36 | 4.1 ± 0.6 | 4.1 ± 0.6 | - | - |
| Collinsella | 36 | 2.6 ± 0.3 | 2.6 ± 0.3 | - | - |
| Gemmiger | 36 | 2.0 ± 0.3 | 2.0 ± 0.3 | - | - |
| Genus (B) | n | Placebo | Lactulose | Difference 2 (95% CI 3) | p-Value |
| Blautia | 36 | 22.3 ± 1.2 | 23.5 ± 1.3 | 1.2 (−2.3 to 4.9) | 0.47 |
| Bifidobacterium | 36 | 16.2 ± 1.6 | 17.0 ± 1.6 | 0.8 (−3.9 to 5.5) | 0.74 |
| Coprococcus | 36 | 7.9 ± 0.5 | 7.9 ± 0.5 | −0.0 (−1.4 to 1.4) | 0.99 |
| Lachnospiraceae genus (Ruminococcus) 4 | 36 | 6.1 ± 0.7 | 5.2 ± 0.7 | −0.9 (−3.6 to 1.8) | 0.51 |
| Streptococcus | 36 | 5.3 ± 0.9 | 6.3 ± 0.9 | 1.0 (−1.9 to 4.0) | 0.49 |
| Lachnospiraceae gen. 4 | 36 | 4.4 ± 0.5 | 4.1 ± 0.5 | −0.3 (−1.6 to 1.1) | 0.67 |
| Faecalibacterium | 36 | 3.4 ± 0.5 | 3.3 ± 0.6 | −0.1 (−1.8 to 1.5) | 0.83 |
| Ruminococcus | 36 | 5.1 ± 0.7 | 4.9 ± 0.7 | −0.2 (−1.9 to 1.6) | 0.84 |
| Collinsella | 36 | 2.7 ± 0.3 | 2.6 ± 0.3 | −0.1 (−1.0 to 0.9) | 0.88 |
| Gemmiger | 36 | 3.0 ± 0.6 | 3.3 ± 0.6 | 0.3 (−0.9 to 1.5) | 0.61 |
| Genus (C) | n | Placebo | Lactulose | Difference 2 (95% CI 3) | p-Value |
| Blautia | 36 | 21.5 ± 1.2 | 19.2 ± 1.2 | −2.3 (−4.7 to 0.1) | 0.062 |
| Bifidobacterium | 36 | 17.1 ± 1.2 | 20.5 ± 1.2 | 3.4 (0.6 to 6.3) | 0.021 |
| Coprococcus | 36 | 9.0 ± 0.6 | 8.2 ± 0.6 | −0.8 (−2.3 to 0.6) | 0.23 |
| Lachnospiraceae genus (Ruminococcus) 4 | 36 | 6.4 ± 0.5 | 5.9 ± 0.5 | −0.5 (−1.8 to 0.8) | 0.45 |
| Streptococcus | 36 | 5.3 ± 1.0 | 5.4 ± 1.0 | 0.1 (−2.9 to 3.2) | 0.93 |
| Lachnospiraceae gen. 4 | 36 | 4.7 ± 0.6 | 4.5 ± 0.7 | −0.2 (−2.0 to 1.6) | 0.79 |
| Faecalibacterium | 36 | 4.5 ± 0.6 | 4.4 ± 0.6 | −0.1 (−2.0 to 1.9) | 0.96 |
| Ruminococcus | 36 | 4.4 ± 0.7 | 3.7 ± 0.7 | −0.7 (−3.0 to 1.6) | 0.53 |
| Collinsella | 36 | 2.4 ± 0.4 | 3.0 ± 0.4 | 0.6 (−0.5 to 1.7) | 0.30 |
| Gemmiger | 36 | 1.9 ± 0.6 | 2.5 ± 0.6 | 0.6 (−1.7 to 2.9) | 0.59 |
| Genus (D) | n | Placebo | Lactulose | Difference 2 (95% CI 3) | p-Value |
| Blautia | 36 | 23.2 ± 1.5 | 19.8 ± 1.6 | −3.4 (−7.1 to 0.3) | 0.067 |
| Bifidobacterium | 36 | 17.2 ± 1.2 | 22.2 ± 1.3 | 5.0 (1.3 to 8.7) | 0.010 |
| Coprococcus | 36 | 7.6 ± 0.6 | 6.5 ± 0.6 | −1.1 (−2.3 to 0.3) | 0.11 |
| Lachnospiraceae genus (Ruminococcus) 4 | 36 | 5.5 ± 1.0 | 6.3 ± 1.0 | 0.8 (−1.5 to 3.1) | 0.49 |
| Streptococcus | 36 | 4.7 ± 0.7 | 3.6 ± 0.7 | −1.1 (−3.4 to 1.1) | 0.30 |
| Lachnospiraceae gen. 4 | 36 | 4.2 ± 0.5 | 3.8 ± 0.5 | −0.4 (−2.0 to 1.3) | 0.68 |
| Faecalibacterium | 36 | 5.1 ± 0.6 | 3.6 ± 0.6 | −1.5 (−3.8 to 0.8) | 0.19 |
| Ruminococcus | 36 | 5.1 ± 0.6 | 3.9 ± 0.7 | −1.2 (−2.9 to 0.4) | 0.13 |
| Collinsella | 36 | 2.5 ± 0.5 | 3.3 ± 0.5 | 0.8 (−0.8 to 2.4) | 0.30 |
| Gemmiger | 36 | 2.5 ± 0.3 | 1.9 ± 0.3 | −0.6 (−1.5 to 0.2) | 0.12 |
| Genus (E) | n | Placebo | Lactulose | Difference 2 (95% CI 3) | p-Value |
| Blautia | 36 | 21.6 ± 1.5 | 22.5 ± 1.5 | 0.9 (−2.0 to 3.7) | 0.53 |
| Bifidobacterium | 36 | 15.0 ± 1.5 | 22.4 ± 1.5 | 7.4 (3.1 to 11.6) | 0.0015 |
| Coprococcus | 36 | 8.4 ± 0.5 | 7.2 ± 0.5 | −1.2 (−2.7 to 0.3) | 0.10 |
| Lachnospiraceae genus (Ruminococcus) 4 | 36 | 5.9 ± 0.7 | 4.6 ± 0.7 | −1.3 (−2.9 to 0.3) | 0.10 |
| Streptococcus | 36 | 5.9 ± 1.0 | 2.8 ± 1.0 | −3.1 (−6.7 to 0.5) | 0.085 |
| Lachnospiraceae gen. 4 | 36 | 5.9 ± 0.7 | 5.2 ± 0.6 | −0.7 (−2.2 to 0.9) | 0.41 |
| Faecalibacterium | 36 | 3.8 ± 0.6 | 4.6 ± 0.6 | 0.8 (−0.8 to 2.6) | 0.29 |
| Ruminococcus | 36 | 4.4 ± 0.6 | 3.5 ± 0.6 | −0.9 (−2.6 to 0.7) | 0.25 |
| Collinsella | 36 | 2.4 ± 0.8 | 3.5 ± 0.7 | 1.1 (−0.8 to 3.1) | 0.24 |
| Gemmiger | 36 | 2.2 ± 0.7 | 2.7 ± 0.7 | 0.5 (−0.4 to 1.6) | 0.24 |
| Genus (F) | n | Placebo | Lactulose | Difference 2 (95% CI 3) | p-Value |
| Blautia | 36 | 23.9 ± 1.6 | 20.4 ± 1.5 | −3.5 (−7.6 to 0.6) | 0.092 |
| Bifidobacterium | 36 | 18.5 ± 1.5 | 24.8 ± 1.5 | 6.3 (1.6 to 11.0) | 0.010 |
| Coprococcus | 36 | 8.1 ± 0.7 | 6.6 ± 0.6 | −1.5 (−2.8 to −0.1) | 0.031 |
| Lachnospiraceae genus (Ruminococcus) 4 | 36 | 5.4 ± 0.5 | 4.5 ± 0.5 | −0.9 (−2.5 to 0.6) | 0.21 |
| Streptococcus | 36 | 4.7 ± 0.9 | 3.5 ± 0.9 | −1.2 (−4.2 to 1.8) | 0.42 |
| Lachnospiraceae gen. 4 | 36 | 4.0 ± 0.5 | 4.5 ± 0.4 | 0.5 (−1.0 to 2.0) | 0.49 |
| Faecalibacterium | 36 | 4.1 ± 0.5 | 4.4 ± 0.5 | 0.3 (−1.3 to 2.0) | 0.66 |
| Ruminococcus | 36 | 3.7 ± 0.6 | 4.0 ± 0.6 | 0.3 (−2.0 to 2.5) | 0.80 |
| Collinsella | 36 | 2.8 ± 0.9 | 3.7 ± 0.8 | 0.9 (−1.5 to 3.3) | 0.46 |
| Gemmiger | 36 | 3.2 ± 0.7 | 2.7 ± 0.7 | −0.5 (−2.0 to 1.0) | 0.50 |
| Genus (G) | n | Placebo | Lactulose | Difference 2 (95% CI 3) | p-Value |
| Blautia | 36 | 23.8 ± 1.8 | 21.5 ± 1.8 | −2.3 (−6.7 to 2.1) | 0.30 |
| Bifidobacterium | 36 | 17.9 ± 1.7 | 26.7 ± 1.7 | 8.8 (3.9 to 13.7) | 0.0010 |
| Coprococcus | 36 | 7.7 ± 0.7 | 6.2 ± 0.7 | −1.5 (−3.8 to 0.7) | 0.18 |
| Lachnospiraceae genus (Ruminococcus) 4 | 36 | 5.5 ± 0.6 | 4.6 ± 0.6 | −0.9 (−2.6 to 0.8) | 0.29 |
| Streptococcus | 36 | 4.4 ± 1.0 | 4.1 ± 1.0 | −0.3 (−2.7 to 2.1) | 0.79 |
| Lachnospiraceae gen. 4 | 36 | 5.4 ± 0.6 | 4.7 ± 0.6 | −0.7 (−2.3 to 0.8) | 0.32 |
| Faecalibacterium | 36 | 4.7 ± 0.7 | 4.7 ± 0.7 | −0.0 (−0.0 to 0.0) | 1.00 |
| Ruminococcus | 36 | 4.2 ± 0.6 | 3.6 ± 0.6 | −0.6 (−1.6 to 0.5) | 0.31 |
| Collinsella | 36 | 2.5 ± 0.4 | 3.0 ± 0.4 | 0.5 (−0.7 to 1.7) | 0.43 |
| Gemmiger | 36 | 2.4 ± 0.4 | 2.1 ± 0.4 | −0.3 (−1.1 to 0.6) | 0.57 |
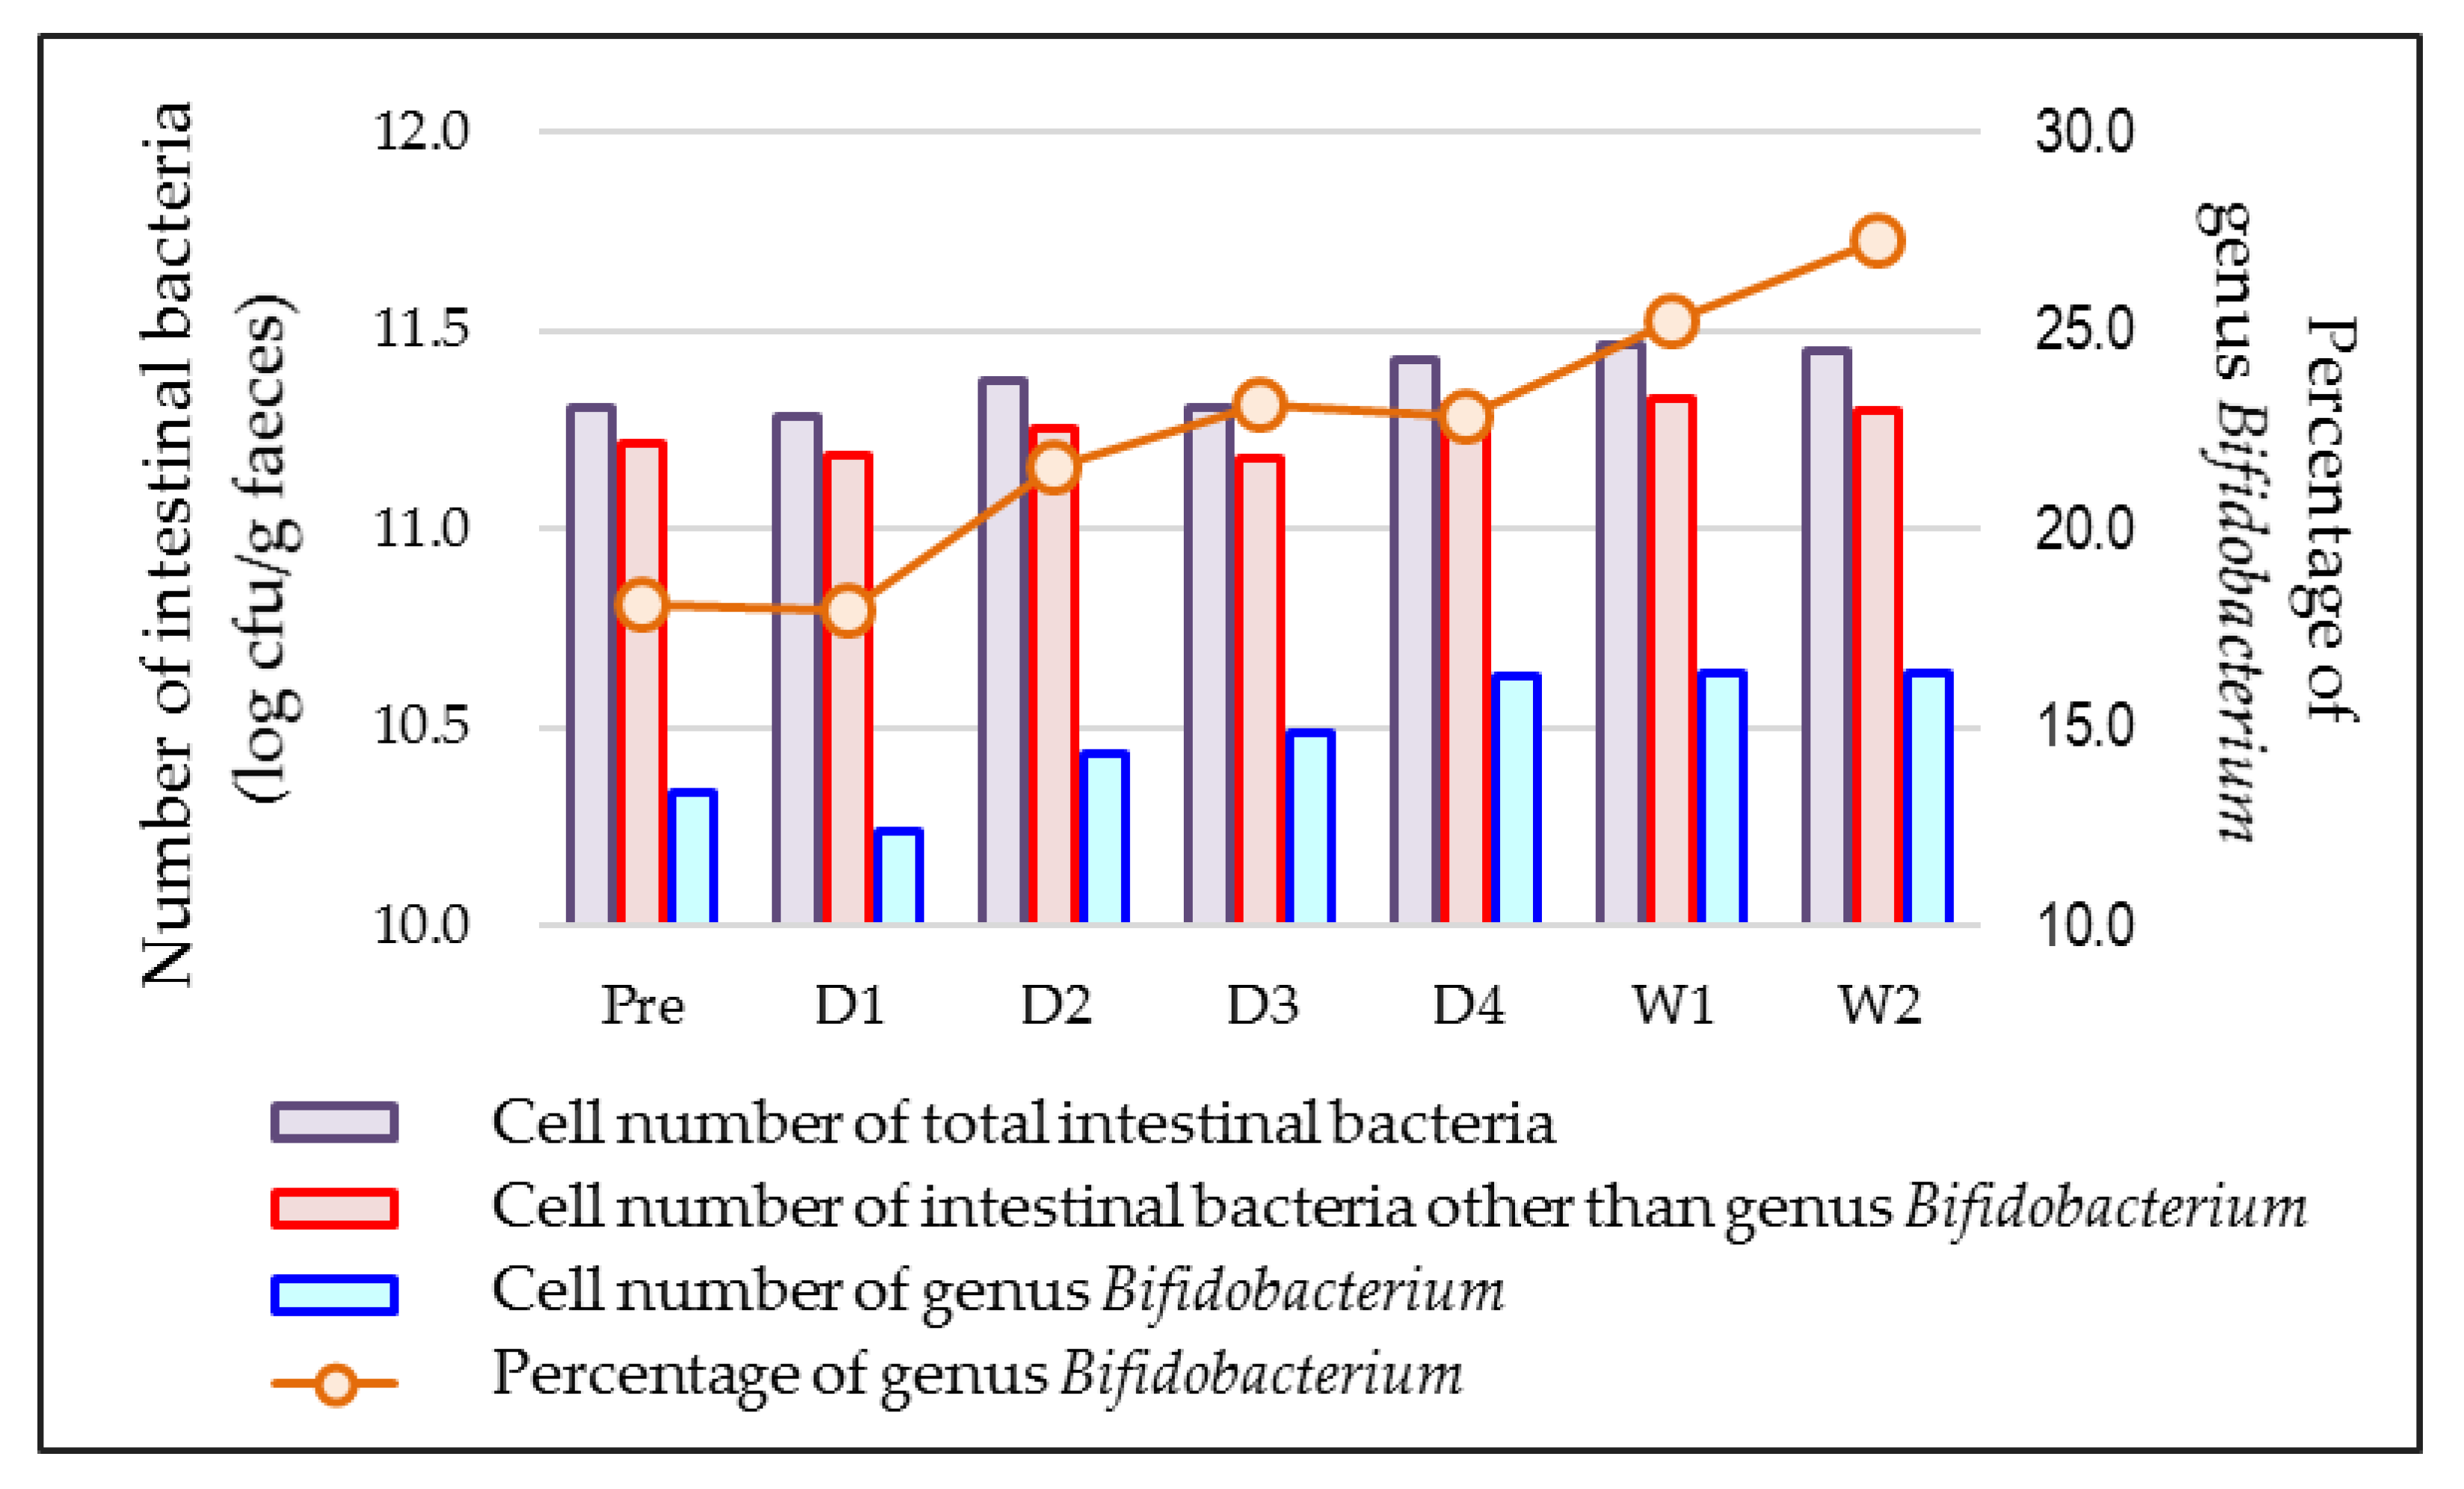
| Time of Sampling (A) | n 2 | Percentage of Genus Bifidobacterium | p-Value vs. before Lactulose Ingestion |
|---|---|---|---|
| before lactulose ingestion | 35 | 18.1 ± 11.9 | - |
| One day after starting lactulose ingestion | 27 | 18.0 ± 15.2 | 0.79 |
| Two days after starting lactulose ingestion | 28 | 21.5 ± 15.6 | 0.0044 |
| Three days after starting lactulose ingestion | 27 | 23.2 ± 15.1 | 0.0002 |
| Four days after starting lactulose ingestion | 27 | 22.8 ± 12.9 | 0.0042 |
| One week after starting lactulose ingestion | 35 | 25.2 ± 13.2 | <0.0001 |
| Two weeks after starting lactulose ingestion | 35 | 27.3 ± 14.8 | <0.0001 |
| Time of Sampling (B) | n2 | Percentage of Genus Bifidobacterium | p-Value vs. before Placebo Ingestion |
| before placebo ingestion | 35 | 16.8 ± 12.1 | - |
| One day after starting placebo ingestion | 28 | 15.2 ± 10.8 | 0.99 |
| Two days after starting placebo ingestion | 29 | 16.1 ± 11.3 | 0.76 |
| Three days after starting placebo ingestion | 30 | 16.4 ± 13.5 | 0.72 |
| Four days after starting placebo ingestion | 25 | 14.6 ± 10.0 | 0.20 |
| One week after starting placebo ingestion | 34 | 18.1 ± 13.2 | 0.58 |
| Two weeks after starting placebo ingestion | 35 | 17.3 ± 15.1 | 0.75 |
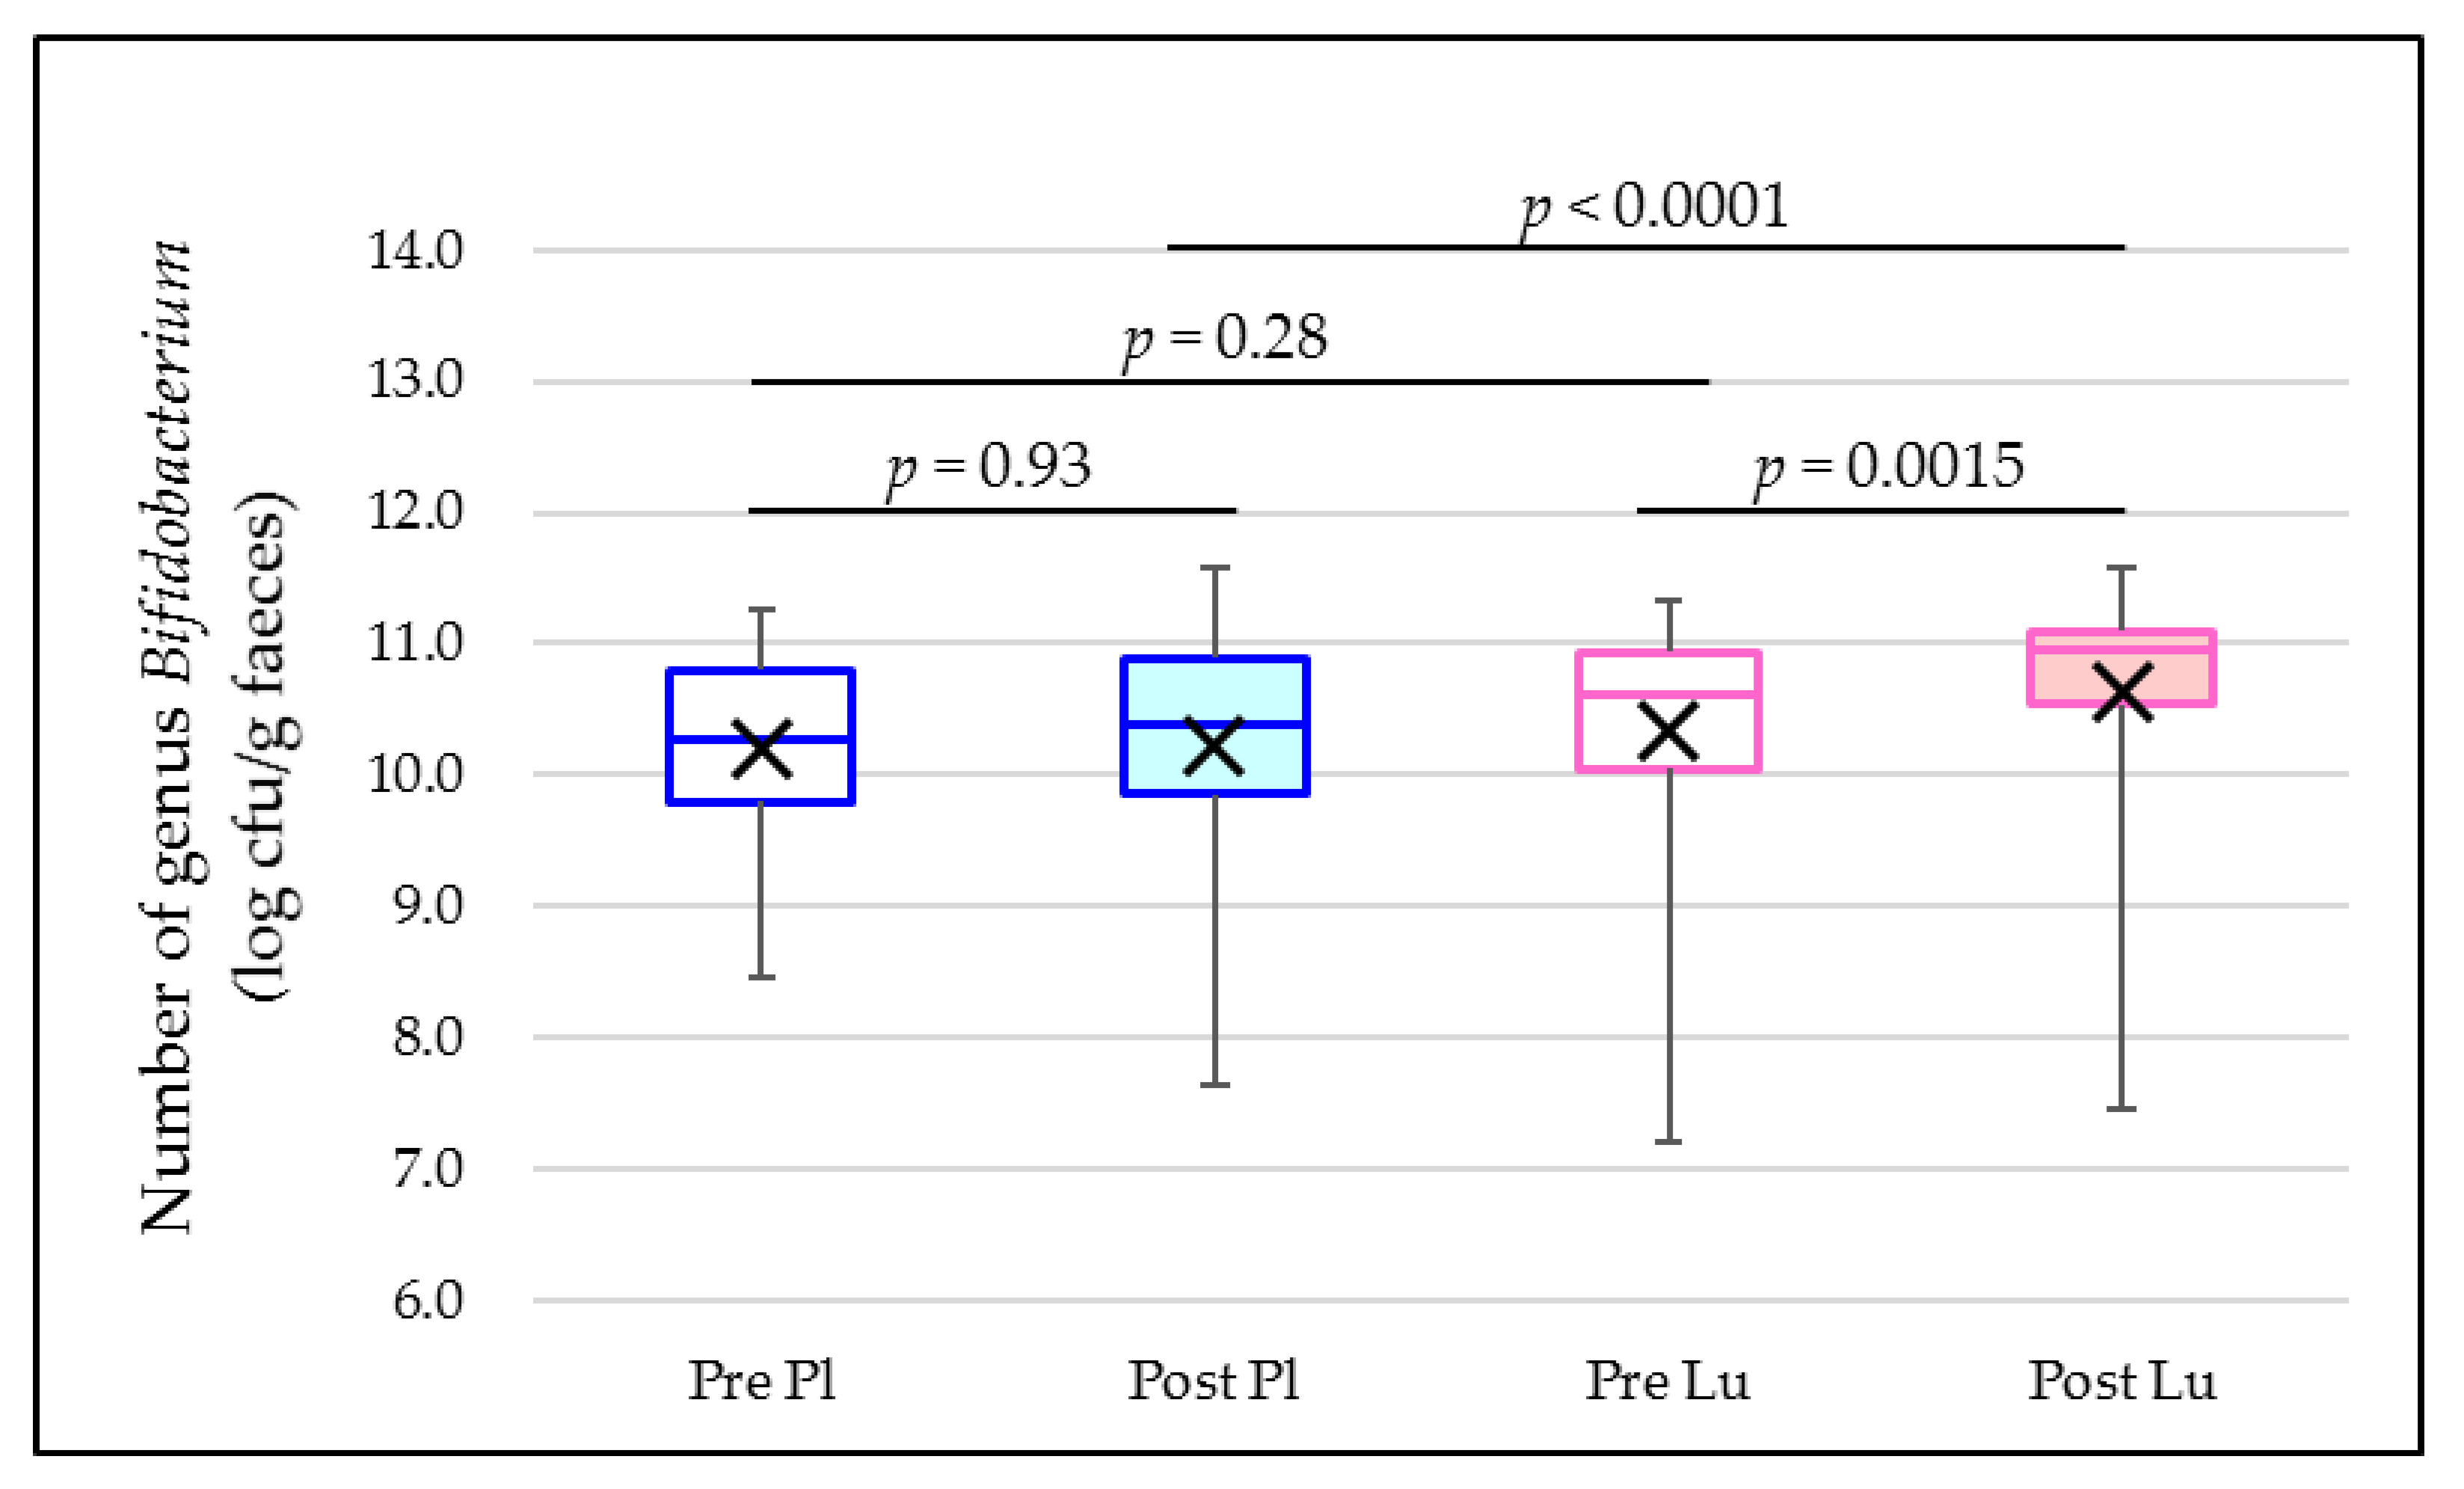
| Time of Sampling (A) | n 2 | Cell Number of Genus Bifidobacterium (log CFU 3/g faeces) | p-Value vs. before Lactulose Ingestion |
|---|---|---|---|
| before lactulose ingestion | 35 | 10.33 ± 0.93 | - |
| One day after starting lactulose ingestion | 27 | 10.24 ± 1.08 | 0.68 |
| Two days after starting lactulose ingestion | 28 | 10.44 ± 1.10 | 0.0093 |
| Three days after starting lactulose ingestion | 27 | 10.48 ± 1.05 | 0.025 |
| Four days after starting lactulose ingestion | 27 | 10.63 ± 0.87 | <0.0001 |
| One week after starting lactulose ingestion | 35 | 10.64 ± 1.04 | 0.0025 |
| Two weeks after starting lactulose ingestion | 35 | 10.63 ± 0.95 | 0.0015 |
| Time of Sampling (B) | n2 | Cell Number of Genus Bifidobacterium (log CFU 3/g faeces) | p-Value vs. before Placebo Ingestion |
| before placebo ingestion | 35 | 10.21 ± 0.76 | - |
| One day after starting placebo ingestion | 28 | 10.18 ± 0.97 | 0.65 |
| Two days after starting placebo ingestion | 29 | 10.26 ± 0.98 | 0.25 |
| Three days after starting placebo ingestion | 30 | 10.19 ± 1.04 | 0.75 |
| Four days after starting placebo ingestion | 25 | 10.21 ± 1.07 | 0.87 |
| One week after starting placebo ingestion | 34 | 10.31 ± 0.93 | 0.36 |
| Two weeks after starting placebo ingestion | 35 | 10.22 ± 0.95 | 0.93 |


References
- Comprehensive Survey of Living Conditions 2019. Available online: https://www.e-stat.go.jp/dbview?sid=0003442361 (accessed on 6 July 2022).
- Seki, N.; Hitoshi, S. Lactose as a source for lactulose and other functional lactose derivatives. Int. Dairy J. 2012, 22, 110–115. [Google Scholar] [CrossRef]
- Terada, A.; Hara, H.; Kataoka, M.; Mitsuoka, T. Effect of Lactulose on the Composition and Metabolic Activity of the Human Faecal Flora. Microb. Ecol. Health Dis. 1992, 5, 43–50. [Google Scholar] [CrossRef]
- Takahashi, S.; Tomita, J.; Nishioka, K.; Hisada, T.; Nishijima, M. Development of a Prokaryotic Universal Primer for Simultaneous Analysis of Bacteria and Archaea Using Next-Generation Sequencing. PLoS ONE 2014, 9, e105592. [Google Scholar] [CrossRef]
- Kato, K.; Ishida, S.; Tanaka, M.; Mitsuyama, E.; Xiao, J.Z.; Odamaki, T. Association between functional lactase variants and a high abundance of Bifidobacterium in the gut of healthy Japanese people. PLoS ONE 2018, 13, e0206189. [Google Scholar] [CrossRef] [PubMed]
- Callahan, B.J.; McMurdie, P.J.; Rosen, M.J.; Han, A.W.; Johnson, A.J.A.; Holmes, S.P. DADA2: High-resolution sample inference from Illumina amplicon data. Nat. Methods 2016, 13, 581–583. [Google Scholar] [CrossRef] [PubMed]
- Matsuki, T.; Watanabe, K.; Fujimoto, J.; Kado, Y.; Takada, T.; Matsumoto, K.; Tanaka, R. Quantitative PCR with 16S rRNA-gene-targeted species-specific primers for analysis of human intestinal bifidobacteria. Appl. Environ. Microb. 2004, 70, 167–173. [Google Scholar] [CrossRef] [PubMed]
- Lewis, S.J.; Heaton, K.W. Stool form scale as a useful guide to intestinal transit time. Scand. J. Gastroenterol. 1997, 32, 920–924. [Google Scholar] [CrossRef] [PubMed]
- Faul, F.; Erdfelder, E.; Buchner, A.; Lang, A.G. Statistical power analyses using G*Power 3.1: Tests for correlation and regression analyses. Behav. Res. Methods 2009, 41, 1149–1160. [Google Scholar] [CrossRef] [PubMed]
- Kawai, M.; Setoyama, H.; Takeda, T.; Shimizu, K.; Satoh, M.; Manabe, K.; Makino, T.; Watanabe, O.; Yoshioka, M.; Nonaka, C.; et al. Effect of Fermented Milk Containing Bifidobacterium on Bowel Habits of Healthy Volunteers with Mild Constipation. Bio. Sci. Microflora 2011, 25, 181–187. (In Japanese) [Google Scholar] [CrossRef]
- Sakai, Y.; Seki, N.; Hamano, H.; Ochi, H.; Abe, F.; Shimizu, F.; Masuda, K.; Iino, H. A study of the prebiotic effect of lactulose with low dosages on healthy Japanese women. Bio. Sci. Microbiota Food Health 2019, 38, 69–72. [Google Scholar] [CrossRef] [PubMed] [Green Version]
- Petuely, F. Bifidusflora bei Flaschenkindern durch bifidogene Substanzen (Bifidusfaktor). Z. Kinderheilkd. 1957, 79, 174–179. [Google Scholar] [CrossRef] [PubMed]


| Parameter | Whole Cohort | Group A (Lactulose First) | Group B (Placebo First) | p-Value |
|---|---|---|---|---|
| n = 36 | n = 18 | n = 18 | ||
| Sex (female/male) | 25/11 | 11/7 | 14/4 | 0.47 3 |
| Age (years) | 41.7 ± 11.2 | 42.1 ± 12.1 | 41.3 ± 10.5 | 0.84 4 |
| Body mass (kg) | 57.7 ± 11.0 | 59.0 ± 13.3 | 56.5 ± 8.1 | 0.51 4 |
| Height (m) | 1.61 ± 0.07 | 1.61 ± 0.08 | 1.61 ± 0.07 | 0.94 4 |
| BMI 2 (kg/m2) | 22.2 ± 3.1 | 22.6 ± 3.7 | 21.8 ± 2.3 | 0.45 4 |
| Defaecation frequency (days/week) | 4.9 ± 1.4 | 5.2 ± 1.3 | 4.6 ± 1.3 | 0.20 4 |
| Past medical history 5 (Y/N) | 0:36 | 0:18 | 0:18 | - |
| Morbidities (Y/N) | 0:36 | 0:18 | 0:18 | - |
| Smoking (>1 cigarette per week) (Y/N) | 3:33 | 2:16 | 1:17 | 1.00 3 |
| Drinking any alcohol (>2 times per week) (Y/N) | 8:28 | 3:15 | 5:13 | 0.69 3 |
| Parameter | n | Before the Intervention 3 | n | At the End of the Intervention 3 | p-Value 2 |
|---|---|---|---|---|---|
| Energy (kcal/day) | 36 | 1390 ± 514 | 35 | 1399 ± 572 | 0.97 |
| Mass (g/day) | 36 | 1679 ± 708 | 35 | 1673 ± 737 | 0.88 |
| Water (g/day) | 36 | 1379 ± 612 | 35 | 1370 ± 632 | 0.83 |
| Protein (g/day) | 36 | 54.8 ± 19.0 | 35 | 55.5 ± 21.0 | 0.85 |
| Fat (g/day) | 36 | 44.4 ± 17.1 | 35 | 44.1 ± 19.2 | 0.79 |
| Carbohydrate (g/day) | 36 | 181.2 ± 82.2 | 35 | 183.7 ± 84.3 | 0.89 |
| Soluble dietary fibre (g/day) | 36 | 2.2 ± 1.4 | 35 | 2.4 ± 1.4 | 0.58 |
| Insoluble dietary fibre (g/day) | 36 | 6.3 ± 3.4 | 35 | 6.6 ± 3.6 | 0.47 |
| Total dietary fibre (g/day) | 36 | 8.8 ± 4.9 | 35 | 9.2 ± 5.2 | 0.53 |
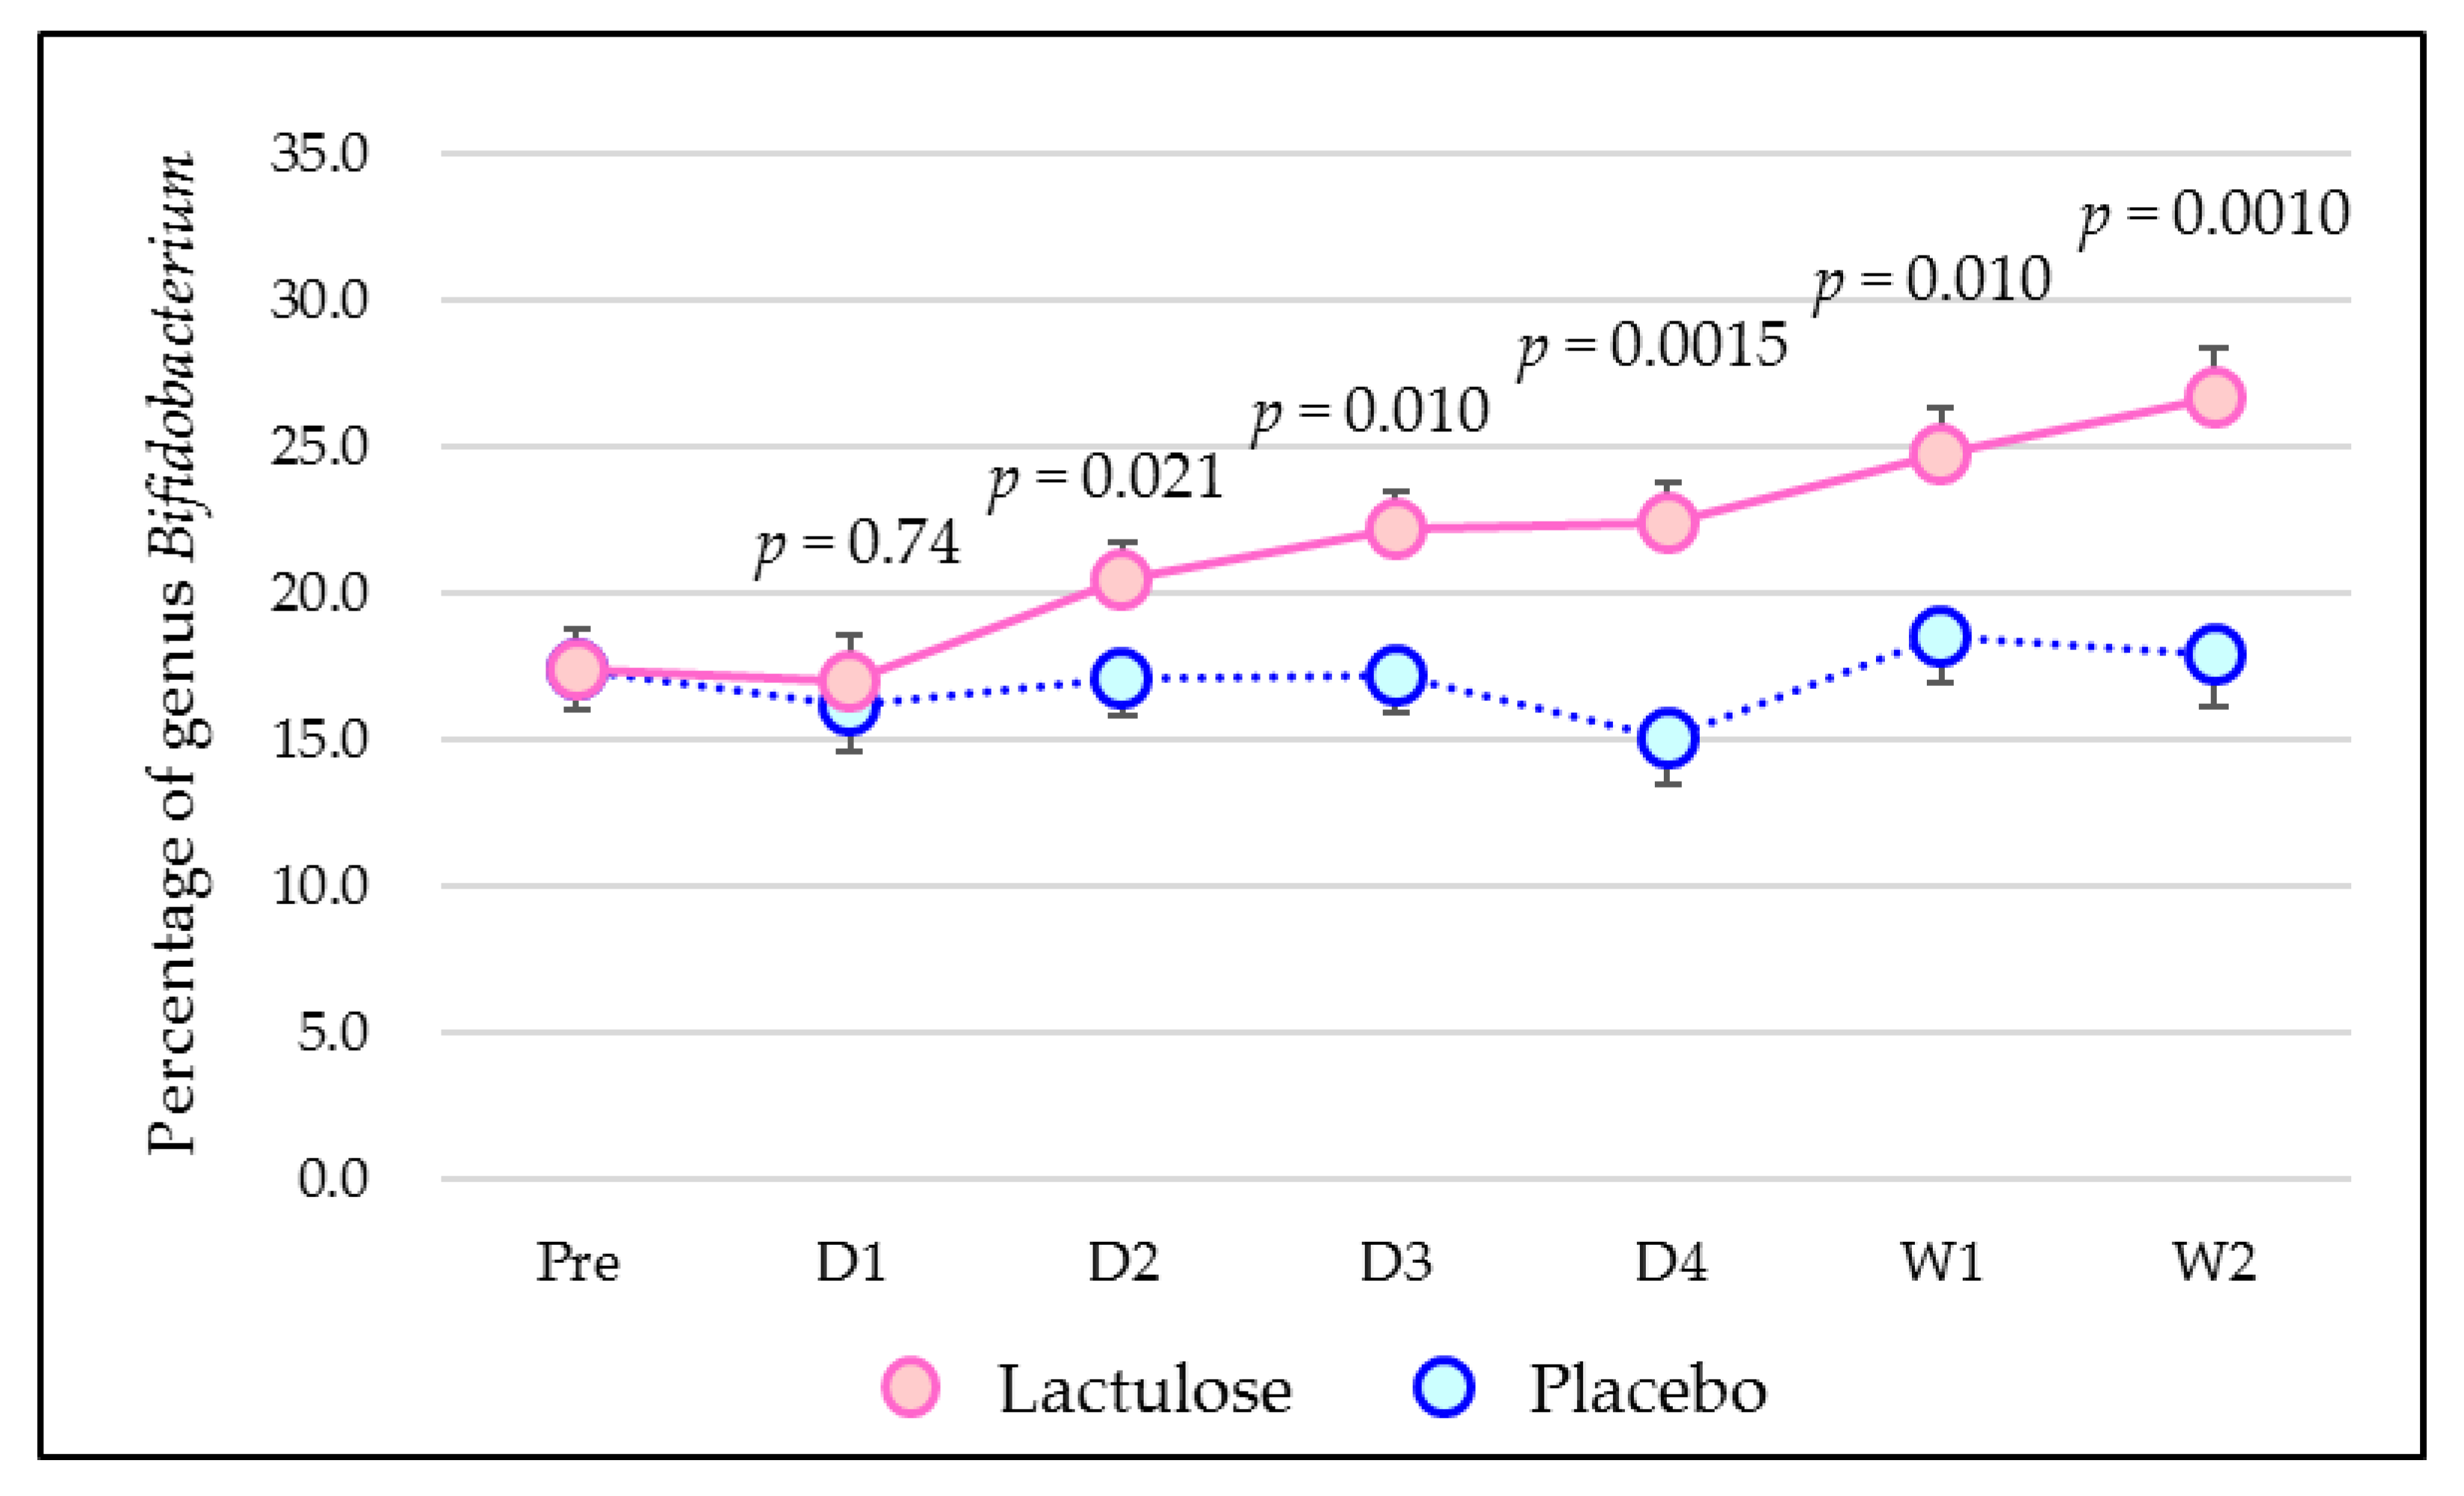
| Time of Sampling | n | Placebo | Lactulose | Difference 2 (95% CI 3) | p-Value |
|---|---|---|---|---|---|
| Just before the ingestion period | 36 | 17.4 ± 1.4 | 17.4 ± 1.4 | - | - |
| One day after starting test food ingestion | 36 | 16.2 ± 1.6 | 17.0 ± 1.6 | 0.8 (−3.9 to 5.5) | 0.74 |
| Two days after starting test food ingestion | 36 | 17.1 ± 1.2 | 20.5 ± 1.2 | 3.4 (0.6 to 6.3) | 0.021 |
| Three days after starting test food ingestion | 36 | 17.2 ± 1.2 | 22.2 ± 1.3 | 5.0 (1.3 to 8.7) | 0.010 |
| Four days after starting test food ingestion | 36 | 15.0 ± 1.5 | 22.4 ± 1.5 | 7.4 (3.1 to 11.6) | 0.0015 |
| One week after starting test food ingestion | 36 | 18.5 ± 1.5 | 24.8 ± 1.5 | 6.3 (1.6 to 11.0) | 0.010 |
| Two weeks after starting test food ingestion | 36 | 17.9 ± 1.7 | 26.7 ± 1.7 | 8.8 (3.9 to 13.7) | 0.0010 |
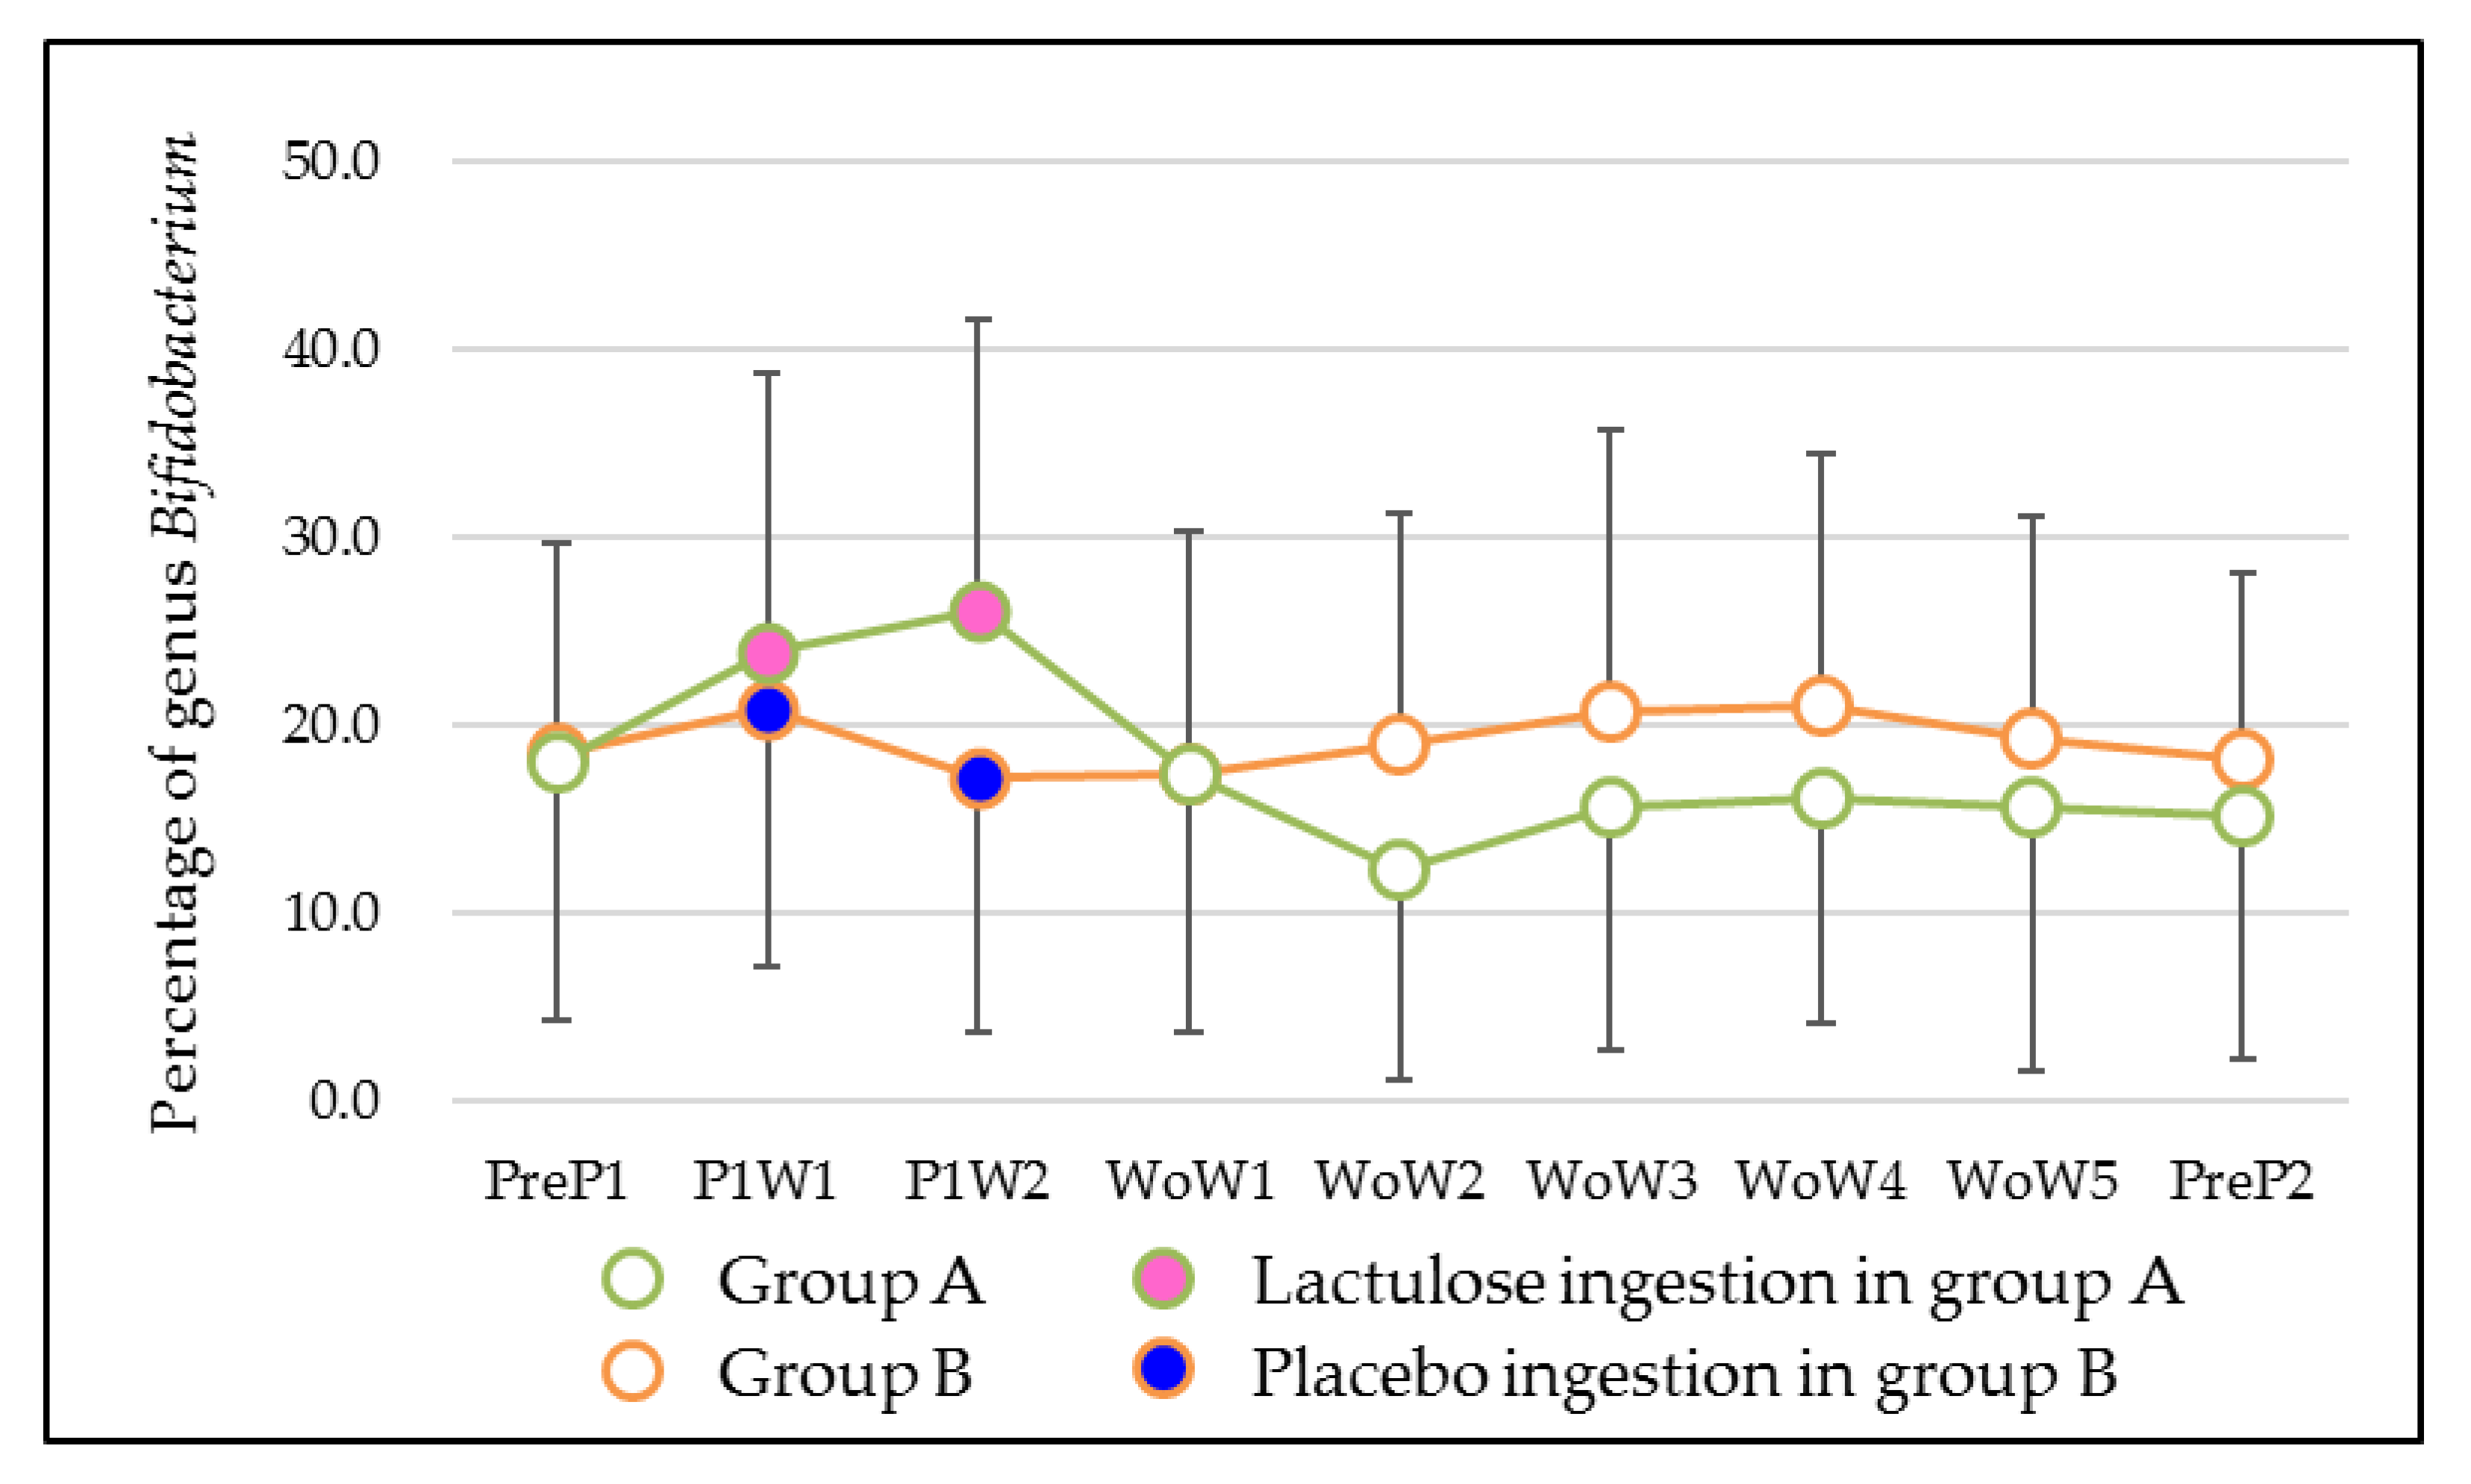
| Time of Sampling (A) | n 3 | Percentage of Genus Bifidobacterium | p-Value vs. before the First Ingestion Period | p-Value vs. Just before the Washout Period |
|---|---|---|---|---|
| Just before the first ingestion period | 18 | 18.1 ± 13.7 | - | - |
| One week after starting lactulose ingestion | 18 | 23.8 ± 15.0 | 0.0094 | - |
| Just before the washout period 4 | 18 | 26.2 ± 15.4 | 0.0040 | - |
| One week after the end of lactulose ingestion | 17 | 17.4 ± 12.8 | 0.88 | 0.036 |
| Two weeks after the end of lactulose ingestion | 17 | 12.2 ± 11.1 | 0.12 | 0.0002 |
| Three weeks after the end of lactulose ingestion | 18 | 15.6 ± 13.0 | 0.41 | 0.0032 |
| Four weeks after the end of lactulose ingestion | 18 | 16.1 ± 12.0 | 0.41 | 0.0018 |
| Five weeks after the end of lactulose ingestion | 18 | 15.5 ± 13.9 | 0.30 | 0.0016 |
| Seven weeks after the end of lactulose ingestion 5 | 18 | 15.2 ± 13.0 | 0.30 | 0.0012 |
| Time of Sampling (B) | n3 | Percentage of Genus Bifidobacterium | p-Value vs. before the First Ingestion Period | p-Value vs. Just before the Washout Period |
| Just before the first ingestion period | 17 | 18.5 ± 11.1 | - | - |
| One week after starting placebo ingestion | 17 | 20.8 ± 13.7 | 0.11 | - |
| Just before the washout period 4 | 17 | 17.2 ± 13.5 | 0.86 | - |
| One week after the end of placebo ingestion | 17 | 17.3 ± 13.6 | 0.94 | 0.96 |
| Two weeks after the end of placebo ingestion | 17 | 19.0 ± 12.2 | 0.40 | 0.29 |
| Three weeks after the end of placebo ingestion | 17 | 20.7 ± 14.9 | 0.30 | 0.073 |
| Four weeks after the end of placebo ingestion | 17 | 21.0 ± 13.4 | 0.17 | 0.027 |
| Five weeks after the end of placebo ingestion | 17 | 19.2 ± 11.8 | 0.48 | 0.23 |
| Seven weeks after the end of placebo ingestion 5 | 17 | 18.1 ± 10.0 | 0.80 | 0.62 |
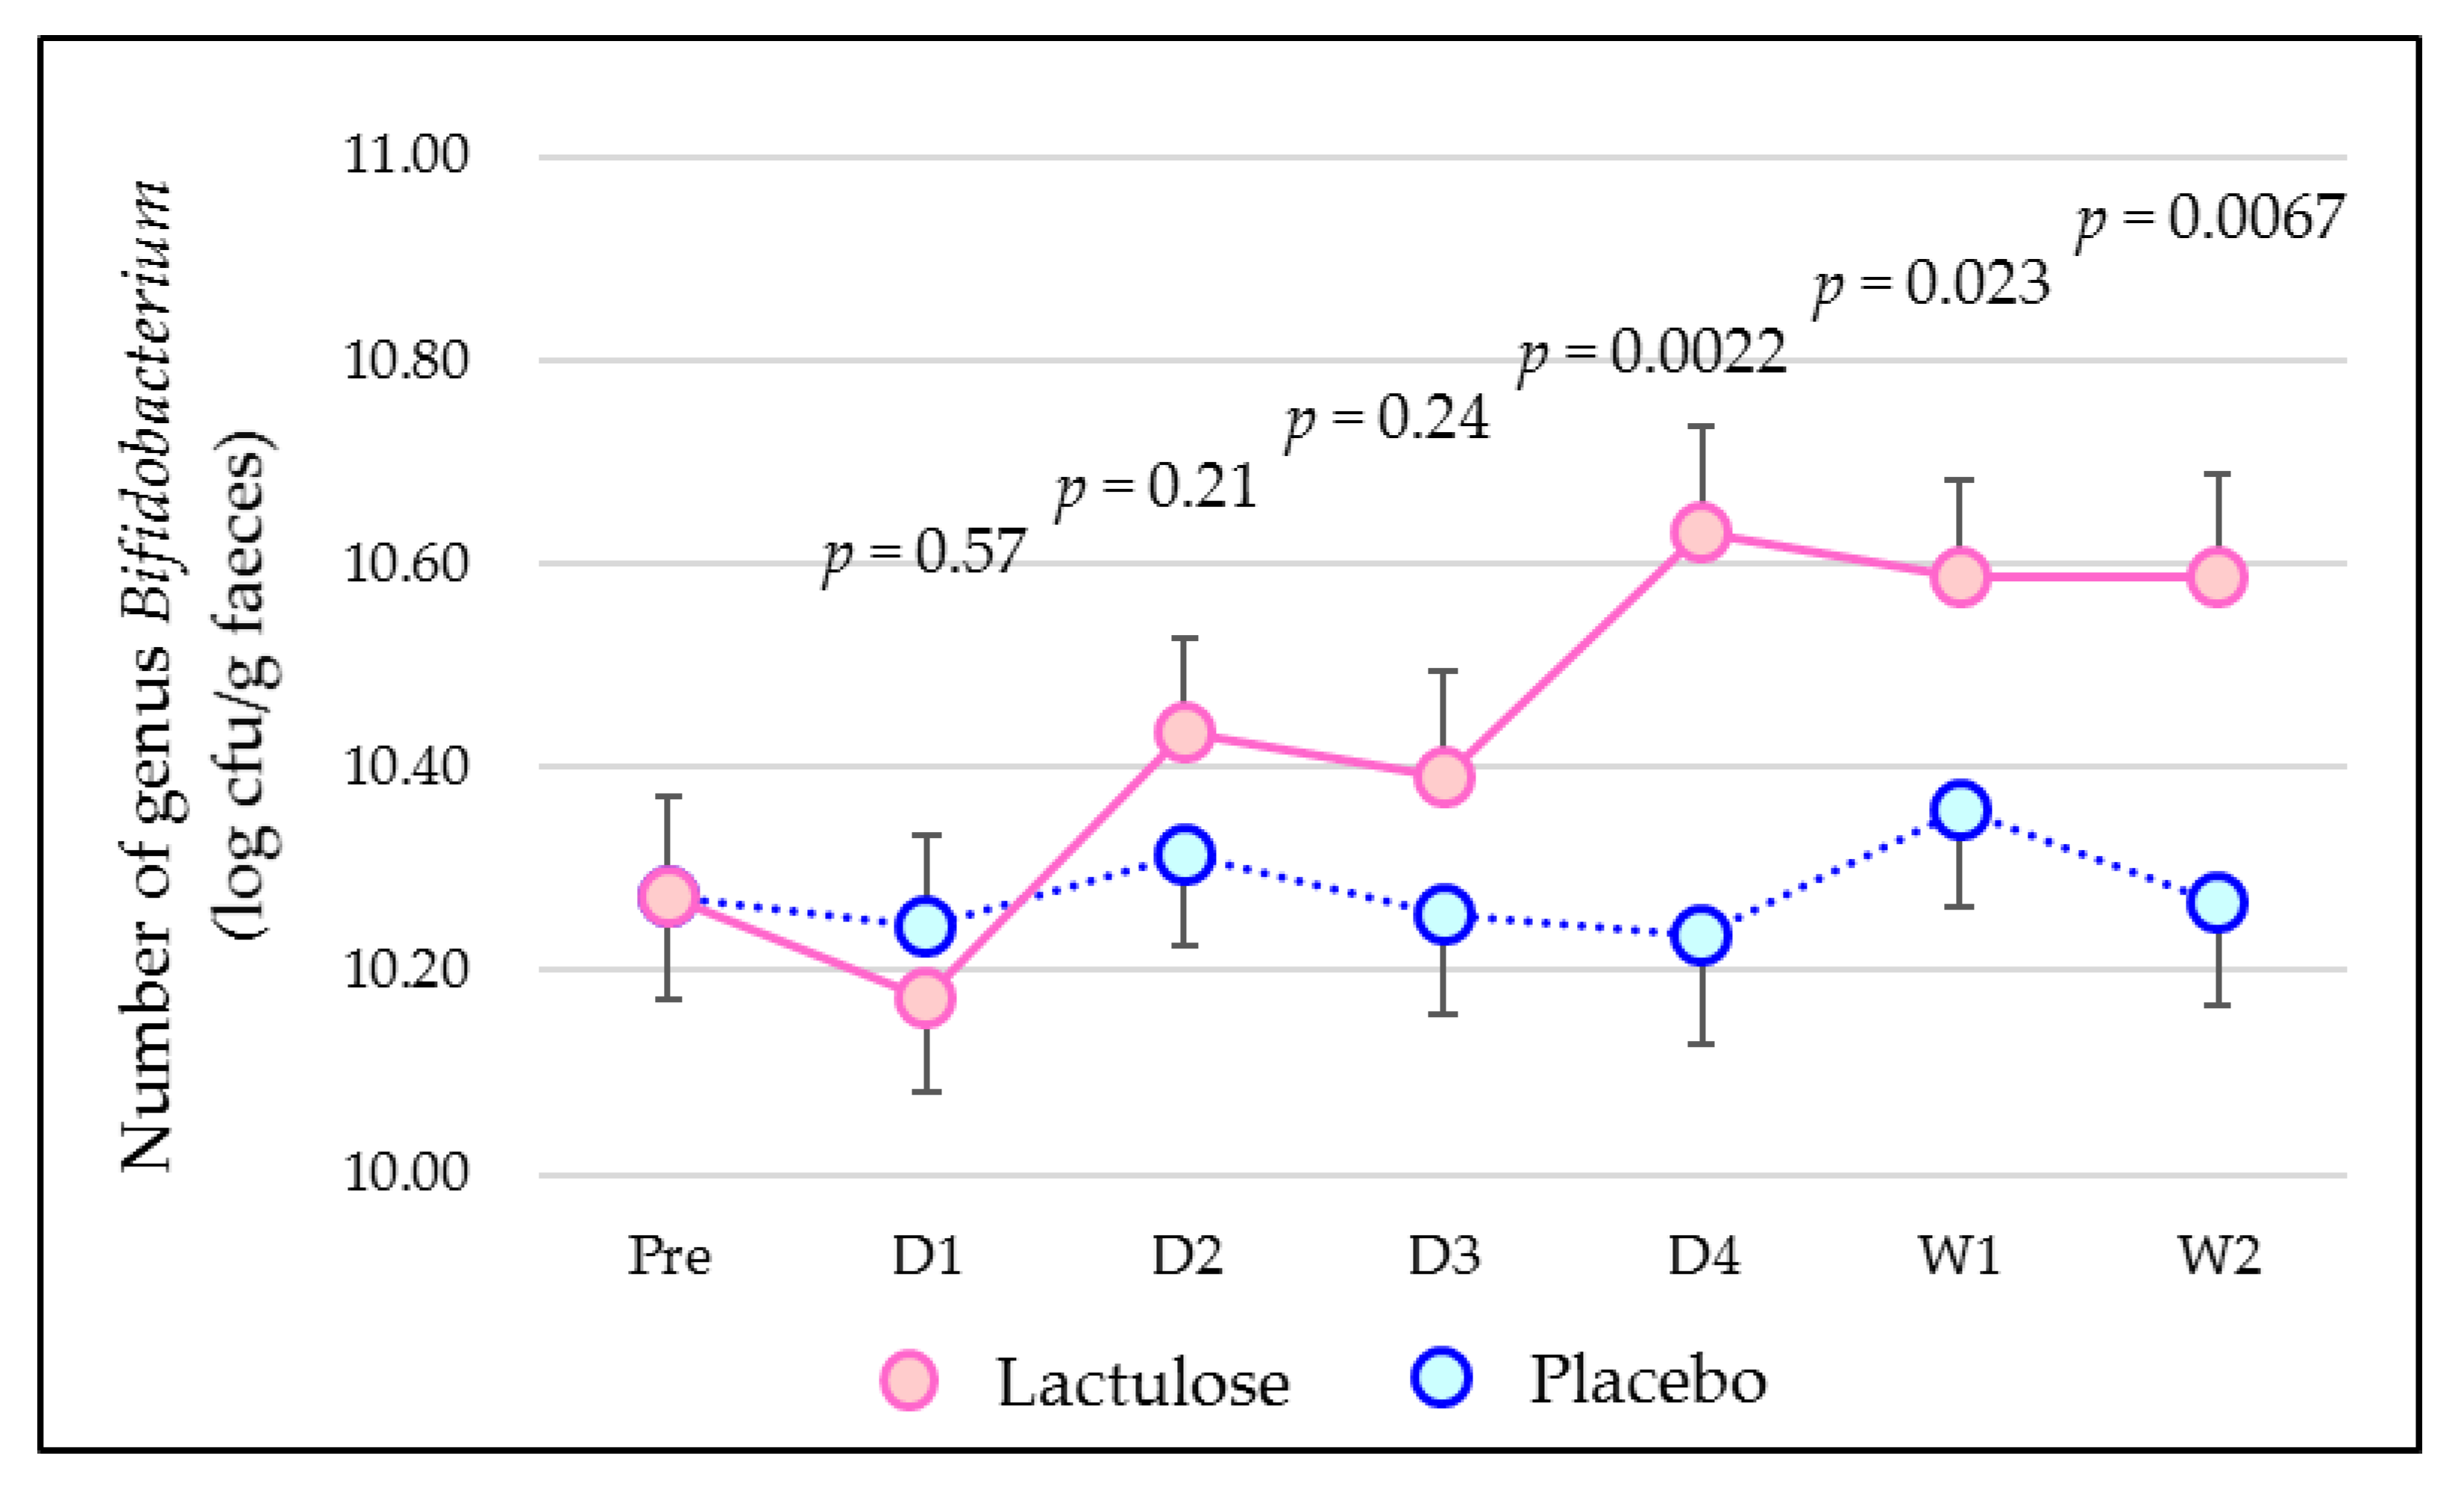
| Time of Sampling | n | Placebo | Lactulose | Difference 2 (95% CI 3) | p-Value |
|---|---|---|---|---|---|
| Just before the ingestion period | 36 | 10.27 ± 0.10 | 10.27 ± 0.10 | - | - |
| One day after starting test food ingestion | 36 | 10.24 ± 0.09 | 10.17 ± 0.09 | −0.07 (−0.33 to 0.18) | 0.57 |
| Two days after starting test food ingestion | 36 | 10.32 ± 0.09 | 10.43 ± 0.09 | 0.12 (−0.07 to 0.31) | 0.21 |
| Three days after starting test food ingestion | 36 | 10.26 ± 0.10 | 10.39 ± 0.10 | 0.13 (−0.09 to 0.36) | 0.24 |
| Four days after starting test food ingestion | 36 | 10.24 ± 0.11 | 10.63 ± 0.10 | 0.39 (0.16 to 0.63) | 0.0022 |
| One week after starting test food ingestion | 36 | 10.36 ± 0.10 | 10.59 ± 0.09 | 0.23 (0.03 to 0.43) | 0.023 |
| Two weeks after starting test food ingestion | 36 | 10.27 ± 0.10 | 10.59 ± 0.10 | 0.32 (0.10 to 0.54) | 0.0067 |
| Abdominal Symptom | Lactulose | Placebo |
|---|---|---|
| Stomach ache | 0 | 0 |
| Heartburn | 0 | 0 |
| Abdominal pain | 2 | 1 |
| Diarrhoea | 3 | 1 |
| Constipation | 0 | 0 |
| Trapped wind | 0 | 0 |
| Abdominal fullness | 0 | 5 |
| Flatus | 3 | 2 |
| Total | 8 | 9 |
| Lactulose | p-Value | ||||
|---|---|---|---|---|---|
| Number Not Reporting | Number Reporting | Total | |||
| Placebo | Number not reporting | 27 | 2 | 29 | 0.41 |
| Number reporting | 4 | 3 | 7 | ||
| Total | 31 | 5 | 36 | ||
Publisher’s Note: MDPI stays neutral with regard to jurisdictional claims in published maps and institutional affiliations. |
© 2022 by the authors. Licensee MDPI, Basel, Switzerland. This article is an open access article distributed under the terms and conditions of the Creative Commons Attribution (CC BY) license (https://creativecommons.org/licenses/by/4.0/).
Share and Cite
Sakai, Y.; Ochi, H.; Tanaka, M. Lactulose Ingestion Induces a Rapid Increase in Genus Bifidobacterium in Healthy Japanese: A Randomised, Double-Blind, Placebo-Controlled Crossover Trial. Microorganisms 2022, 10, 1719. https://doi.org/10.3390/microorganisms10091719
Sakai Y, Ochi H, Tanaka M. Lactulose Ingestion Induces a Rapid Increase in Genus Bifidobacterium in Healthy Japanese: A Randomised, Double-Blind, Placebo-Controlled Crossover Trial. Microorganisms. 2022; 10(9):1719. https://doi.org/10.3390/microorganisms10091719
Chicago/Turabian StyleSakai, Yohei, Hiroshi Ochi, and Miyuki Tanaka. 2022. "Lactulose Ingestion Induces a Rapid Increase in Genus Bifidobacterium in Healthy Japanese: A Randomised, Double-Blind, Placebo-Controlled Crossover Trial" Microorganisms 10, no. 9: 1719. https://doi.org/10.3390/microorganisms10091719