
Changes in Phytoplankton Community Composition and Phytoplankton Cell Size in Response to Nitrogen Availability Depend on Temperature

 , , and
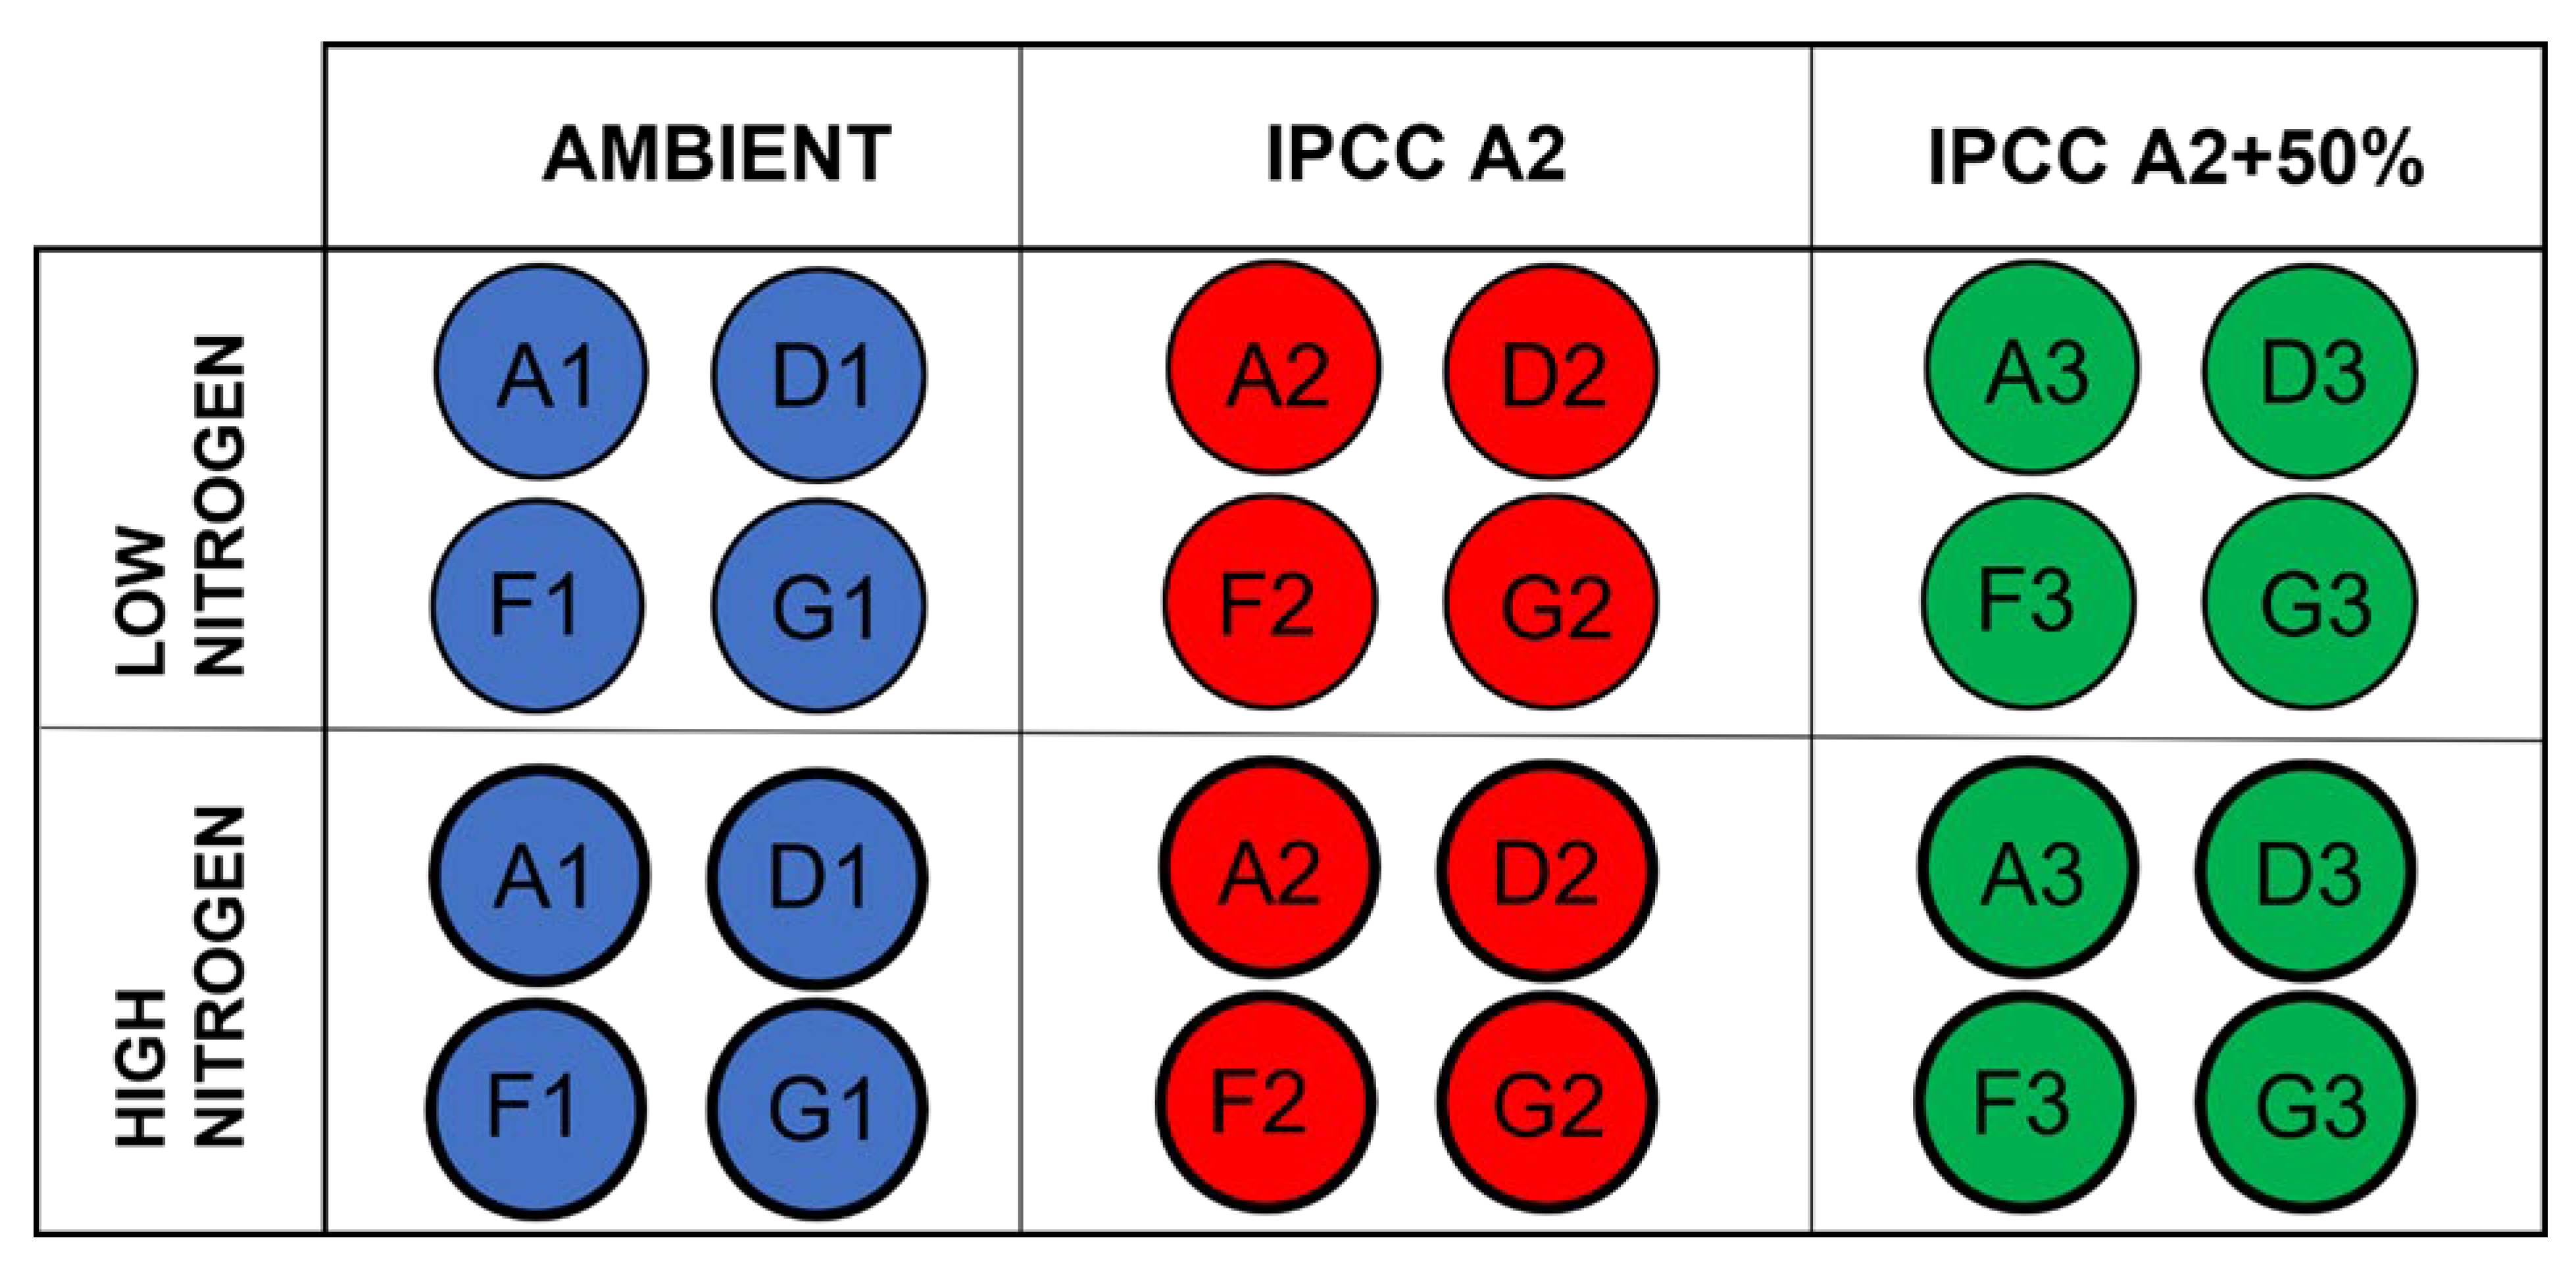
Abstract
:1. Introduction
2. Materials and Methods
2.1. Experimental Setup
2.2. Sample Collection and Measurement of Water Parameters
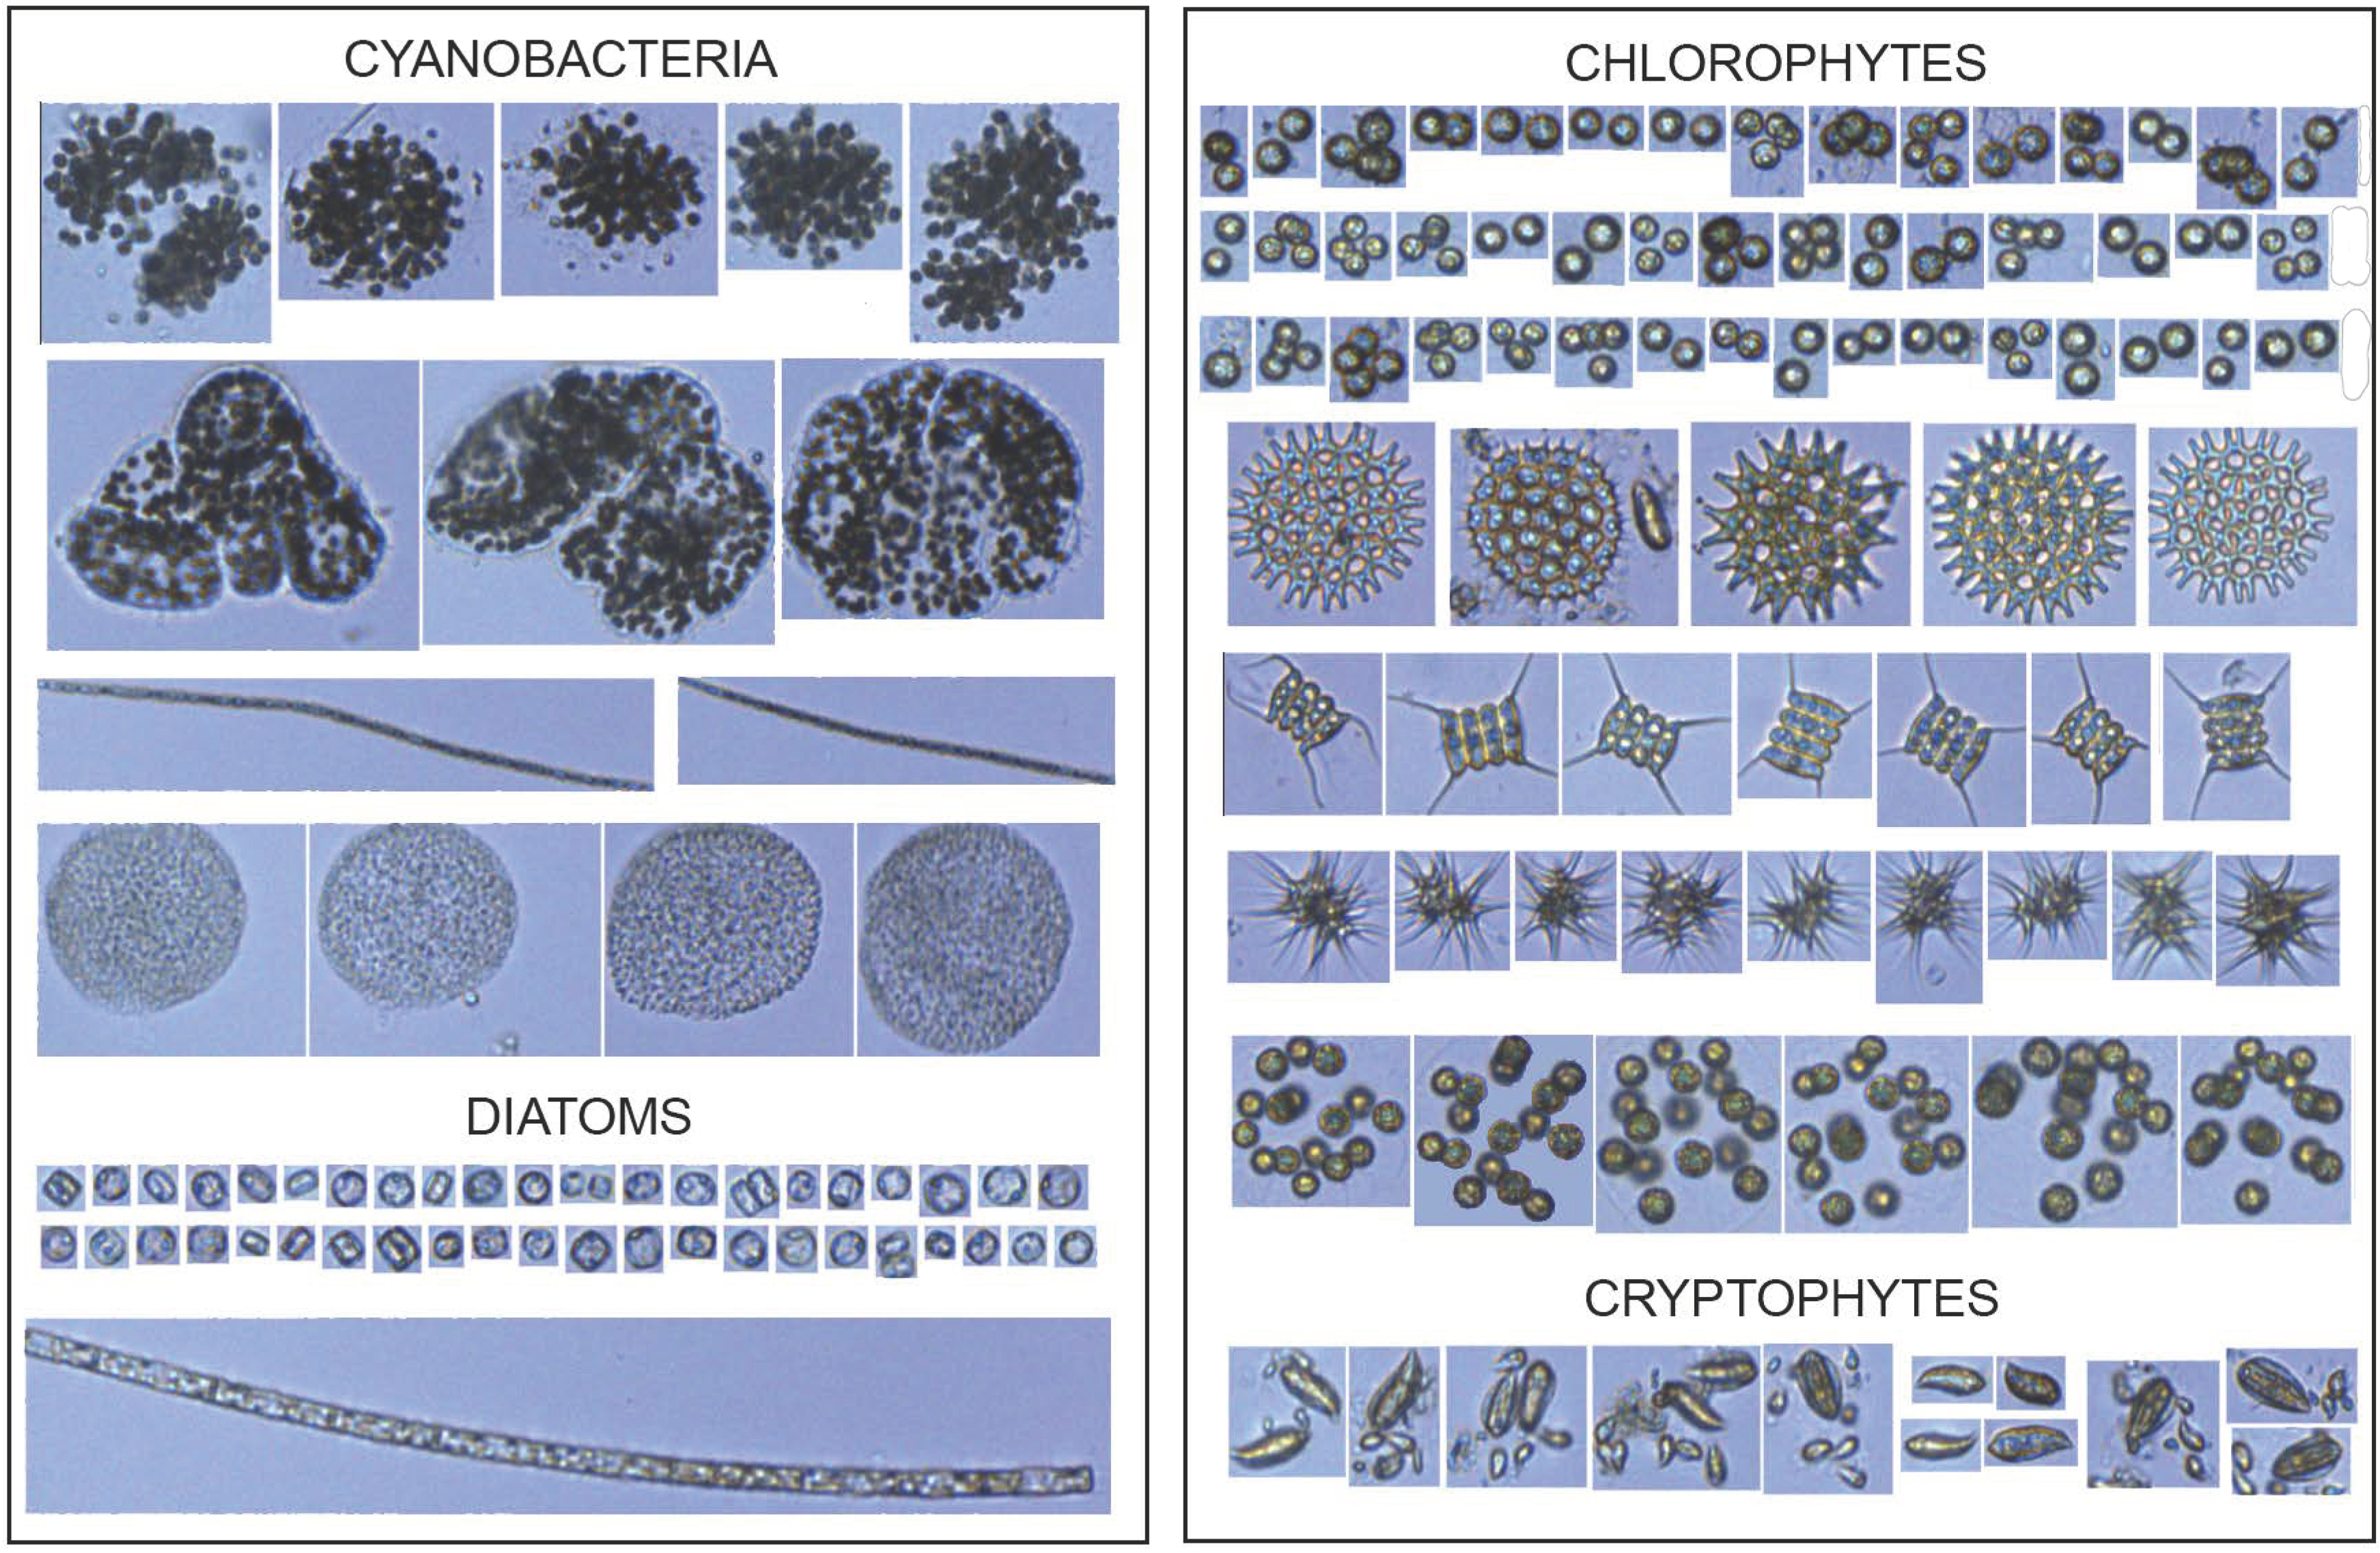
2.3. FlowCAM Analysis and Microscopy
2.4. Biovolume and Biomass Estimation
2.5. Statistical Data Analysis
3. Results
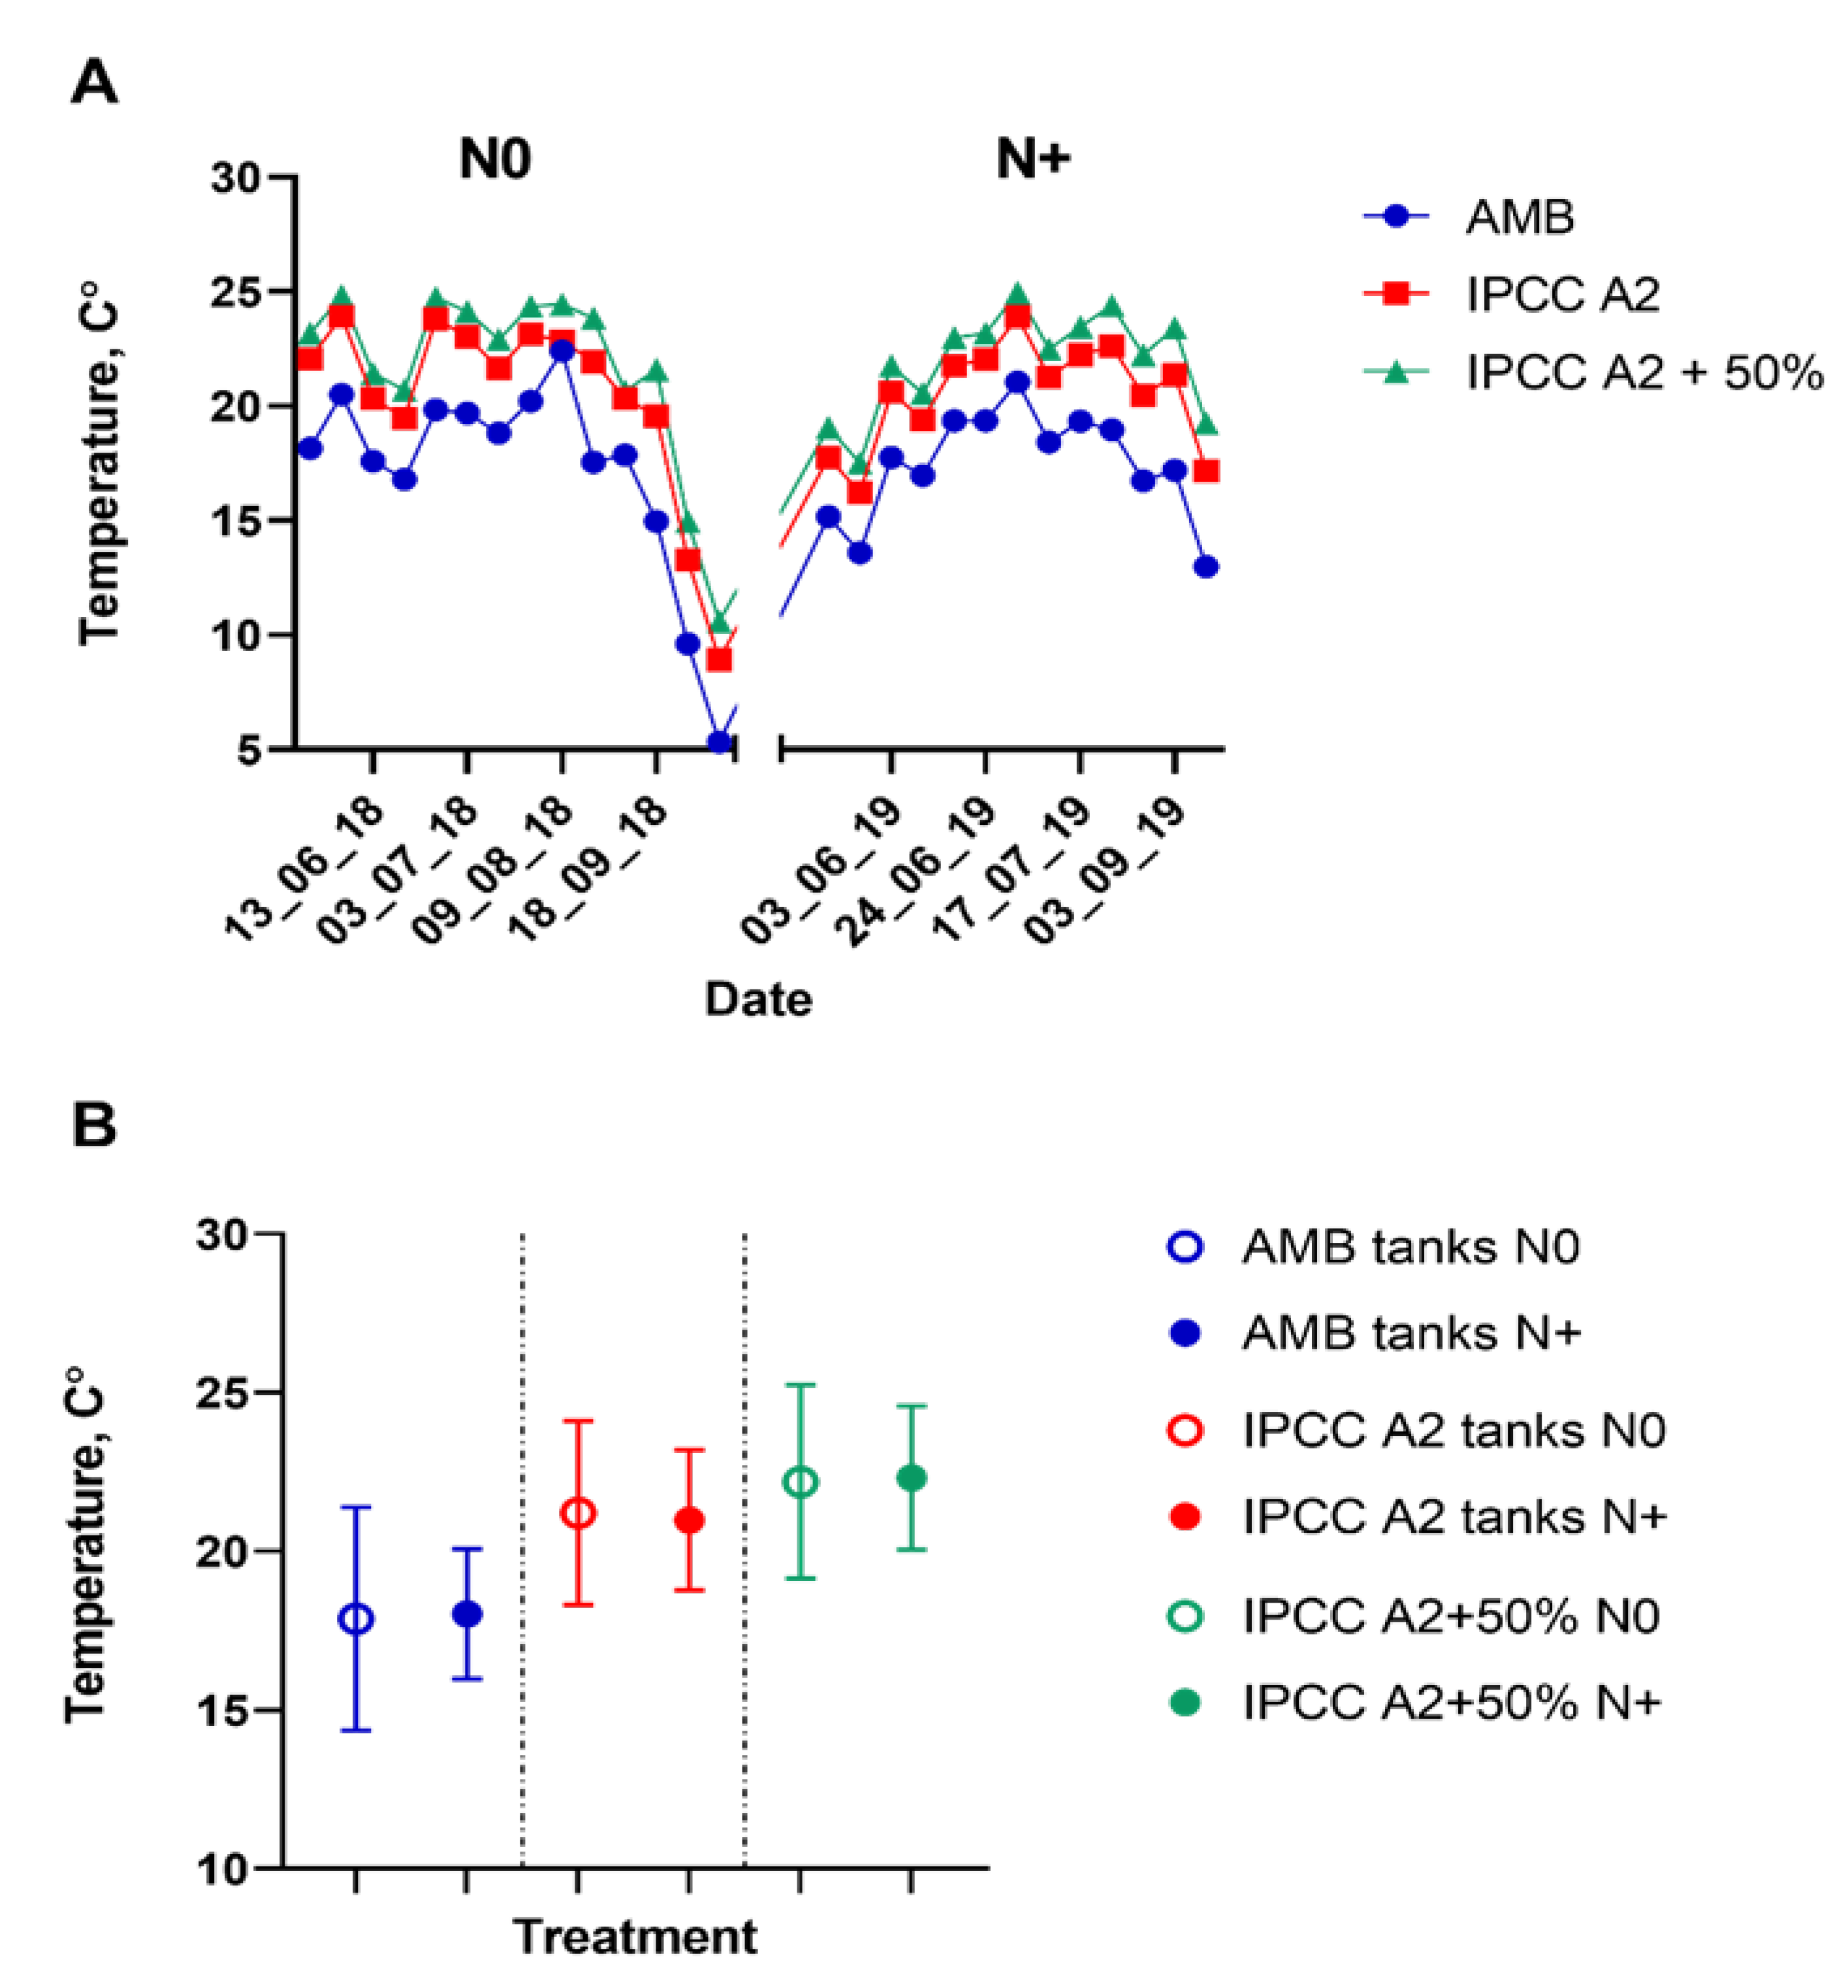
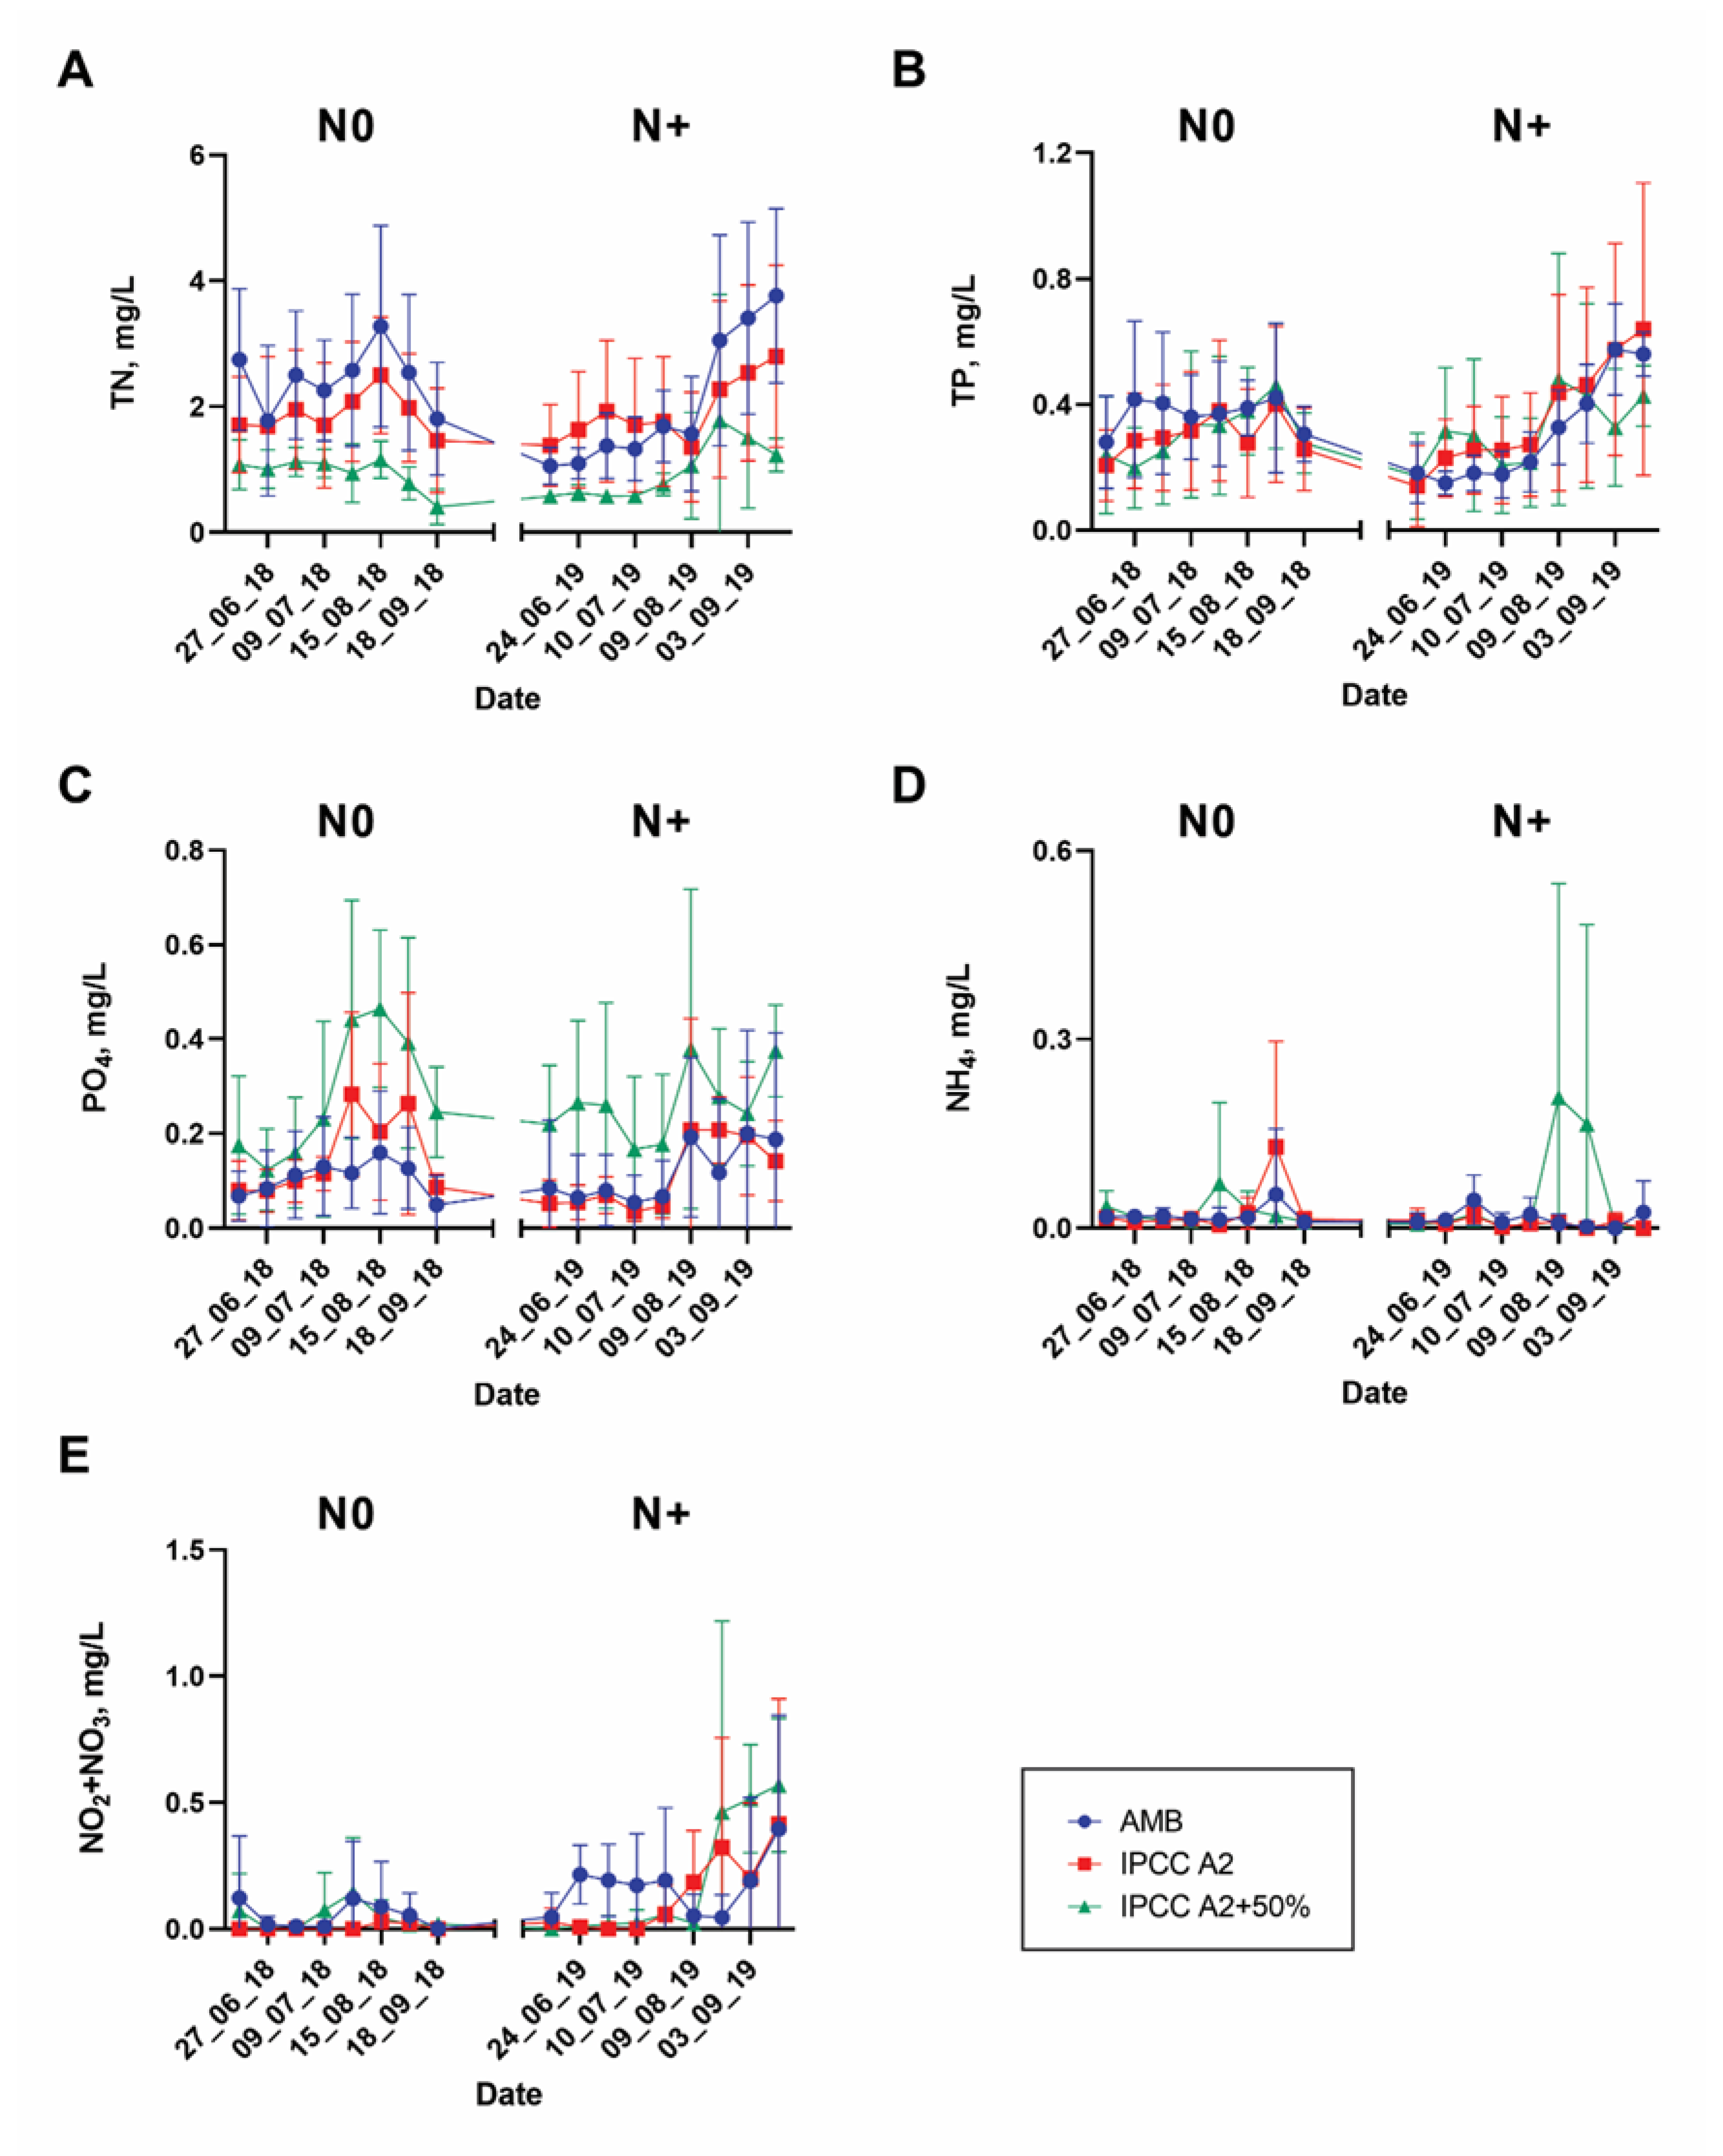
3.1. Environmental Changes
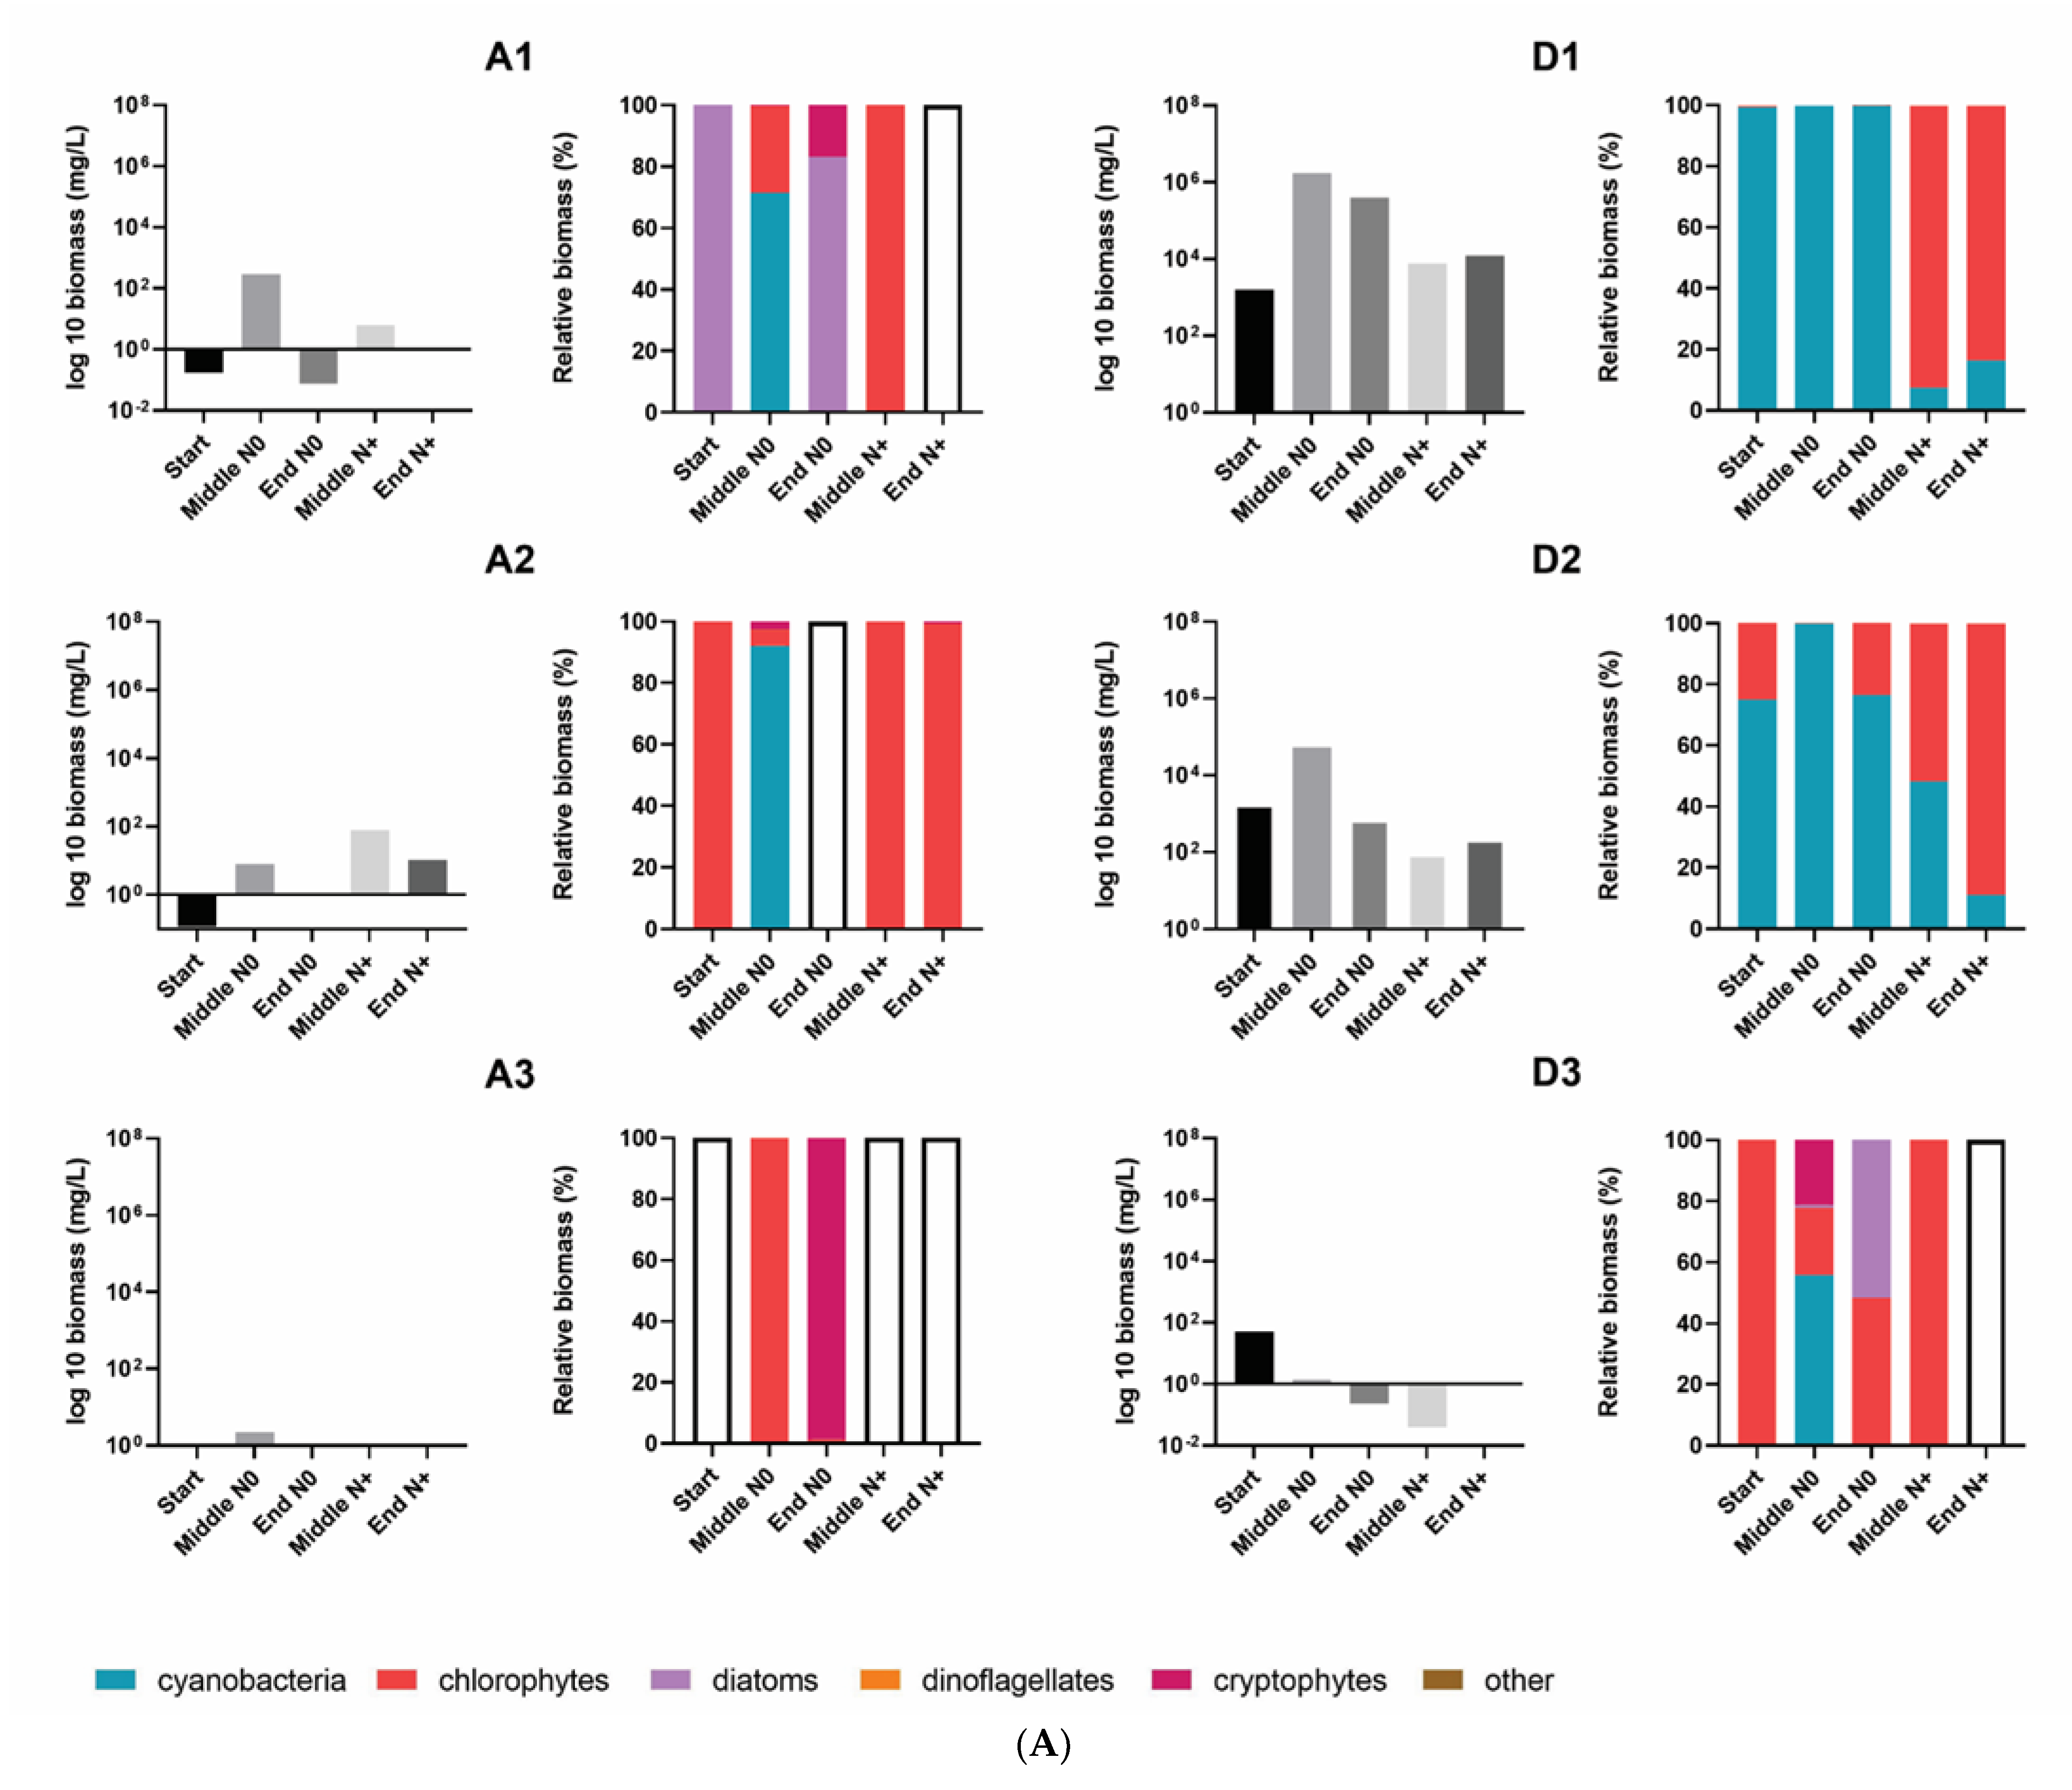
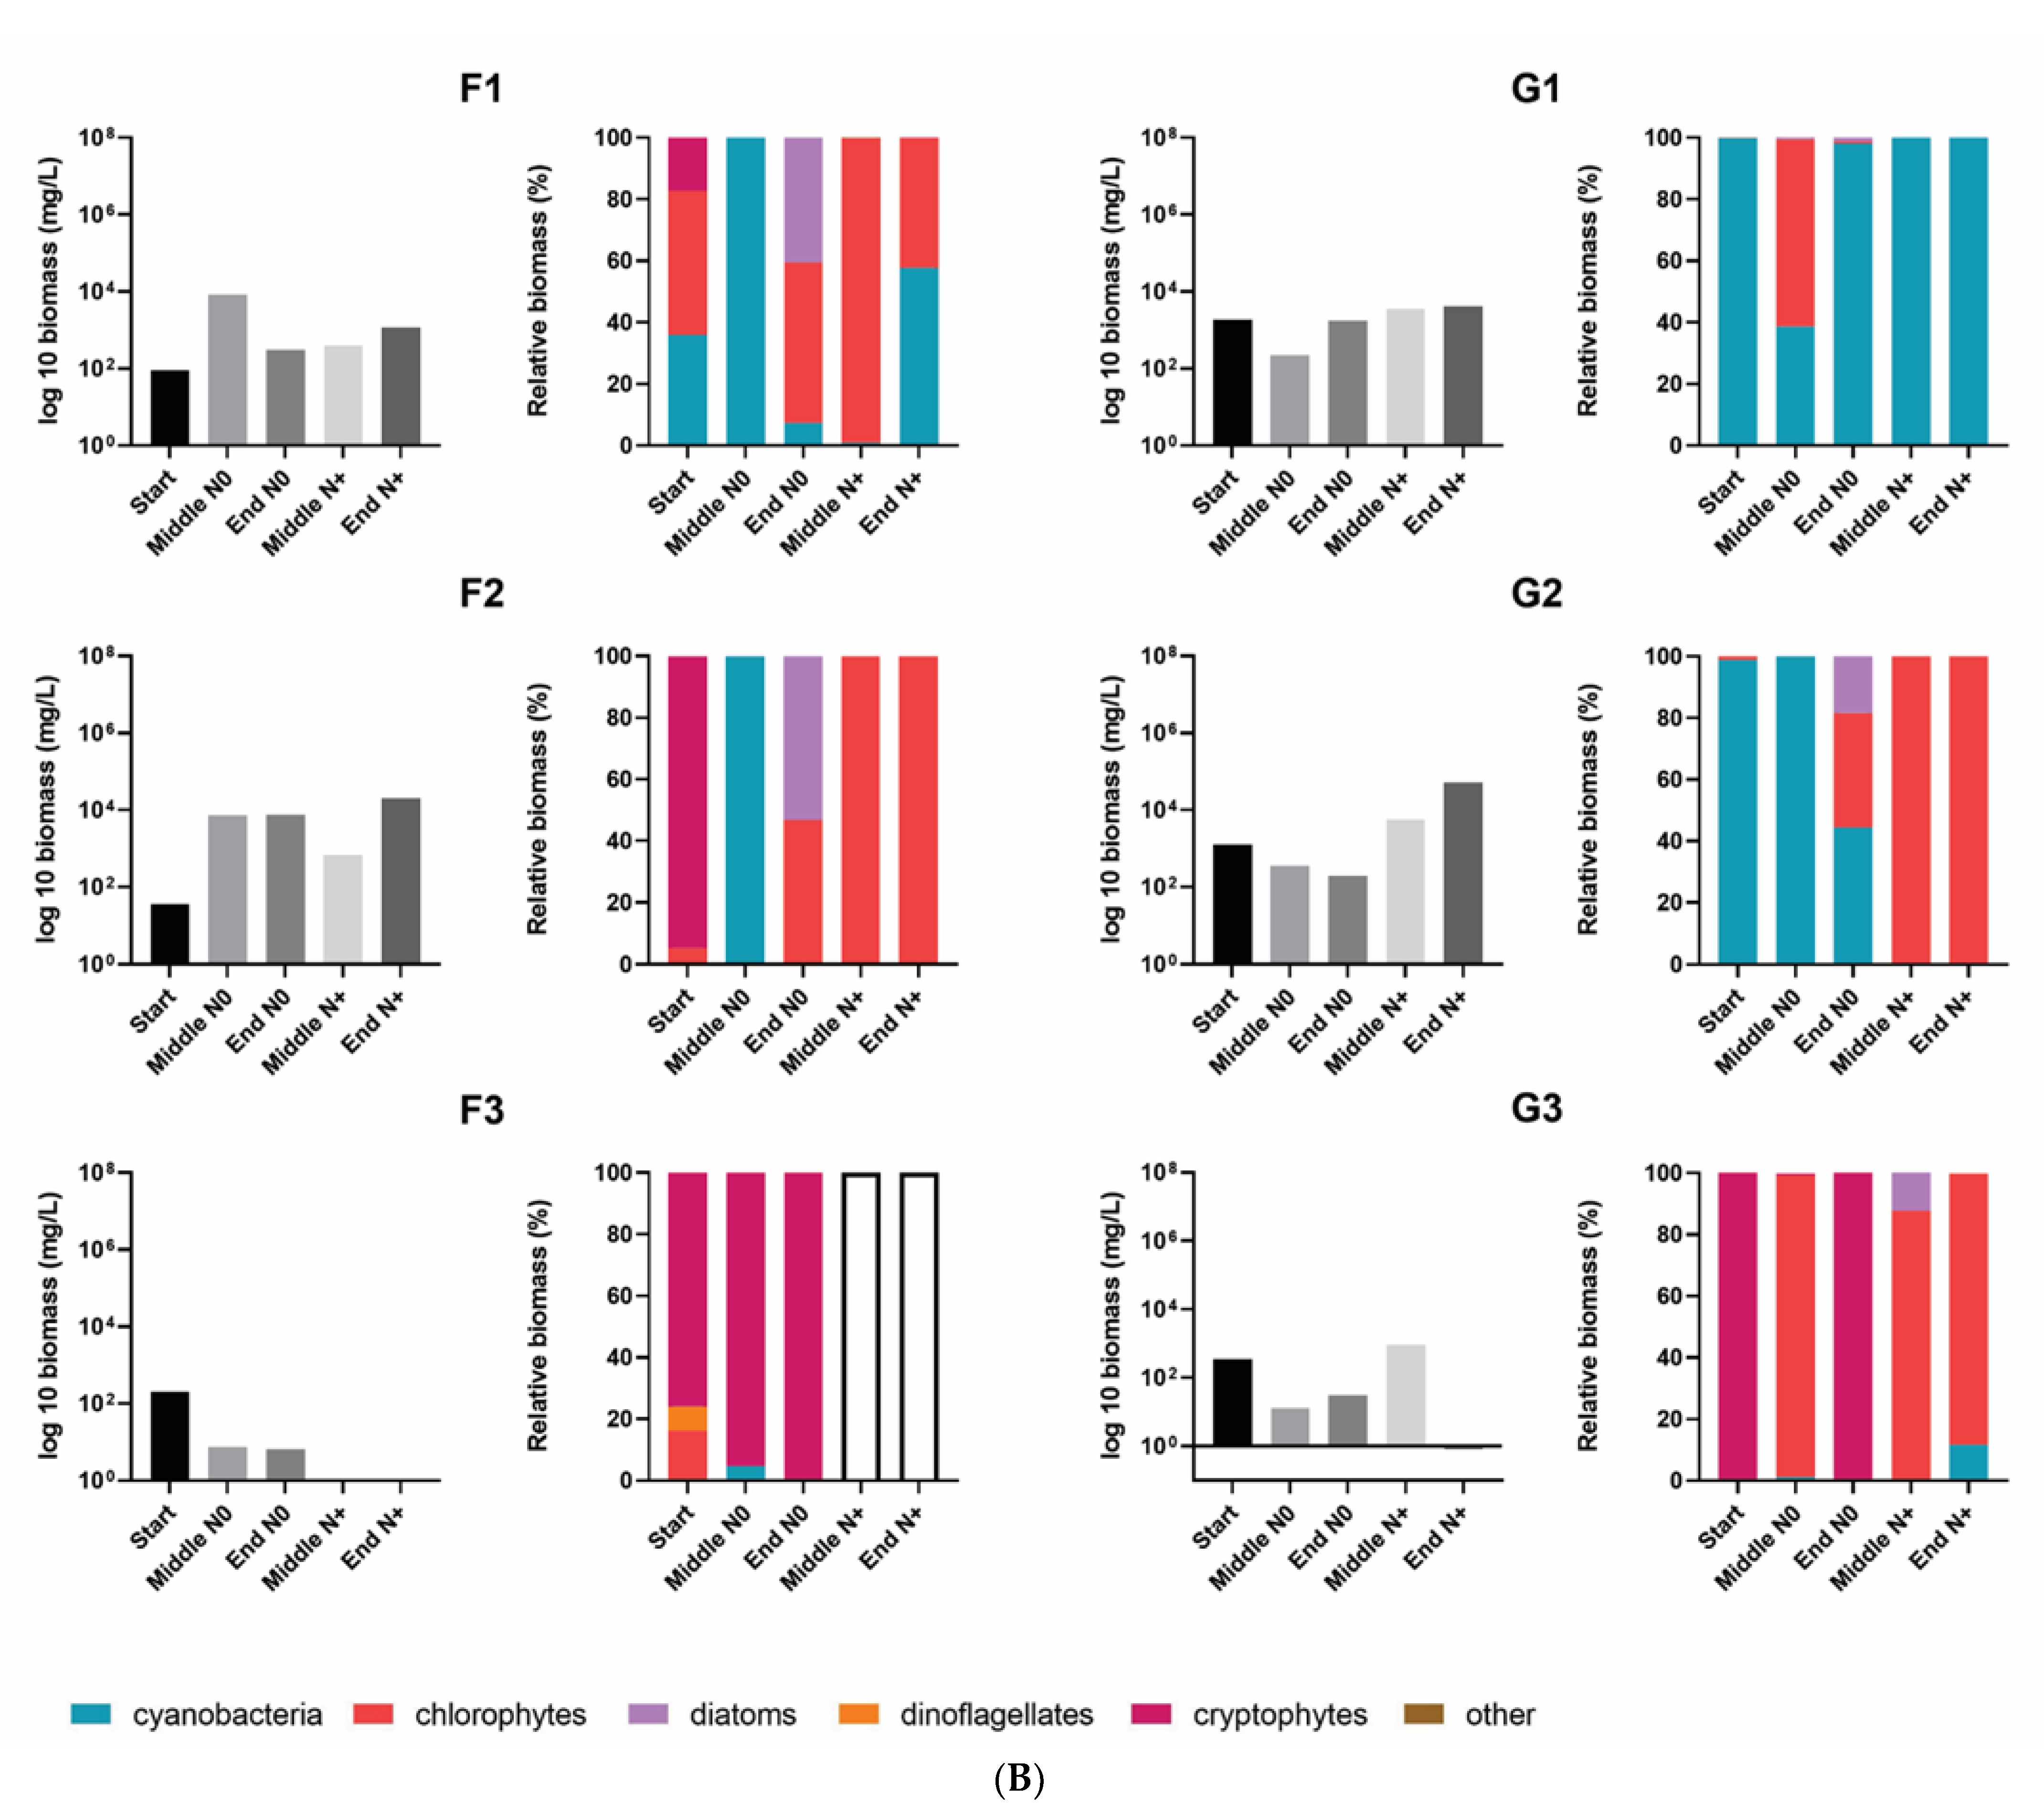
3.2. Total Phytoplankton Biomass and Composition
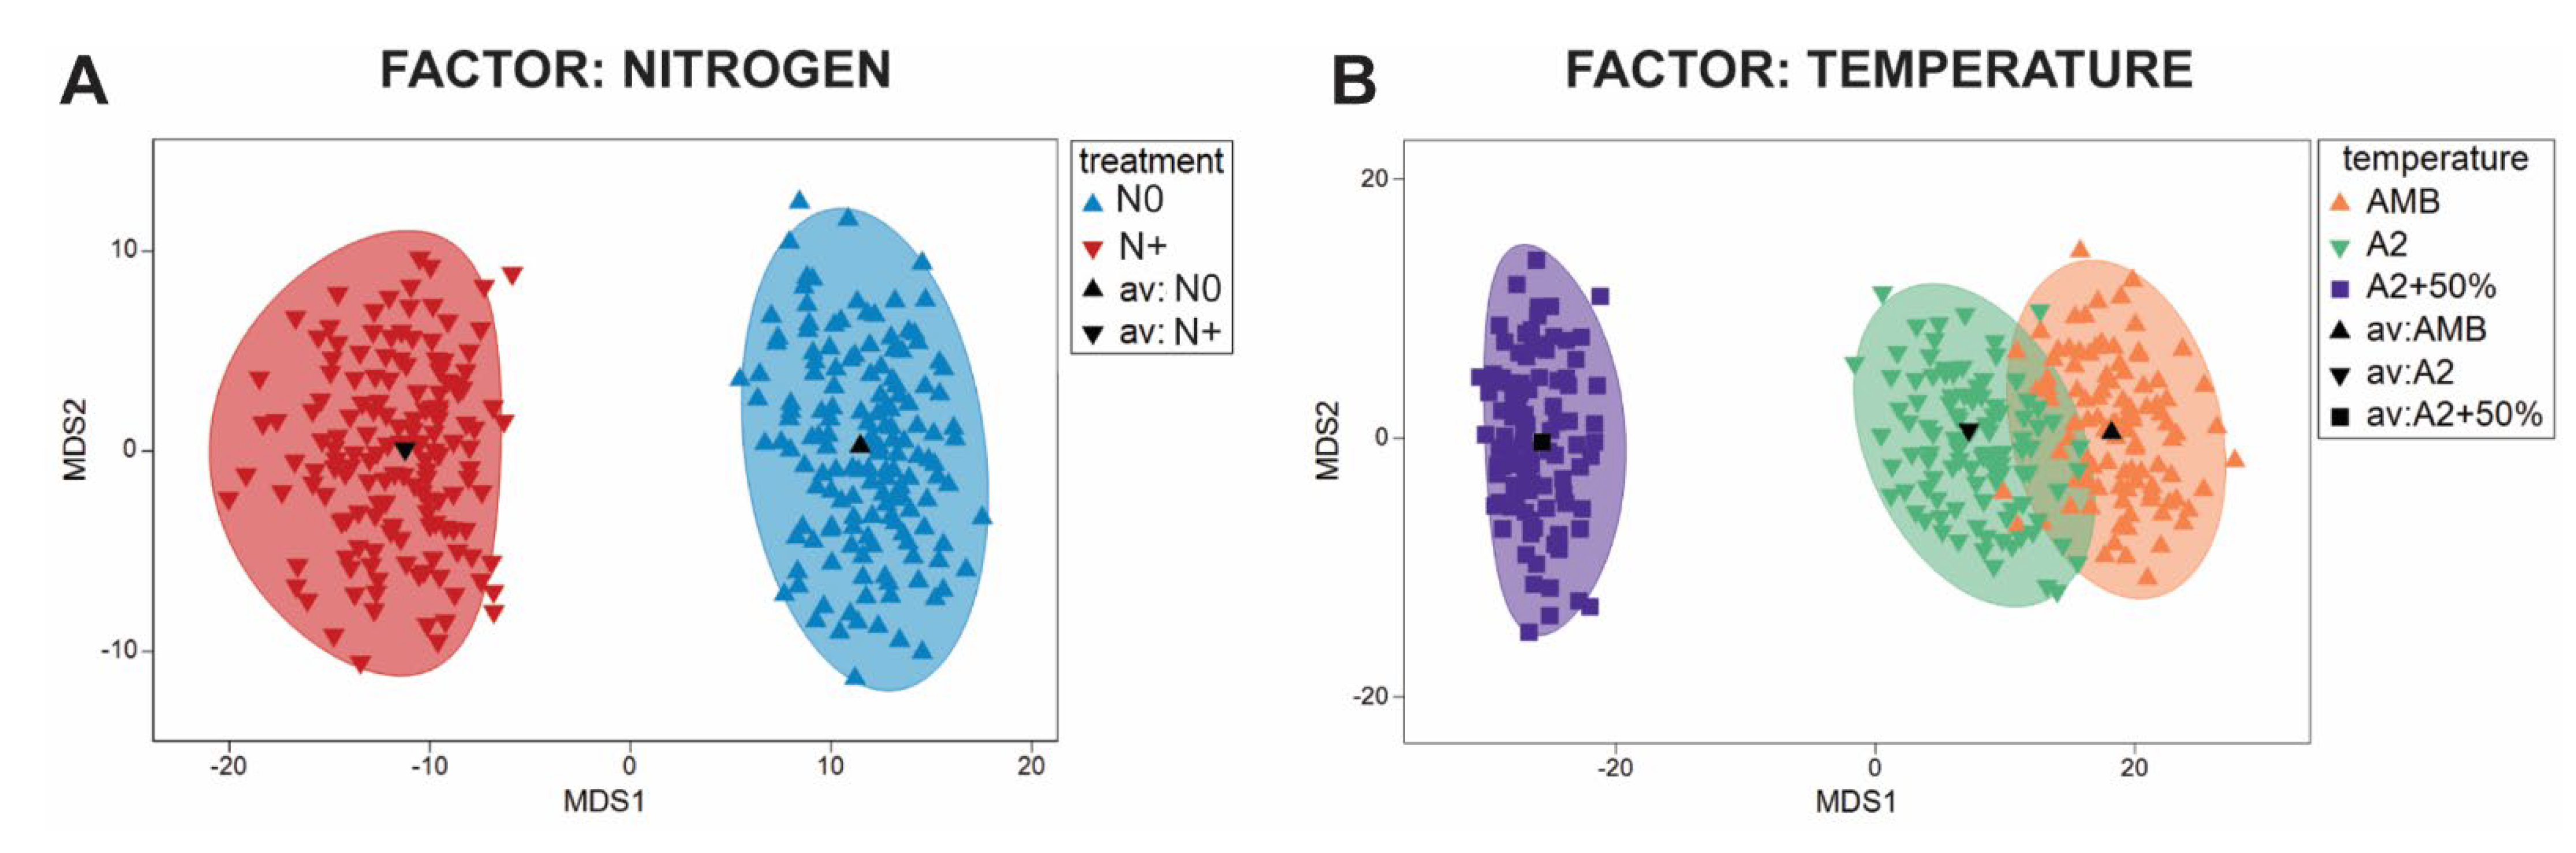
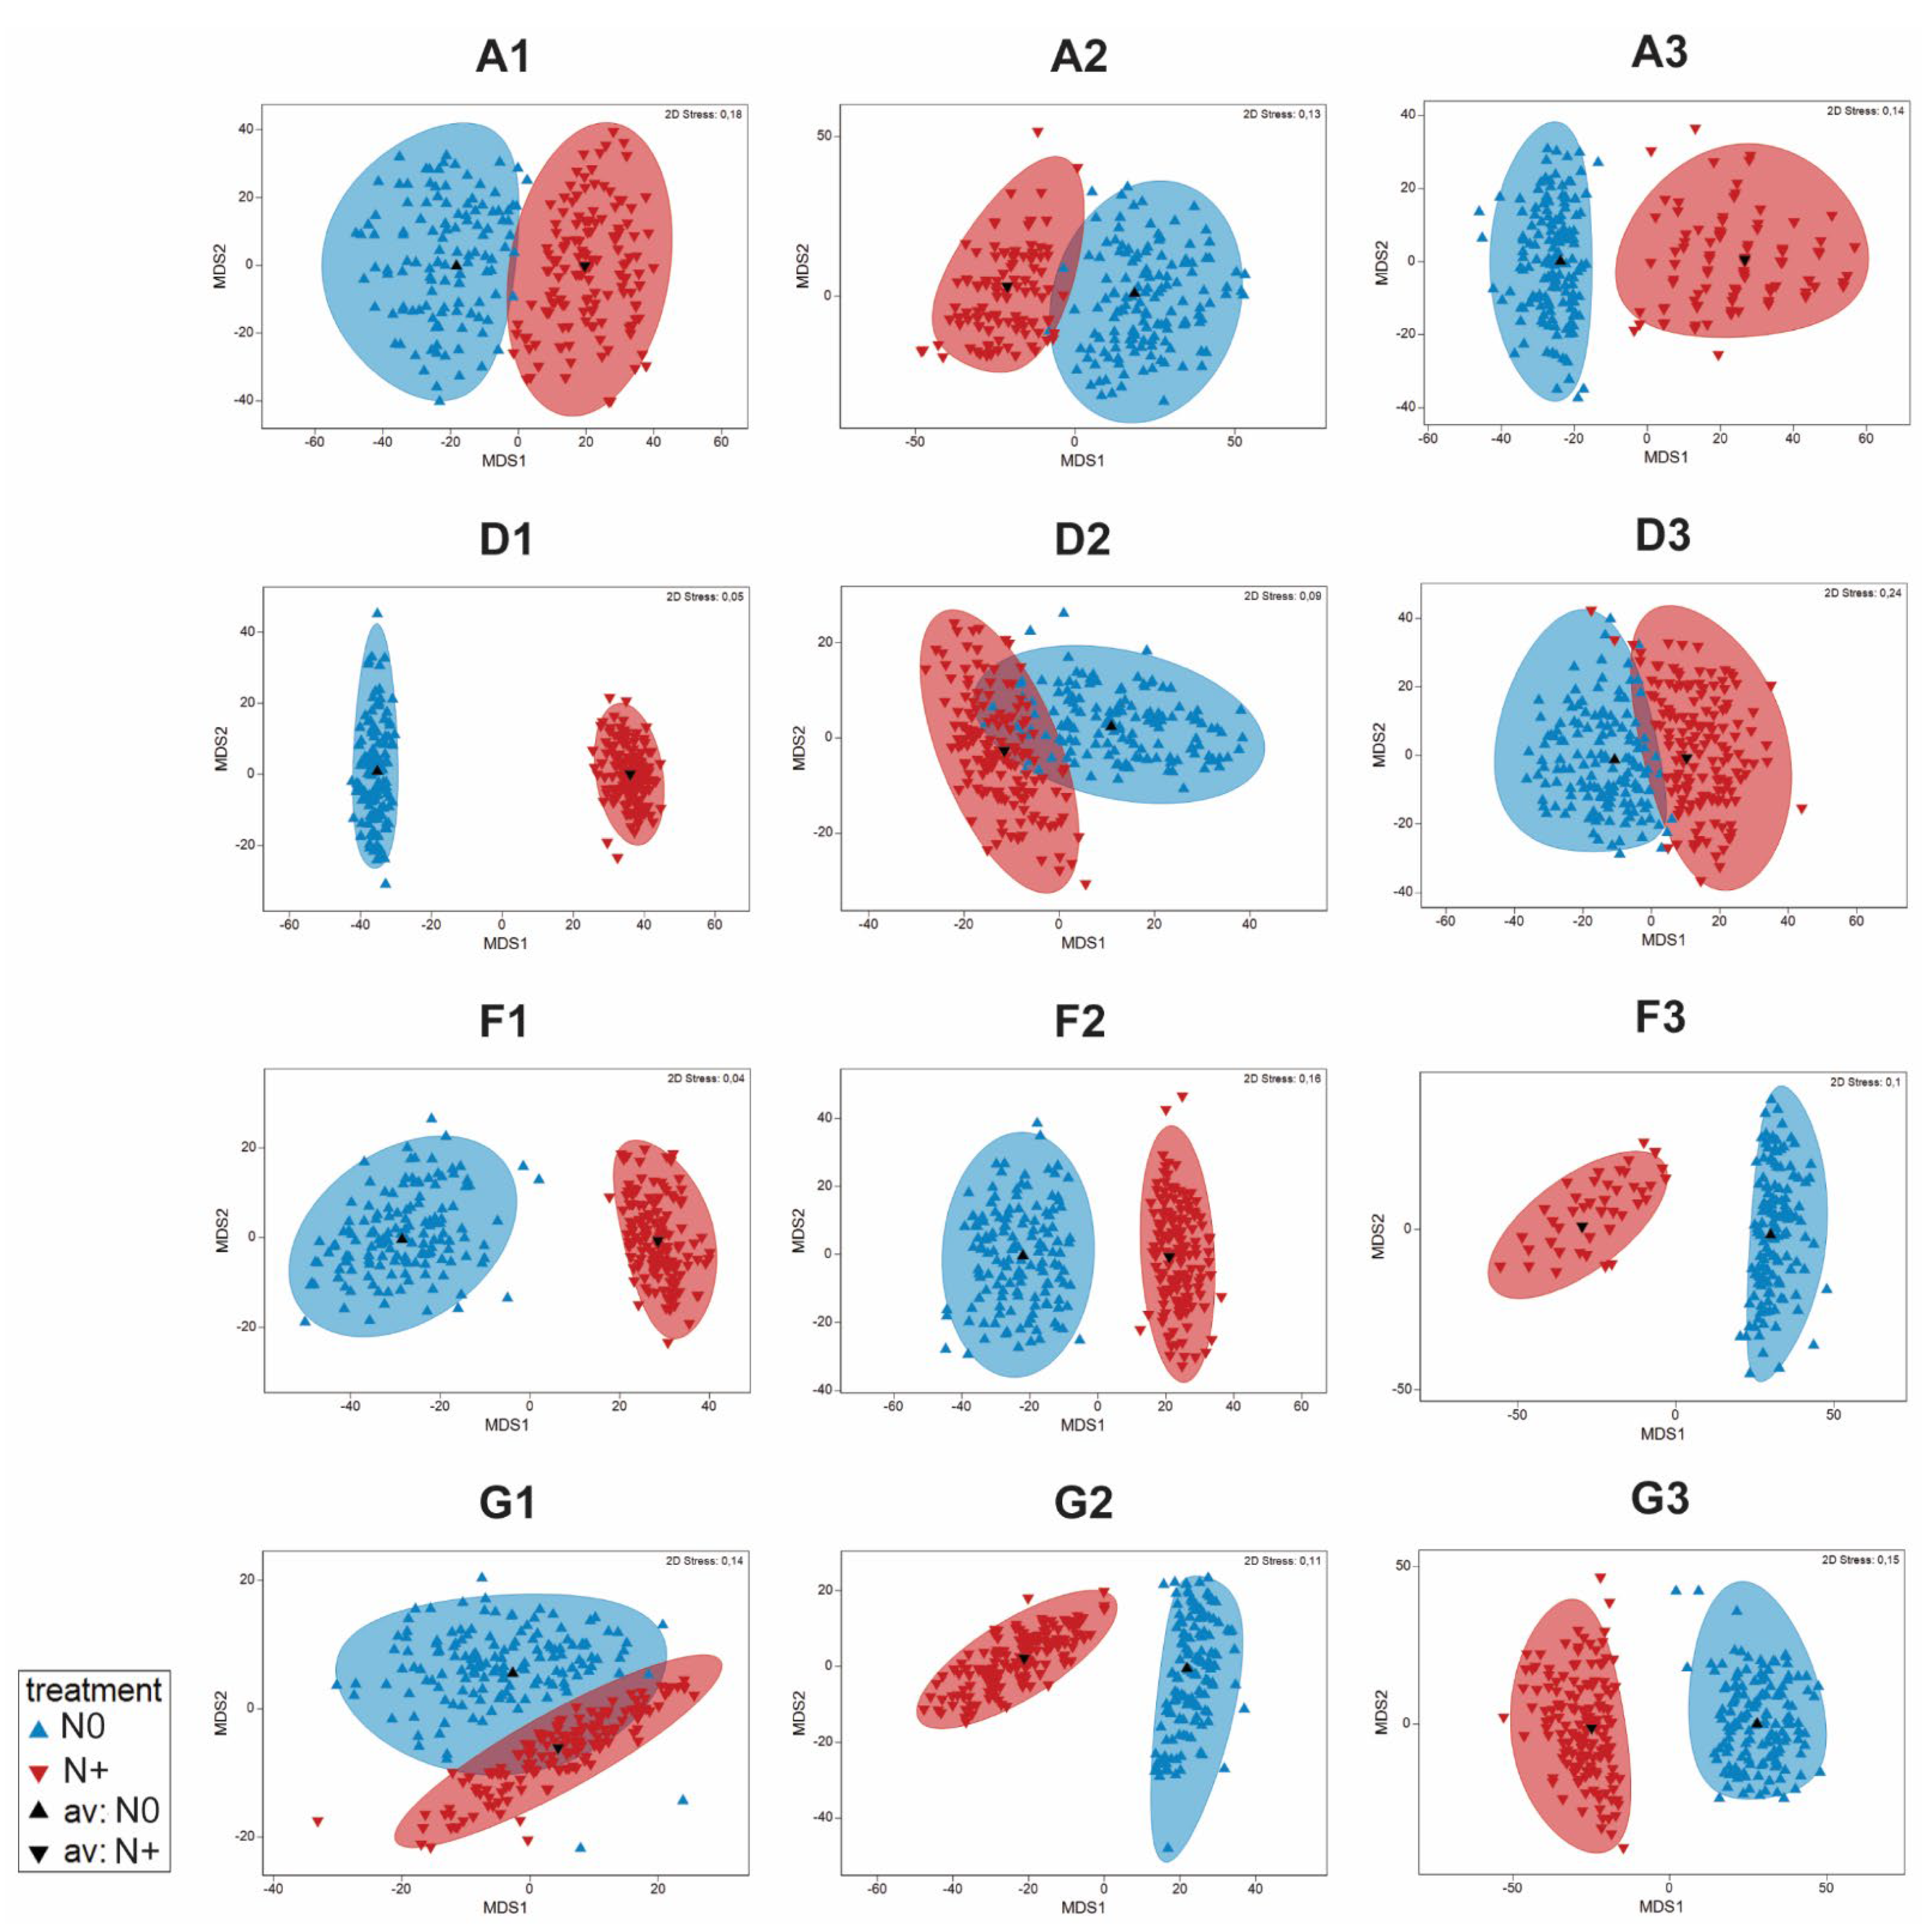
3.3. Changes in Phytoplankton Community Structure
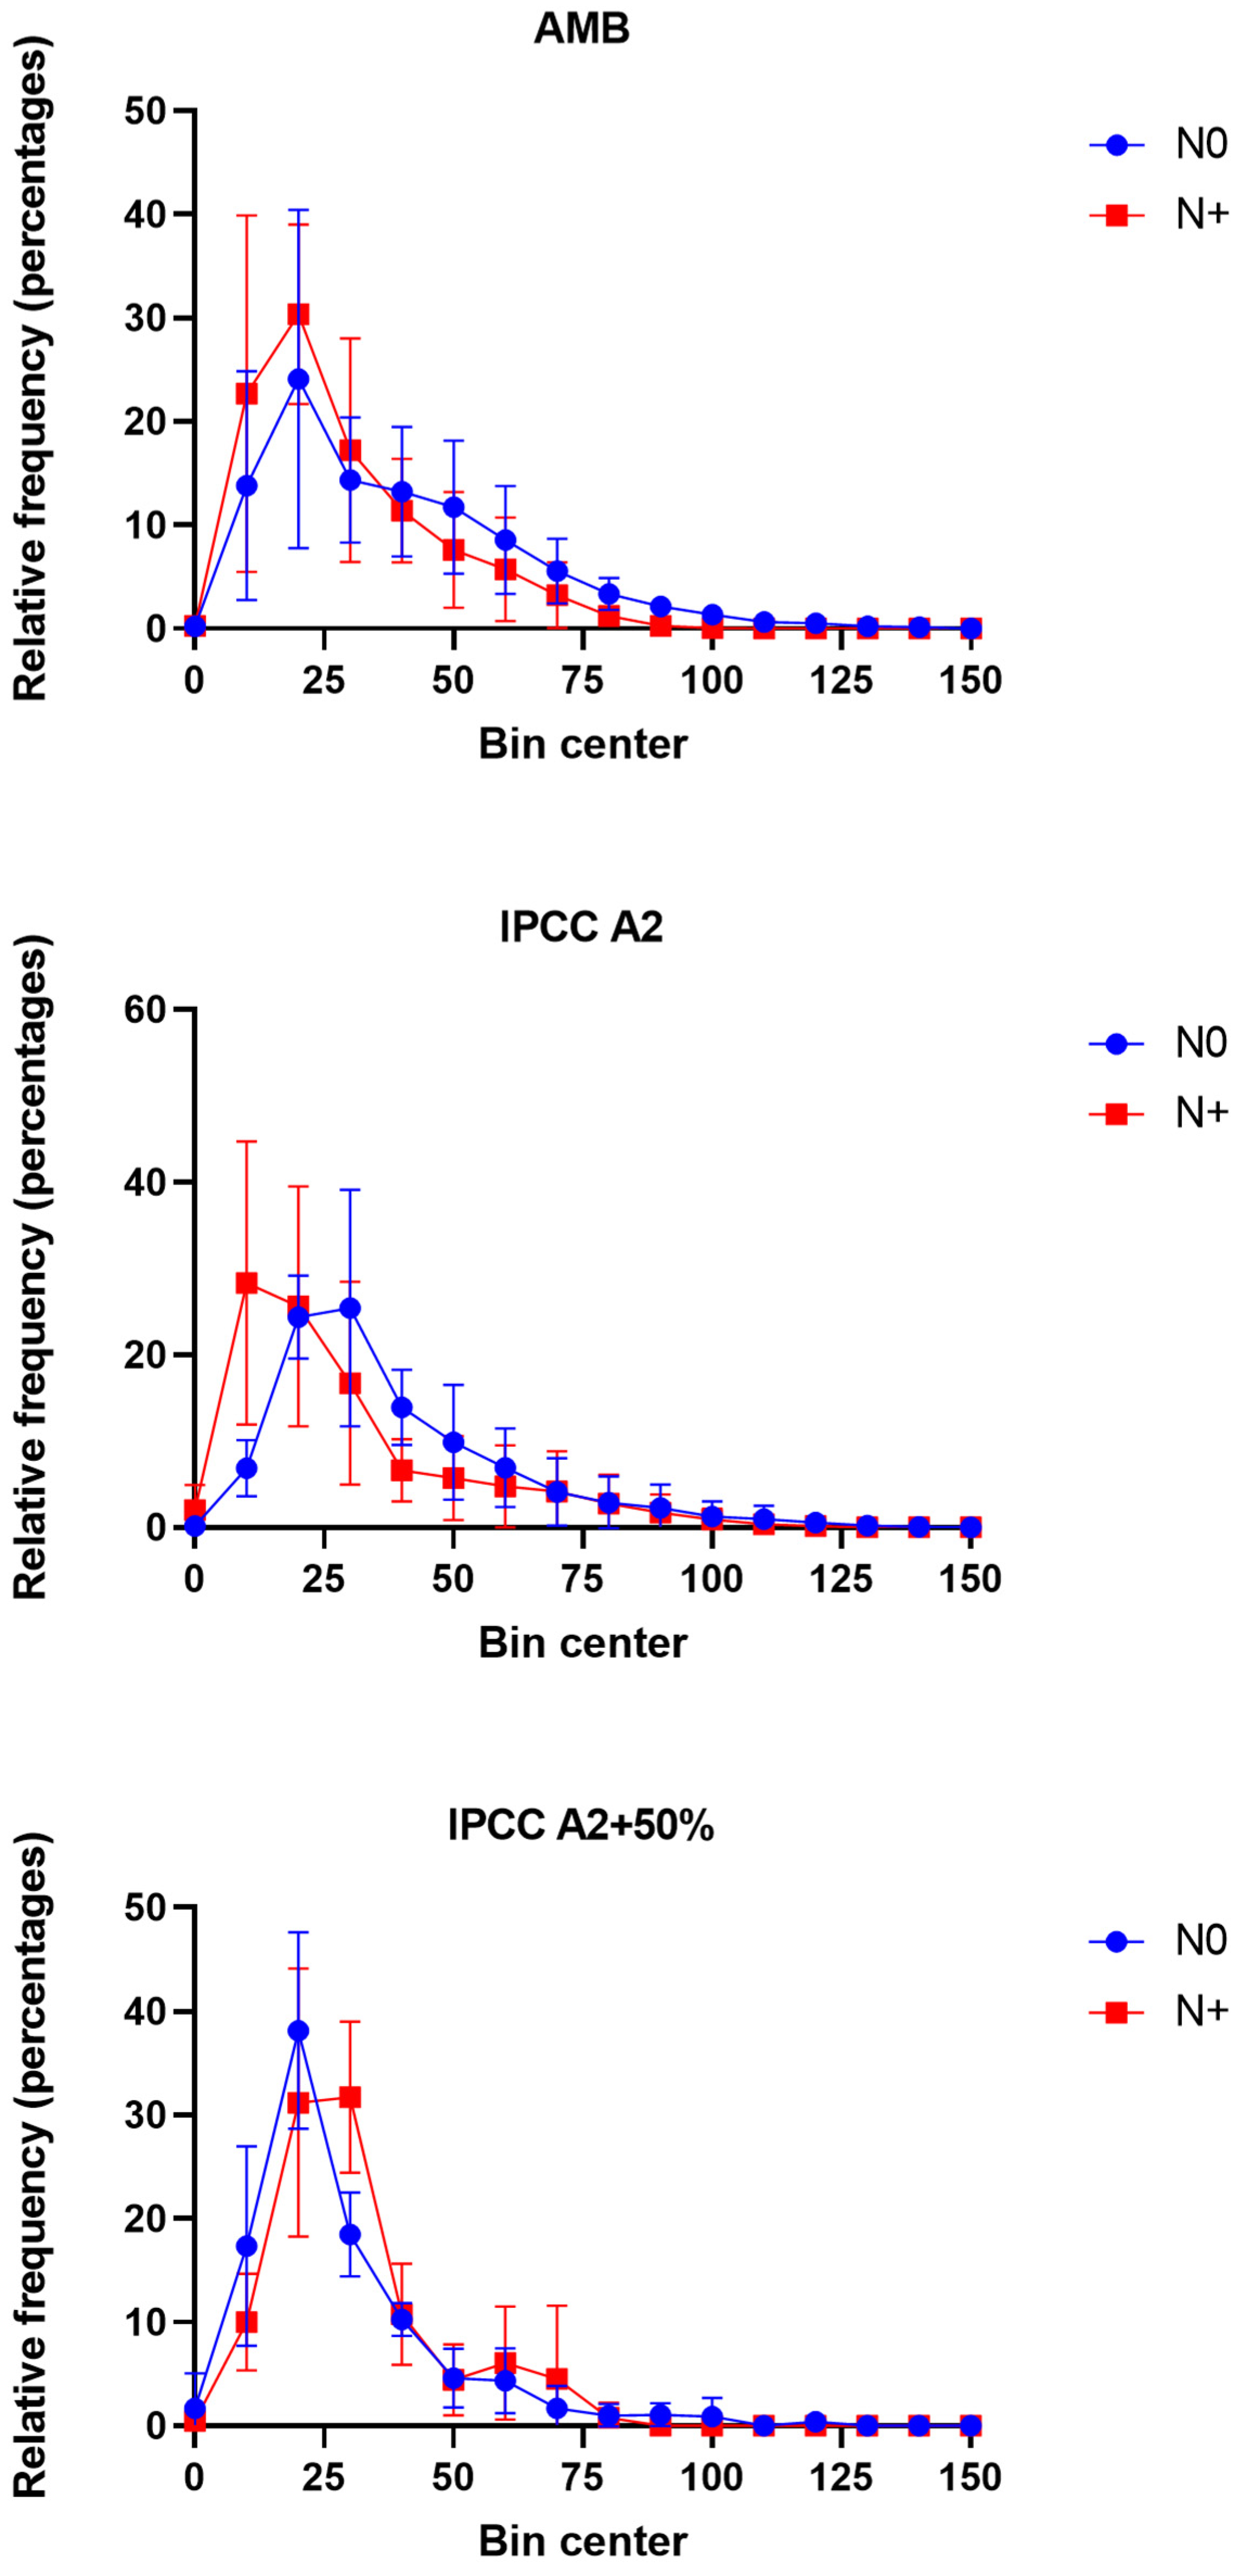
3.4. Changes in Phytoplankton Size Distribution
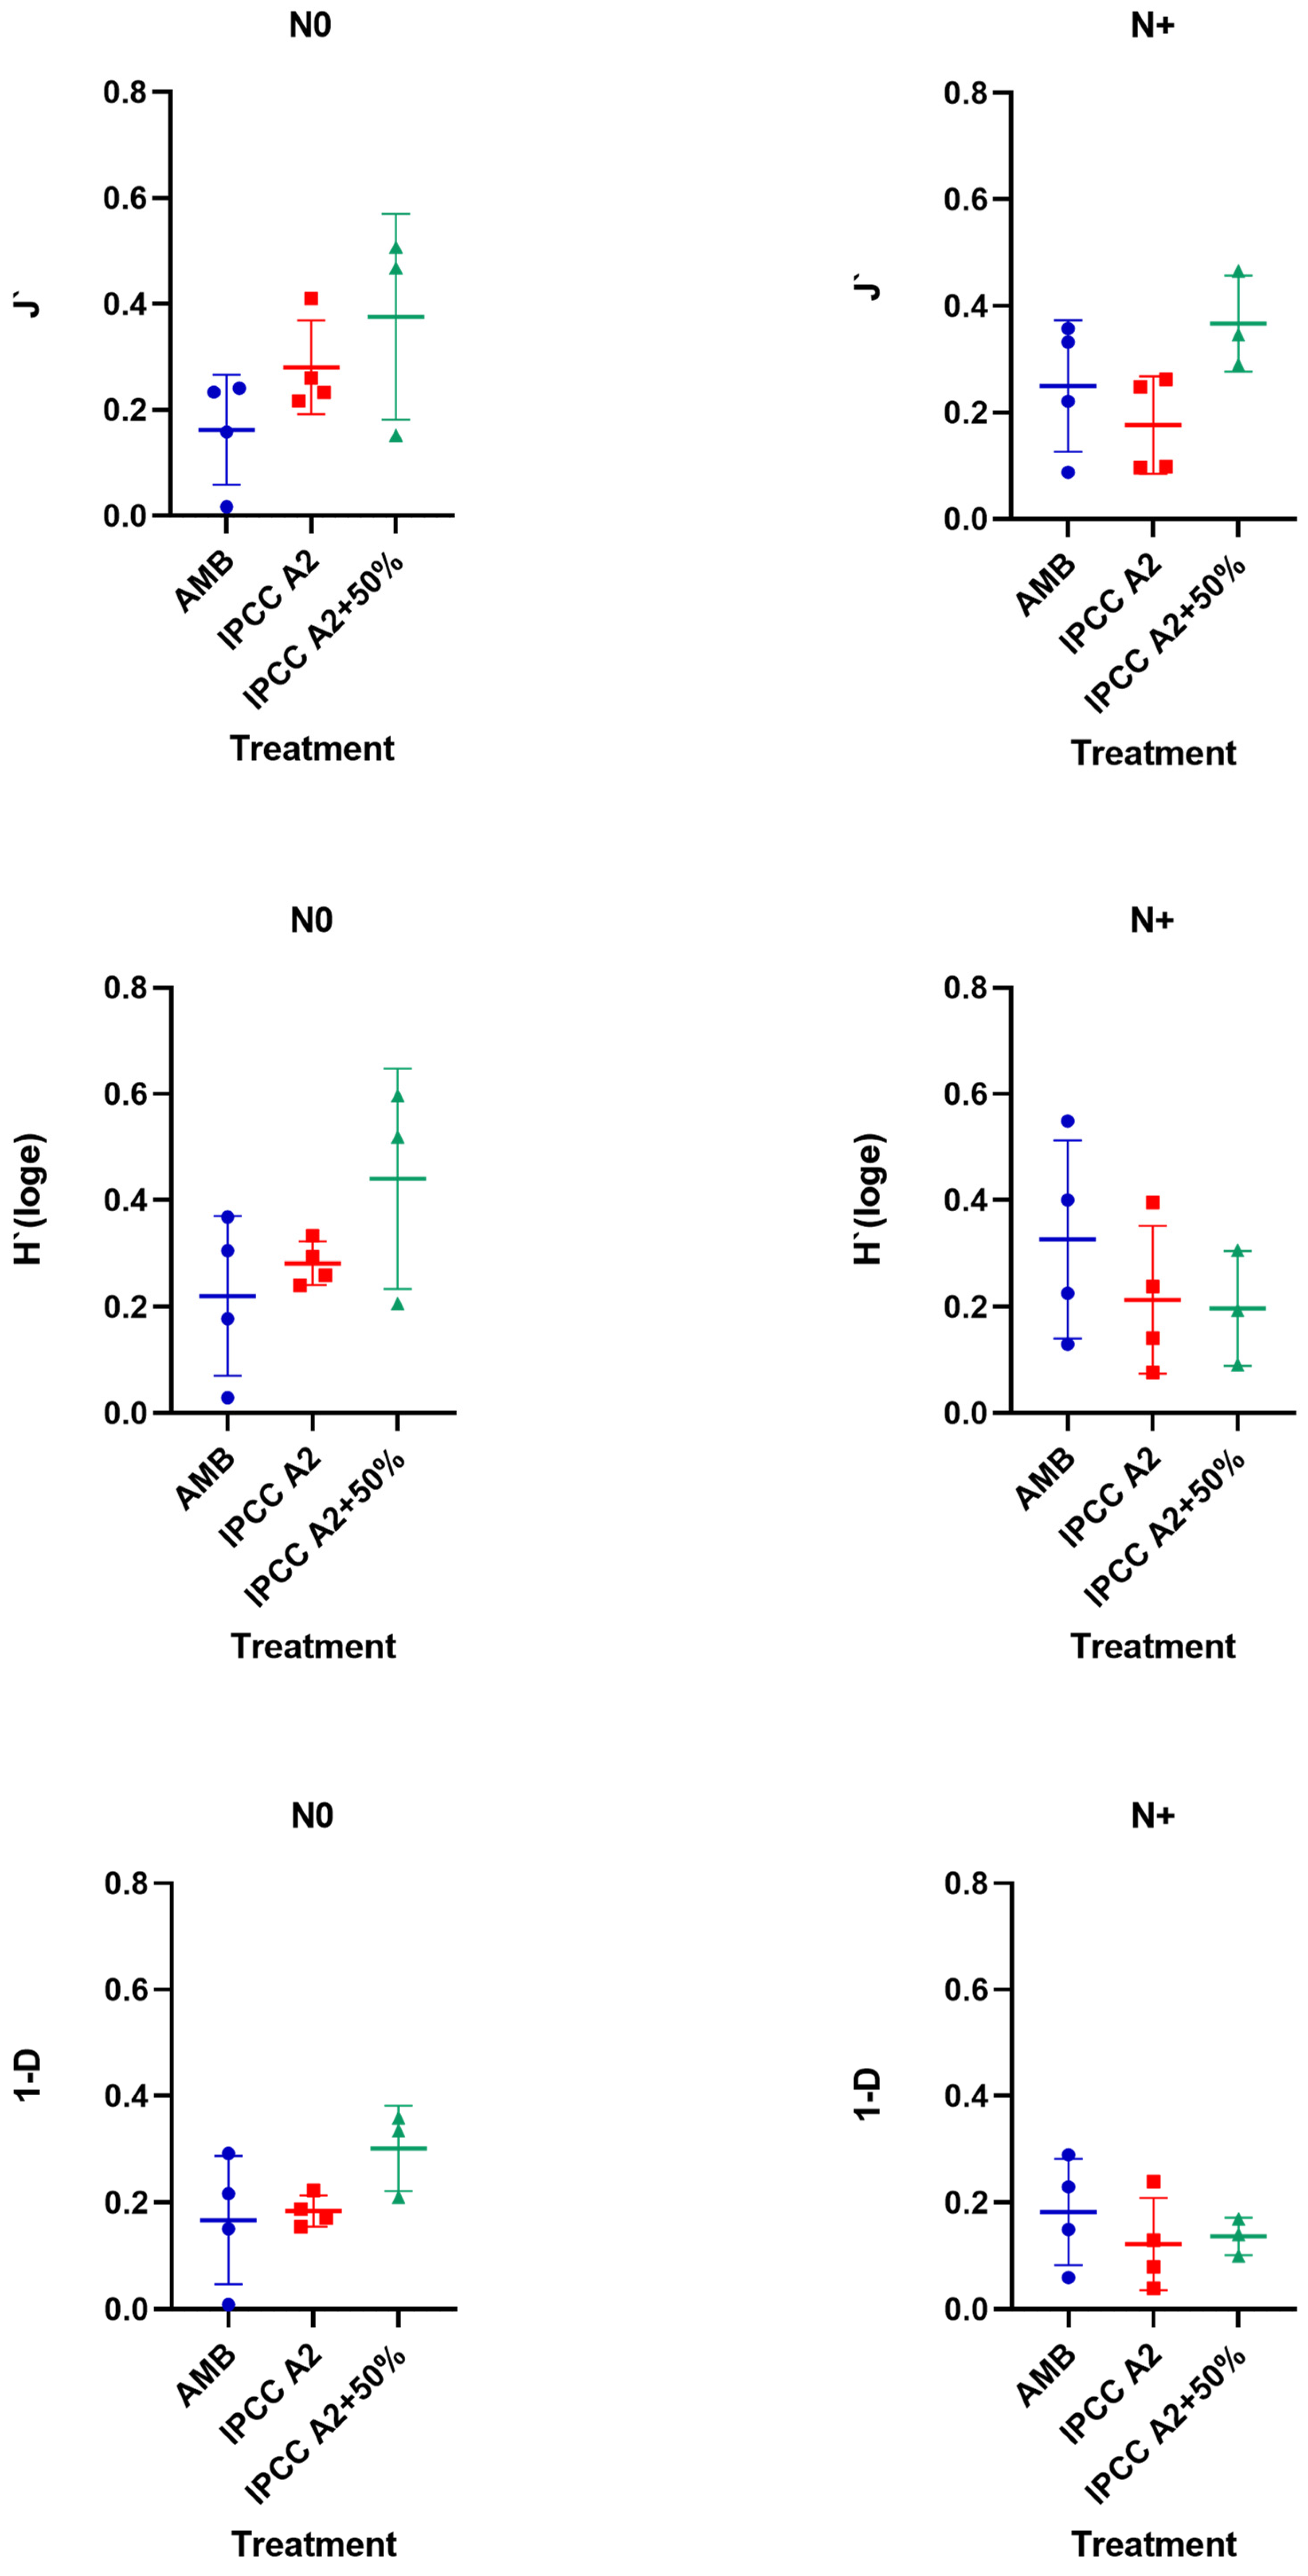
3.5. Changes in Phytoplankton Diversity
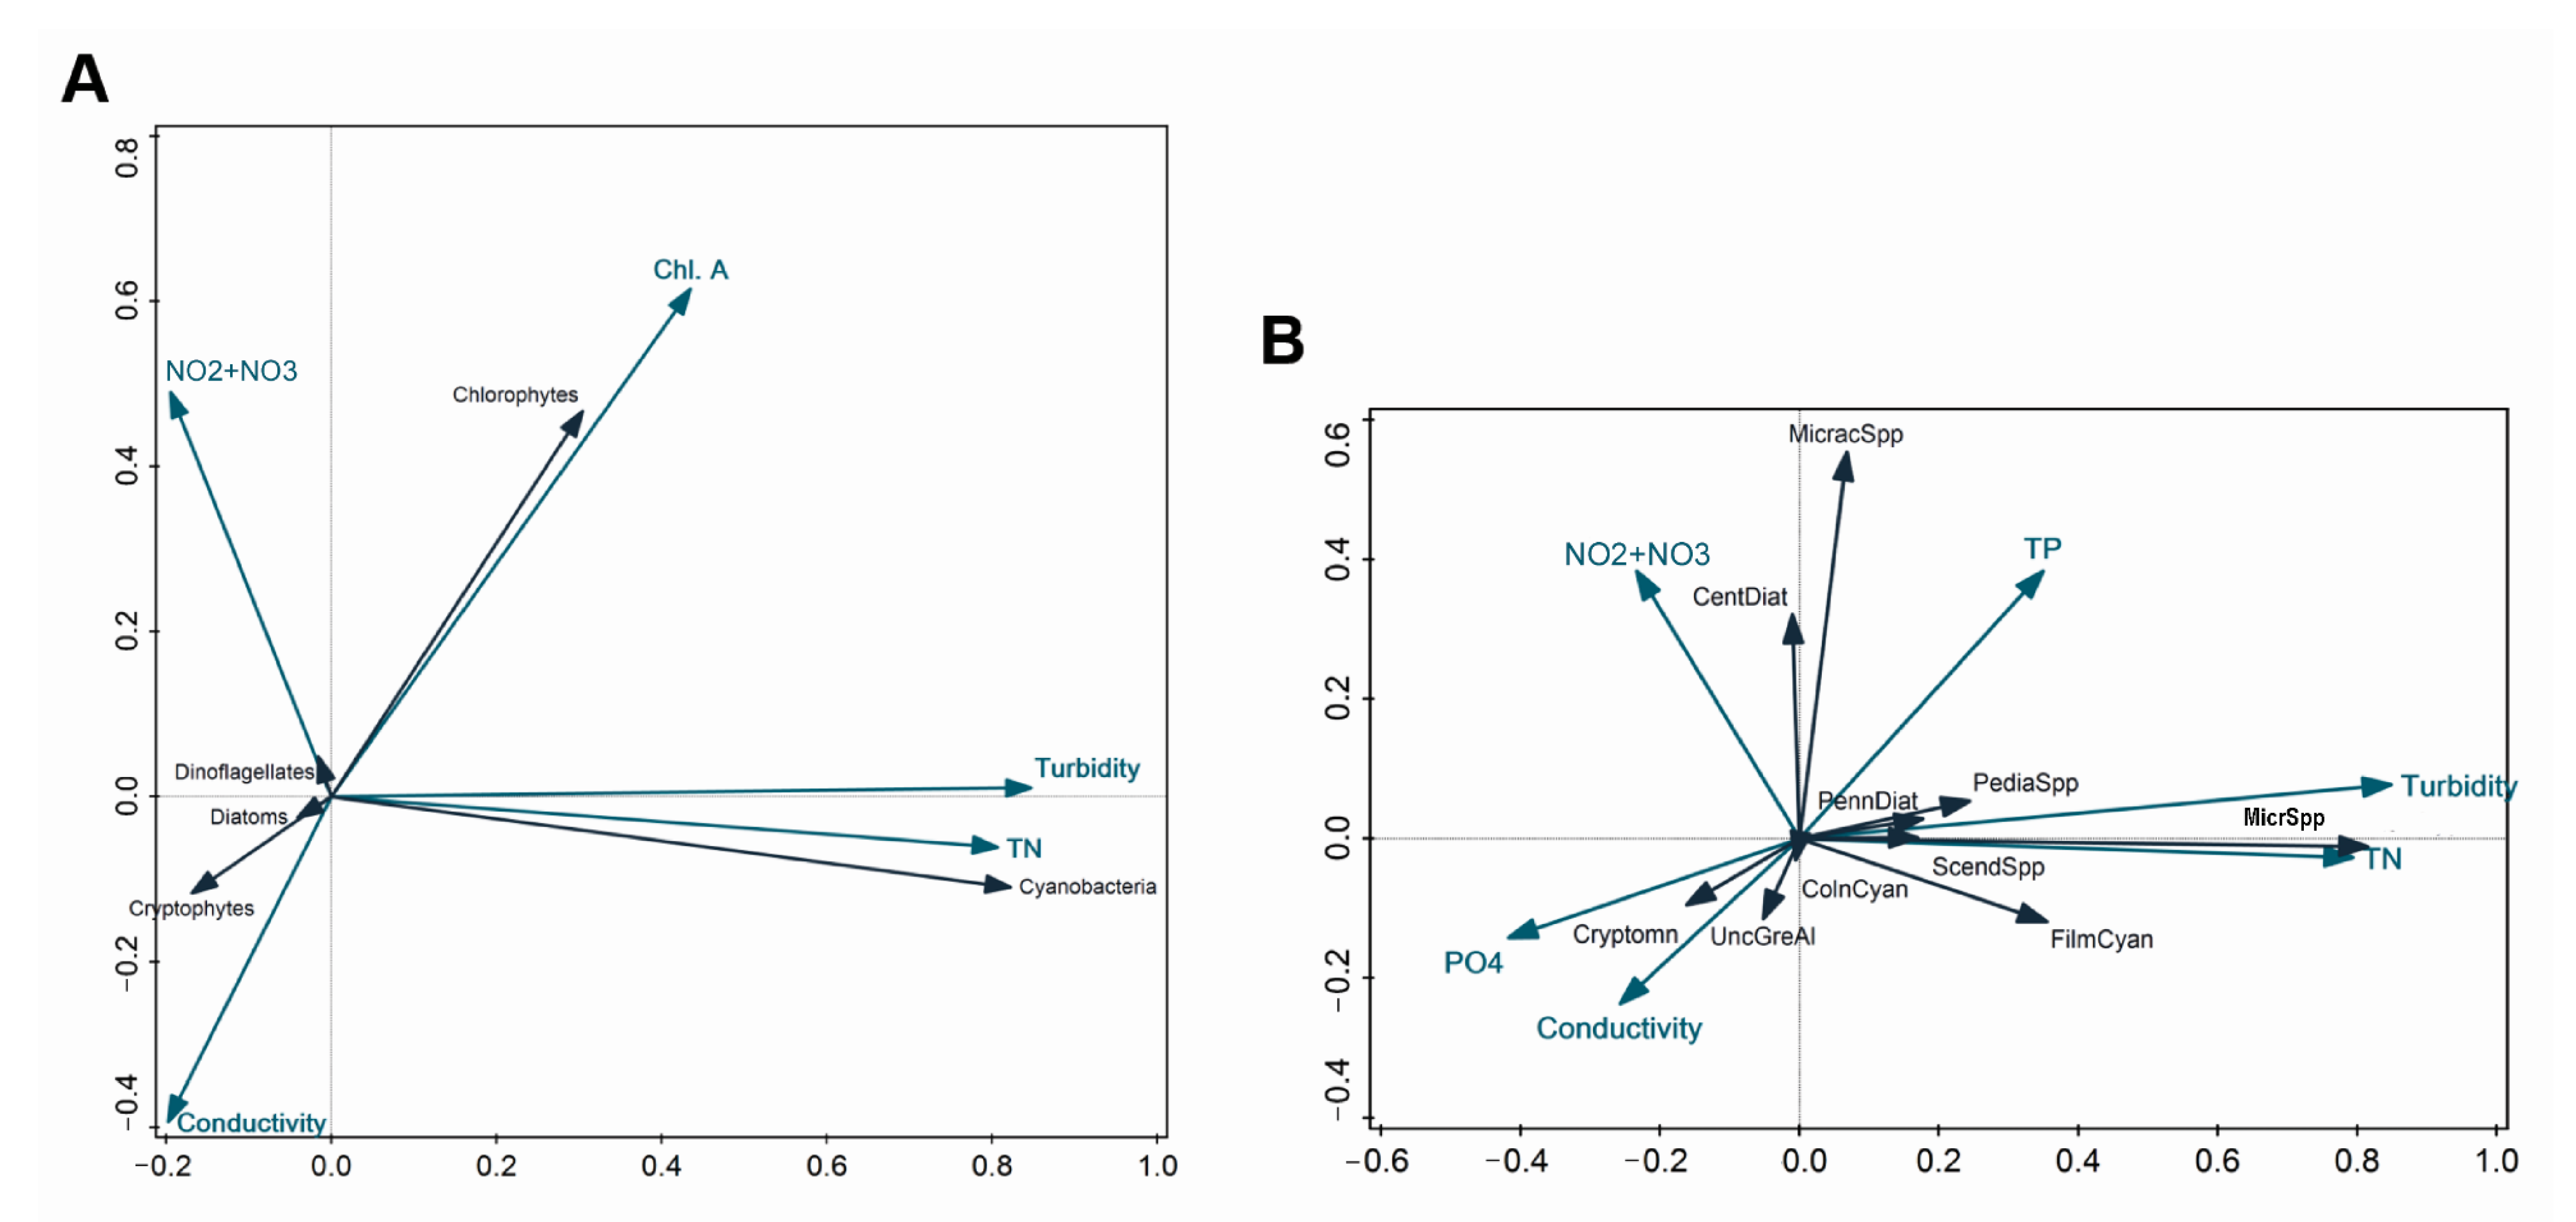
3.6. RDA of Phytoplankton Community and Environmental Factors
4. Discussion
4.1. Phytoplankton Cell Size
4.2. Phytoplankton Community Composition and Biomass Shifting
4.3. Phytoplankton Diversity
5. Conclusions
Supplementary Materials
Author Contributions
Funding
Institutional Review Board Statement
Informed Consent Statement
Data Availability Statement
Acknowledgments
Conflicts of Interest
References
- Kosten, S.; Huszar, V.; Bécares, E.; Costa, L.S.; van Donk, E.; Hansson, L.-A.; Jeppesen, E.; Kruk, C.; Lacerot, G.; Mazzeo, N.; et al. Warmer climates boost cyanobacterial dominance in shallow lakes. Glob. Chang. Biol. 2012, 18, 118–126. [Google Scholar] [CrossRef]
- Jeppesen, E.; Kronvang, B.; Meerhoff, M.; Søndergaard, M.; Hansen, K.M.; Andersen, H.E.; Lauridsen, T.L.; Liboriussen, L.; Beklioglu, M.; Özen, A.; et al. Climate change effects on runoff, catchment phosphorus loading and lake ecological state, and potential adaptations. J. Environ. Qual. 2009, 38, 1930–1941. [Google Scholar] [CrossRef] [PubMed]
- Woodward, G.; Perkins, D.M.; Brown, L.E. Climate change and freshwater ecosystems impacts across multiple levels of organization. Philos. Trans. R. Soc. B 2010, 365, 2093–2106. [Google Scholar] [CrossRef] [PubMed] [Green Version]
- Moss, B.; Kosten, S.; Meerhoff, M.; Battarbee, R.W.; Jeppesen, E.; Mazzeo, N.; Havens, K.E.; Lacerot, G.; Liu, Z.W.; De Meester, L.; et al. Allied attack: Climate change and eutrophication. Inland Waters 2011, 1, 101–105. [Google Scholar] [CrossRef] [Green Version]
- Meis, S.; Thackeray, S.; Jones, I. Effects of recent climate change on phytoplankton phenology in a temperate lake. Freshw. Biol. 2009, 54, 1888–1898. [Google Scholar] [CrossRef]
- Lewandowska, A.; Sommer, U. Climate change and the spring bloom: A mesocosm study on the influence of light and temperature on phytoplankton and mesozooplankton. Mar. Ecol. Prog. Ser. 2010, 405, 101–111. [Google Scholar] [CrossRef] [Green Version]
- Winder, M.; Sommer, U. Phytoplankton response to a changing climate. Hydrobiologia 2012, 698, 5–16. [Google Scholar] [CrossRef]
- Jeppesen, E.; Canfield, D.E.; Bachmann, R.W.; Søndergaard, M.; Havens, K.E.; Johansson, L.S.; Lauridsen, T.L.; Sh, T.; Rutter, R.P.; Warren, G.; et al. Toward predicting climate change effects on lakes: A comparison of 1656 shallow lakes from Florida and Denmark reveals substantial differences in nutrient dynamics, metabolism, trophic structure, and top-down control. Inland Waters 2020, 10, 197–211. [Google Scholar] [CrossRef]
- Paerl, H.; Paul, V. Climate change: Links to global expansion of harmful cyanobacteria. Water Res. 2012, 46, 1349–1363. [Google Scholar] [CrossRef]
- Paerl, H.; Huisman, J. Climate change: A catalyst for global expansion of harmful cyanobacterial blooms. Environ. Microbiol. Rep. 2009, 1, 27–37. [Google Scholar] [CrossRef]
- Yan, X.; Xu, X.; Wang, M.; Wang, G.; Wu, S.; Li, Z.; Sun, H.; Shi, A.; Yang, Y. Climate warming and cyanobacteria blooms: Looks at their relationships from a new perspective. Water Res. 2017, 125, 449–457. [Google Scholar] [CrossRef] [PubMed]
- Yang, Y.; Stenger-Kovács, C.; Padisák, J.; Pettersson, K. Effects of winter severity on spring phytoplankton development in a temperate lake (Lake Erken, Sweden). Hydrobiologia 2016, 780, 47–57. [Google Scholar] [CrossRef]
- Machado, K.B.; Vieira, L.C.G.; Nabout, J.C. Predicting the dynamics of taxonomic and functional phytoplankton compositions in different global warming scenarios. Hydrobiologia 2019, 830, 115–134. [Google Scholar] [CrossRef]
- Schaum, C.; Barton, S.; Bestion, E.; Buckling, A.; Garcia-Carreras, B.; Lopez, P.; Lowe, C.; Pawar, S.; Smirnoff, N.; Trimmer, M.; et al. Adaptation of phytoplankton to a decade of experimental warming linked to increased photosynthesis. Nat. Ecol. Evol. 2017, 1, 94. [Google Scholar] [CrossRef]
- Abonyi, A.; Ács, É.; Hidas, A.; Grigorszky, I.; Várbíró, G.; Borics, G.; Kiss, K.T. Functional diversity of phytoplankton highlights long-term gradual regime shift in the middle section of the Danube River due to global warming, human impacts and oligotrophication. Freshw. Biol. 2018, 63, 456–472. [Google Scholar] [CrossRef] [Green Version]
- Fu, H.; Yuan, G.; Ozkan, K.; Sander Johansson, L.; Sondergaard, M.; Lauridsen, T.L.; Jeppesen, E. Seasonal and long-term trends in the spatial heterogeneity of lake phytoplankton communities over two decades of restoration and climate change. Sci. Total Environ. 2020, 748, 141106. [Google Scholar] [CrossRef]
- Barica, J.; Kling, H.; Gibson, J. Experimental manipulation of algal bloom composition by nitrogen addition. Can. J. Fish. Aquat. Sci. 1980, 37, 1175–1183. [Google Scholar] [CrossRef]
- Finlay, K.; Patoine, A.; Donald, D.B.; Bogard, M.J.; Leavitt, P.R. Experimental evidence that pollution with urea can degrade water quality in phosphorus-rich lakes of the Northern Great Plains. Limnol. Oceanogr. 2010, 55, 1213–1230. [Google Scholar] [CrossRef]
- Donald, D.B.; Bogard, M.J.; Finlay, K.; Bunting, L.; Leavitt, P.R. Phytoplankton-specific response to enrichment of phosphorus-rich surface waters with ammonium, nitrate, and urea. PLoS ONE 2013, 8, e53277. [Google Scholar] [CrossRef] [Green Version]
- Bogard, M.; Vogt, R.; Hayes, N.; Leavitt, P. Unabated nitrogen pollution favors growth of toxic cyanobacteria over Chlorophytes in most hypereutrophic lakes. Environ. Sci. Technol. 2020, 54, 3219–3227. [Google Scholar] [CrossRef]
- Swabrick, V.J.; Simpson, G.L.; Glibert, P.M.; Leavitt, P.R. Differential stimulation and suppression of phytoplankton growth by ammonium enrichment in eutrophic hardwater lakes over 16 years. Limnol. Oceanogr. 2019, 64, S130–S149. [Google Scholar]
- McKee, D.; Atkinson, D.; Collings, S.; Eaton, J.; Gill, A.; Harvey, I.; Hatton, K.; Heyes, T.; Wilson, D.; Moss, B. Response of freshwater microcosm communities to nutrients, fish, and elevated temperature during winter and summer. Limnol. Oceanogr. 2003, 48, 707–722. [Google Scholar] [CrossRef] [Green Version]
- Verbeek, L.; Gall, A.; Hillebrand, H.; Striebel, M. Warming and oligotrophication cause shifts in freshwater phytoplankton communities. Glob. Chang. Biol. 2018, 24, 4532–4543. [Google Scholar] [CrossRef] [PubMed] [Green Version]
- Richardson, J.; Feuchtmayr, H.; Miller, C.; Hunter, P.; Maberly, S.; Carvalho, L. Response of cyanobacteria and phytoplankton abundance to warming, extreme rainfall events and nutrient enrichment. Glob. Chang. Biol. 2019, 25, 3365–3380. [Google Scholar] [CrossRef] [PubMed] [Green Version]
- Filiz, N.; Işkın, U.; Beklioğlu, M.; Öğlü, B.; Cao, Y.; Davidson, T.A.; Søndergaard, M.; Lauridsen, T.L.; Jeppesen, E. Phytoplankton community response to nutrients, temperatures, and a heat wave in shallow lakes: An experimental approach. Water 2020, 12, 3394. [Google Scholar] [CrossRef]
- Haraguchi, L.; Jakobsen, H.H.; Lundholm, N.; Carstensen, J. Monitoring natural phytoplankton communities: A comparison between traditional methods and pulse-shape recording flow cytometry. Aquat. Microb. Ecol. 2017, 80, 77–92. [Google Scholar] [CrossRef]
- Sieracki, C.; Sieracki, M.; Yentsch, C. An imaging-in-flow system for automated analysis of marine microplankton. Mar. Ecol. Prog. Ser. 1998, 168, 285–296. [Google Scholar] [CrossRef] [Green Version]
- Olson, R.; Sosik, H. A submersible imaging-in-flow instrument to analyze nano-and microplankton: Imaging FlowCytobot. Limnol. Oceanogr. Methods 2007, 5, 195–203. [Google Scholar] [CrossRef] [Green Version]
- Dashkova, V.; Malashenkov, D.; Poulton, N.; Vorobjev, I.; Barteneva, N. Imaging flow cytometry for phytoplankton analysis. Methods 2017, 112, 188–200. [Google Scholar] [CrossRef]
- Dashkova, V.; Segev, E.; Malashenkov, D.; Kolter, R.; Vorobjev, I.; Barteneva, N. Microalgal cytometric analysis in the presence of endogenous autofluorescent pigments. Algal Res. 2016, 19, 370–380. [Google Scholar] [CrossRef]
- Zarauz, L.; Irigoien, X.; Fernandes, J. Changes in plankton size structure and composition, during the generation of a phytoplankton bloom, in the central Cantabrian Sea. J. Plankton Res. 2008, 31, 193–207. [Google Scholar] [CrossRef] [Green Version]
- Álvarez, E.; Moyano, M.; López-Urrutia, A.; Nogueira, E.; Scharek, R. Routine determination of plankton community composition and size structure: A comparison between FlowCAM and light microscopy. J. Plankton Res. 2014, 36, 170–184. [Google Scholar] [CrossRef] [Green Version]
- Laney, S.; Sosik, H. Phytoplankton assemblage structure in and around a massive under-ice bloom in the Chukchi Sea. Deep Sea Res. Part II Top. Stud. Oceanogr. 2014, 105, 30–41. [Google Scholar] [CrossRef]
- Reul, A.; Muñoz, M.; Bautista, B.; Neale, P.J.; Sobrino, C.; Mercado, J.M.; Segovia, M.; Salles, S.; Kulk, G.; León, P.; et al. Effect of CO2, nutrients and light on coastal plankton. III. Trophic cascade, size structure and composition. Aquat. Biol. 2014, 22, 59–76. [Google Scholar] [CrossRef] [Green Version]
- Poulton, N.J.; Martin, J.L. Imaging flow cytometry for quantitative phytoplankton analysis-FlowCAM. In Microscopic and Molecular Methods for Quantitative Phytoplankton Analysis; UNESCO: Paris, France, 2010; p. 47. [Google Scholar]
- Liboriussen, L.; Landkildehus, F.; Meerhoff, M.; Bramm, M.E.; Søndergaard, M.; Christoffersen, K.; Richardson, K.; Søndergaard, M.; Lauridsen, T.L.; Jeppesen, E. Global warming: Design of a flow-through shallow lake mesocosm climate experiment. Limnol. Oceanogr. Methods 2005, 3, 1–9. [Google Scholar] [CrossRef]
- Hao, B.; Wu, H.; Zhen, W.; Jo, H.; Cai, Y.; Jeppesen, E.; Li, W. Warming effects in periphoton community and abundance in different seasons are influenced by nutrient state and plant type: Shallow lake mesocosm. Front. Plant Sci. 2020, 11, 404. [Google Scholar] [CrossRef]
- Søndergaard, M.; Jeppesen, E.; Mortensen, E.; Dall, E.; Kristensen, P.; Sortkjær, O. Phytoplankton biomass reduction after planktivorous fish reduction in a shallow, eutrophic lake: A combined effect of reduced internal P-loading and increased zooplankton grazing. Hydrobiologia 1990, 200, 229–240. [Google Scholar] [CrossRef]
- Gibbs, M. A simple method for the rapid determination of iron in natural waters. Water Res. 1979, 13, 295–297. [Google Scholar] [CrossRef]
- Malashenkov, D.; Dashkova, V.; Zhakupova, K.; Vorobjev, I.; Barteneva, N. Comparative analysis of freshwater phytoplankton communities in two lakes of Burabay National Park using morphological and molecular approaches. Sci. Rep. 2021, 11, 16130. [Google Scholar] [CrossRef]
- Olenina, I. Biovolumes and size-classes of phytoplankton in the Baltic Sea. Balt. Sea Environ. Proc. 2006, 106, 6–22. [Google Scholar]
- Bergkemper, V.; Weisse, T. Do current European lake monitoring programmes reliably estimate phytoplankton community changes? Hydrobiologia 2017, 824, 143–162. [Google Scholar] [CrossRef] [Green Version]
- Jakobsen, H.; Carstensen, J. FlowCAM: Sizing cells and understanding the impact of size distributions on biovolume of planktonic community structure. Aquat. Microb. Ecol. 2011, 65, 75–87. [Google Scholar] [CrossRef] [Green Version]
- Kydd, J.; Rajakaruna, H.; Briski, E.; Bailey, S. Examination of a high resolution laser optical plankton counter and FlowCAM for measuring plankton concentration and size. J. Sea Res. 2018, 133, 2–10. [Google Scholar] [CrossRef] [Green Version]
- Hsieh, C.H.; Ishikawa, K.; Sakai, Y.; Ishikawa, T.; Ichise, S.; Yamamoto, Y.; Kuo, T.C.; Park, H.D.; Yamamura, N.; Kumagai, M. Phytoplankton community reorganization driven by eutrophication and warming in Lake Biwa. Aquat. Sci. 2010, 72, 467–483. [Google Scholar] [CrossRef]
- De Senerpont Domis, L.N.; Van de Waal, D.B.; Helmsing, N.R.; Van Donk, E.; Mooij, W.M. Community stoichiometry in a changing world: Combined effects of warming and eutrophication on phytoplankton dynamics. Ecology 2014, 95, 1485–1495. [Google Scholar] [CrossRef] [Green Version]
- Nielsen, L.; Jakobsen, H.; Hansen, P. High resilience of two coastal plankton communities to twenty-first century seawater acidification: Evidence from microcosm studies. Mar. Biol. Res. 2010, 6, 542–555. [Google Scholar] [CrossRef]
- Jónasdóttir, S.; Dutz, J.; Koski, M.; Yebra, L.; Jakobsen, H.; Vidoudez, C.; Pohnert, G.; Nejstgaard, J. Extensive cross-disciplinary analysis of biological and chemical control of Calanus finmarchicus reproduction during an aldehyde forming diatom bloom in mesocosms. Mar. Biol. 2011, 158, 1943–1963. [Google Scholar] [CrossRef] [Green Version]
- Calbet, A.; Sazhin, A.F.; Nejstgaard, J.C.; Berger, S.A.; Tait, Z.S.; Olmos, L.; Sousoni, D.; Isari, S.; Martinez, R.A.; Bouquet, J.M.; et al. Future climate scenarios for a coastal productive planktonic food web resulting in microplankton phenology changes and decreased trophic transfer efficiency. PLoS ONE 2014, 9, e94388. [Google Scholar]
- Whitten, A.; Marin Jarrin, J.; McNaught, A. A mesocosm investigation of the effects of quagga mussels (Dreissena rostriformis bugensis) on Lake Michigan zooplankton assemblages. J. Great Lakes Res. 2018, 44, 105–113. [Google Scholar] [CrossRef]
- Detmer, T.; Broadway, K.; Potter, C.; Collins, S.; Parkos, J.; Wahl, D. Comparison of microscopy to a semi-automated method (FlowCAM) for characterization of individual-, population-, and community-level measurements of zooplankton. Hydrobiologia 2019, 838, 99–110. [Google Scholar] [CrossRef]
- Mirasbekov, Y.; Zhumakhanova, A.; Zhantuyakova, A.; Sarkytbayev, K.; Malashenkov, D.; Baishulakova, A.; Dashkova, V.; Davidson, T.; Vorobjev, I.A.; Jeppesen, E.; et al. Semi-automated classification of colonial Microcystis by FlowCAM imaging flow cytometry in mesocosm experiment reveals high heterogeneity during seasonal bloom. Sci. Rep. 2021, 11, 9377. [Google Scholar] [CrossRef] [PubMed]
- Hillebrand, H.; Acevedo-Trejos, E.; Moorthi, S.D.; Ryabov, A.; Striebel, M.; Thomas, P.K.; Schneider, M.L. Cell size as driver and sentinel of phytoplankton community structure and functioning. Funct. Ecol. 2022, 36, 276–293. [Google Scholar] [CrossRef]
- Yvon-Durocher, G.; Montoya, J.; Trimmer, M.; Woodward, G. Warming alters the size spectrum and shifts the distribution of biomass in freshwater ecosystems. Glob. Chang. Biol. 2011, 17, 1681–1694. [Google Scholar] [CrossRef] [Green Version]
- Zohary, T.; Flaim, G.; Sommer, U. Temperature and the size of freshwater phytoplankton. Hydrobiologia 2020, 848, 143–155. [Google Scholar] [CrossRef]
- Irwin, A.; Finkel, Z.; Schofield, O.; Falkowski, P. Scaling-up from nutrient physiology to the size-structure of phytoplankton communities. J. Plankton Res. 2006, 28, 459–471. [Google Scholar] [CrossRef] [Green Version]
- Peter, K.; Sommer, U. Phytoplankton Cell Size Reduction in Response to Warming Mediated by Nutrient Limitation. PLoS ONE 2013, 8, e71528. [Google Scholar] [CrossRef] [Green Version]
- Álvarez, E.; López-Urrutia, A.; Nogueira, E. Improvement of plankton biovolume estimates derived from image-based automatic sampling devices: Application to FlowCAM. J. Plankton Res. 2012, 34, 454–469. [Google Scholar] [CrossRef] [Green Version]
- Hrycik, A.; Shambaugh, A.; Stockwell, J. Comparison of FlowCAM and microscope biovolume measurements for a diverse freshwater phytoplankton community. J. Plankton Res. 2019, 41, 849–864. [Google Scholar] [CrossRef]
- Moss, B.; Mckee, D.; Atkinson, D.; Collings, S.; Eaton, J.; Gill, A.; Harvey, I.; Hatton, K.; Heyes, T.; Wilson, D. How important is climate? Effects of warming, nutrient addition and fish on phytoplankton in shallow lake microcosms. J. Appl. Ecol. 2004, 40, 782–792. [Google Scholar] [CrossRef] [Green Version]
- Lv, J.; Wu, H.; Chen, M. Effects of nitrogen and phosphorus on phytoplankton composition and biomass in 15 subtropical, urban shallow lakes in Wuhan, China. Limnologica 2011, 41, 48–56. [Google Scholar] [CrossRef] [Green Version]
- Moraska Lafrancois, B.; Nydick, K.R.; Caruso, B. Influence of nitrogen on phytoplankton biomass and community composition in fifteen Snowy Range Lakes (Wyoming, USA). Arct. Antarct. Alp. Res. 2003, 35, 499–508. [Google Scholar] [CrossRef]
- Beklioğlu, M.; Bucak, T.; Levi, E.E.; Erdoğan, Ş.; Özen, A.; Filiz, N.; Bezirci, G.; Çakıroğlu, A.İ.; Tavşanoğlu, Ü.N.; Gökçe, D.; et al. Influences of climate and nutrient enrichment on the multiple trophic levels of Turkish shallow lakes. Inland Waters 2020, 10, 173–185. [Google Scholar] [CrossRef]
- Ahoutou, M.K.; Yao, E.K.; Djeha, R.Y.; Kone, M.; Tambosco, K.; Duval, C.; Hamlaoui, S.; Bernard, C.; Bouvy, M.; Marie, B.; et al. Impacts of nutrient loading and fish grazing on the phytoplankton community and cyanotoxin production in a shallow tropical lake: Results from mesocosm experiments. Microbiol. Open 2022, 11, e1278. [Google Scholar] [CrossRef] [PubMed]
- Jensen, J.; Jeppesen, E.; Olrik, K.; Kristensen, P. Impact of Nutrients and Physical Factors on the Shift from Cyanobacterial to Chlorophyte Dominance in Shallow Danish Lakes. Can. J. Fish. Aquat. Sci. 1994, 51, 1692–1699. [Google Scholar] [CrossRef]
- Ma, J.; Qin, B.; Paerl, H.; Brookes, J.; Wu, P.; Zhou, J.; Deng, J.; Guo, J.; Li, Z. Green algal over cyanobacterial dominance promoted with nitrogen and phosphorus additions in a mesocosm study at Lake Taihu, China. Environ. Sci. Pol. Res. 2014, 22, 5041–5049. [Google Scholar] [CrossRef]
- Escalas, A.; Catherine, A.; Maloufi, S.; Cellamare, M.; Hamlaoui, S.; Yéprémian, C.; Louvard, C.; Troussellier, M.; Bernard, C. Drivers and ecological consequences of dominance in periurban phytoplankton communities using networks approaches. Water Res. 2019, 163, 114893. [Google Scholar] [CrossRef] [Green Version]
- Amorim, C.A.; do Nascimento Moura, A. Ecological impacts of freshwater algal blooms on water quality, plankton biodiversity, structure, and ecosystem functioning. Sci. Total Environ. 2021, 758, 143605. [Google Scholar] [CrossRef]
- Griffith, A.; Gobler, C. Harmful algal blooms: A climate change co-stressor in marine and freshwater ecosystems. Harmful Algae 2020, 91, 101590. [Google Scholar] [CrossRef]
- Li, D.; Wu, N.; Tang, S.; Su, G.; Li, X.; Zhang, Y.; Wang, G.; Zhang, J.; Liu, H.; Hecker, M.; et al. Factors associated with blooms of cyanobacteria in a large shallow lake, China. Environ. Sci. Eur. 2018, 30, 27. [Google Scholar] [CrossRef]
- Søndergaard, M.; Jensen, J.P.; Jeppesen, E. Role of sediment and internal loading of phosphorus in shallow lakes. Hydrobiologia 2003, 506, 135–145. [Google Scholar] [CrossRef]
- Yvon-Durocher, G.; Allen, A.P.; Cellamare, M.; Dossena, M.; Gaston, K.J.; Leitao, M.; Montoya, J.M.; Reuman, D.C.; Woodward, G.; Trimmer, M. Five years of experimental warming increases the biodiversity and productivity of phytoplankton. PLoS Biol. 2015, 13, e1002324. [Google Scholar] [CrossRef] [PubMed] [Green Version]
- Schindler, D.W.; Beaty, K.G.; Fee, E.J.; Cruikshank, D.R.; DeBruyn, E.R.; Findlay, D.L.; Linsey, G.A.; Shearer, J.A.; Stainton, M.P.; Turner, M.A. Effects of climatic warming on lakes of the central boreal forest. Science 1990, 250, 967–970. [Google Scholar] [CrossRef] [PubMed]
- Rasconi, S.; Winter, K.; Kainz, M. Temperature increase and fluctuation induce phytoplankton biodiversity loss-Evidence from a multi-seasonal mesocosm experiment. Ecol. Evol. 2017, 7, 2936–2946. [Google Scholar] [CrossRef] [PubMed]
- Urrutia-Cordero, P.; Ekvall, M.; Ratcovich, J.; Soares, M.; Wilken, S.; Zhang, H.; Hansson, L.-A. Phytoplankton diversity loss along a gradient of future warming and brownification in freshwater mesocosms. Freshw. Biol. 2017, 62, 1869–1878. [Google Scholar] [CrossRef]
- Rosset, V.; Lehmann, A.; Oertli, B. Warmer and richer? Predicting the impact of climate warming on species richness in small temperate waterbodies. Glob. Chang. Biol. 2010, 16, 2376–2387. [Google Scholar] [CrossRef]


Publisher’s Note: MDPI stays neutral with regard to jurisdictional claims in published maps and institutional affiliations. |
© 2022 by the authors. Licensee MDPI, Basel, Switzerland. This article is an open access article distributed under the terms and conditions of the Creative Commons Attribution (CC BY) license (https://creativecommons.org/licenses/by/4.0/).
Share and Cite
Dashkova, V.; Malashenkov, D.V.; Baishulakova, A.; Davidson, T.A.; Vorobjev, I.A.; Jeppesen, E.; Barteneva, N.S. Changes in Phytoplankton Community Composition and Phytoplankton Cell Size in Response to Nitrogen Availability Depend on Temperature. Microorganisms 2022, 10, 1322. https://doi.org/10.3390/microorganisms10071322
Dashkova V, Malashenkov DV, Baishulakova A, Davidson TA, Vorobjev IA, Jeppesen E, Barteneva NS. Changes in Phytoplankton Community Composition and Phytoplankton Cell Size in Response to Nitrogen Availability Depend on Temperature. Microorganisms. 2022; 10(7):1322. https://doi.org/10.3390/microorganisms10071322
Chicago/Turabian StyleDashkova, Veronika, Dmitry V. Malashenkov, Assel Baishulakova, Thomas A. Davidson, Ivan A. Vorobjev, Erik Jeppesen, and Natasha S. Barteneva. 2022. "Changes in Phytoplankton Community Composition and Phytoplankton Cell Size in Response to Nitrogen Availability Depend on Temperature" Microorganisms 10, no. 7: 1322. https://doi.org/10.3390/microorganisms10071322