Article

Identification, Characterization, and Virulence Gene Expression of Marine Enterobacteria in the Upper Gulf of Thailand

by
Pongrawee Nimnoi
1,† and
Neelawan Pongsilp
2,*,†
1
Department of Microbiology, Faculty of Liberal Arts and Science, Kasetsart University, Nakhon Pathom 73140, Thailand
2
Department of Microbiology, Faculty of Science, Silpakorn University, Nakhon Pathom 73000, Thailand
*
Author to whom correspondence should be addressed.
These authors contributed equally to this work.
Microorganisms 2022, 10(3), 511; https://doi.org/10.3390/microorganisms10030511
Submission received: 3 February 2022 / Revised: 19 February 2022 / Accepted: 24 February 2022 / Published: 26 February 2022
(This article belongs to the Topic Microorganisms in Aquatic Environments)

Abstract

:
Enterobacteria that commonly inhabit marine environments have a great impact on human health. In this study, enterobacteria isolated from seawater in the Upper Gulf of Thailand were identified and characterized. Seawater from nine sampling sites along the Upper Gulf of Thailand contained presumptive enterobacteria that ranged from 0.22 ± 0.44 to 17.00 ± 3.97 CFU/mL. The 101 strains belonged to seven species in which Klebsiella pneumoniae was the majority (47.5% of strains). The highest prevalence was resistant to ampicillin (76.2%) and ticarcillin (72.3%), respectively, whereas none was resistant to imipenem. Forty-five antibiotic resistance patterns were observed and 33.7% exhibited multidrug resistance, emphasizing the concern about public health. Three β-lactamase genes, including ampC, blaSHV, and blaTEM, were detected at the frequencies of 47.5%, 21.8%, and 11.9%, respectively. Six virulence genes, including csgD, uge, kfu, eaeA, magA, and LTI, were detected at the frequencies of 37.6%, 31.7%, 19.8%, 16.8%, 12.9%, and 5.9%, respectively. The condition of 4% NaCl downregulated the expression of the kfu and uge genes. The 67.3% and 63.4% of strains synthesized silver nanoparticles ranging between 3.04 ± 0.64 and 20.64 ± 0.95 μg/mL and gold nanoparticles ranging between 7.77 ± 0.45 and 57.57 ± 8.00 μg/mL, respectively.

1. Introduction

In our previous publication, the community and diversity of total bacteria present in seawater of the Upper Gulf of Thailand was first reported [1]. In this study, we further focused on culturable enterobacteria, an important group that has a large impact on human health. Enterobacteria, a heterogeneous group of the γ-Proteobacteria, belong to the order Enterobacterales and consist of eight families including Budviciaceae, Enterobacteriaceae, Erwiniaceae, Hafniaceae, Morganellaceae, Pectobacteriaceae, Thorselliaceae, and Yersiniaceae. Examples of genera include Citrobacter, Enterobacter, Erwinia, Escherichia, Klebsiella, Morganella, Pantoea, Proteus, Salmonella, Serratia, Shigella, and Yersinia [2,3]. Enterobacteria can cause a variety of diseases such as nonalcoholic steatohepatitis, allergy, eczema, asthma, inflammatory bowel disease, bacteremia, and neonatal meningitis [4,5,6,7]. Members of enterobacteria are considered as indicators for bacterial contamination in food and water and food safety evaluation; thus, are of sanitary significance [8]. Enterobacteria were found to commonly inhabit marine environments. Their prevalence was reported in seawater in Italy [9], Israel [10], Ireland [11,12], Brazil [13], and Palestine [14]. The contamination by enterobacteria in seawater affects water quality, and consequently endangers marine microbiota, marine animal health, and human health.
The characteristics that have been highlighted among enterobacteria include antibiotic resistance, pathogenesis, and metabolite synthesis. Antibiotic resistance has been reported to be a common characteristic among enterobacteria. Previous reports demonstrated that enterobacteria exhibited high levels of resistance to many antibiotics [15,16]. Marine enterobacteria were also found to be multidrug-resistant [14,17,18,19]. Enterobacteria have a special ability to obtain multidrug resistance in a single step by acquiring several resistance genes from various bacterial species and integrating those genes into the same plasmids [20]. This mechanism enables pathogens to become resistant to multiple antibiotics, increasing risks of failures in treatments with last resort antibiotics [21]. Trends in resistance patterns offer important insights regarding emerging pathogens as well as inform strategies for public health, infection control, and antimicrobial approaches [22]. Antibiotic resistance and virulence of pathogens play important roles in the infection process. Antibiotic resistance and virulence genes of enterobacteria are consequently of interest. Resistance and virulence are inextricably related to the phylogenetic information of the strain [23]. Even members of the same genus, only some species and strains are pathogenic [24]. Additionally, the strains (or species) differ in their virulence [25]. Virulence genes, which may be located on chromosomal pathogenicity islands (PAIs), plasmids, and other mobile genetic elements, control the disease-causing ability of bacteria [26]. Virulence genes can be classified into three types including (1) true virulence genes which encode factors or enzymes producing factors that are involved in bacteria-host interaction and directly cause the pathological damage during infection; (2) virulence-associated genes which encode factors or enzymes producing factors that control virulence gene expression or stimulate virulence factors or are essential for the activity of true virulence factors; and (3) virulence life-style genes which encode factors or enzymes producing factors that promote host colonization or enable evasion of the host immune system or enable interaction survival or employ host-factors for the advantages of survival [27]. Previous reports demonstrated that the expression of virulence genes was affected by several factors such as (1) nutrient starvation [28,29,30]; (2) osmotic agents (NaCl, sucrose, and glucose) [29,31,32,33,34,35,36]; (3) oxygen [37]; (4) temperature [31,38]; (5) growth phase [29,39,40]; (6) kind of carbon source [41,42]; (7) pH [43]; (8) sodium glycocholate [44]; and (9) L-glutamine [45]. Besides being a major problem in public health concern, enterobacteria are also highlighted for their application potential. Enterobacteria are promising nanoparticle-synthesizing bacteria based on the advantages of rapid, nonpolluted and nontoxic reaction, cost-effectiveness, easy purification of nanoparticles in supernatant, and size of nanoparticles [46,47,48,49]. Previous studies reported the ability of enterobacteria to synthesize various nanoparticles such as gold [49,50], silver [51,52], selenium [53], lead [54], and cadmium sulfide [55].
In this study, we investigated enterobacteria isolated from seawater at nine sites along the shores of the Upper Gulf of Thailand in the following aspects: (1) the use of enterobacterial repetitive intergenic consensus-polymerase chain reaction (ERIC-PCR) fingerprinting to distinguish enterobacterial strains; (2) the use of two-primers random amplified polymorphic DNA (TP-RAPD) fingerprinting to distinguish enterobacterial species; (3) the identification of enterobacterial species by using the Vitek® mass spectrometry (MS) system; (4) the dominant characteristics including resistance to antibiotics as well as synthesis of silver and gold nanoparticles; (5) the detection and sequence analysis of antibiotic resistance and virulence genes; and (6) the quantitative assessment of factors affecting the expression of virulence genes by a quantitative real-time PCR (qRT-PCR).

2. Materials and Methods

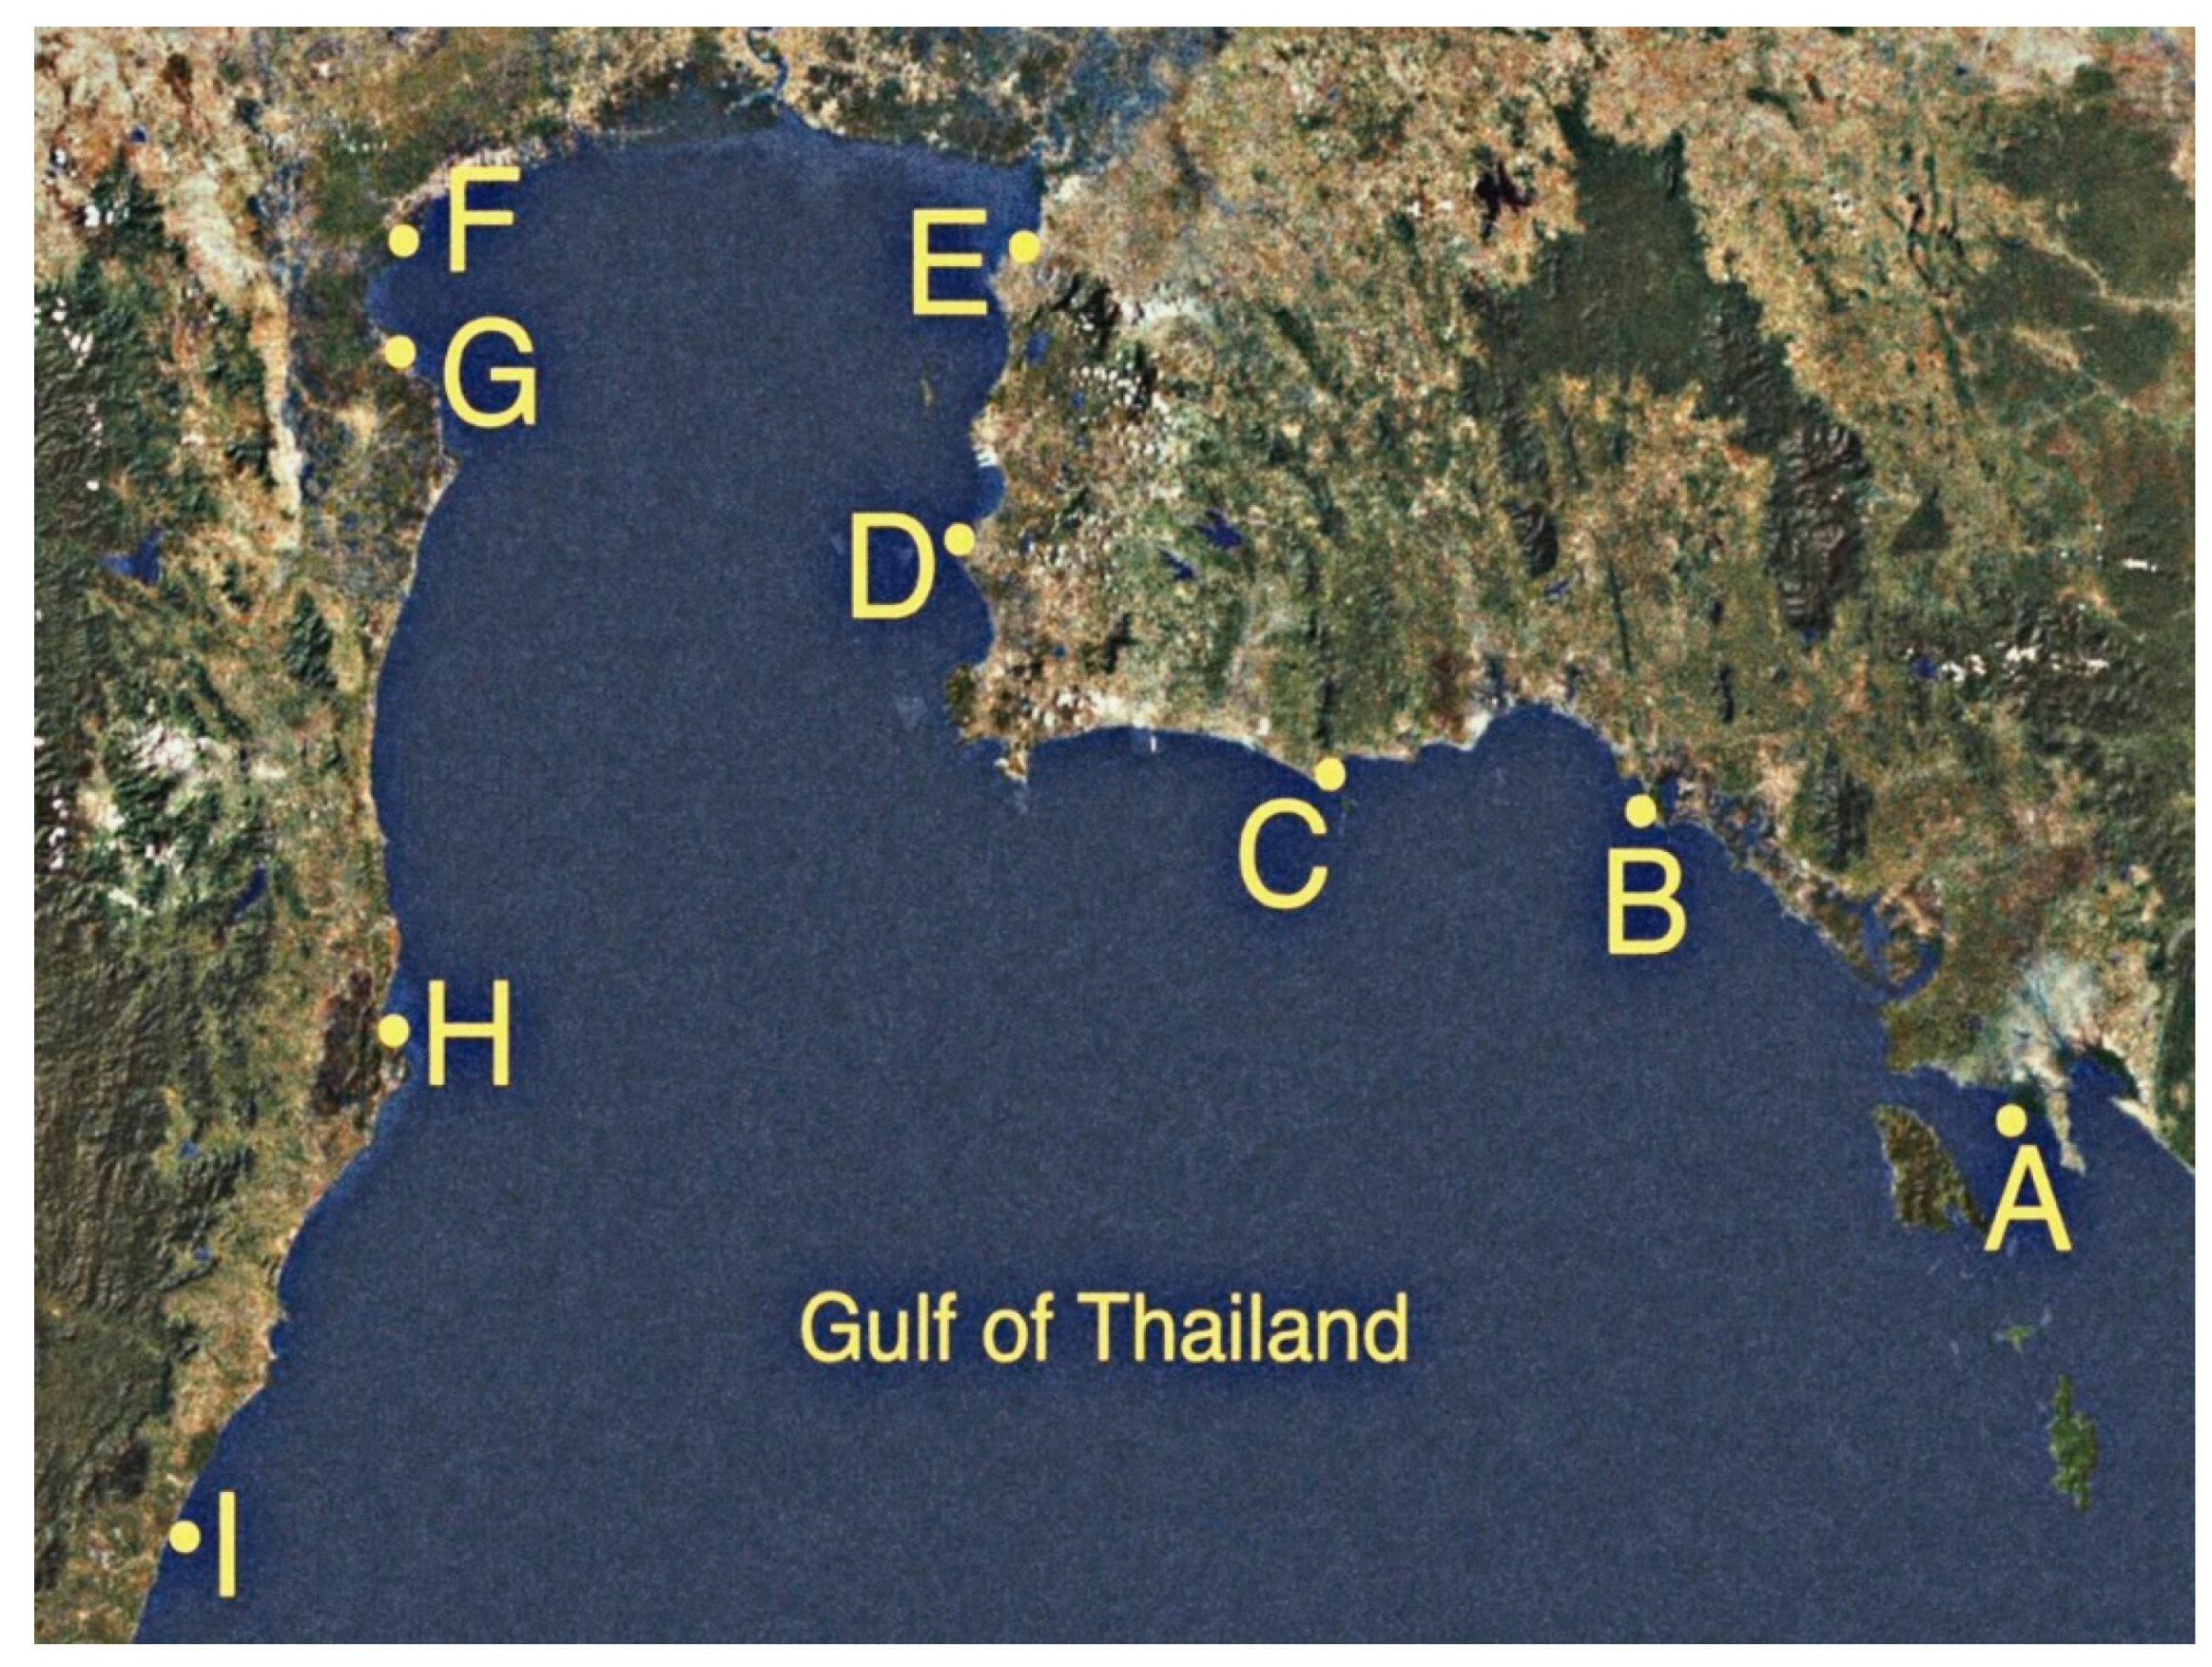
2.1. Isolation of Enterobacteria from Seawater Samples

Seawater was collected on 10 November and 1 December 2018 at nine sites in seven provinces along the shores of the Upper Gulf of Thailand, with a distance of approximately 769.97 km (Table 1 and Figure 1). Sampling sites were categorized into three types of land use that were presumably affected by different run-off conditions. Three mangrove forests were at Black Sand Beach (site A), Kungkrabaen Bay (site B), and Pranburi forest park (site H). Three tourist sites were at Suanson Beach (site C), Pattaya Beach (site D), and Wanakorn Beach (site I). Three aquaculture sites were at Angsila old market (site E), Donhoylhod (site F), and Bangtaboon Bay (site G). At each sampling site, near-surface seawater (depth approximately one foot) was collected approximately 2 m from the shoreline during the day (from 8 a.m. to 2 p.m.). The aseptic sampling was performed in triplicate as previously described [56] and the collected samples were stored on ice during transit. Temperatures and pH values of seawater samples from nine sampling sites ranged from 27 °C to 31 °C and 6.7 to 7.5, respectively. The isolation of enterobacteria was performed within 6 h after sample collection as previously described [57]. The numbers of presumptive enterobacteria in seawater samples were enumerated by a pour plate technique using a selective medium, violet red bile glucose (VRBG) agar (Titan Biotech. Ltd., Delhi, India) and reported as colony forming unit (CFU)/mL. Presumptive enterobacteria were selected based on the following characteristics: pink to violet-red colonies of 0.5 mm or greater in diameters on VRBG agar and gram-negative bacilli or coccobacilli that were oxidase-negative [58]. Pure cultures of presumptive enterobacterial isolates were kept both at 4 °C on Luria-Bertani (LB) slants and at −80 °C in 20% glycerol. The most-probable-number (MPN) indices of coliform bacteria were determined by the standard multiple tube fermentation method as previously described [59].

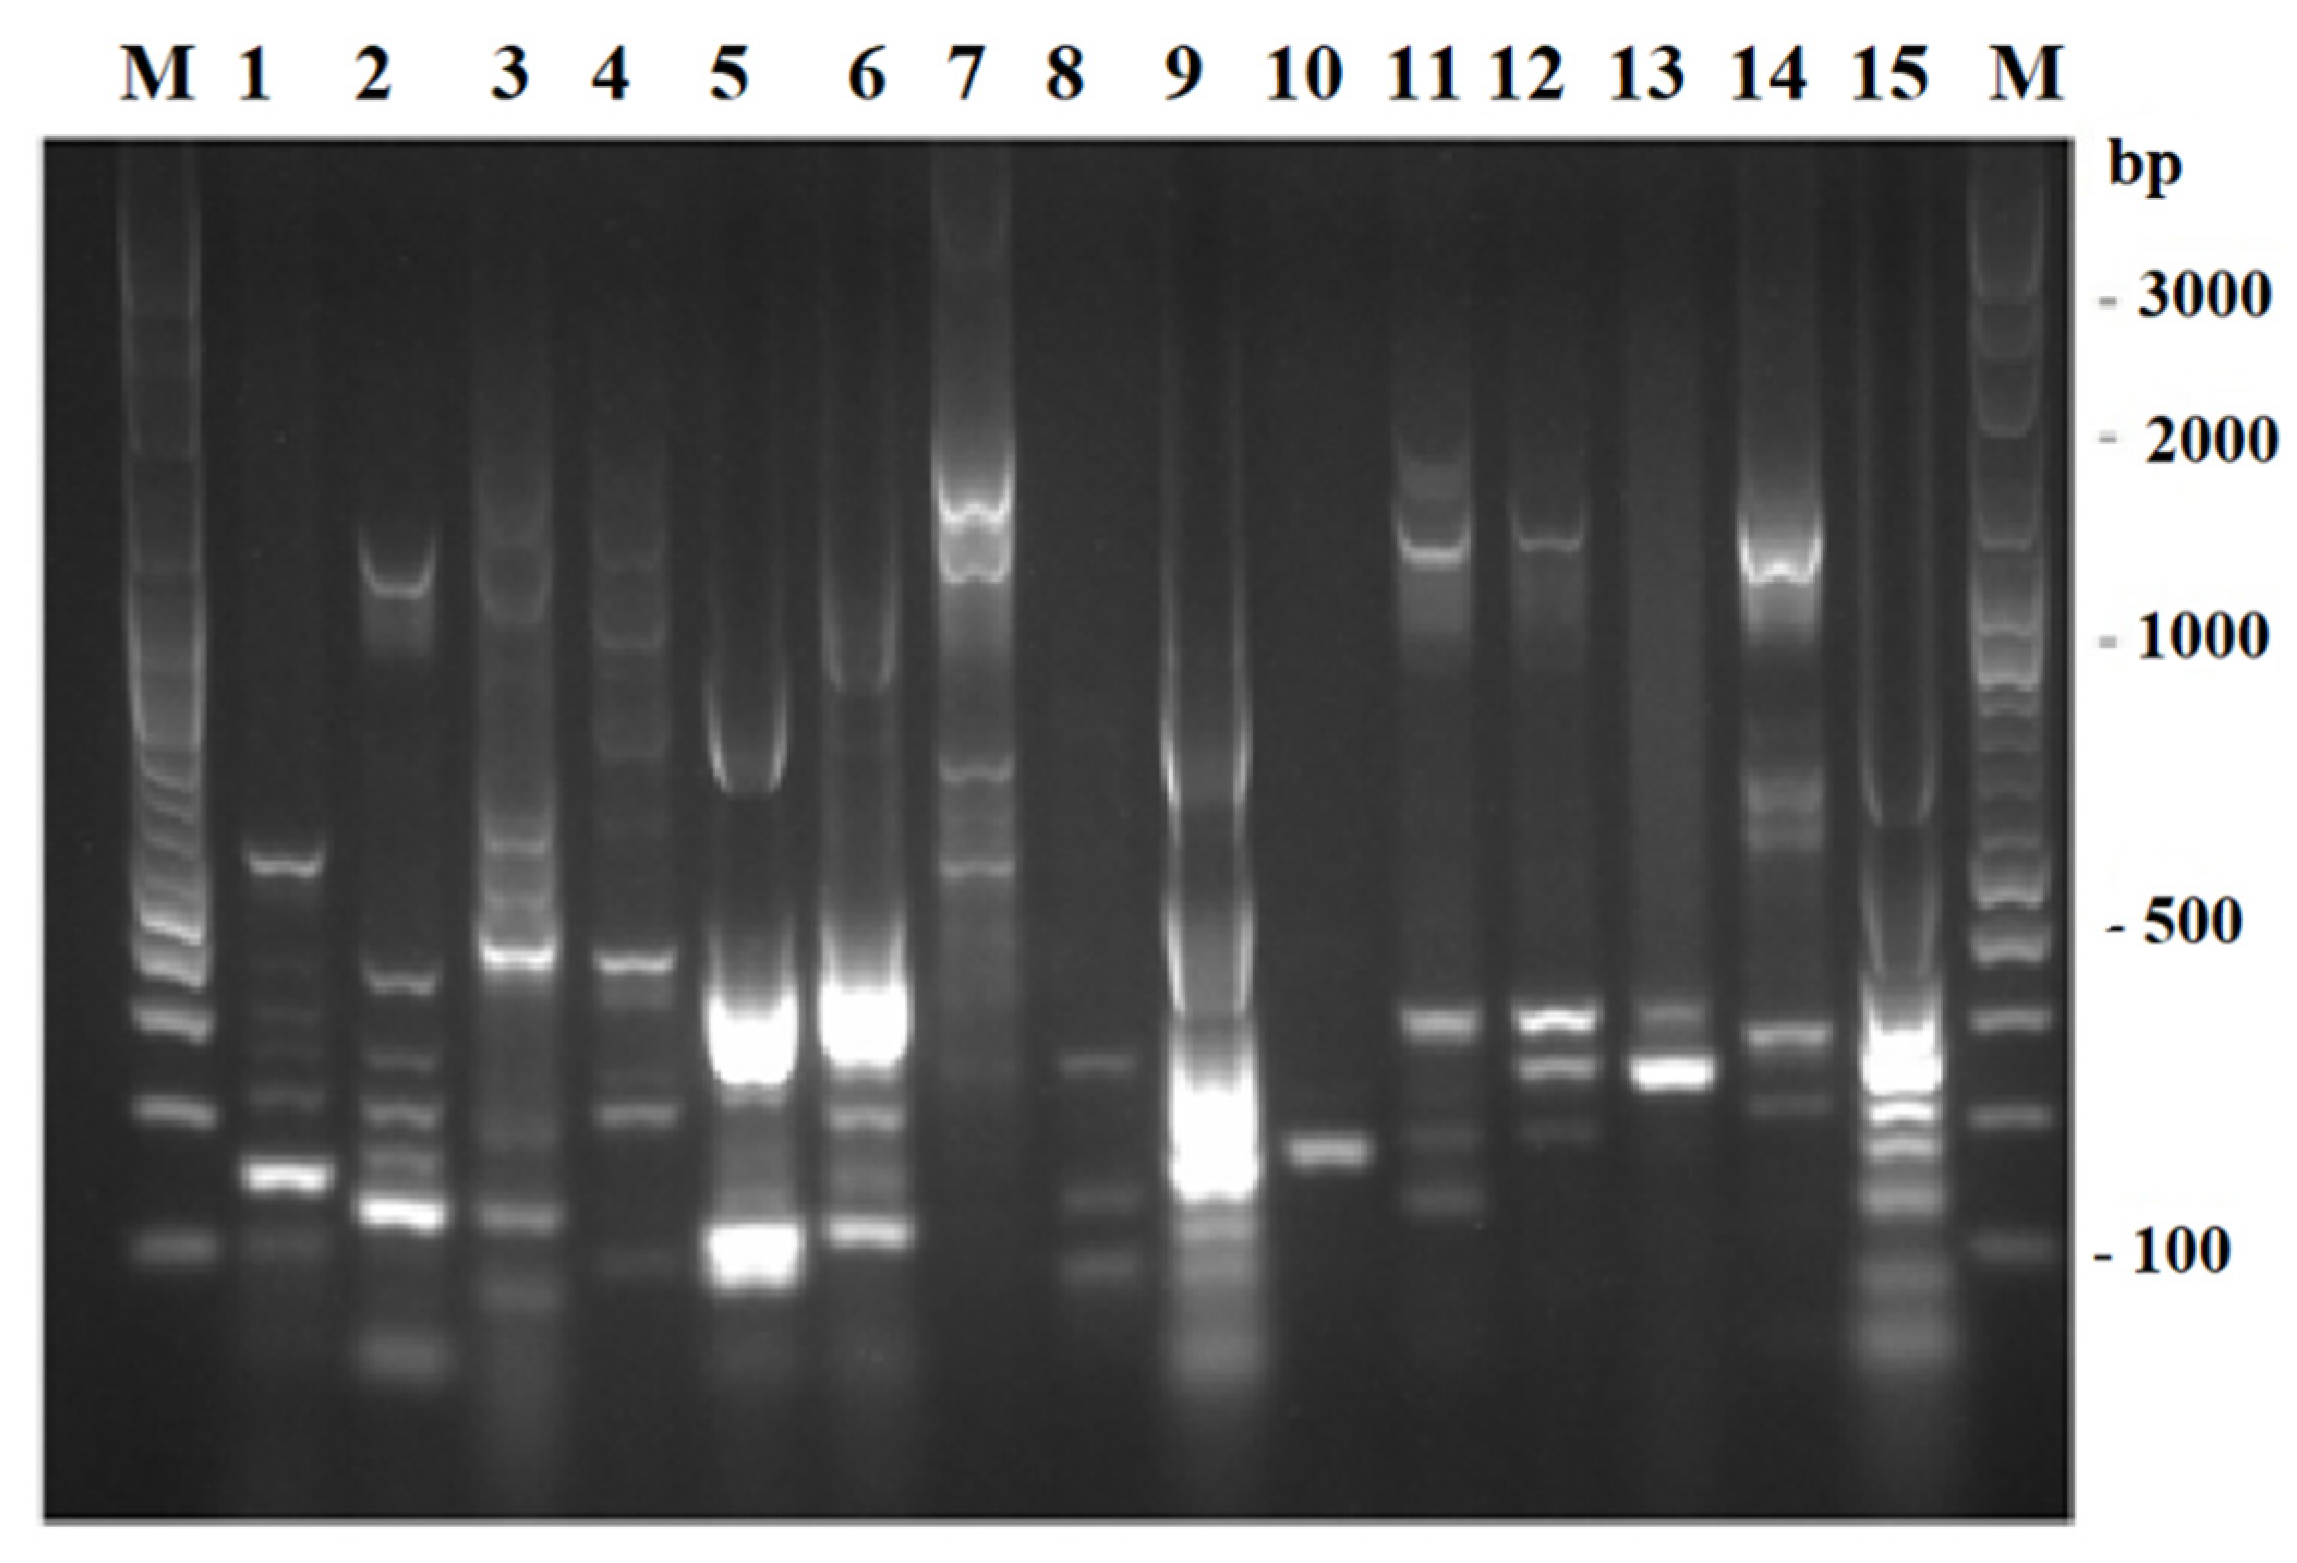
2.2. ERIC-PCR Fingerprinting of Presumptive Enterobacterial Isolates

ERIC-PCR was performed to assess genotypic diversity and to reveal clusters among isolates as well as to differentiate individual strains. ERIC-PCR employed genomic DNA extracted from cell pellets of each isolate as a DNA template, a pair of primers ERIC2 (5′ AAG TAA GTG ACT GGG GTG AGC G 3′) and ERIC1R (5′ ATG TAA GCT CCT GGG GAT TAC C 3′), and a thermal cycling condition consisting of a first denaturation step at 95 °C for 7 min, 30 cycles of denaturation at 95 °C for 1 min, annealing at 52 °C for 1 min, and extension at 65 °C for 8 min, and a final extension step at 65 °C for 16 min [60]. Negative controls (no DNA template) were included in PCR reactions. The amplified fragments were separated by electrophoresis on 1%% agarose gels containing SafeView FireRed gel casting dye (Applied Biological Materials Inc., Richmond, BC, Canada) and visualized with a Molecular Imager® Gel DocTM XR+ system (Bio-Rad Laboratories, Hercules, CA, USA). ERIC-PCR fingerprints and clusters were presented in the unweighted pair groups using mathematical averages (UPGMA) dendrogram created with the Phoretix ID Pro. software (TotalLab Ltd., Newcastle upon Tyne, UK). The isolates generating distinct ERIC-PCR fingerprints were characterized as individual strains and then were subjected to further steps of the study.

2.3. TP-RAPD Fingerprinting of Presumptive Enterobacterial Strains and Species Identification by Using the Vitek® MS System

TP-RAPD was performed to distinguish species among presumptive enterobacterial strains. Genomic DNA of each strain was used as a DNA template in PCR reactions using a pair of primers, 8F (5′ AGA GTT TGA TCC TGG CTC AG 3′) and 1522R (5′ AAG GAG GTG ATC CAN CCR CA 3′) (R = C/T; N = A/G/C/T). PCR cycles consisted of a first denaturation step at 95 °C for 9 min, and then 35 cycles of denaturation at 95 °C for 1 min, annealing at 45 °C for 1 min, and extension at 72 °C for 2 min, followed by a final extension step at 72 °C for 7 min [61]. Negative controls (no DNA template) were included in PCR reactions. The amplified fragments were separated and visualized as described above. A representative strain from each TP-RAPD pattern was subjected to species identification using the Vitek® MS system (bioMerieux, Inc., Durham, NC, USA).

2.4. Examination on Antibiotic Resistance of Enterobacterial Strains

Enterobacterial strains were examined for resistance to 14 antibiotics in 6 categories as previously described [62]. The experiments were performed in triplicate and the interpretation was in accordance with a zone size interpretative chart [63]. The tested antibiotics included (1) ampicillin 10 μg; (2) ticarcillin 75 μg; (3) cefepime 30 μg; (4) cefoxitin 30 μg; (5) ceftriaxone 30 μg; (6) imipenem 10 μg; (7) meropenem 10 μg; (8) ciprofloxacin 5 μg; (9) levofloxacin 5 μg; (10) norfloxacin 10 μg; (11) amikacin 30 μg; (12) gentamicin 10 μg; (13) tobramycin 10 μg; and (14) chloramphenicol 30 μg.

2.5. Detection and Sequence Analysis of Antibiotic Resistance and Virulence Genes in Enterobacterial Strains

Genomic DNA of each enterobacterial strain was used as a DNA template in PCR reactions to detect the presence of ten antibiotic resistance and ten virulence genes as previously described. The antibiotic resistance genes examined were as follows: (1) ampC [64]; (2) blaCMY2 [65]; (3) blaCTX-M [66]; (4) blaKPC [65]; (5) blaNDM [65]; (6) blaSHV [66]; (7) blaTEM [66]; (8) blaVIM [65]; (9) blaZ [67]; and (10) mecA [68]. The virulence genes examined were as follows: (1) cnf2 (for synthesis of cytotoxic necrotizing factor) [69]; (2) csgD (for synthesis of curli) [70]; (3) eaeA (for interaction with host cell) [69]; (4) espB (for interaction with host cell) [71]; (5) kfu (for iron uptake system) [72]; (6) LTI (for synthesis of thermolabile toxin) [69]; (7) magA (for synthesis of capsular polysaccharide) [72]; (8) STII (for synthesis of thermolabile toxin) [69]; (9) uge (for synthesis of lipopolysaccharide) [72]; and (10) vt2e (for synthesis of verotoxin) [69]. Nucleotide sequences of primers and sizes of the PCR products are shown in Table S1. The presence and sizes of the amplified fragments were determined by electrophoresis on 1% agarose gels. The PCR positive bands were eluted from agarose gels using a QIAquick gel extraction kit (Qiagen, Valencia, CA, USA). The nucleotide sequences of purified PCR products were determined by Bio Basic, Inc. (Markham, ON, Canada) and then aligned with reference sequences in order to obtain percentages of sequence identity by using the BLASTn program that is available on the website of the National Center for Biotechnology Information (NCBI) (https://blast.ncbi.nlm.nih.gov/Blast.cgi) (accessed on 28 January 2022).

2.6. Statistical Analysis for Association between Antibiotic Resistance Genes and Virulence Genes

The data analysis was processed with SPSS statistical software version 19.0 (IBM Corp., Chicago, IL, USA). Association of antibiotic resistance genes and virulence genes were analyzed by Pearson’s and Spearman’s correlations. A p-value of ≤0.05 was considered indicative of significance.

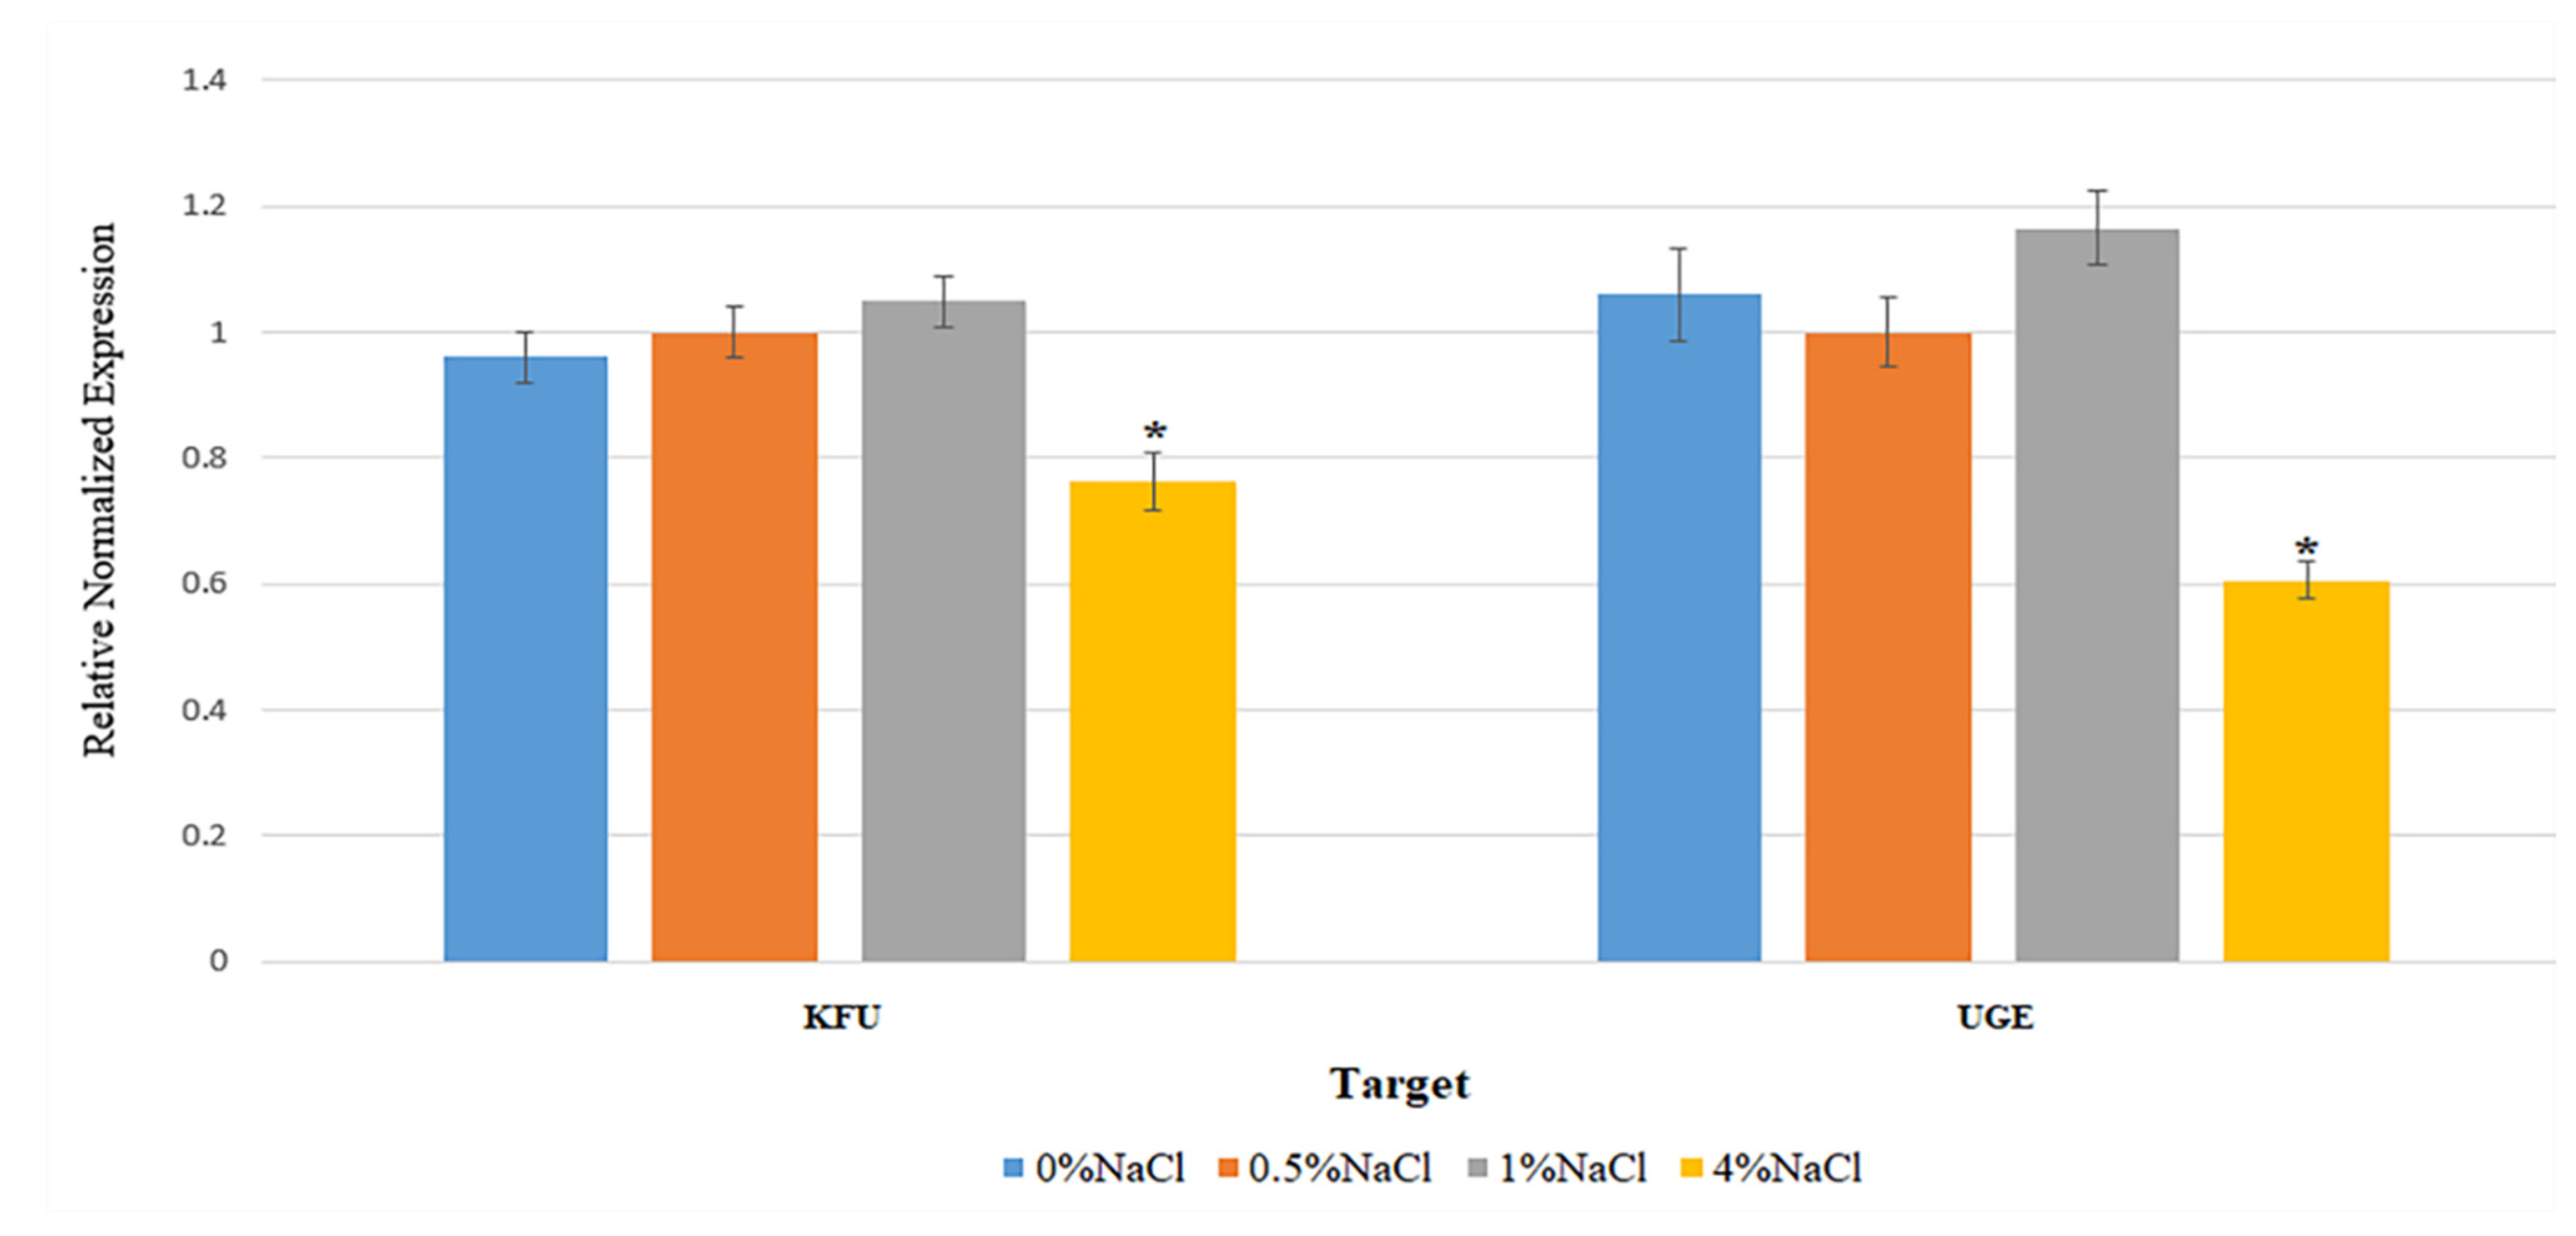
2.7. Examination on Factors Affecting the Expression of Virulence Genes

A representative strain harboring virulence genes was subjected to examination on factors affecting gene expression by qRT-PCR analysis. Specific primers for virulence genes used in qRT-PCR experiments were designed using the Primer-BLAST program of NCBI (https://www.ncbi.nlm.nih.gov/tools/primer-blast/index.cgi?LINK_LOC=Blast Home) (Table 2). The housekeeping gene, recA (recombinase A), was selected because it was the most suitable reference gene for accurate reverse transcription quantitative real-time PCR data normalization in K. pneumoniae [73]. To examine the effect of NaCl concentrations on the expression of virulence genes, a representative strain was cultured in four types of medium including LB without NaCl, LB with 0.5% (wt/vol) NaCl, LB with 1% (wt/vol) NaCl, and LB with 4% (wt/vol) NaCl. Three mL of the cell cultures were centrifuged, and the cell pellets were washed with DNase-free water. Total RNA of the cultures grown under each condition was extracted by using an RNeasy mini kit (Qiagen, Valencia, CA, USA). The RNA concentration and purity were determined photometrically at 260 nm, 280 nm, and 230 nm using a Nanodrop 2000C spectrophotometer (Thermo Scientific, Waltham, MA, USA). RNA bands were examined by agarose (1% in TBE buffer) gel electrophoresis. RNA was diluted to 10 ng/μL in molecular biology grade nuclease and protease-free water (Apsalagen Co., Ltd., Bangkok, Thailand). Complementary DNA (cDNA) was synthesized from 50 ng of RNA using an IScriptTM reverse transcription supermix for RT-qPCR (Bio-Rad Laboratories, Hercules, CA, USA). The real-time PCR was performed with a qPCRBIO SyGreen 1-step detect Lo-Rox (PCR Biosystems Ltd., London, UK) in a CFX ConnectTM real-time PCR detection system (Bio-Rad Laboratories, Hercules, CA, USA). Thermal cycling included 3 min of initial denaturation at 95 °C, denaturation at 95 °C for 10 sec, annealing/extension at 60 °C for 30 sec, and fluorescence acquisition at the end of each extension for 39 cycles. Melting curve measurements were performed after the completion of cycling.

2.8. Examination on Nanoparticle Synthesis by Enterobacterial Strains

The synthesis of silver and gold nanoparticles by enterobacterial strains was investigated. All strains were cultured in LB at 37 °C with shaking at 120 rpm for 40 h. Cultures were centrifuged at 11,000 rpm for 10 min at 4 °C in an Eppendorf 5804R centrifuge (Eppendorf, Selangor Darul Ehsan, Malaysia). Five mL of supernatant was mixed with the solutions of 1 mM AgNO3 (for silver nanoparticles) and 1 mM HAuCl4·3H2O (for gold nanoparticles) and the resulting mixtures were allowed to stand at 55 °C for 48 h in the dark. The color changes from light-yellow to brown and from light-yellow to pink, red, and purple indicated the synthesis of silver and gold nanoparticles, respectively [74,75]. The visible ultraviolet (UV-vis) spectra of silver and gold nanoparticles were determined using a Nanodrop 2000C spectrophotometer (Thermo Scientific, Waltham, MA, USA). The optical densities (ODs) at λmax were measured with a Cecil CE1011 spectrophotometer (Cecil Instruments, Cambridge, UK). The concentrations of silver and gold nanoparticles were evaluated from the standard curves of silver and gold nanoparticles with the same λmax (Sigma-Aldrich, St. Louis, MO, USA), respectively.

3. Results

3.1. Prevalence of Enterobacteria in Seawater along the Upper Gulf of Thailand

Seawater parameters, including temperature, pH, salinity, turbidity, total suspended solid (TSS), total N, total P, and five-day biochemical oxygen demand (BOD5) at nine sampling sites along the shores of the Upper Gulf of Thailand, were reported in our previous study [1]. Seawater from all sites had the same salinity value of 4.0% NaCl, except sites F (aquaculture site at Donhoylhod) and G (aquaculture site at Bangtaboon Bay) that had the salinity values of 3.0% NaCl and 1.0% NaCl, respectively. Seawater from nine sampling sites contained presumptive enterobacteria that ranged from 0.22 ± 0.44 to 17.00 ± 3.97 CFU/mL. Numbers of total coliform bacteria ranged from 4.5 to 3500 MPN index/100 mL. Average number of presumptive enterobacteria and number of total coliform bacteria in each sampling site are shown in Table 3. The 129 presumptive enterobacterial isolates were derived and designated by abbreviations GTH followed by the letters A-I that indicate the sites according to those presented in Table 1 and then followed by the isolate number.

3.2. ERIC-PCR Fingerprinting of Presumptive Enterobacterial Isolates

The 113 distinct ERIC-PCR patterns were generated by the 129 presumptive enterobacterial isolates, suggesting that there were 113 individual strains. These ERIC-PCR patterns were distinguished based on the number and size of the amplified bands that ranged from one to seven and from approximately 100 to 5000 bp, respectively. The UPGMA dendrogram (Figure S1) presents genetic relatedness among strains. The isolates with 100% similarity of ERIC-PCR fingerprints were defined as the same strains. Presumptive enterobacterial strains were selected for subsequent studies.

3.3. Distinguishing Presumptive Enterobacterial Species Based on TP-RAPD Fingerprinting

As depicted in Figure 2, 15 distinct TP-RAPD patterns were generated from 113 presumptive enterobacterial strains, suggesting that these strains belonged to 15 species. The amplified bands ranged in number from one to eight and in size from approximately 100 to 2000 bp.

3.4. Species Identification of Presumptive Enterobacterial Strains Based on the Vitek® MS System

The Vitek® MS system was employed for species identification of 15 representative strains belonging to each TP-RAPD pattern. These strains were identified (with 99.2 to 99.9% confidence values) as being members of 15 species including (1) K. pneumoniae (48 strains out of 113; 42.5%); (2) Escherichia coli (16 strains; 14.2%); (3) Enterobacter cloacae (13 strains; 11.5%); (4) Klebsiella variicola (12 strains; 10.6%); (5) Enterobacter hormaechei (seven strains; 6.2%); (6) Klebsiella aerogenes (four strains; 3.5%); (7) Aeromonas caviae (two strains; 1.8%); (8) Sphingomonas paucimobilis (two strains; 1.8%); (9) Vibrio fluvialis (two strains; 1.8%); (10) Vibrio vulnificus (two strains; 1.8%); (11) Pantoea sp. (one strain; 0.9%); (12) Photobacterium damselae (one strain; 0.9%); (13) Pseudomonas mendocina (one strain; 0.9%); (14) Vibrio alginolyticus (one strain; 0.9%); and (15) Vibrio parahaemolyticus (one strain; 0.9%). Among 113 presumptive enterobacterial strains, 101 strains (89.4%) were enterobacteria in the genera Enterobacter, Escherichia, Klebsiella, and Pantoea.

3.5. Prevalence of Antibiotic Resistance among Enterobacterial Strains

Forty-five antibiotic resistance patterns, as shown in Table S2, were observed among 101 enterobacterial strains. The most common resistance pattern (14.9%) was the ampicillin and ticarcillin co-resistance. Six strains (5.9%) were susceptible to all 14 antibiotics tested. The remaining 95 strains were resistant to at least one antibiotic except imipenem. The resistance to ampicillin, ticarcillin, ciprofloxacin, norfloxacin, cefoxitin, tobramycin, chloramphenicol, cefepime, amikacin, gentamicin, levofloxacin, ceftriaxone, and meropenem was found in 77 (76.2%), 73 (72.3%), 45 (44.6%), 41 (40.6%), 32 (31.7%), 15 (14.9%), 15 (14.9%), 12 (11.9%), 7 (6.9%), 6 (5.9%), 5 (5.0%), 4 (4.0%), and 3 (3.0%) strains, respectively, while none was resistant to imipenem. E. coli GTH-F3 was resistant to most (11) antibiotics including ampicillin, ticarcillin, cefepime, cefoxitin, ceftriaxone, ciprofloxacin, levofloxacin, norfloxacin, amikacin, gentamicin, and tobramycin. Among 64 Klebsiella strains, the resistance to ticarcillin (85.9% of strains), ampicillin (82.8%), ciprofloxacin (53.1%), norfloxacin (50.0%), cefoxitin (18.8%), chloramphenicol (17.2%), cefepime (14.1%), tobramycin (12.5%), amikacin (7.8%), gentamicin (6.3%), ceftriaxone (4.7%), meropenem (4.7%), and levofloxacin (4.7%) was observed. Among 20 Enterobacter strains, the highest percentage of resistant strains was found with cefoxitin (80.0%), followed by ampicillin (75.0%), ticarcillin (40.0%), meropenem (20.0%), norfloxacin (20.0%), cefepime (5.0%), amikacin (5.0%), gentamicin (5.0%), and tobramycin (5.0%). Among 16 E. coli strains, the percentages of resistant strains were as follows: ticarcillin (56.3%), ampicillin (50.0%), ciprofloxacin (37.5%), tobramycin (37.5%), norfloxacin (31.3%), cefoxitin (25.0%), levofloxacin (12.5%), ceftriaxone (6.3%), cefepime (6.3%), amikacin (6.3%), gentamicin (6.3%), and chloramphenicol (6.3%). Pantoea sp. was resistant to ampicillin, ticarcillin, cefepime, and ciprofloxacin.
The 14 antibiotics tested were sorted into six categories including (1) penicillin (ampicillin and ticarcillin); (2) cephalosporin (cefepime, cefoxitin, and ceftriaxone); (3) carbapenem (imipenem and meropenem); (4) monobactam (ciprofloxacin, levofloxacin, and norfloxacin); (5) aminoglycoside (amikacin, gentamicin, and tobramycin); and (6) phenicol (chloramphenicol). Multidrug resistant (MDR) is defined as nonsusceptibility to at least one agent in three or more antimicrobial categories after removing the agent or category which a species has intrinsic resistance [76]. Therefore, 34 strains (33.7%), including K. pneumoniae (16 strains; 15.8%), K. variicola (six strains; 5.9%), E. coli (five strains; 5.0%), E. hormaechei (four strains; 4.0%), K. aerogenes (two strain; 2.0%), and Pantoea sp. (one strain; 1.0%), were classified as MDR.

3.6. Detected Antibiotic Resistance Genes in Enterobacterial Strains

Positive bands with sizes compatible with the presence of three antibiotic resistance genes, including ampC, blaSHV, and blaTEM, were detected by PCR reactions. Sequencing of PCR-amplified fragments from representative strains reinforced the presence of these genes based on 95.61 to 100.00% identities to the reference sequences. The sequences of antibiotic resistance genes were deposited in the NCBI database under GenBank accession numbers OM460077-OM460087. Seven antibiotic resistance gene patterns were observed among 59 enterobacterial strains (58.4% of strains) while the remaining 42 strains provided negative results for the presence of all ten antibiotic resistance genes. The number of positive strains in each genus or species that possessed antibiotic gene is shown in Table 4. Antibiotic resistance gene patterns included (1) ampC (28 strains; 27.7%); (2) blaSHV (six strains; 5.9%); (3) blaTEM (three strains; 3.0%); (4) ampC blaSHV (13 strains; 12.9%); (5) ampC blaTEM (six strains; 5.9%); (6) blaSHV blaTEM (two strains; 2.0%); and (7) ampC blaSHV blaTEM (one strain; 1.0%). The frequency of the ampC gene was highest (48 strains; 47.5%), followed by the blaSHV gene (22 strains; 21.8%), and the blaTEM gene (12 strains; 11.9%), respectively. These genes encode β-lactamases that confer resistance to the β-lactam group of antibiotics such as ampicillin and ticarcillin. The co-occurrence of three β-lactamase genes, including ampC, blaSHV, and blaTEM in a single strain, was noticed in K. pneumoniae GTH-A4.

3.7. Detected Virulence Genes in Enterobacterial Strains

Positive bands with sizes compatible with the presence of six virulence genes, including csgD, eaeA, kfu, LTI, magA, and uge, were detected by PCR reactions. Sequencing of PCR-amplified fragments from representative strains reinforced the presence of these genes based on 95.83 to 100.00% identities to the reference sequences. The sequences of virulence genes were deposited in the NCBI database under GenBank accession numbers OM460088-OM460096. A total of 17 virulence gene patterns were observed among 74 enterobacterial strains (73.3%) while the remaining 27 strains provided negative results for the presence of all ten virulence genes. The number of positive strains in each genus or species that possessed virulence gene is shown in Table 5. The 17 virulence gene patterns included (1) csgD (22 strains; 21.8%); (2) eaeA (three strains; 3.0%); (3) LTI (two strains; 2.0%); (4) uge (seven strains; 6.9%); (5) csgD eaeA (11 strains; 10.9%); (6) csgD uge (five strains; 5.0%); (7) eaeA uge (one strain; 1.0%); (8) kfu LTI (two strains; 2.0%); (9) kfu magA (one strain; 1.0%); (10) kfu uge (four strains; 4.0%); (11) LTI uge (two strains; 2.0%); (12) magA uge (one strain; 1.0%); (13) csgD kfu magA (one strain; 1.0%); (14) csgD kfu uge (one strain; 1.0%); (15) eaeA kfu uge (one strain; 1.0%); (16) kfu magA uge (nine strains; 8.9%); and (17) eaeA kfu magA uge (one strain; 1.0%). The frequency of the csgD gene was highest (37.6%), followed by the uge gene (31.7%), the kfu gene (19.8%), the eaeA gene (16.8%), the magA gene (12.9%), and the LTI gene (5.9%), respectively.

3.8. Association of Antibiotic Resistance Genes and Virulence Genes

Association of antibiotic resistance genes (ampC, blaSHV, and blaTEM) and virulence genes (csgD, eaeA, kfu, LTI, magA, and uge) were analyzed. The statistical analysis revealed positive and negative correlations between the two groups of genes (Table 6). The ampC gene exhibited significantly positive correlations with the uge and magA genes, whereas it exhibited a significantly negative correlation with the csgD gene. The blaSHV gene had the most significant positive association with the uge gene but negative association with the csgD gene. However, the blaTEM gene had the most significant positive association with the eaeA gene only. The LTI gene was the only one that exhibited a positive correlation with all antibiotic resistance genes.
The strain K. pneumoniae GTH-A21 was selected to quantify the expression of two virulence genes, kfu and uge, under different NaCl concentrations (0%, 0.5%, 1%, and 4% wt/vol) by qRT-PCR. The reference gene, recA, was selected as being the most suitable reference gene for accurate qRT-PCR data normalization in K. pneumoniae [73]. Transcription levels determined under each condition were normalized to the internal reference gene recA. The relative gene expression levels (merged from three experiments) of both virulence genes, kfu and uge, of K. pneumoniae GTH-A21 under different NaCl concentrations are shown in Figure 3. The condition of 4% NaCl suppressed the expression of both kfu and uge genes. Gene expression levels under the conditions of 0% and 0.5% NaCl were not significantly different for both kfu and uge genes. Gene expression levels under the conditions of 0% and 1% NaCl were significantly different for only the kfu gene, whereas gene expression levels under the conditions of 0.5% and 1% NaCl were significantly different for only the uge gene. This study demonstrates the impact of NaCl concentration, an important physicochemical characteristic of seawater, on the expression of virulence genes in the marine bacterium, K. pneumoniae. The condition of 4% NaCl was detected in all three mangrove forests, all three tourist sites, and one aquaculture site, suggesting that marine habitats may provide the possibility to reduce pathogenicity or virulence caused by enterobacteria.

3.9. Synthesis of Silver and Gold Nanoparticles by Enterobacterial Strains

The 101 enterobacterial strains were examined for their ability to synthesize silver and gold nanoparticles. When the supernatant was incubated with 1 mM AgNO3 solution, the synthesis of silver nanoparticles was monitored visually by the change in color of the reaction solution from light-yellow to brown [74]. When the supernatant was incubated with 1 mM AuHCl4·3H2O solution, the synthesis of gold nanoparticles was monitored visually by the change in color of the reaction solution from light-yellow to red to purple-blue [75]. The λmax of silver and gold nanoparticles were 420 and 550 nm, respectively. Concentrations of synthesized silver and gold nanoparticles were calculated from standard curves constructed by using standard silver nanoparticles with λmax of 420 nm and standard gold nanoparticles with λmax of 550 nm (Sigma-Aldrich, St. Louis, MO, USA). Sixty-eight silver nanoparticle-synthesizing strains (67.3%) belonged to six species including K. pneumoniae (31 strains), E. coli (11 strains), E. cloacae (nine strains), K. variicola (eight strains), E. hormaechei (six strains), and K. aerogenes (three strains). These strains synthesized silver nanoparticles in a range of concentrations 3.04 ± 0.64 to 20.64 ± 0.95 μg/mL. Sixty-four gold nanoparticle-synthesizing strains (63.4%) belonged to seven species including K. pneumoniae (25 strains), E. cloacae (12 strains), E. coli (11 strains), K. variicola (eight strains), E. hormaechei (four strains), K. aerogenes (three strains), and Pantoea sp. (one strain). These strains synthesized gold nanoparticles in a range of concentrations 7.77 ± 0.45 to 57.57 ± 8.00 μg/mL. E. coli GTH-E1 and K. variicola GTH-A23 synthesized the highest amounts of silver and gold nanoparticles, respectively.

4. Discussion

Seawater has been found to be a reservoir of enterobacteria. For examples, Enterobacteriaceae were always detected in North Tyrrhenian Sea, Italy, during a 2-year period. Moreover, in 13 months, they were the major taxons with relative abundance in the range 2.5–18.1% [9]. New Delhi metallo-β-lactamase (NDM)-producing K. pneumoniae and carbapenemase-producing Enterobacteriaceae (CPE) were detected in seawater samples in Ireland [11,12]. Enterobacteriaceae accounted for 48% of 285 isolates of gram-negative bacilli from seawater in Brazil [13] and 46% of 377 isolates from seawater in Palestine [14]. The average numbers of enterobacteria and total coliforms in seawater from nine sites along the Upper Gulf of Thailand was 5.71 CFU/mL and 924.87 MPN/100 mL, respectively. In comparison, the average number of total coliforms in seawater from eight stations along the Persian Gulf was 1238.13 MPN/100 mL [77].
The presumptive enterobacterial strains were distinguished by ERIC-PCR which has been found to be extremely sensitive and can detect minor differences among strains of the same bacterial genus and species [29]. The UPGMA dendrogram (Figure S1) constructed from ERIC-PCR fingerprints presents a high level of diversity among 113 strains as showing 20% similarity. As further determined by TP-RAPD, 15 different species were distinguished. TP-RAPD was developed for taxonomy purpose as the patterns of strains in the same species are identical [78]. These 15 species were then identified and seven enterobacterial species were revealed based on the Vitek® MS system which was reported as a simple, convenient, and accurate method for routine bacterial identification [79]. The Vitek® MS system also provided correct identification for 99.1% of 2246 bacterial isolates [80] and 84.2% of 95 bacterial isolates [81].
In this study, 101 enterobacterial strains exhibited 45 antibiotic resistance patterns, indicating a high diversity of resistance. Only 5.9% of the strains were susceptible to all antibiotic tested while 94.1% were resistant to at least one but up to 11 of 14 antibiotics. The ampicillin and ticarcillin co-resistance was the pattern mostly found (14.9% of strains) and 33.7% were MDR. The prevalence of MDR enterobacteria in marine environment was previously reported. Approximately 35% of 1351 enterobacterial isolates from seawater samples in the eastern Adriatic Sea in Croatia were MDR [82]. Enterobacteria have a special ability to obtain multidrug resistance in a single step by acquiring several resistance genes from various bacterial species and integrating those genes into the same plasmids [20]. Multidrug resistance of enterobacteria is a challenge facing the global public health agenda.
The majority of strains (83.2%) were resistant to either or both ampicillin and ticarcillin, all of which are categorized in the penicillin group. As the major mechanism of resistance against β-lactam antibiotics (such as ampicillin and ticarcillin) in gram-negative bacteria is the synthesis of β-lactamases, which irreversibly cleave the β-lactam ring of antibiotics [83], the presence of ten β-lactamase genes was subsequently studied. The three β-lactamase genes, including ampC, blaSHV, and blaTEM, were detected. The 59 enterobacterial strains (58.4%) exhibited seven antibiotic resistance gene patterns while the remaining 42 strains yielded negative results for the presence of all ten β-lactamase genes. These three antibiotic genes were the same as those detected in 81 enterobacterial strains isolated from seafood in Thailand in which the blaTEM, ampC, and blaSHV genes were detected at the frequencies of 43%, 27%, and 24%, respectively [84].
The six virulence genes, including csgD, eaeA, kfu, LTI, magA, and uge, were detected and 17 virulence gene patterns were observed among 74 enterobacterial strains (73.3% of strains) while the remaining 27 strains provided negative results for the presence of all ten virulence genes. K. pneumoniae GTH-A6 harbored the most virulence genes including eaeA, kfu, magA, and uge. The possession of virulence genes offers a suitable approach to risk evaluation of the pathogenic potential of bacteria. Previous studies described the roles of six virulence genes detected in this study in disease progression. The csgD gene that encodes the synthesis of curli was reported to have a great impact on the natural phenotype of Salmonella such as the rdar morphotype that is beneficial to the passage through the intestinal epithelial cells [85]. The iron uptake system coding gene kfu, and lipopolysaccharide-synthesizing gene uge, were reported to be important for the invasion of mastitis-causing K. pneumoniae strains [86]. The thermolabile toxin-coding gene, LTI was reported as a particular gene that controlled the virulence of diarrhea-causing enterotoxigenic E. coli (ETEC) [87]. The eaeA gene encoding intimin that adheres to intestinal mucosa and causes intestinal lesion formation [88] was found to be associated with the severity of human disease, especially hemolytic uremic syndrome (HUS) [89]. Possession of the eaeA gene was common in Shiga toxin-producing E. coli (STEC) serotypes that are commonly implicated in severe human disease and outbreaks including STEC O157:H7, STEC O145:H28, and STEC O103:H2 [90]. The magA gene that encodes the synthesis of capsular polysaccharide is an essential virulence gene for K. pneumoniae strains. It was detected in a vast majority of K. pneumoniae liver abscess isolates and associated with resistance to killing by human serum and phagocytosis [91]. A previous study [92] demonstrated the association between the magA gene and endophthalmitis.
The antibiotic resistance genes and virulence genes displayed either positive or negative correlations. The uge gene was significantly more prevalent with the ampC and blaSHV genes. On the contrary, the csgD gene exhibited a significantly higher negative correlation with the ampC and blaSHV genes. The eaeA was the only virulence gene that was found to be positively significant with the blaTEM gene. Significant association of virulence genes with either antibiotic/antimicrobial resistance or antibiotic resistance gene was previously reported. The hlyA was the only virulence gene that was significantly more prevalent in the highly antibiotic resistant E. coli isolates. Three virulence genes, including ompA, malX, and hlyA, were obviously more abundant in the antibiotic resistant E. coli isolates in comparison with susceptible isolates. The papC gene was associated with amoxicillin resistance of E. coli [93]. Significant association was observed between the iucC gene and resistance to ampicillin and amoxicillin and between the fimH gene and resistance to aztreonam in Pakistani uropathogenic E. coli isolates [94]. Significant strong positive association between the colM gene for colicin resistance and the virulence genes, including colE1, colB, traT, and csgA, was observed among pathogenic E. coli isolated from Egyptian patients [95]. Significant association between antibiotic resistance and virulence genes was found only in Salmonella isolates which were resistant to more than five antibiotics and the associated virulence genes included sefA, sodC1, sopE1, spvC, pefA, and one integron-associated integrase class 1 gene [96].
This study examined the effect of NaCl concentrations on the expression of virulence genes (kfu and uge) by using qRT-PCR. The kfu gene has a role in iron acquisition. It is essential for transporting Fe3+ into cytoplasm [97]. Its contribution to capsule formation, hypermucoviscosity, purulent tissue infection, and intestinal colonization was suggested [98]. The uge gene has a role in capsule synthesis, resistance of phagocytosis, liver abscess, and blood infection [99]. For both kfu and uge genes, the condition of 4% NaCl suppressed the expression and the conditions of 0% and 0.5% NaCl did not differently affect the expression. The qRT-PCR has become one of the most used techniques for gene expression analysis because of its advantages of high specificity and sensitivity [100]. Even though quantification of gene expression depends on several factors such as quality of RNA, efficiency of primers, and synthesis and quantity of amplified cDNA template, the expression level of the target gene can be normalized against stably expressed internal genes to compensate for variations [101]. The bacterial pathogen senses and adapts to the prevailing conditions by modulating its gene expression [102]. The effects of NaCl concentrations on the expression of the other virulence genes were previously reported. The NaCl concentrations (<0.15% and 3.6% wt/wt) affected the expression of virulence-related genes in Listeria monocytogenes. The low NaCl concentration decreased the expression of the agrA, ami, gadC, and opuC genes, which are associated with osmotic stress responses, in both strains that exhibited different tolerances to salt stress [33]. The NaCl concentrations in LB medium differently affected the expression of virulence genes in a strain of Salmonella enterica. The condition of 1 M NaCl triggered significant overexpression of the sopA gene encoding E3 ubiquitin ligase, compared with that of 0 M, 0.3 M, and 0.6 M NaCl, whereas the higher NaCl concentrations (0.3 M, 0.6 M, and 1 M) significantly downregulated the expression of the hilA gene, a promotor of the Salmonella pathogenicity island [103].
The λmax of silver and gold nanoparticles synthesized by enterobacterial strains were 420 and 550 nm, respectively. The λmax of silver and gold nanoparticles were reported to be in a range of 307 to 448 nm and 400 to 700 nm, respectively, depending on size and shape [51]. The UV-vis spectroscopy is a very useful and reliable technique for the primary characterization of synthesized nanoparticles. This technique is fast, easy, simple, sensitive, selective for different types of nanoparticles, and needs only a short period for measurement [104]. The synthesis of silver and gold nanoparticles was observed with 67.3% and 63.4% of strains. Among silver and gold nanoparticle-synthesizing bacteria, enterobacteria offer several advantages including rapid, nonpolluted and nontoxic reaction, cost-effectiveness, easy purification of nanoparticles in supernatant, and size of nanoparticles. The antibacterial, antifungal, antiviral, anti-inflammatory, anti-cancer, and anti-angiogenic properties of silver nanoparticles were verified. Silver nanoparticles have been used extensively in various application perspectives such as biomedical, food, industrial, and environmental sciences [104]. Gold nanoparticles exhibit valuable properties such as surface plasmon resonance (SPR), wide surface chemistry, high binding affinity, good biocompatibility, enhanced solubility, and tunable functionalities for targeted delivery. Therefore, they can be applied to a wide range of applications including medicine, material science, biology, chemistry, and physics [105]. The enterobacterial strains examined in this study might be promising for such application in the nanotechnology.
In the present study, enterobacterial isolates of tropical marine environment were characterized, identified, and screened for the virulence-related characteristics: antibiotic resistance, presence of antibiotic resistance and virulence genes, and expression of virulence genes. The majority were resistant to ampicillin (76.2%) and ticarcillin (72.3%) which are categorized in the penicillin group. Notably, carbapenem-resistant Enterobacteriaceae (CRE) which are a major cause of concern in public health were also detected at the lowest prevalence as 3% of strains were resistant to meropenem. High proportion of strains (33.7%) were MDR and one strain (K. aerogenes GTH-G17) was resistant to at least one antibiotic in all six categories including penicillin, cephalosporin, carbapenem, monobactam, aminoglycoside, and phenicol. A total of 58.4% and 73.3% of strains harbored at least one antibiotic resistance and virulence gene, respectively. All three detected antibiotic resistance genes (ampC, blaSHV, and blaTEM) are plasmid-mediated β-lactamase genes that emerged in gram-negative bacteria. The blaSHV and blaTEM genes that encode extended-spectrum β-lactamases (ESBLs) confer resistance to a variety of antibiotics including those in penicillin, cephalosporin, and monobactam groups, causing difficulties in treatment and infection control [106]. The occurrence of CRE and MDR strains as well as possession of ESBL and virulence genes determine public health risks and might draw more attention to public health surveillance.

Supplementary Materials

The following supporting information can be downloaded at: https://www.mdpi.com/article/10.3390/microorganisms10030511/s1, Figure S1: Dendrogram constructed from ERIC-PCR patterns of the 129 presumptive enterobacterial isolates.; Table S1: Nucleotide sequences of primers and sizes of the PCR products for the examined antibiotic resistance and virulence genes.; Table S2: Antibiotic resistance patterns of enterobacterial strains and numbers of strain(s) belonging to each pattern.

Author Contributions

P.N. and N.P. contributed equally to this article. N.P. conceived and designed this study. P.N. and N.P. performed the experiments, analyzed the data and wrote the manuscript. All authors have read and agreed to the published version of the manuscript.

Funding

This study was financially supported by the Thailand Research Fund (TRF) under grant contract no. DBG6180026.

Institutional Review Board Statement

Not applicable.

Data Availability Statement

All data generated or analyzed during this study have been included in this published article. Sequence data have been deposited in the NCBI database under accession numbers OM460077-OM460096.

Conflicts of Interest

The authors declare no conflict of interest. The funders had no role in the de-sign of the study; in the collection, analyses, or interpretation of data; in the writing of the manuscript, or in the decision to publish the results.

References

  1. Nimnoi, P.; Pongsilp, N. Marine bacterial communities in the upper gulf of Thailand assessed by Illumina next-generation sequencing platform. BMC Microbiol. 2020, 20, 19. [Google Scholar] [CrossRef] [PubMed] [Green Version]
  2. Adeolu, M.; Alnajar, S.; Naushad, S.; Gupta, R. Genome-based phylogeny and taxonomy of the ‘Enterobacteriales: Proposal for Enterobacterales ord. nov. divided into the families Enterobacteriaceae, Erwiniaceae fam. nov., Pectobacteriaceae fam. nov., Yersiniaceae fam. nov., Hafniaceae fam. nov., Morganellaceae fam. nov., and Budviciaceae fam. nov. Int. J. Syst. Evol. Microbiol. 2016, 66, 5575–5599. [Google Scholar] [PubMed]
  3. Morales-López, S.; Yepes, J.A.; Prada-Herrera, J.C.; Torres-Jiménez, A. Enterobacteria in the 21st century: A review focused on taxonomic changes. J. Infect. Dev. Ctries 2019, 13, 265–273. [Google Scholar] [CrossRef]
  4. Baldelli, V.; Scaldaferri, F.; Putignani, L.; Del Chierico, F. The role of Enterobacteriaceae in gut microbiota dysbiosis in inflammatory bowel diseases. Microorganisms 2021, 9, 697. [Google Scholar] [CrossRef]
  5. Biran, D.; Ron, E.Z. Extraintestinal pathogenic Escherichia coli. Curr. Top. Microbiol. Immunol. 2018, 416, 149–161. [Google Scholar] [PubMed]
  6. Sarkar, S.; Kimono, D.; Albadrani, M.; Seth, R.K.; Busbee, P.; Alghetaa, H.; Porter, D.E.; Scott, G.I.; Brooks, B.; Nagarkatti, M.; et al. Environmental microcystin targets the microbiome and increases the risk of intestinal inflammatory pathology via NOX2 in underlying murine model of nonalcoholic fatty liver disease. Sci. Rep. 2019, 9, 8742. [Google Scholar] [CrossRef] [PubMed] [Green Version]
  7. Zimmermann, P.; Messina, N.; Mohn, W.W.; Finlay, B.B.; Curtis, N. Association between the intestinal microbiota and allergic sensitization, eczema, and asthma: A systematic review. J. Allergy Clin. Immunol. 2019, 143, 467–485. [Google Scholar] [CrossRef]
  8. Wen, X.; Cgen, F.; Lin, Y.; Zhu, H.; Yuan, F.; Kuang, D.; Jia, Z.; Yuan, Z. Microbial indicators and their use for monitoring drinking water quality: A review. Sustainability 2020, 12, 2249. [Google Scholar] [CrossRef] [Green Version]
  9. Gorrasi, S.; Pasqualetti, M.; Franzetti, A.; Gonzalez-Martinez, A.; Gonzalez-Lopez, J.; Munoz-Palazon, B.; Fenice, M. Persistence of Enterobacteriaceae drawn into a marine saltern (Saline di Tarquinia, Italy) from the adjacent coastal zone. Water 2021, 13, 1443. [Google Scholar] [CrossRef]
  10. Cohen, R.; Paikin, S.; Astrahan, P. 1619 carbapenemase producing Enterobacteriaceae in river estuaries and coastal water of Netanya, Israel. Open Forum Infect. Dis. 2019, 6, S590–S591. [Google Scholar] [CrossRef]
  11. Mahon, B.M.; Brehony, C.; Cahill, N.; McGrath, E.; O’Conor, L.; Varley, A.; Cormican, M.; Ryan, S.; Hickey, P.; Keane, S.; et al. Detection of OXA-48-like-producing Enterobacterales in Irish recreational water. Sci. Total Environ. 2019, 690, 1–6. [Google Scholar] [CrossRef]
  12. Mahon, B.M.; Brehony, C.; McGrath, E.; Killeen, J.; Cormican, M.; Hickey, P.; Keane, S.; Hanahoe, B.; Dolan, A.; Morris, D. Indistinguishable NDM-producing Escherichia coli isolated from recreational waters, sewage, and a clinical specimen in Ireland, 2016 to 2017. Euro. Surveill. 2017, 22, 30513. [Google Scholar] [CrossRef] [Green Version]
  13. Paschoal, R.P.; Campana, E.H.; Corrêa, L.L.; Montezzi, L.F.; Barrueto, L.R.L.; da Silva, I.R.; Bonelli, R.R.; Castro, L.S.; Picao, R.C. Concentration and variety of carbapenemase producers in recreational coastal waters showing distinct levels of pollution. Antimicrob. Agents Chemother. 2017, 61, e01963-17. [Google Scholar] [CrossRef] [Green Version]
  14. Abdelraouf, A.E.; Philippe, H.; Kamal, J.E.; Adnan, A.; Samir, A.; Fatma, E.; Alaa, R.A. Antimicrobial resistance of Staphylococcus aureus, fecal streptococci, Enterobacteriaceae and Pseudomonas aeruginosa isolated from the coastal water of the Gaza strip-Palestine. Int. Arab. J. Antimicrob. Agents. 2016, 6, 3. [Google Scholar] [CrossRef]
  15. Farkas, A.; Tarco, E.; Butiuc-Keul, A. Antibiotic resistance profiling of pathogenic Enterobacteriaceae from Cluj-Napoca, Romania. Germs 2019, 9, 17–27. [Google Scholar] [CrossRef]
  16. Santos, A.L.; Dos Santos, A.P.; Ito, C.R.M.; Queiroz, P.H.P.; de Almeida, J.A.; de Carvalho Júnior, M.A.B.; de Oliveira, C.Z.; Avelino, M.A.G.; Wastowski, I.J.; Gomes, G.P.L.A.; et al. Profile of enterobacteria resistant to beta-lactams. Antibiotics 2020, 9, 410. [Google Scholar] [CrossRef] [PubMed]
  17. Alves, M.S.; Pereira, A.; Araujo, S.M.; Castro, B.B.; Correia, A.C.M.; Henriques, I. Seawater is a reservoir of multi-resistant Escherichia coli, including strains hosting plasmid-mediated quinolones resistance and extended-spectrum beta-lactamases genes. Front. Microbiol. 2014, 5, 426. [Google Scholar] [CrossRef] [PubMed]
  18. Cohen, R.; Paikin, S.; Rokney, A.; Rubin-Blum, M.; Astrahan, P. Multidrug-resistant enterobacteriaceae in coastal water: An emerging threat. Antimicrob. Resist. Infect. Control 2020, 9, 169. [Google Scholar] [CrossRef] [PubMed]
  19. Maloo, A.; Borade, S.; Dhawde, R.; Gajbhiye, S.N.; Dastager, S.G. Occurrence and distribution of multiple antibiotic-resistantbacteria of Enterobacteriaceae family in waters of Veraval coast, India. Environ. Exp. Bot. 2014, 12, 43–50. [Google Scholar]
  20. Partridge, S.R. Resistance mechanisms in Enterobacteriaceae. Pathology 2015, 47, 270–284. [Google Scholar] [CrossRef]
  21. Nappier, S.P.; Liguori, K.; Ichida, A.M.; Stewart, J.R.; Jones, K.R. Antibiotic resistance in recreational waters: State of the science. Int. J. Environ. Res. Pub. Health 2020, 17, 8034. [Google Scholar] [CrossRef]
  22. Gupta, M.; Naik, A.K.; Singh, S.K. Bacteriological profile and antimicrobial resistance patterns of burn wound infections in a tertiary care hospital. Heliyon 2019, 5, e02956. [Google Scholar] [CrossRef] [PubMed] [Green Version]
  23. Duan, Y.; Gao, H.; Zheng, L.; Liu, S.; Cao, Y.; Zhu, S.; Wu, Z.; Ren, H.; Mao, D.; Luo, Y. Antibiotic resistance and virulence of extraintestinal pathogenic Escherichia coli (ExPEC) vary according to molecular types. Front. Microbiol. 2020, 11, 598305. [Google Scholar] [CrossRef] [PubMed]
  24. Duvallet, C.; Gibbons, S.M.; Gurry, T.; Irizarry, R.A.; Alm, E.J. Meta-analysis of gut microbiome studies identifies disease-specific and shared responses. Nat. Commun. 2017, 8, 1784. [Google Scholar] [CrossRef] [PubMed] [Green Version]
  25. Alizon, S.; de Roode, J.C.; Michalakis, Y. Multiple infections and the evolution of virulence. Ecol. Lett. 2013, 16, 556–567. [Google Scholar] [CrossRef] [PubMed] [Green Version]
  26. Sarowska, J.; Futoma-Koloch, B.; Jama-Kmiecik, A.; Frej-Madrzak, M.; Ksiazczyk, M.; Bugla-PLoSkonska, G.; Choroszy-Krol, I. Virulence factors, prevalence and potential transmission of extraintestinal pathogenic Escherichia coli isolated from different sources: Recent reports. Gut Pathog. 2019, 11, 10. [Google Scholar] [CrossRef] [Green Version]
  27. Wassenaar, T.M.; Gaastra, W. Bacterial virulence: Can we draw the line? FEMS Microbiol. Lett. 2001, 201, 1–7. [Google Scholar] [CrossRef] [PubMed] [Green Version]
  28. Chandra, K.; Garai, P.; Chatterjee, J.; Chakravortty, D. Peptide transporter YjiY influences the expression of the virulence gene mgtC to regulate biofilm formation in Salmonella. FEMS Microbiol. Lett. 2017, 364. [Google Scholar] [CrossRef]
  29. Nimnoi, P.; Pongsilp, N. Distribution and expression of virulence genes in potentially pathogenic bacteria isolated from seafood in Thailand. CyTA J. Food. 2020, 18, 753–763. [Google Scholar] [CrossRef]
  30. Paytubi, S.; Cansado, C.; Madrid, C.; Balsalobre, C. Nutrient composition promotes switching between pellicle and bottom biofilm in Salmonella. Front. Microbiol. 2017, 8, 2160. [Google Scholar] [CrossRef]
  31. Gerstel, U.; Romling, U. Oxygen tension and nutrient starvation are major signals that regulate agfD promoter activity and expression of the multicellular morphotype in Salmonella typhimurium. Environ. Microbiol. 2001, 3, 638–648. [Google Scholar] [CrossRef] [PubMed]
  32. Jubelin, G.; Vianney, A.; Beloin, C.; Ghigo, J.M.; Lazzaroni, J.C.; Lejeune, P.; Dorel, C. CpxR/OmpR interplay regulates curli gene expression in response to osmolarity in Escherichia coli. J. Bacteriol. 2005, 187, 2038–2049. [Google Scholar] [CrossRef] [PubMed] [Green Version]
  33. Larsen, N.; Jespersen, L. Expression of virulence-related genes in Listeria monocytogenes grown on Danish hard cheese as affected by NaCl content. Foodborne Pathog. Dis. 2015, 12, 536–544. [Google Scholar] [CrossRef]
  34. Prignent-Combaret, C.; Brombacher, E.; Vidal, O.; Ambert, A.; Lejeune, P.; Landini, P.; Dorel, C. Complex regulatory network controls initial adhesion and biofilm formation in Escherichia coli via regulation of the csgD gene. J. Bacteriol. 2001, 183, 7213–7223. [Google Scholar] [CrossRef] [Green Version]
  35. Valdes, K.M.; Sundar, G.S.; Belew, A.T.; Islam, E.; El-Sayed, N.M.; Breton, Y.L.; Mclver, K.S. Glucose levels alter the Mga virulence regulon in the group A. Streptococcus. Sci. Rep. 2018, 8, 4971. [Google Scholar] [CrossRef] [Green Version]
  36. Zhou, G.; Li, L.J.; Shi, Q.S.; Ouyang, Y.S.; Chen, Y.B.; Hu, W.F. Effects of nutritional and environmental conditions on planktonic growth and biofilm formation of Citrobacter werkmanii BF-6. J. Microbiol. Biotechnol. 2013, 23, 1673–1682. [Google Scholar] [CrossRef] [PubMed]
  37. Melson, E.M.; Kendall, M.M. The sRNA DicF integrates oxygen sensing to enhance enterohemorrhagic Escherichia coli virulence via distinctive RNA control mechanisms. Proc. Natl. Acad. Sci. USA 2019, 116, 14210–14215. [Google Scholar] [CrossRef] [Green Version]
  38. Guijarro, J.A.; Cascales, D.; Garcia-Torrico, A.I.; Garcia-Dominguez, M.; Mendez, J. Temperature-dependent expression of virulence genes in fish-pathogenic bacteria. Front. Microbiol. 2015, 6, 700. [Google Scholar] [CrossRef]
  39. Koohsari, H.; Ghaemi, E.A.; Mozaffari, N.A.; Moradi, A.; Sadegh-Sheshpoli, M.; Javid, S.N. The effect of adding blood on the virulence genes expression of Staphylococcus aureus in exponential and stationary growth phase. Jundishapur J. Microbiol. 2017, 10, e14380. [Google Scholar] [CrossRef]
  40. Ogasawara, H.; Yamada, K.; Kori, A.; Yamamoto, K.; Ishihama, A. Regulation of the Escherichia coli csgD promoter: Interplay between five transcription factors. Microbiology 2010, 156, 2470–2483. [Google Scholar] [CrossRef] [Green Version]
  41. Ferrando, M.L.; van Baarlen, P.; Orru, G.; Piga, R.; Bongers, R.S.; Wels, M.; De Greeff, A.; Smith, H.E.; Wells, J.M. Carbohydrate availability regulates virulence gene expression in Streptococcus suis. PLoS ONE 2014, 9, e89334. [Google Scholar] [CrossRef] [Green Version]
  42. Kentache, T.; Milochanic, E.; Cao, T.N.; Mokhtari, A.; Ake, F.M.; Ma Pham, Q.M.; Joyet, P.; Deutscher, J. Transport and catabolism of pentitols by Listeria monocytogenes. J. Mol. Microbiol. Biotechnol. 2016, 26, 369–380. [Google Scholar] [CrossRef] [PubMed]
  43. Do, H.; Makthal, N.; VanderWal, A.R.; Saavedra, M.O.; Olsen, R.J.; Musser, J.M.; Kumaraswami, M. Environmental pH and peptide signaling control virulence of Streptococcus pyogenes via a quorum-sensing pathway. Nat. Commun. 2019, 10, 2586. [Google Scholar] [CrossRef] [PubMed] [Green Version]
  44. Joffre, E.; Nicklasson, M.; Alvarez-Carretero, S.; Xiao, X.; Sun, L.; Nookaew, I.; Zhu, B.; Sjoling, A. The bile salt glycocholate induces global changes in gene and protein expression and activates virulence in enterotoxigenic Escherichia coli. Sci. Rep. 2019, 9, 108. [Google Scholar] [CrossRef]
  45. Haber, A.; Friedman, S.; Lobel, L.; Burg-Golani, T.; Sigal, N.; Rose, J.; Livnat-Levanon, N.; Lewinson, O.; Herskovits, A.A. L-glutamate induces expression of Listeria monocytogenes virulence genes. PLoS Pathog. 2017, 13, e1006161. [Google Scholar] [CrossRef] [PubMed]
  46. Ayesha, A. Bacterial synthesis and applications of nanoparticles. Nano. Sci. Nano. Technol. 2017, 11, 119. [Google Scholar]
  47. Koul, B.; Poonia, A.K.; Yadav, D.; Jin, J.O. Microbe-mediated biosynthesis of nanoparticles: Applications and future prospects. Biomolecules 2021, 11, 886. [Google Scholar] [CrossRef]
  48. Sadeghi-Aghbash, M.; Rahimnejad, M.; Pourali, S.M. Bio-mediated synthesis and characterization of zinc phosphate nanoparticles using Enterobacter aerogenes cells for antibacterial and anticorrosion applications. Curr. Pharm. Biotechnol. 2020, 21, 1232–1241. [Google Scholar] [CrossRef]
  49. Srinath, B.S.; Rai, V.R. Biosynthesis of highly monodispersed, spherical gold nanoparticles of size 4-10 nm from spent cultures of Klebsiella pneumoniae. 3 Biotech 2015, 5, 671–676. [Google Scholar] [CrossRef] [Green Version]
  50. Honary, S.; Gharaei-Fathabad, E.; Paji, Z.K.; Eslamifar, M. A novel biological synthesis of gold nanoparticle by Enterobacteriaceae family. Trop. J. Pharm. Res. 2012, 11, 887–891. [Google Scholar] [CrossRef] [Green Version]
  51. Baltazar-Encarnación, E.; Escárcega-González, C.E.; Vasto-Anzaldo, X.G.; Cantú-Cárdenas, M.E.; Morones-Ramírez, J.R. Silver nanoparticles synthesized through green methods using Escherichia coli Top 10 (Ec-Ts) growth culture medium exhibit antimicrobial properties against nongrowing bacterial strains. J. Nanomater. 2019, 2019, 4637325. [Google Scholar] [CrossRef] [Green Version]
  52. Javaid, A.; Oloketuyi, S.; Khan, M.M.; Khan, F. Diversity of bacterial synthesis of silver nanoparticles. BioNanoSci. 2018, 8, 43–59. [Google Scholar] [CrossRef]
  53. Song, D.; Li, X.; Cheng, Y.; Xiao, X.; Lu, Z.; Wang, Y.; Wang, F. Aerobic biogenesis of selenium nanoparticles by Enterobacter cloacae Z0206 as a consequence of fumarate reductase mediated selenite reduction. Sci. Rep. 2017, 7, 3239. [Google Scholar] [CrossRef]
  54. El-Shanshoury, A.R.R.; Elsilk, S.E.; Ateya, P.S.; Ebeid, E.M. Synthesis of lead nanoparticles by Enterobacter sp. and avirulent Bacillus anthracis PS2010. Ann. Microbiol. 2012, 62, 1803–1810. [Google Scholar] [CrossRef]
  55. Wang, Q.F.; Li, Q.; Lin, Y.; Hou, Y.; Deng, Z.; Liu, W.; Wang, H.; Xia, Z. Biochemical and genetic basis of cadmium biosorption by Enterobacter ludwigii LY6, isolated from industrial contaminated soil. Environ. Pollut. 2020, 264, 114637. [Google Scholar] [CrossRef]
  56. Standard Microbiological Water Sampling Technique. Available online: https://ww2.health.wa.gov.au/~/media/Files/Corporate/general-documents/water/envwater/other-publications/PDF/Env-waters-micro-sampling-technique.pdf (accessed on 11 January 2022).
  57. Da Silva, N.; Taniwaki, M.H.; Junqueira, V.C.A.; Silveira, N.; Da Silva Do Nascimento, M.; Gomes, R.A.R. Microbiology Examination Methods of Food and Water: A Laboratory Manual, 1st ed.; CRC Press: London, UK, 2012; pp. 83–88. [Google Scholar]
  58. Walker, K.E.; Mahon, C.R.; Lehman, D.C.; Manuselis, G. Enterobacteriaceae. In Textbook of Diagnostic Microbiology, 5th ed.; Mahon, C.R., Lehman, D.C., Manuselis, G., Eds.; Saunders: Philadelphia, PA, USA, 2015; pp. 420–454. [Google Scholar]
  59. American Public Health Association (APHA). Standard Method for the Examination of Water and Wastewater, 22nd ed.; APHA: Washington, DC, USA, 2012; Volume 9221B. [Google Scholar]
  60. Ogutcu, H.; Adiguzel, A.; Gulluce, M.; Karadayi, M.; Sahin, F. Molecular characterization of Rhizobium strains isolated from wild chickpeas collected from high altitudes in Erzurum-Turkey. Rom. Biotechnol. Lett. 2009, 14, 4294–4300. [Google Scholar]
  61. Rivas, R.; Velazquez, E.; Valverde, A.; Mateos, P.F.; Martinez-Molina, E. A two primers random amplified polymorphic DNA procedure to obtain polymerase chain reaction fingerprints of bacterial species. Electrophoresis 2001, 22, 1086–1089. [Google Scholar] [CrossRef]
  62. Antimicrobial Susceptibility Testing EUCAST Disk Diffusion Method Version 2.1. Available online: https://asmsig.files.wordpress.com/2013/08/manual_v_2-1_eucast_disk_test.pdf (accessed on 15 December 2021).
  63. Antimicrobial Susceptibility Systems. Available online: https://www.himedialabs.com/HML/images/literature/pdf/100000027/68.pdf (accessed on 15 December 2021).
  64. Hanson, N.D.; Thomson, K.S.; Moland, E.S.; Sanders, C.C.; Berthold, G.; Penn, R.G. Molecular characterization of a multiply resistant Klebsiella pneumoniae encoding ESBLs and a plasmid-mediated AmpC. J. Antimicrob. Chemother. 1999, 44, 377–380. [Google Scholar] [CrossRef] [Green Version]
  65. Mulvey, M.R.; Grant, J.M.; Plewes, K.; Roscoe, D.; Boyd, D.A. New Delhi metallo-β-lactamase in Klebsiella pneumoniae and Escherichia coli, Canada. Emerg. Infect. Dis. 2011, 17, 103–106. [Google Scholar] [CrossRef]
  66. Jang, J.; Suh, Y.S.; Di, D.Y.; Unno, T.; Sadowsky, M.J.; Hur, H.G. Pathogenic Escherichia coli strains producing extended-spectrum β-lactamase in the Yeongsan River basin of South Korea. Environ. Sci. Technol. 2013, 47, 1128–1136. [Google Scholar] [CrossRef] [PubMed]
  67. Olsen, J.E.; Christensen, H.; Aarestrup, F.M. Diversity and evolution of blaZ from Staphylococcus aureus and coagulase-negative staphylococci. J. Antimicrob. Chemother. 2006, 57, 450–460. [Google Scholar] [CrossRef]
  68. Duran, N.; Ozer, B.; Duran, G.G.; Onlen, Y.; Demir, C. Antibiotic resistance genes & susceptibility patterns in staphylococci. Indian J. Med. Res. 2012, 135, 389–396. [Google Scholar]
  69. Pass, M.A.; Odedra, R.; Batt, R.M. Multiplex PCRs for identification of Escherichia coli virulence genes. J. Clin. Microbiol. 2000, 38, 2001–2004. [Google Scholar] [CrossRef] [PubMed] [Green Version]
  70. Akbari, M.; Bakhshi, B.; Peerayeh, S.N.; Behmanesh, M. Detection of curli biogenesis genes among Enterobacter cloacae isolated from blood cultures. Int. J. Enteric Pathog. 2015, 3, e28413. [Google Scholar] [CrossRef] [Green Version]
  71. Sandner, L.; Eguiarte, L.E.; Navarro, A.; Cravioto, A.; Souza, V. The elements of the locus of enterocyte effacement in human and wild mammal isolates of Escherichia coli: Evolution by assemblage or disruption? Microbiology 2001, 147, 3149–3158. [Google Scholar] [CrossRef] [PubMed] [Green Version]
  72. Aher, T.; Roy, A.; Kumar, P. Molecular detection of virulence genes associated with pathogenicity of Klebsiella spp. isolated from the respiratory tract of apparently healthy as well as sick goats. Isr. J. Vet. Med. 2012, 67, 249–252. [Google Scholar]
  73. Gomes, A.É.I.; Stuchi, L.P.; Siqueira, N.M.G.; Henrique, J.B.; Vicentini, R.; Ribeiro, M.L.; Darrieux, M.; Ferraz, L.F.C. Selection and validation of reference genes for gene expression studies in Klebsiella pneumoniae using reverse transcription quantitative real-time PCR. Sci. Rep. 2018, 8, 9001. [Google Scholar] [CrossRef] [PubMed]
  74. Matei, A.; Matei, S.; Matei, G.M.; Cogălniceanu, G.; Cornea, C.P. Biosynthesis of silver nanoparticles mediated by culture filtrate of lactic acid bacteria, characterization and antifungal activity. EuroBiotech J. 2020, 4, 97–103. [Google Scholar] [CrossRef]
  75. Chang, C.C.; Chen, C.P.; Wu, T.H.; Yang, C.H.; Lin, C.W.; Chen, C.Y. Gold nanoparticle-based colorimetric strategies for chemical and biological sensing applications. Nanomaterials 2019, 9, 861. [Google Scholar] [CrossRef] [PubMed] [Green Version]
  76. Magiorakos, A.P.; Srinivasan, A.; Carey, R.B.; Carmeli, Y.; Falagas, M.E.; Giske, C.G.; Harbarth, S.; Hindler, J.F.; Kahlmeter, G.; Olsson- Liljequist, B.; et al. Multidrig-resistant, extensively drug-resistant and pandrug-resistant bacteria: An international expert proposal for interim standard definitions for acquired resistance. Clin. Microbiol. Infect. 2012, 18, 268–281. [Google Scholar] [CrossRef] [Green Version]
  77. Karbasdehi, V.N.; Dobaradaran, S.; Nabipour, I.; Ostovar, A.; Arfaeinia, H.; Vazirizadeh, A.; Mirahmadi, R.; Keshtkar, M.; Ghasemi, F.F.; Khalifeim, F. Indicator bacteria community in seawater and coastal sediment: The Persian Gulf as a case. J. Environ. Health Sci. Eng. 2017, 15, 6. [Google Scholar] [CrossRef] [PubMed] [Green Version]
  78. Valverde, A.; Igual, J.M.; Peix, A.; Cervantes, E.; Velázquez, E. Rhizobium lusitanum sp. nov. a bacterium that nodulates Phaseolus vulgaris. Int. J. Syst. Evol. Microbiol. 2006, 56, 2631–2637. [Google Scholar] [CrossRef] [PubMed] [Green Version]
  79. Dubois, D.; Grare, M.; Prere, M.F.; Segonds, C.; Marty, N.; Oswald, E. Performances of the Vitek MS matrix-assisted laser desorption ionization-time of flight mass spectrometry system for rapid identification of bacteria in routine clinical microbiology. J. Clin. Microbiol. 2012, 50, 2568–2576. [Google Scholar] [CrossRef] [PubMed] [Green Version]
  80. Luo, Y.; Siu, G.K.H.; Yeung, A.S.F.; Chen, J.H.K.; Ho, P.L.; Leung, K.W.; Tsang, J.L.Y.; Cheng, V.C.C.; Guo, L.; Yang, J.; et al. Performance of the VITEK MS matrix-assisted laser desorption ionization-time of flight mass spectrometry system for rapid bacterial identification in two diagnostic centres in China. J. Med. Microbiol. 2015, 64, 18–24. [Google Scholar] [CrossRef] [PubMed] [Green Version]
  81. Alibi, S.; Ferjani, A.; Boukadida, J.; de Alegría, C.R.; Martínez-Martínez, L.; Navas, J. Evaluation of the VITEK-MS matrix-assisted laser desorption/ionization time-of-flight mass spectrometry system for the identification of clinical Corynebacterium species. Rev. Esp. Quimioter. 2017, 30, 57–58. [Google Scholar]
  82. Maravic, A.; Skocibusic, M.; Cvjetan, S.; Samanic, I.; Fredotovic, Z.; Puizina, J. Prevalence and diversity of extended-spectrum-β-lactamase-producing Enterobacteriaceae from marine beach waters. Mar. Pollut. Bull. 2015, 90, 60–67. [Google Scholar] [CrossRef]
  83. Zango, U.U.; Ibrahim, M.; Shawai, S.A.A.; Shamsuddin, I.M. A review on β-lactam antibiotic drug resistance. MOJ Drug Des. Develop. Ther. 2019, 3, 52–58. [Google Scholar]
  84. Pongsilp, N.; Nimnoi, P. Diversity and antibiotic resistance patterns of enterobacteria isolated from seafood in Thailand. CyTA J. Food. 2018, 16, 793–800. [Google Scholar] [CrossRef] [Green Version]
  85. Mackenzie, K.D.; Wang, Y.; Musicha, P.; Hansen, E.G.; Palmer, M.B.; Herman, D.J.; Feasy, N.A.; White, A.P. Parallel evolution leading to impaired biofilm formation in invasive Salmonella strains. PLoS Genet. 2019, 15, e1008233. [Google Scholar] [CrossRef] [PubMed]
  86. Osman, K.M.; Hassman, H.M.; Orabi, A.; Abdelhafez, A.S.T. Phenotypic, antimicrobial susceptibility profile and virulence factors of Klebsiella pneumoniae isolated from buffalo and cow mastitic milk. Pathog. Glob. Health 2014, 108, 191–199. [Google Scholar] [CrossRef] [Green Version]
  87. Tomar, R.S.; Agarwal, M.; Jyoti, A. Determination of drug resistance and virulent gene signatures in potable water isolates of Escherichia coli in Gwalior city. J. Pharm. Sci. Res. 2015, 7, 967–971. [Google Scholar]
  88. Cornick, N.A.; Booher, S.L.; Moon, H.W. Intimin facilitates colonization by Escherichia coli O157-H7 in adult ruminants. Infect. Immun. 2002, 70, 2704–2707. [Google Scholar] [CrossRef] [PubMed] [Green Version]
  89. Beutin, L.; Krause, G.; Zimmermann, S.; Kaulfuss, S.; Gleier, K. Characterization of Shiga toxin-producing Escherichia coli strains isolated from human patients in Germany over a 3-year period. J. Clin. Microbiol. 2004, 42, 1099–1108. [Google Scholar] [CrossRef] [Green Version]
  90. Karama, M.; Mainga, A.O.; Cenci-Goga, B.T.; Malahlela, M.; El-Ashram, S.; Kalake, A. Molecular profiling and antimicrobial resistance of Shiga toxin-producing Escherichia coli O26, O45, O103, O121, O145 and O157 isolates from cattle on cow-calf operations in South Africa. Sci. Rep. 2019, 9, 11930. [Google Scholar] [CrossRef] [Green Version]
  91. Lee, H.C.; Chuang, Y.C.; Yu, W.L.; Lee, N.Y.; Chang, C.M.; Ko, N.Y.; Wang, L.R.; Ko, W.C. Clinical implications of hypermucoviscosity phenotype in Klebsiella pneumoniae isolates: Association with invasive syndrome in patients with community-acquired bacteraemia. J. Intern. Med. 2006, 259, 610–614. [Google Scholar] [CrossRef] [PubMed]
  92. Hunt, J.J.; Wang, J.T.; Callegan, M.C. Contribution of mucoviscosity-associated gene A (magA) to virulence in experimental Klebsiella pneumoniae endophthalmitis. Invest. Ophthalmol. Vis. Sci. 2011, 52, 6860–6866. [Google Scholar] [CrossRef] [PubMed] [Green Version]
  93. Yazdanpour, Z.; Tadjrobehkar, O.; Shahkhah, M. Significant association between genes encoding virulence factors with antibiotic resistance and phylogenetic groups in community acquired uropathogenic Escherichia coli isolates. BMC Microbiol. 2020, 20, 241. [Google Scholar] [CrossRef]
  94. Haq, K.U.; Noreen, S.; Sehgal, S.A.; Tahir, R.A.; Essa, A.; Ihsan, A.; Hassan, M.U.; Iqbal, W.; Hussain, M.; Hussain, H.; et al. Association of virulence genes with antibiotic resistance in Pakistani uropathogenic E. coli isolates. Comb. Chem. High Throughput Screen 2020, 23, 517–524. [Google Scholar] [CrossRef] [PubMed]
  95. Abd El-Baky, R.M.; Ibrahim, R.A.; Mohamed, D.S.; Ahmed, E.F.; Hashem, Z.S. Prevalence of virulence genes and their association with antimicrobial resistance among pathogenic E. coli isolated from Egyptian patients with different clinical infections. Infect. Drug Resist. 2020, 13, 1221–1236. [Google Scholar] [CrossRef] [PubMed]
  96. Higgins, D.; Mukherjee, N.; Pal, C.; Sulaiman, I.M.; Jiang, Y.; Hanna, S.; Dunn, J.R.; Katmaus, W.; Banerjee, P. Association of virulence and antibiotic resistance in Salmonella-statistical and computational insights into a selected set of clinical isolates. Microorganisms 2020, 8, 1465. [Google Scholar] [CrossRef] [PubMed]
  97. Wyres, K.L.; Lam, M.M.C.; Holt, K.E. Population genomics of Klebsiella pneumoniae. Nat. Rev. Microbiol. 2020, 18, 344–359. [Google Scholar] [CrossRef]
  98. Remya, P.A.; Shanthi, M.; Sekar, U. Characterisation of virulence genes associated with pathogenicity in Klebsiella pneumoniae. Indian J. Med. Microbiol. 2019, 37, 210–218. [Google Scholar] [CrossRef] [PubMed]
  99. Aljanaby, A. Role of rmpA, wabG, uge, Ycfm, fimh1, EntB, Ybt-irp2 and kfu genes in pathogenicity of Klebsiella pneumoniae: An overview. Int. J. Chemtech. Res. 2017, 10, 391–398. [Google Scholar]
  100. Derveaux, S.; Vandesompele, J.; Hellemans, J. How to do successful gene expression analysis using real-time PCR. Methods 2010, 50, 227–230. [Google Scholar] [CrossRef]
  101. Rivera, L.; Lopez-Patino, M.A.; Milton, D.L.; Nieto, T.P.; Farto, R. Effective qPCR methodology to quantify the expression of virulence genes in Aeromonas salmonicida subsp. salmonicida. J. Appl. Microbiol. 2015, 118, 792–802. [Google Scholar] [CrossRef] [PubMed]
  102. Thomas, M.S.; Wigneshweraraj, S. Regulation of virulence gene expression. Virulence 2014, 5, 832–834. [Google Scholar] [CrossRef] [PubMed]
  103. Chakroun, I.; Mahdhi, A.; Morcillo, P.; Cordero, H.; Cuesta, A.; Bakhrouf, A.; Mahdouani, K.; Esteban, M.A. Motility, biofilm formation, apoptotic effect and virulence gene expression of atypical Salmonella Typhimurium outside and inside Caco-2 cells. Microb. Pathog. 2018, 114, 153–162. [Google Scholar] [CrossRef] [PubMed]
  104. Zhang, X.F.; Liu, Z.G.; Shen, W.; Gurunathan, S. Silver nanoparticles: Synthesis, characterization, properties, applications, and therapeutic approaches. Int. J. Mol. Sci. 2016, 17, 1534. [Google Scholar] [CrossRef] [PubMed]
  105. Hu, X.; Zhang, Y.; Ding, T.; Liu, J.; Zhao, H. Multifunctional gold nanoparticles: A novel nanomaterial for various medical applications and biological activities. Front. Bioeng. Biotechnol. 2020, 8, 990. [Google Scholar] [CrossRef] [PubMed]
  106. Liebana, E.; Carattoli, A.; Coque, T.M.; Hasman, H.; Magiorakos, A.P.; Mevius, D.; Peixe, L.; Poirel, L.; Schuepbach-Regula, G.; Torneke, K.; et al. Public health risks of enterobacterial isolates producing extended-spectrum β-lactamases or AmpC β-lactamases in food and food-producing animals: An EU perspective of epidemiology, analytical methods, risk factors, and control options. Clin. Infect. Dis. 2013, 56, 1030–1037. [Google Scholar] [CrossRef] [Green Version]
Figure 1. Nine sampling sites along the shores of the Upper Gulf of Thailand. Site A, Black Sand Beach; B, Kungkrabaen Bay; C, Suanson Beach; D, Pattaya Beach; E, Angsila old market; F, Donhoylhod; G, Bangtaboon Bay; H, Pranburi forest park; I, Wanakorn Beach.
Microorganisms 10 00511 g001
Figure 2. TP-RAPD fingerprints of 113 presumptive enterobacterial strains. Lane M: 100 bp plus DNA ladder; 1–15: 15 different TP-RAPD fingerprints.
Microorganisms 10 00511 g002
Figure 3. Relative gene expression levels of the virulence genes, kfu and uge, of K. pneumoniae GTH-A21 under different NaCl concentrations. Graph bars represent the means of three experiments. Error bars indicate standard deviations. * Error bars indicate standard deviations.
Microorganisms 10 00511 g003
Table 1. Site locations, sampling dates and land use.
SiteSampling DatePlaceDistrict, ProvinceLatitudeLongitudeDistance (km)Land Use
A11 October 2018Black Sand BeachLaemngop, Trat12.169° N102.406° E0.00Mangrove
forest
B11 October 2018Kungkrabaen BayThamai,
Chanthaburi
12.573° N101.902° E123.57Mangrove
forest
C11 October 2018Suanson BeachMueang, Rayong12.458° N101.473° E190.51Tourist site
D11 October 2018Pattaya BeachBanglamoong, Chonburi12.936° N100.883° E326.22Tourist site
E11 October 2018Angsila old marketMueang, Chonburi13.341° N100.926° E388.60Aquaculture site
F12 January 2018DonhoylhodMueang,
Samutsongkhram
13.361° N100.022° E527.64Aquaculture site
G12 January 2018Bangtaboon BayBanlaem,
Phetchaburi
13.264° N99.945° E548.77Aquaculture site
H12 January 2018Pranburi forest parkPranburi,
Prachuapkhirikhan
12.412° N99.981° E659.23Mangrove
forest
I12 January 2018Wanakorn BeachThubsakae,
Prachuapkhirikhan
11.635° N99.703° E769.97Tourist site
Table 2. Nucleotide sequences of primers for real-time PCR and sizes of the PCR products obtained from each pair of primers.
GeneNucleotide Sequence of PrimerSize of the PCR Product (bp)
kfuKFU-RTf 5′ CGA CCG GTT TCT GGG CGT TA 3′
KFU-RTr 5′ GGC GTT TCA AAA CCG GCG AG 3′
293
ugeUGE-RTf 5′ CTC TCA ACG GTC CAG TCG GC 3′
UGE-RTr 5′ CCT GTA TGC CGC CAC CAA GA 3′
288
recARECA-RTf 5′ TTA AAC AGG CCG AAT TCC AG 3′
RECA-RTr 5′ CCG CTT TCT CAA TCA GCT TC 3′
99
Table 3. Average numbers of presumptive enterobacteria and numbers of total coliform bacteria in sampling sites.
SiteAverage Number of
Presumptive Enterobacteria (CFU/mL) *
Number of Total Coliform Bacteria (MPN Index/100 mL)
A, Black Sand Beach6.22 ± 2.683500
B, Kungkrabaen Bay0.44 ± 0.739.3
C, Suanson Beach17.00 ± 3.97540
D, Pattaya Beach1.11 ± 1.051600
E, Angsila old market6.22 ± 4.58350
F, Donhoylhod12.33 ± 6.80700
G, Bangtaboon Bay6.00 ± 1.41920
H, Pranburi forest park1.89 ± 1.36700
I, Wanakorn Beach0.22 ± 0.444.5
* Values are means from three replicates ± standard deviations.
Table 4. Number of enterobacterial strain in each genus or species that possessed antibiotic gene.
Genus/SpeciesNumber of StrainNumber of Strain Possessing Antibiotic Gene
ampCblaSHVblaTEM
E. cloacae13411
E. hormaechei7110
E. coli16436
K. aerogenes4100
K. pneumoniae4831125
K. variicola12740
Pantoea sp.1010
Total101482212
Table 5. Number of enterobacterial strain in each genus or species that possessed virulence gene.
Genus/SpeciesNumber of StrainNumber of Strain Possessing Virulence Gene
csgDeaeAkfuLTImagAuge
E. cloacae13820000
E. hormaechei7400001
E. coli16970100
K. aerogenes4100000
K. pneumoniae481271521123
K. variicola12415227
Pantoea sp.1000101
Total10138172061332
Table 6. Nonparametric correlation analysis of antibiotic resistance genes and virulence genes.
Virulence GeneAntibiotic Resistance Gene
ampCblaSHVblaTEM
r(s)pr(s)pr(s)p
csgD−0.2030.042 *−0.2310.020 *0.1410.161
eaeA−0.0040.967−0.1090.2770.2440.014 *
kfu0.1790.0740.0680.502−0.1710.087
LTI0.0120.9200.070.4850.0370.712
magA0.2850.004 *−0.060.554−0.1410.159
uge0.3320.001 *0.2590.009 *−0.1190.238
r(s) Spearman’s correlation coefficient; p, p-value; * correlation is significant at the 0.05 level.
Publisher’s Note: MDPI stays neutral with regard to jurisdictional claims in published maps and institutional affiliations.

