Article

Grinding Beads Influence Microbial DNA Extraction from Organic-Rich Sub-Seafloor Sediment

1
State Key Laboratory of Marine Environmental Science, Fujian Key Laboratory of Marine Carbon Sequestration, College of Ocean and Earth Sciences, Xiamen University, Xiamen 361102, China
2
Department of Ocean Science, The Hong Kong University of Science and Technology, Hong Kong, China
3
Fishery College, Zhejiang Ocean University, Zhoushan 316022, China
4
Institute for Advanced Study, Shenzhen University, Shenzhen 518061, China
5
Southern Marine Science and Engineering Guangdong Laboratory (Zhuhai), Zhuhai 519080, China
*
Author to whom correspondence should be addressed.
These authors contributed equally to this work.
Microorganisms 2022, 10(12), 2505; https://doi.org/10.3390/microorganisms10122505
Submission received: 6 November 2022 / Revised: 15 December 2022 / Accepted: 16 December 2022 / Published: 18 December 2022
(This article belongs to the Section Environmental Microbiology)

Abstract

:
Sub-seafloor sediment is the largest microbial habitat on Earth. The study of microbes in sub-seafloor sediment is largely limited by the technical challenge of acquiring ambient microbial DNA because of sediment heterogeneity. Changes in the extraction method, even just by one step, can affect the extraction yields for complicated sediment samples. In this work, sub-seafloor sediment samples from the Baltic Sea with high organic carbon content were used to evaluate the influence of different grinding beads on DNA extraction. We found that the grinding beads can affect the DNA extraction from the organic-matter- and biosiliceous-clay-rich samples. A mixture of 0.5-mm and 0.1-mm grinding beads exhibited higher DNA yields and recovered more unique taxa than other bead combinations, such as Stenotrophomonas from Gammaproteobacteria and Leptotrichia from Fusobacteria; therefore, these beads are more suitable than the others for DNA extraction from the samples used in this study. This advantage might be magnified in samples with high biomass. On the contrary, the use of only small beads might lead to underestimation for certain Gram-positive strains. Overall, the discovery of abundant widespread deep biosphere clades in our samples indicated that our optimized DNA extraction method successfully recovered the in situ microbial community.

1. Introduction

The fundamental step for determining microbial diversity and function in complex environmental samples is extraction of high quantities of high-quality DNA; however, this remains challenging [1]. Except for the DNA yield, the modification of a single step in the DNA extraction protocol may influence the resulting microbial community diversity [1,2,3], primarily due to the structural difference of cell walls [4,5,6,7,8,9]. Previous studies have implied that the combination of different lytic strategies (bead beating, a cock tail of lytic enzymes, etc.) can obtain the best representation of microbial diversity [10]. For example, the physical disruption was deemed to improve the recovery of Actinobacteria, Nitrospirota, Chloroflexota, and Alphaproteobacteria [11]. It is not possible to simply apply one protocol to extract DNA from different environmental samples. The extraction of microbial DNA from sub-seafloor sediment is more challenging than that from water, soil, or marine surface sediment because of the diversity of sediment types (e.g., fine sand, silt, and clay), low biomass, complex structures (e.g., spores and cysts), and multiple potential enzyme inhibitors (e.g., heavy metals, colloids, fulvic acids, and humic acids) that exist in the deep biosphere [12]. Sediment microbial DNA can be extracted by separating the cells from the sediment particles before lysis (cell extraction method) or by direct lysis of cells in the sediment without separation (direct lysis method) [13].
The cell extraction method is time-consuming, has a low recovery rate, and may introduce extraction bias for different microbial groups [14]. By contrast, several studies have shown that the direct lysis method provides a high DNA yield, ribotype richness, and diversity and is a better method than cell extraction for investigating microbial diversity in sediments [15,16,17,18,19,20]. Direct lysis can be achieved by mechanical disruption (e.g., by freeze-thawing, bead-mill homogenization, and/or sonication), chemical lysis (e.g., with detergents, sodium chloride, and/or chaotropic agents), and enzymatic lysis (e.g., by lysozyme, proteinase K, achromopeptidase, and/or protease E) [12,21,22,23]. Moré et al. (1994) suggested that mechanical treatment is more efficient and less selective than chemical lysis [24]. Various investigations into soil microbial DNA extraction methods have found that bead milling produces higher DNA yields than other mechanical disruption methods [15,22,24,25,26,27]. In this method, the grinding beads effectively separate and fragment cells by interaction with the sediment matrix. Some studies have investigated the impact of the milling time and intensity on the DNA yield and recovery rate [28]. However, there have been few specific reports on the influence of various parameters of the grinding beads on DNA extraction [29].
For microbial DNA extraction from sediment samples, commercial bead-based DNA extraction kits are commonly used. In contrast to manual extraction of DNA [25], which is time-consuming, commercial DNA extraction kits are more suitable for molecular ecological investigations of large numbers of samples because they use prepared reagents and streamlined processes [17,25]. Over the past two decades, many commercial kits have been developed and used for extraction of DNA from various environmental samples (e.g., terrestrial soil, marine sediment, permafrost, and sludge) [11,17,21,26,30]. However, commercial DNA extraction kits designed for sediment samples are not widely available. In some studies, commercial soil DNA extraction kits were used to recover microbial DNA from marine sediment. Lever et al. (2015) found that the use of these kits resulted in lower DNA yields [31], and Morono et al. (2014) found that almost two-thirds of all microbial cells were not destroyed using commercial kits [3]. Therefore, to improve the suitability and effectiveness of these kits for application to microbial DNA extraction from sediment samples, it is essential to modify the parameters of the grinding beads in commercial soil kits to facilitate the isolation and disruption of microbial cells without causing excessive fragmentation of the DNA.
The Baltic Sea basin is one of the world’s largest intra-continental basins [32]. The Baltic Sea environment has undergone dramatic changes over time because of switching between freshwater with low organic carbon deposition periods and seawater with high organic carbon deposition periods [32]. These climate changes are reflected in the high-resolution sediments of the Baltic Sea [33]. The Baltic Sea is also characterized by rapid sedimentation rates and high levels of organic matter and nutrients that support the growth of benthic microbial communities [34]. Thus, the Baltic Sea serves as a natural laboratory for studying the effects of sediment age, energy availability, and changing salinity throughout time on microbial communities in the deep sub-seafloor. It also provides an excellent experimental material for the optimization of sediment microbial DNA extraction methods.

2. Materials and Methods

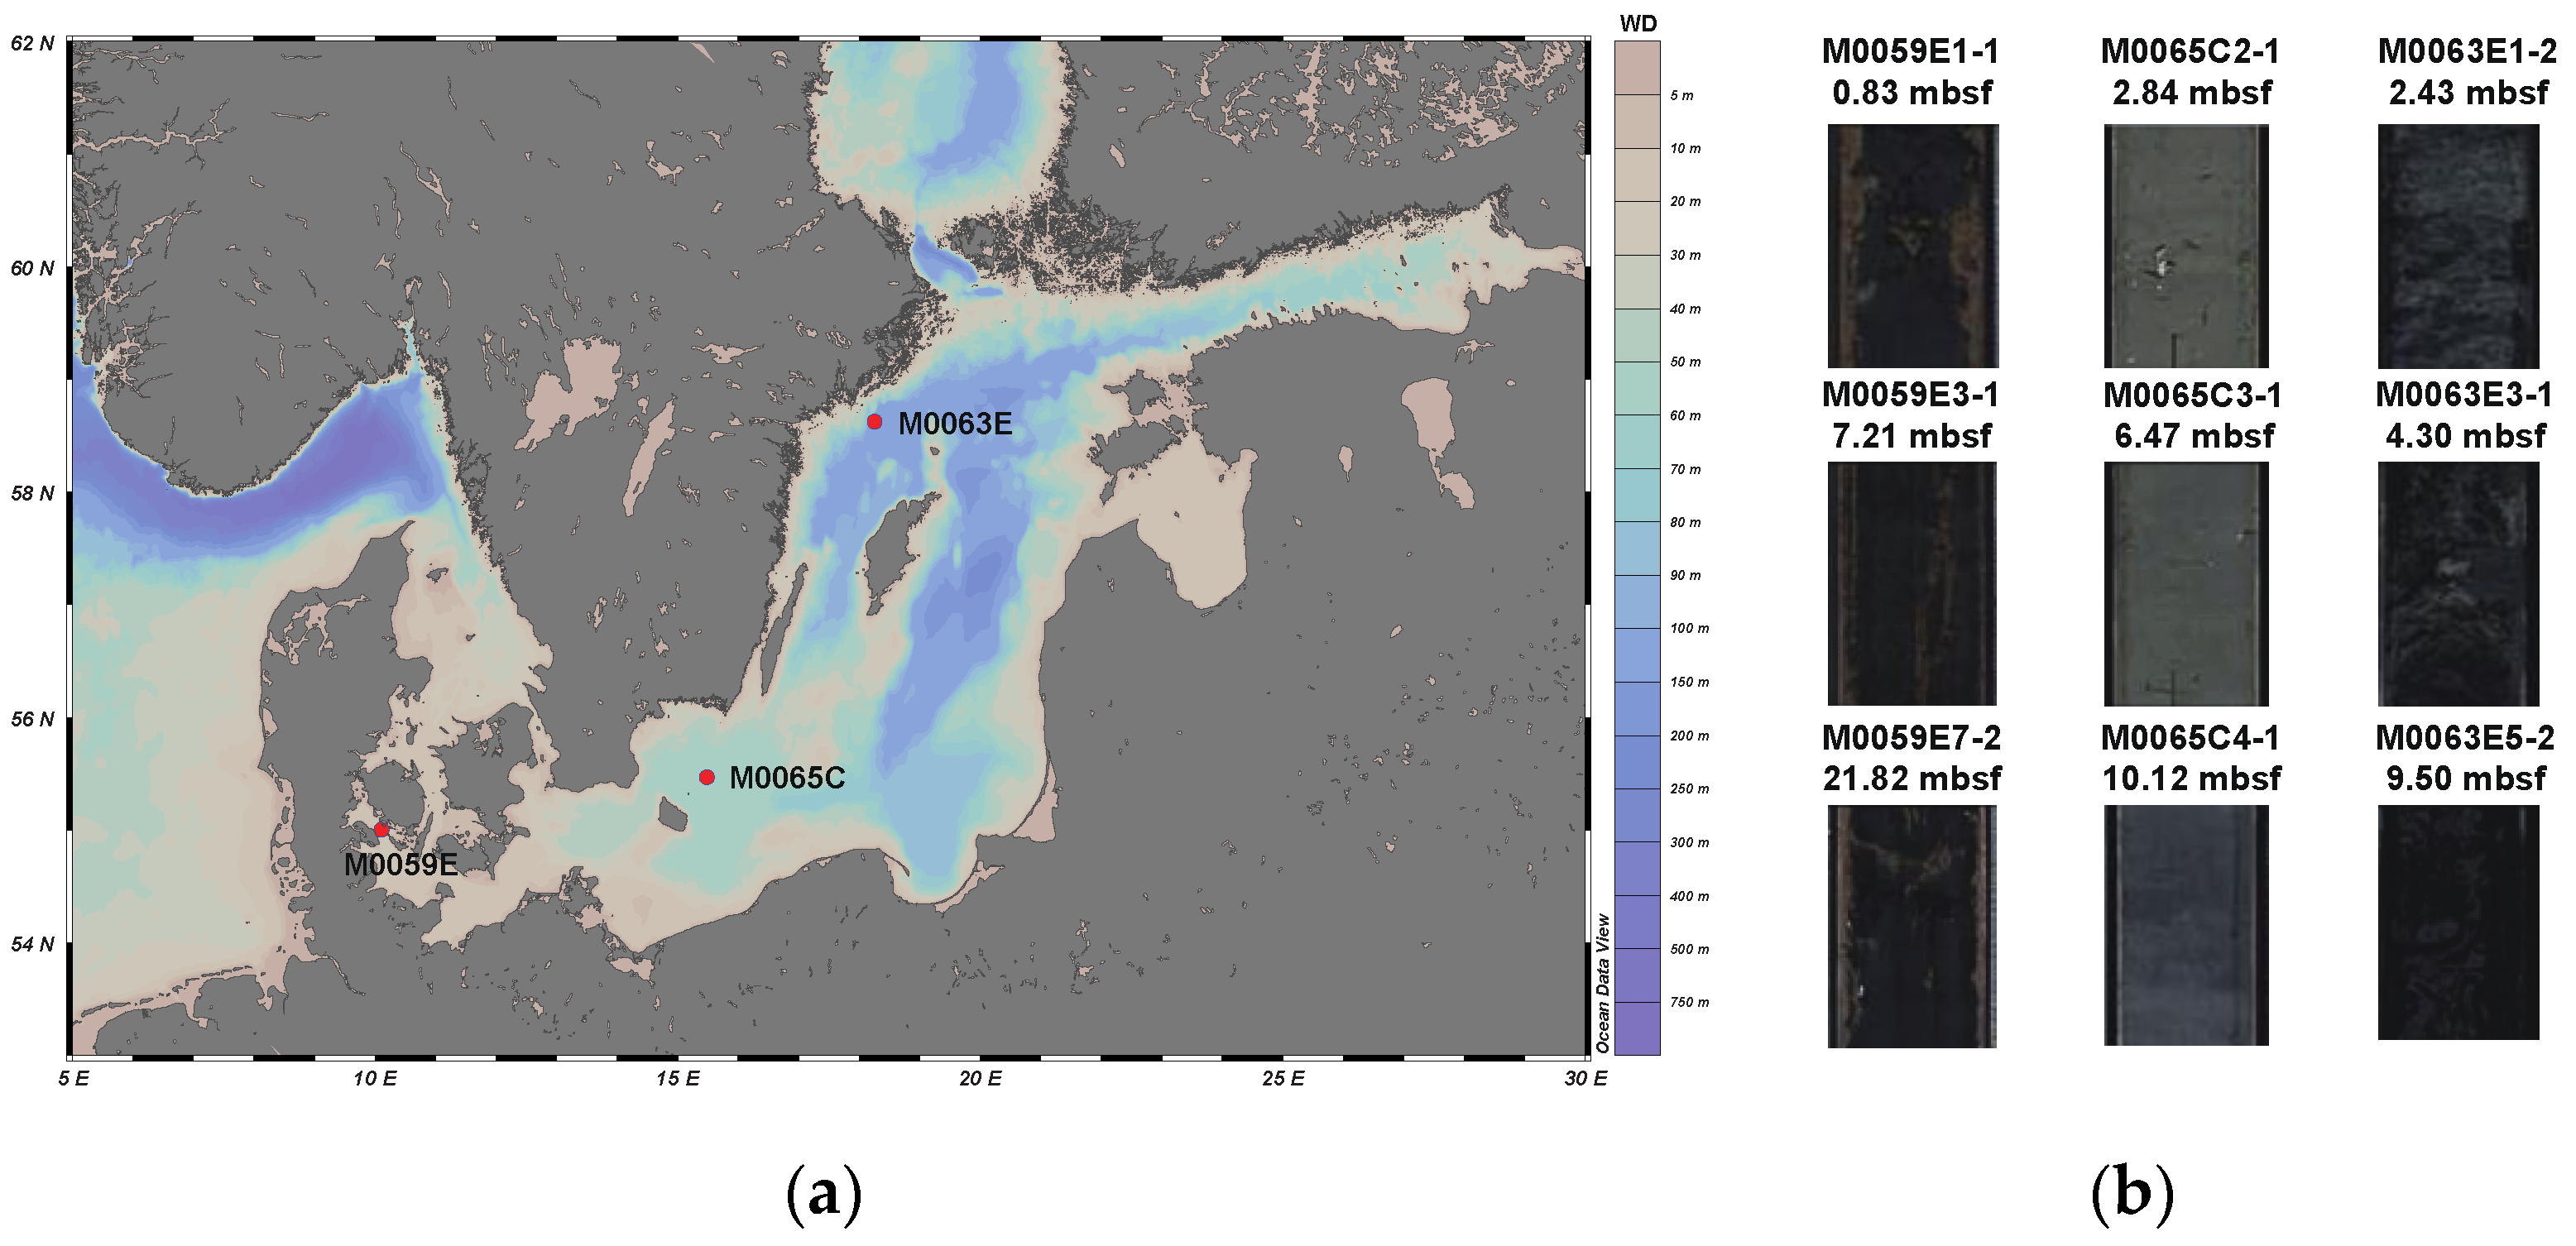
2.1. Sample Collection

The Baltic Sea is an organic-rich basin with a high sedimentation rate of 100–500 cm/ky [34]. During the IODP Expedition 347 in the Baltic Sea in 2013, sediments were sampled from three boreholes: M0059E, M0065C, and M0063E. M0059E was located in a shallow region (depth of 37.1 m) at the entrance to the Baltic Sea. In this area, marine water from the North Sea flows into the Baltic Sea [33]. M0065C was situated in the middle of the Baltic Sea and the depth was 84.3 m. M0063E was located in the deepest part (437.1 m) of the Baltic Sea basin. This area of the sea experiences periodic anoxia [35] (Figure 1a). All samples were packaged in Whirl-Pak sampling bags on board, transported to the laboratory on dry ice, and stored at −80 °C until required for analysis. Three samples from different depths at each borehole (a total of nine samples) were used for DNA extraction (Figure 1b).
For the different boreholes, there were some variations in the physical properties (Table S1 and Figure S1). The major lithology of the M0059E samples used in this study was biosiliceous clay, containing 68–89% clay minerals and 5–27% biogenic silica (primarily diatoms, silicoflagellates, and sponge spicules) [34]. The samples at borehole M0065C were dark greenish gray organic-rich clay with very low silt and sand contents [34]. The sediments from M0063E were organic-rich diatom-bearing black clays, which had very low contents of silt and sand [34]. For samples from all three boreholes, the water content (wet mass) and fractional porosity decreased with depth, with the M0059E samples having higher water contents and porosities than the samples from the other two boreholes. Compared with the samples from M0059E and M0063E, the M0065C samples had higher particle densities.
In terms of chemical parameters, vertical and horizontal variations were evident (Table S1 and Figure S1). The majority of these values gradually decreased as the distance of the sampling borehole increased from the entrance to the Baltic Sea (M0059E) to the inner Baltic Sea (M0065C and M0063E). The salinity clearly decreased with depth, ranging from 26.69 to 32.15 (average: 30.31 ± 2.90) at M0059E, 13.90 to 16.40 (average: 15.37 ± 1.31) at M0065C, and 11.80 to 13.00 (average: 13.10 ± 1.35) at M0063E. The total organic matter (TOC) content, and ammonium (NH4+) and phosphate (PO43−) concentrations were positively correlated with the salinity (Spearman correlations of p = 0.036, p = 0.001, and p = 0.0016, respectively). Although scattering of the data was observed in some parts of the profiles, the sulfate (SO42−) concentrations in all sediment samples in this work were generally <0.15 mM. The sulfate concentrations varied from 0.030 to 0.070 mM (average: 0.043 ± 0.023 mM) at M0059E, 0.010 to 0.100 mM (average: 0.046 ± 0.047 mM) at M0065C, and 0.050 to 0.120 mM (average: 0.070 ± 0.044 mM) at M0063E.

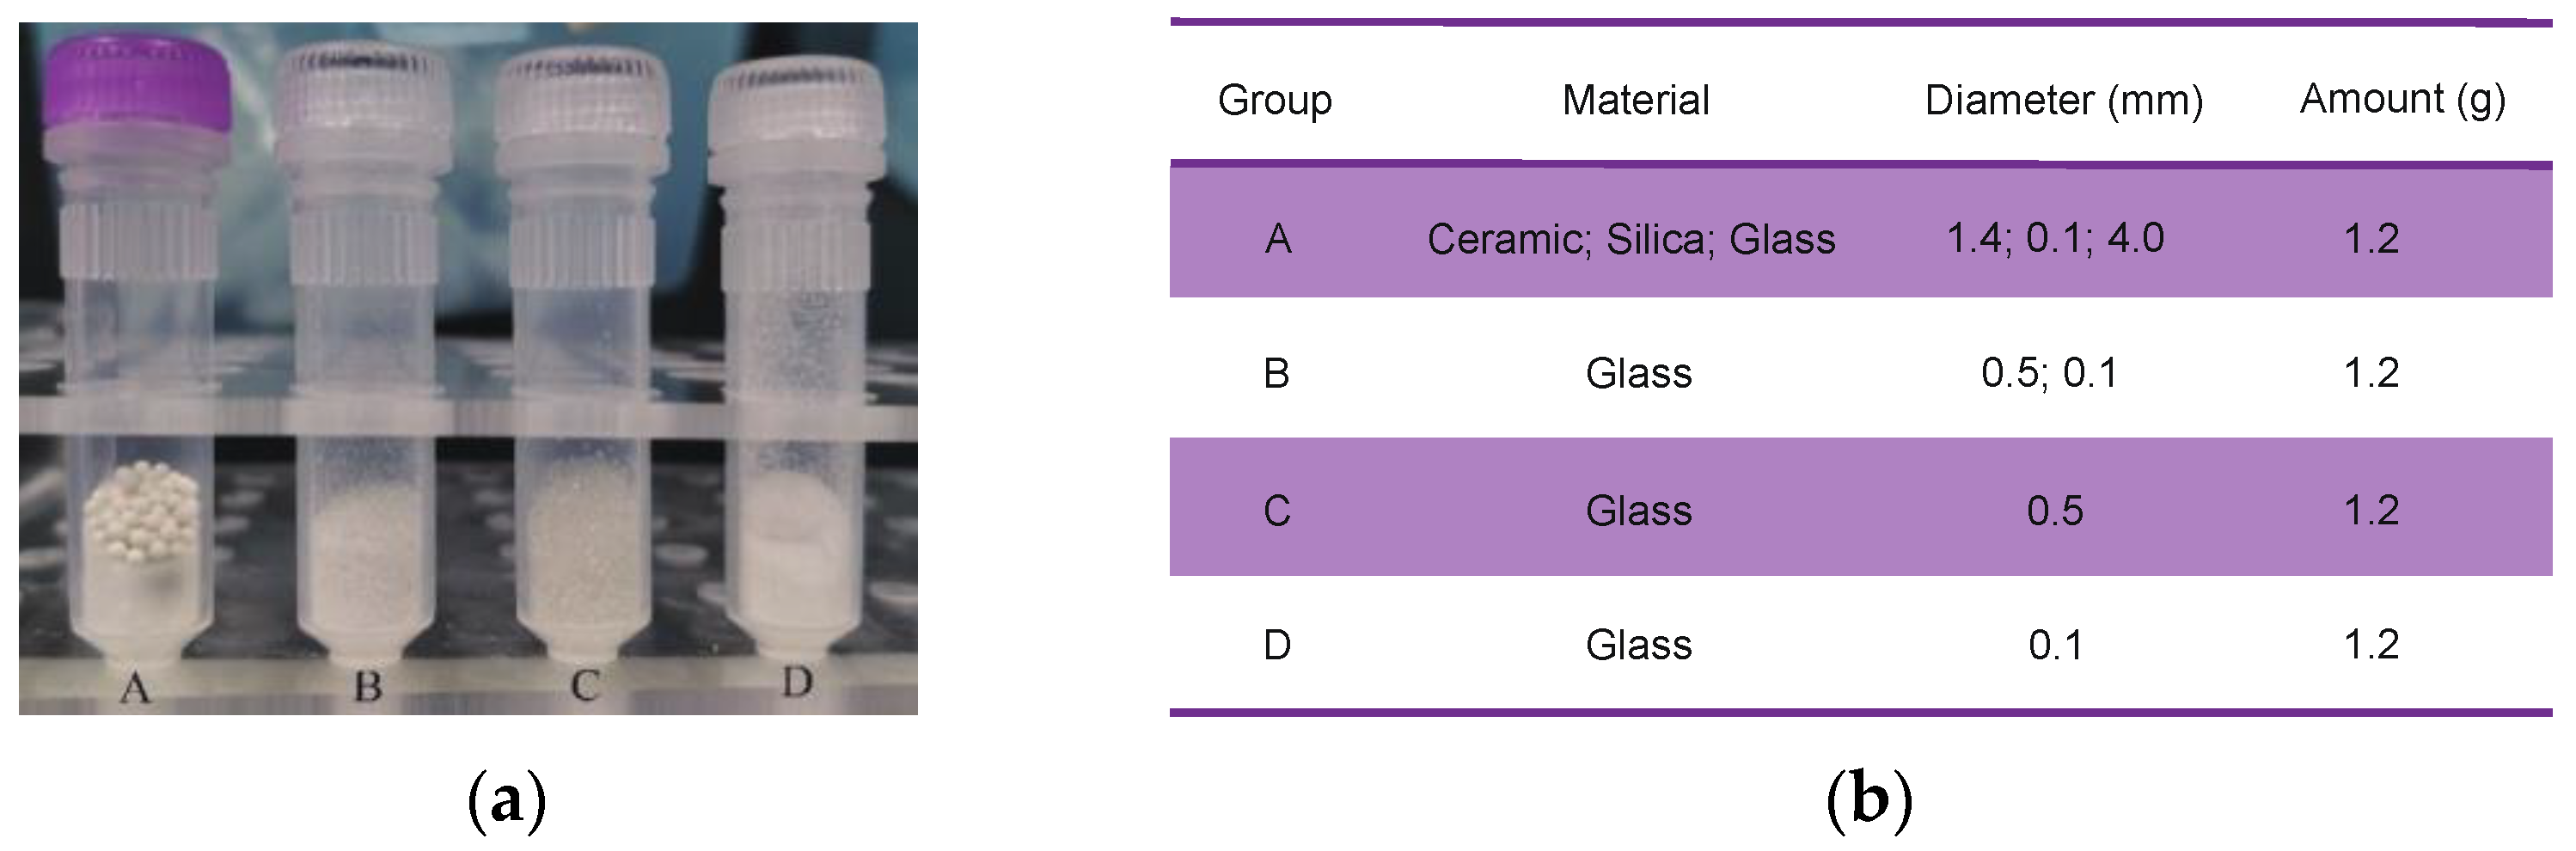
2.2. Combinations of Grinding Beads

Four different types of beads made from various materials and with different diameters were used in different amounts. The results were used to compare the efficiency of different bead combinations on environmental microbial DNA extraction from sediment samples (Figure 2). Group A contained 1.2 g of 1.4-mm ceramic beads, 0.1-mm silica beads, and a 4-mm glass bead (from the FastDNA® SPIN Kit for soil, MP Biomedicals, Santa Ana, CA, USA); group B contained 0.6 g of 0.1-mm glass beads and 0.6 g of 0.5-mm glass beads; group C contained 1.2 g of 0.5-mm glass beads; and group D contained 1.2 g of 0.1-mm glass beads. Three parallel sets of sediment samples were lysed using each group of beads. The results for the experiments were labeled according to the sediment sample location and extraction method, for example, M0059E1-1A, M0059E1-1B, M0059E1-1C, and M0059E1-1D for sediment sample M0059E1-1 extracted using the group A, B, C, and D beads, respectively.

2.3. DNA Extraction

Three DNA extractions using the grinding beads in each group were conducted using the FastDNA® SPIN Kit for soil (MP Biomedicals) following the manufacturer’s instructions with some modifications. The following extraction steps were used (Figure S2):
(I)
Each sediment sample was thawed at 4 °C until it was soft enough to scrape off the surface with a sterile knife. Then, 0.5 g of the wet sediment sample was added to a 2-mL lysis tube with one of the groups of beads.
(II)
Lysis buffer (1 mL) containing 978 μL of sodium phosphate buffer and 122 μL of MT buffer was added to the lysis tube. The tube was then secured horizontally on a Vortex-Genie Adapter (Thermo Fisher Scientific, Waltham, MA, USA) and vortex mixed gently to dissolve the sediment and mix it with the beads and buffer.
(III)
The lysis tube was homogenized in a FastPrep instrument twice for 45 s at 6.0 m s−1 with a 5 min interval in an ice bath between the two cycles. This step was used to disrupt the cell wall and release nucleic acids.
(IV)
The sediment/bead mixture was centrifuged at 14,000× g for 10 min at 4 °C to pelletize any debris such as insoluble cellular debris and the lysis matrix.
(V)
The supernatant was transferred to a clean 2-mL microcentrifuge tube. PPS (250 μL) was added to separate the solubilized nucleic acids from the cellular debris and lysis matrix. After inverting the tube 10 times, it was centrifuged at 14,000× g for 5 min (4 °C).
(VI)
The supernatant was transferred to two clean 2-mL microcentrifuge tubes (approximately 0.5 mL each) and then resuspended with 0.5 mL of binding matrix. After vortex mixing, the tubes were placed in an ice bath for 15 min.
(VII)
For each of two tubes, 300 μL of the supernatant was carefully removed and discarded to avoid disturbing the settled binding matrix. The binding matrix in the remaining amount of supernatant was gently resuspended. The remaining 700 μL of the mixtures was transferred to a spin filter and centrifuged at 14,000× g for 2 min (4 °C). The spin filter was then emptied and reused for another tube of the mixture.
(VIII)
Prepared SEWS-M (500 μL with an appropriate volume of ethanol added) was added to solubilize any impurities. The pellet was gently resuspended using liquid from a pipet tip, which was followed by centrifugation at 14,000× g for 1 min (4 °C). The tube was then emptied. After washing the spin filter three times, it was centrifuged at 14,000× g for 2 min without any added liquid to completely remove SEWS-M.
(IX)
The catch tube was replaced with a new, clean catch tube, and the spin filter was air dried for 10 min at room temperature to remove the residual alcohol.
(X)
The binding matrix (above the spin filter) was gently resuspended in 100 μL of DES and incubated for 5 min at 55 °C in a heat block or water bath.
(XI)
The tube was centrifuged at 14,000× g for 1 min to bring the eluted DNA into the clean catch tube and the spin filter was discarded. The DNA samples were stored at −20 °C until required for amplification.
The DNA concentrations were determined using the Quant-iT dsDNA BR assay kit and a Qubit fluorometer (Invitrogen GmbH, Karlsruhe, Germany). DNA purity was measured with a spectrophotometer at 260 and 280 nm (A260 and A280) using a NanoDrop ND-2000 (Thermo Fisher Scientific, Waltham, MA, USA). Nucleic acids were measured using the peak at 260 nm, and proteins and phenolics were measured using the peak at 280 nm. Pure DNA preparations have an expected A260/A280 ratio of 1.8.

2.4. Analyses of Sequences and Statistics

The DNA from the three parallel extractions for each group was mixed for the following experiments. The primer pair 515F (5′-GTG YCA GCM GCC GCG GTA A-3′) [36] and 806R (5′-GGA CTA CNV GGG TWT CTA AT-3′) [37] was used to amplify the V4 region of the bacterial and archaeal 16S rRNA gene. Three parallel samples of the PCR products were mixed and purified with magnetic beads. The DNA concentration was detected by a microplate reader, and the fragment size was detected by agarose gel electrophoresis. The library was quantified to 10 nM, and PE250 paired-end sequencing was performed according to the Illumina MiSeq (Illumina, San Diego, CA, USA) instrument manual by GENEWIZ (Suzhou, China). Sequencing data were analyzed and visualized using QIIME 2 (Version 2020.11.1) [38]. Demultiplexed reads were quality filtered using the QIIME2 plugin quality filter with the default settings [39]. Reads were then denoised, chimera checked, and dereplicated using a DADA2 denoise-paired plugin [40]. Amplicon sequence variants (ASVs) were classified based on the 100% non-clustered unique sequences obtained by DADA2 [40]. Using the qiime feature-table rarefy, the outputs of DADA2 were rarefied to the lowest sample at 5631 sequences. Past (Version 4.02) was used to calculate the diversity indices, including Chao-1 and Shannon indices [41]. Taxonomic assignments were performed by qiime feature-classifier classify-sklearn using a pre-trained Naïve−Bayes classifier with the SILVA database (Version 138) [42]. Taxa bar plots were built using the plugin qiime taxa bar plot with the feature table.
Statistical analyses relating to DNA purity, DNA concentration, and diversities were performed using one-way analysis of variance (ANOVA) by Tukey’s test. Significant results were subjected to pairwise comparisons using the Student’s t-test. All statistical analyses and data visualization were performed using GraphPad Prism (Version 9.3.1, Dotmatics, San Diego, CA, USA).

3. Results

3.1. Sample Description

We compared the efficiencies of four different groups of grinding beads for DNA extraction from Baltic Sea sub-seafloor sediment samples with a wide range of physicochemical and microbial characteristics (Table S1 and Figure S1). The cell abundances of the nine samples (three samples collected at each of three sites) varied by nearly 30-fold, with a range of 2.67 × 10⁸ cells/cm3 in M0065C4-1 to 7.57 × 10⁹ cells/cm3 in M0063E3-1 [43]. All of the sediment samples were fine clay minerals with a clay content of up to 89% and had low water contents that decreased with sediment depth at each sampling site. The trend for the NH4+ concentration at M0059E and M0063E was the reverse of that for water, and the concentration peaked in M0059E7-2 at 36.99 mM. The salinity varied widely among the sampling sites, with M0059E being classed as a marine sediment and M0063E and M0065C as brackish sediments. All nine samples had high TOC contents (1.85–7.40%), and oxygen and sulfate were depleted.

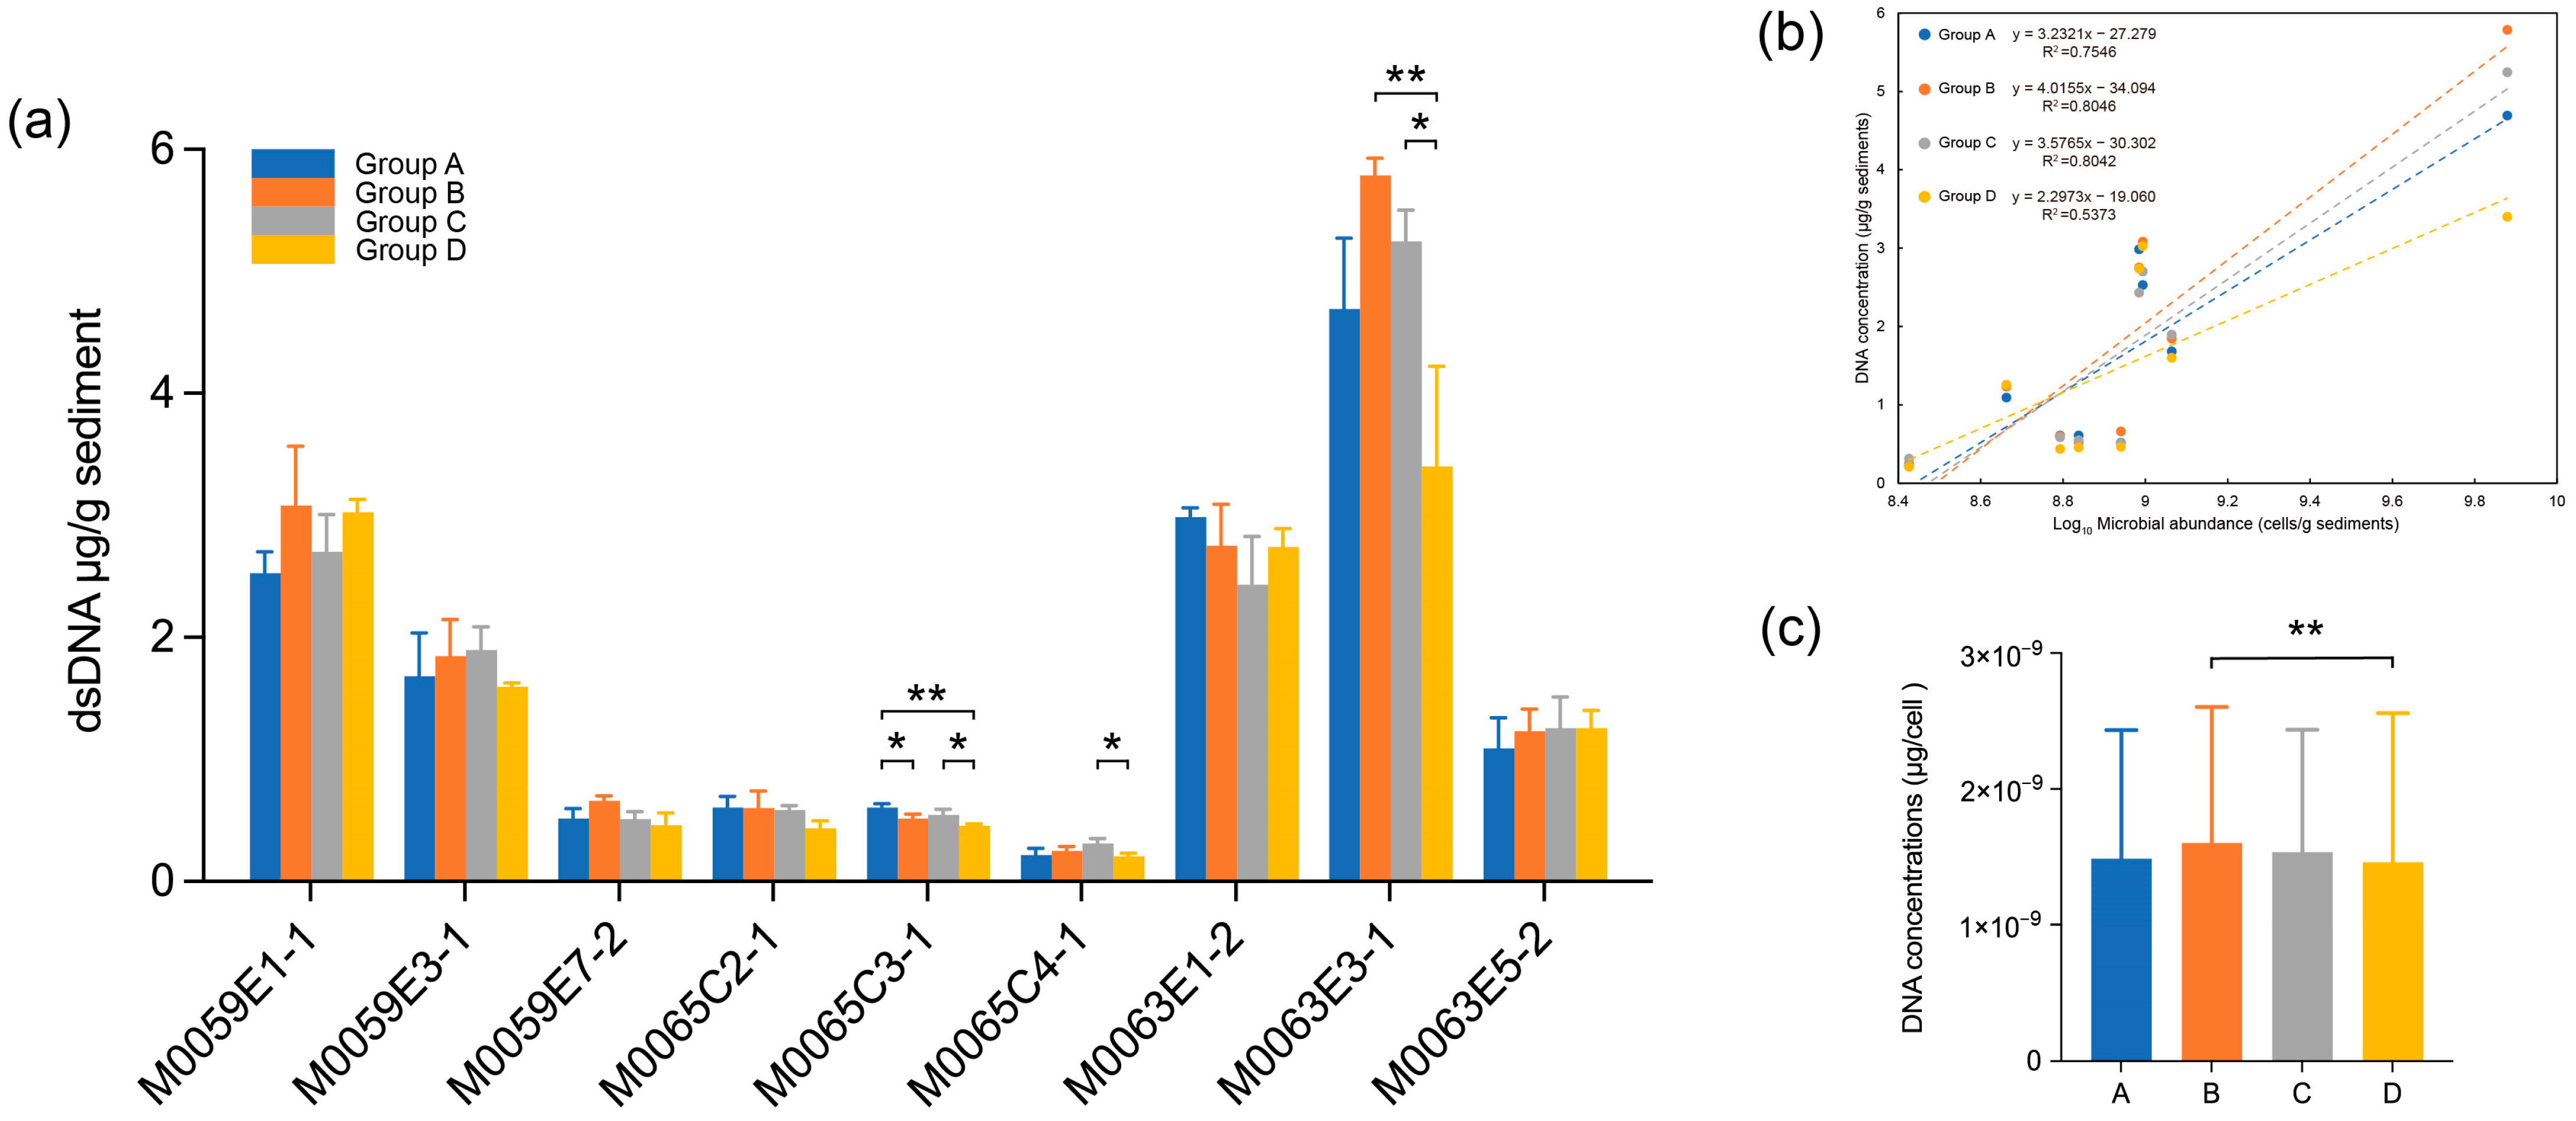
3.2. Effect of Grinding Beads on DNA Quality

Concentration is an important parameter when evaluating the efficiency of DNA extraction. In the present study, significant differences were observed among the four groups of grinding beads used for extraction of DNA from M0065C3-1, M0065C4-1, and M0063E3-1. The grinding beads in groups A, C, and B performed the best (one-way ANOVA, p < 0.05; Figure 3a). The group D beads produced the lowest quantity of double-stranded DNA among the four groups of beads (Student’s t-test, p < 0.05). Significant positive correlations between DNA concentration and cell abundance were found for all four groups of beads (Spearman, p < 0.05; Figure 3b). The grinding beads in groups B and C showed the best fit with the cell abundance and the highest average DNA concentration, which was consistent with their good performance for DNA extraction compared with group D. After controlling for the influence of cell abundance, the DNA concentrations showed no significant relationships with the other tested parameters. However, normalized DNA concentration was significantly higher in group B than in group D (Student’s t-test, p = 0.0085; Figure 3c).
The A260/A280 ratio was measured using Nanodrop and used to evaluate the purity of the DNA extracted in this work. This ratio ranged from 1.40 to 1.75 (1.535 ± 0.074) for all DNA, which indicated high purity and a low level of protein contamination. Although different grinding beads did not influence the purity of the DNA, significant variation was found among the nine samples (one-way ANOVA, p < 10−4; Figure S3a). The DNA purity was higher at M0063E, which had low a TOC content (1.560 ± 0.080), than at M0059E (1.510 ± 0.084) or M0065C (1.534 ± 0.090), which had high TOC contents. The purities of the DNA extracted using all four groups of grinding beads were significantly positively correlated with the sulfate concentration (Spearman, p < 0.05; Figure S3b).

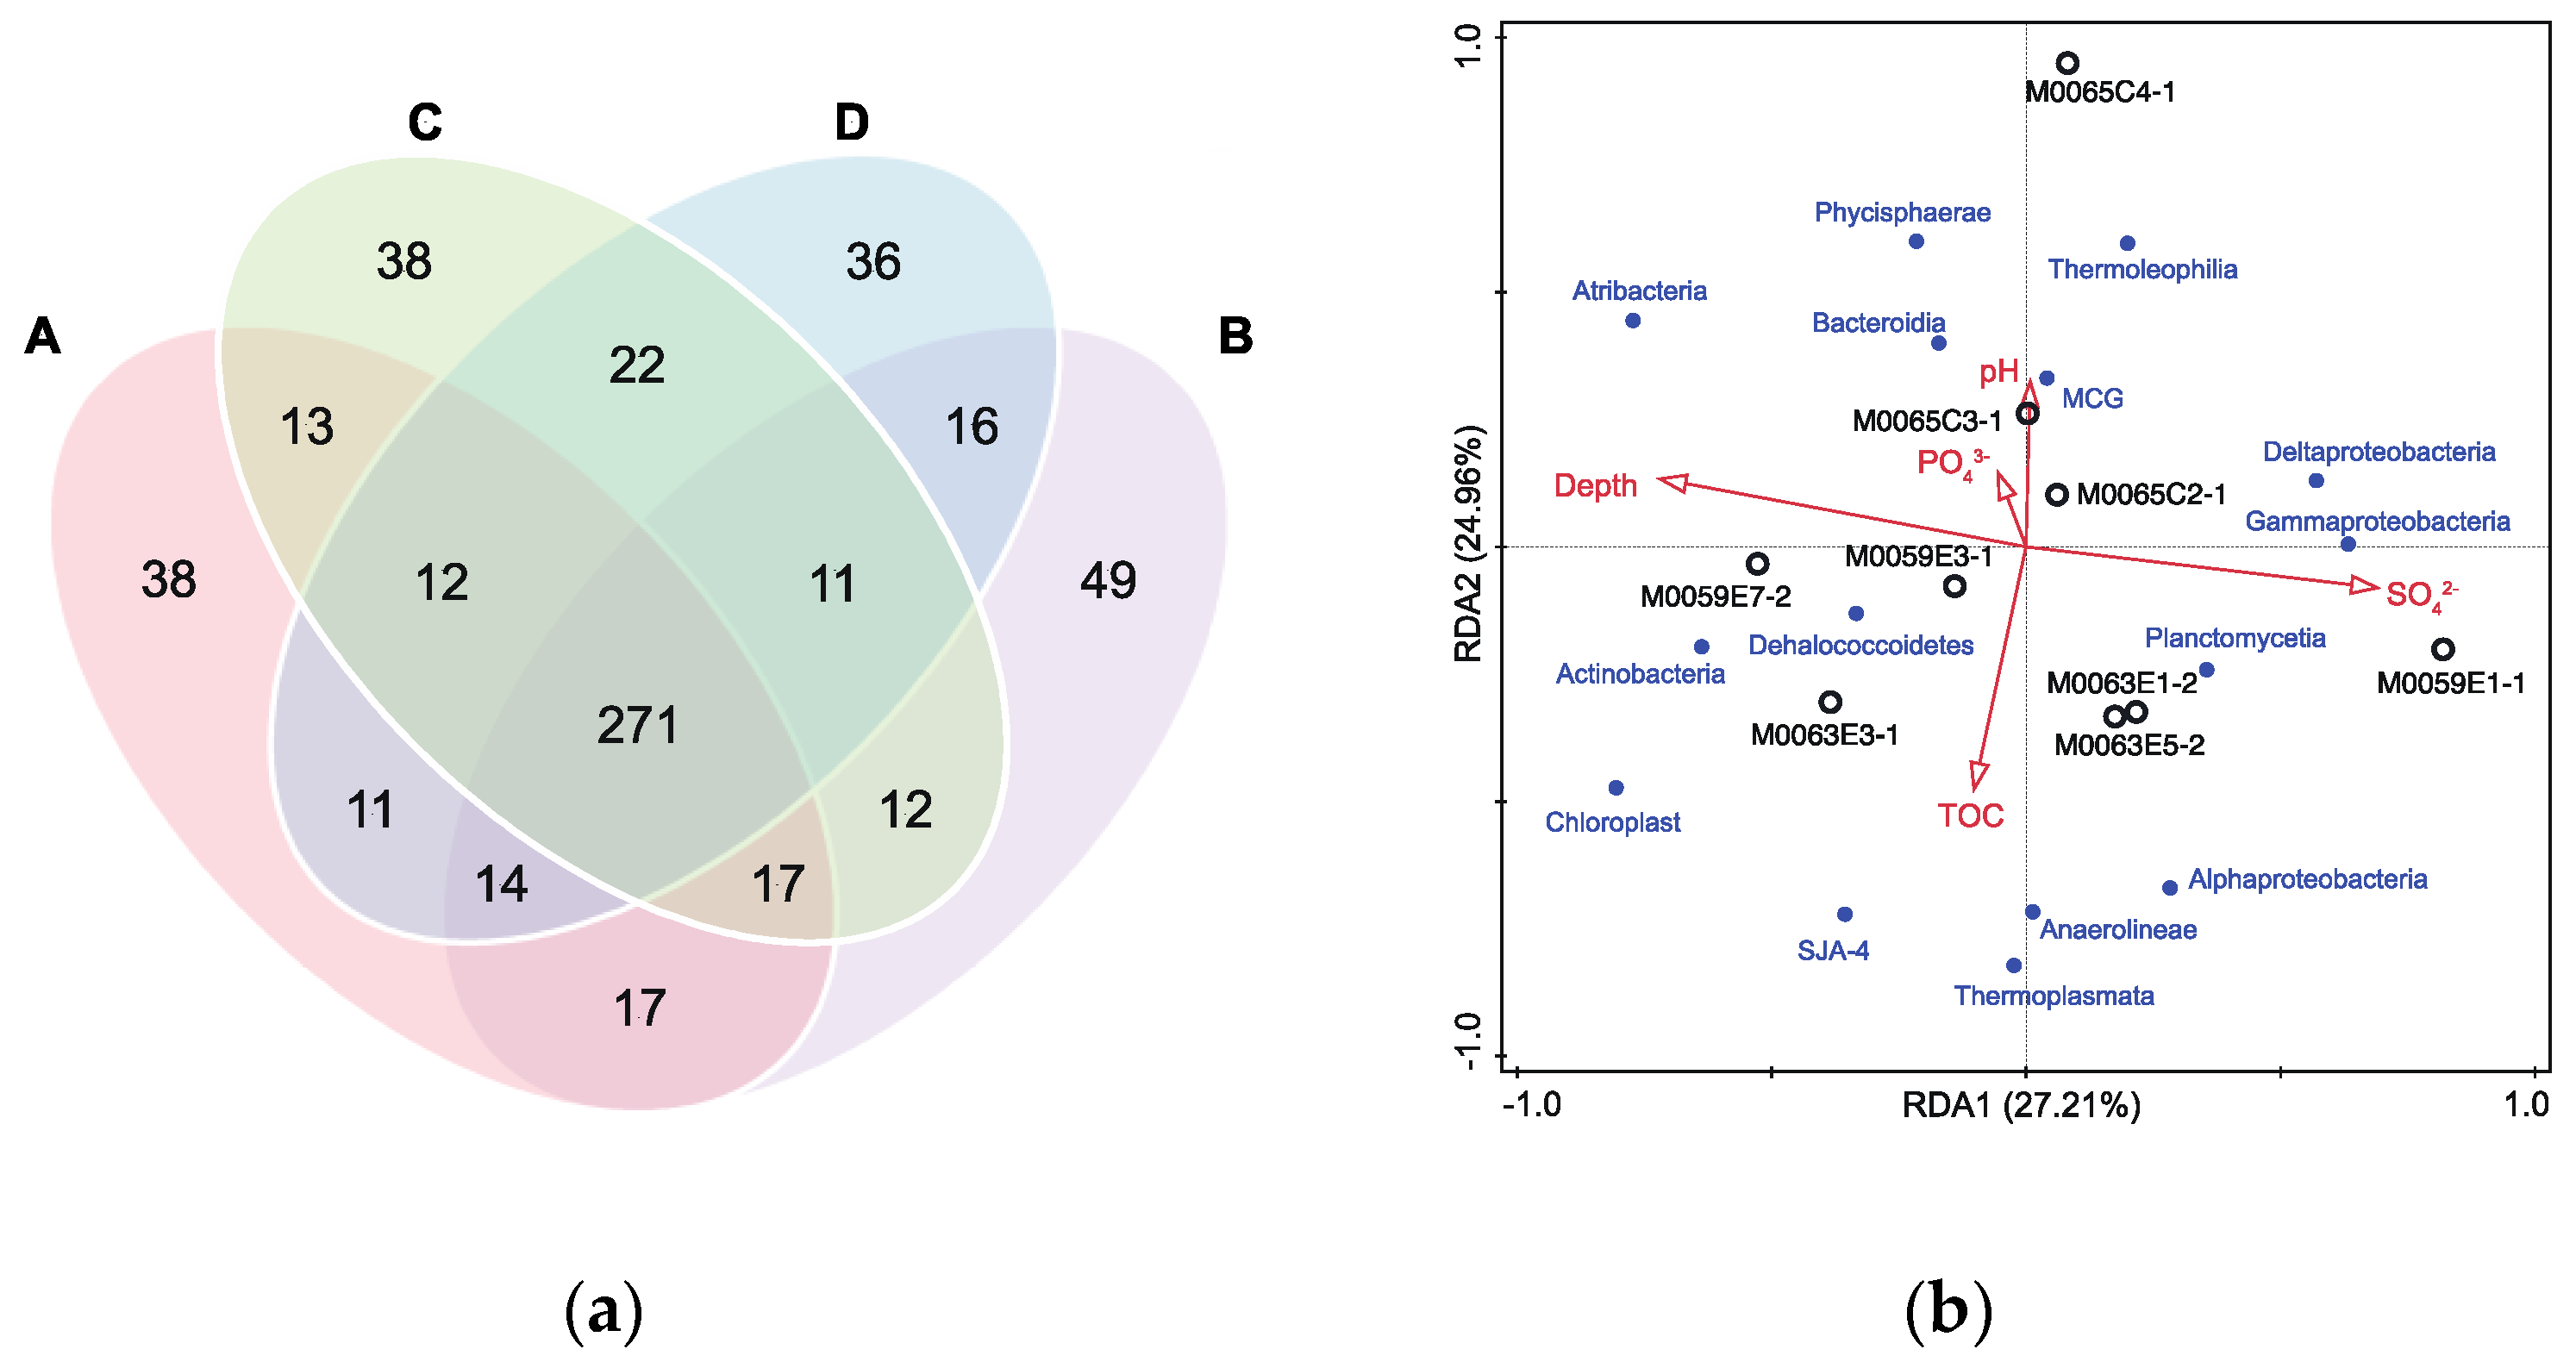
3.3. Effect of Grinding Beads on the Microbial Community Alpha Diversity

By amplifying and sequencing the V4 region 16S rRNA gene, >2.5 million raw sequences were obtained. After quality control, at least 38,260 reads with an average sequence length of 293 bp were left in each sample for further analyses (Table S2). The DADA2 algorithm was used to dereplicate the high-quality sequences, and a total of 10,031 ASVs were obtained. For the DADA2 community, groups C and D had significantly higher Chao-1 indices than group A at M0063E (Student’s t-test, p < 0.05; Table S3 and Figure S4). Overall, the DADA2 algorithm could identify high community diversity and was sensitive to the differences caused by the grinding beads in the DNA extraction process. Consequently, all further analyses were based on the ASV community of DADA2. We also found consistent relationships between community diversity and environmental parameters. The Shannon index in groups B and D was negatively correlated in depth, but only group B was positively correlated with water content (Spearman, p < 0.05).

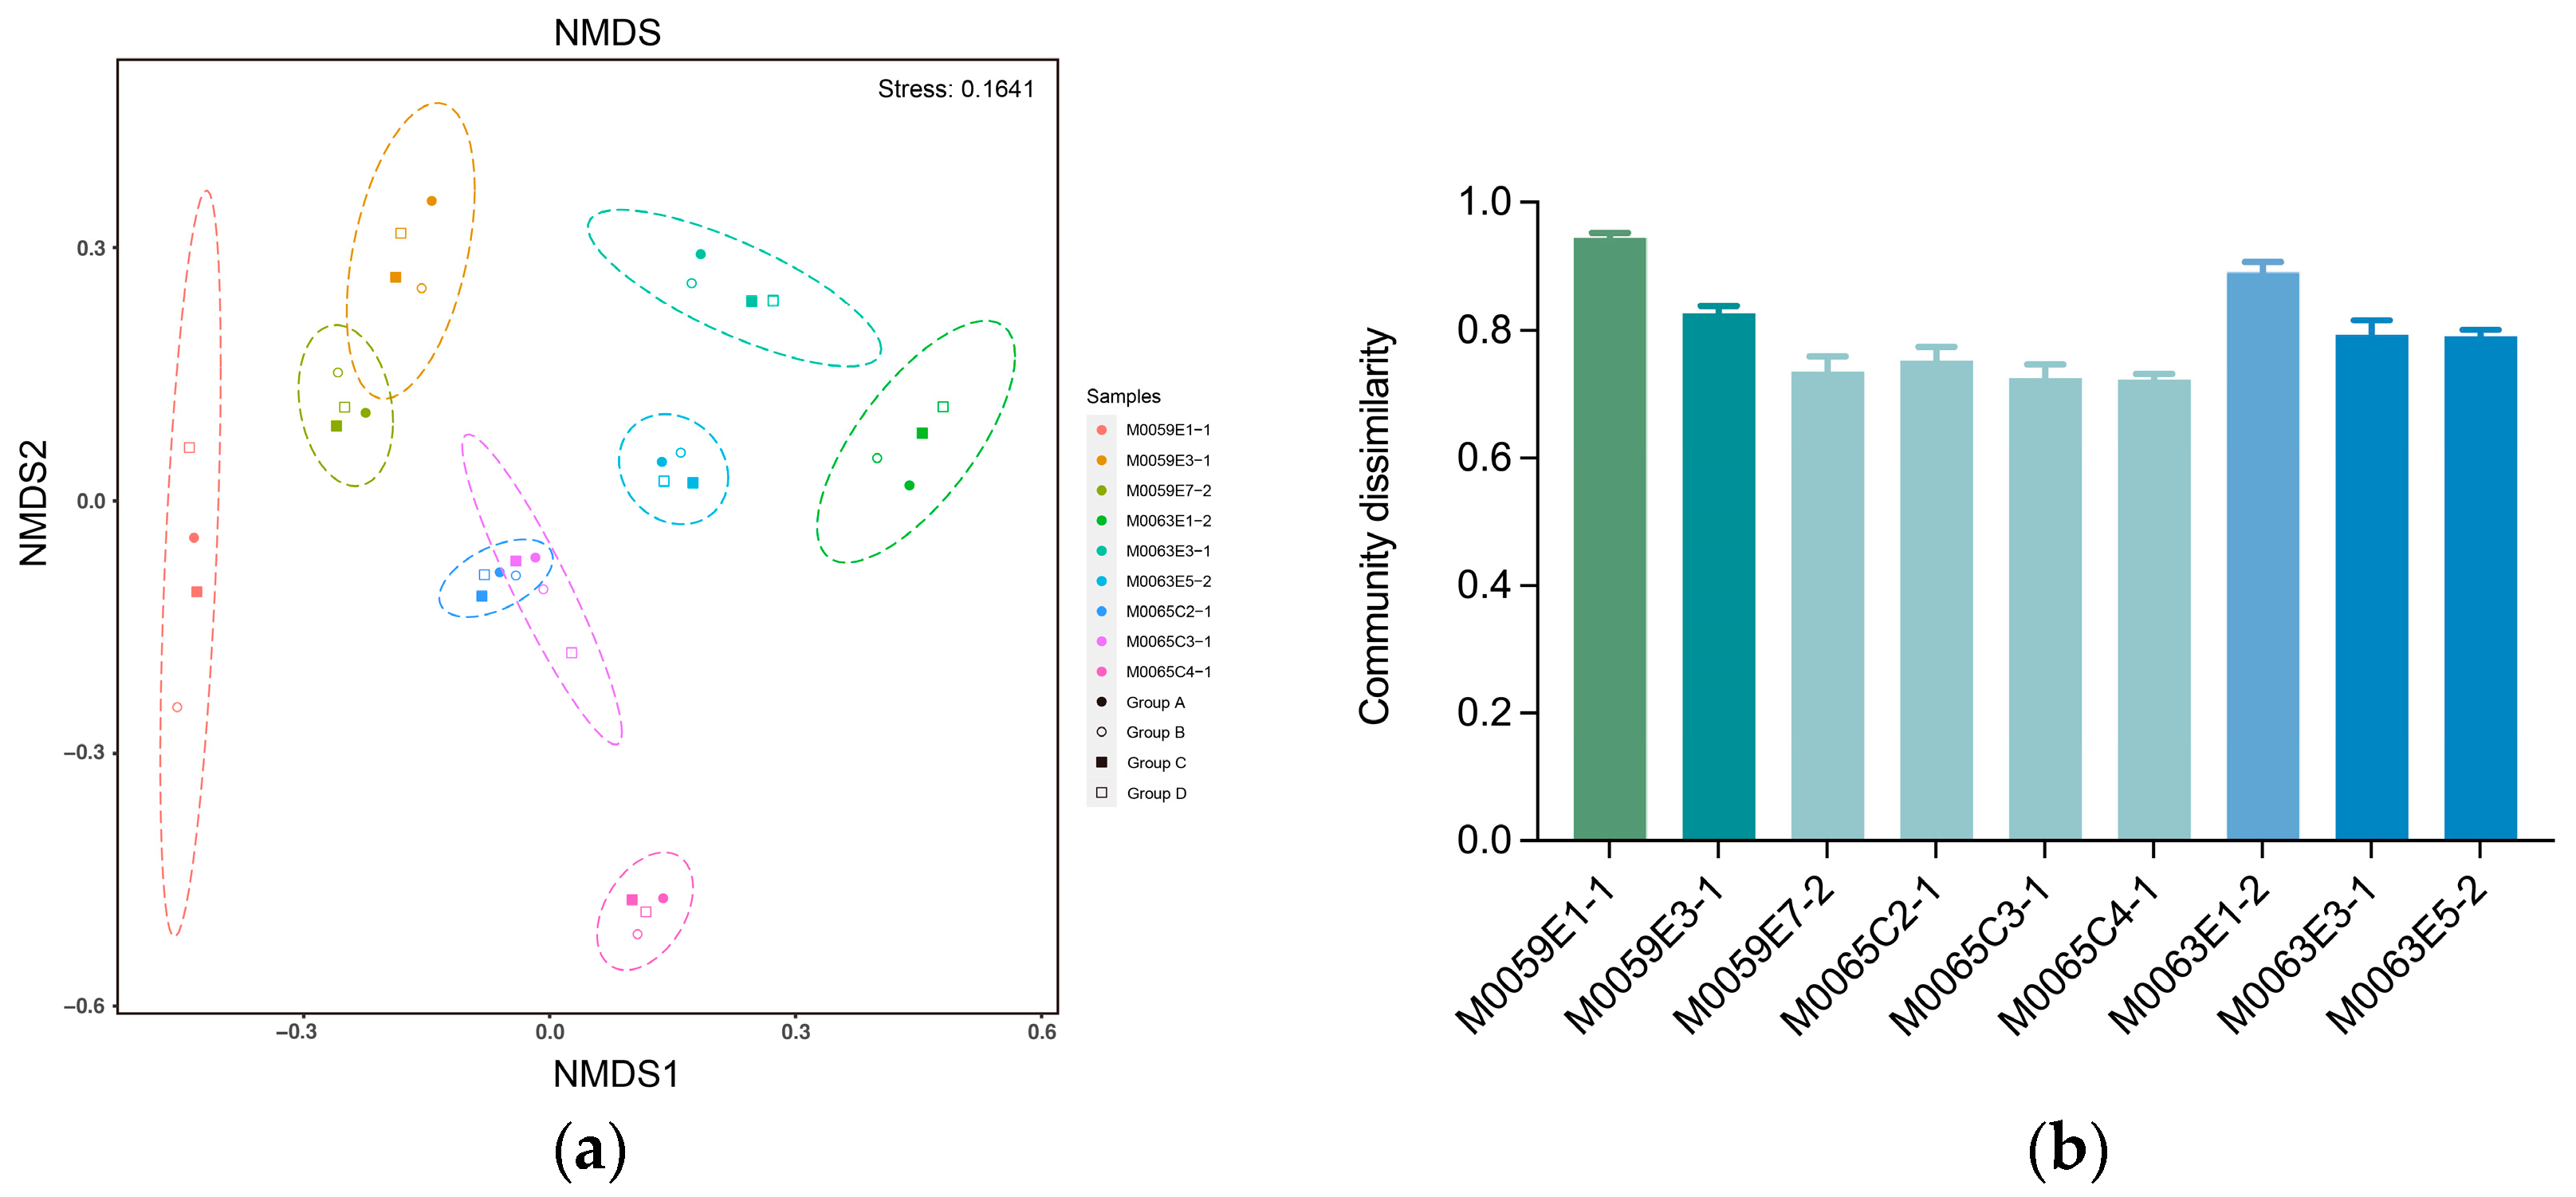
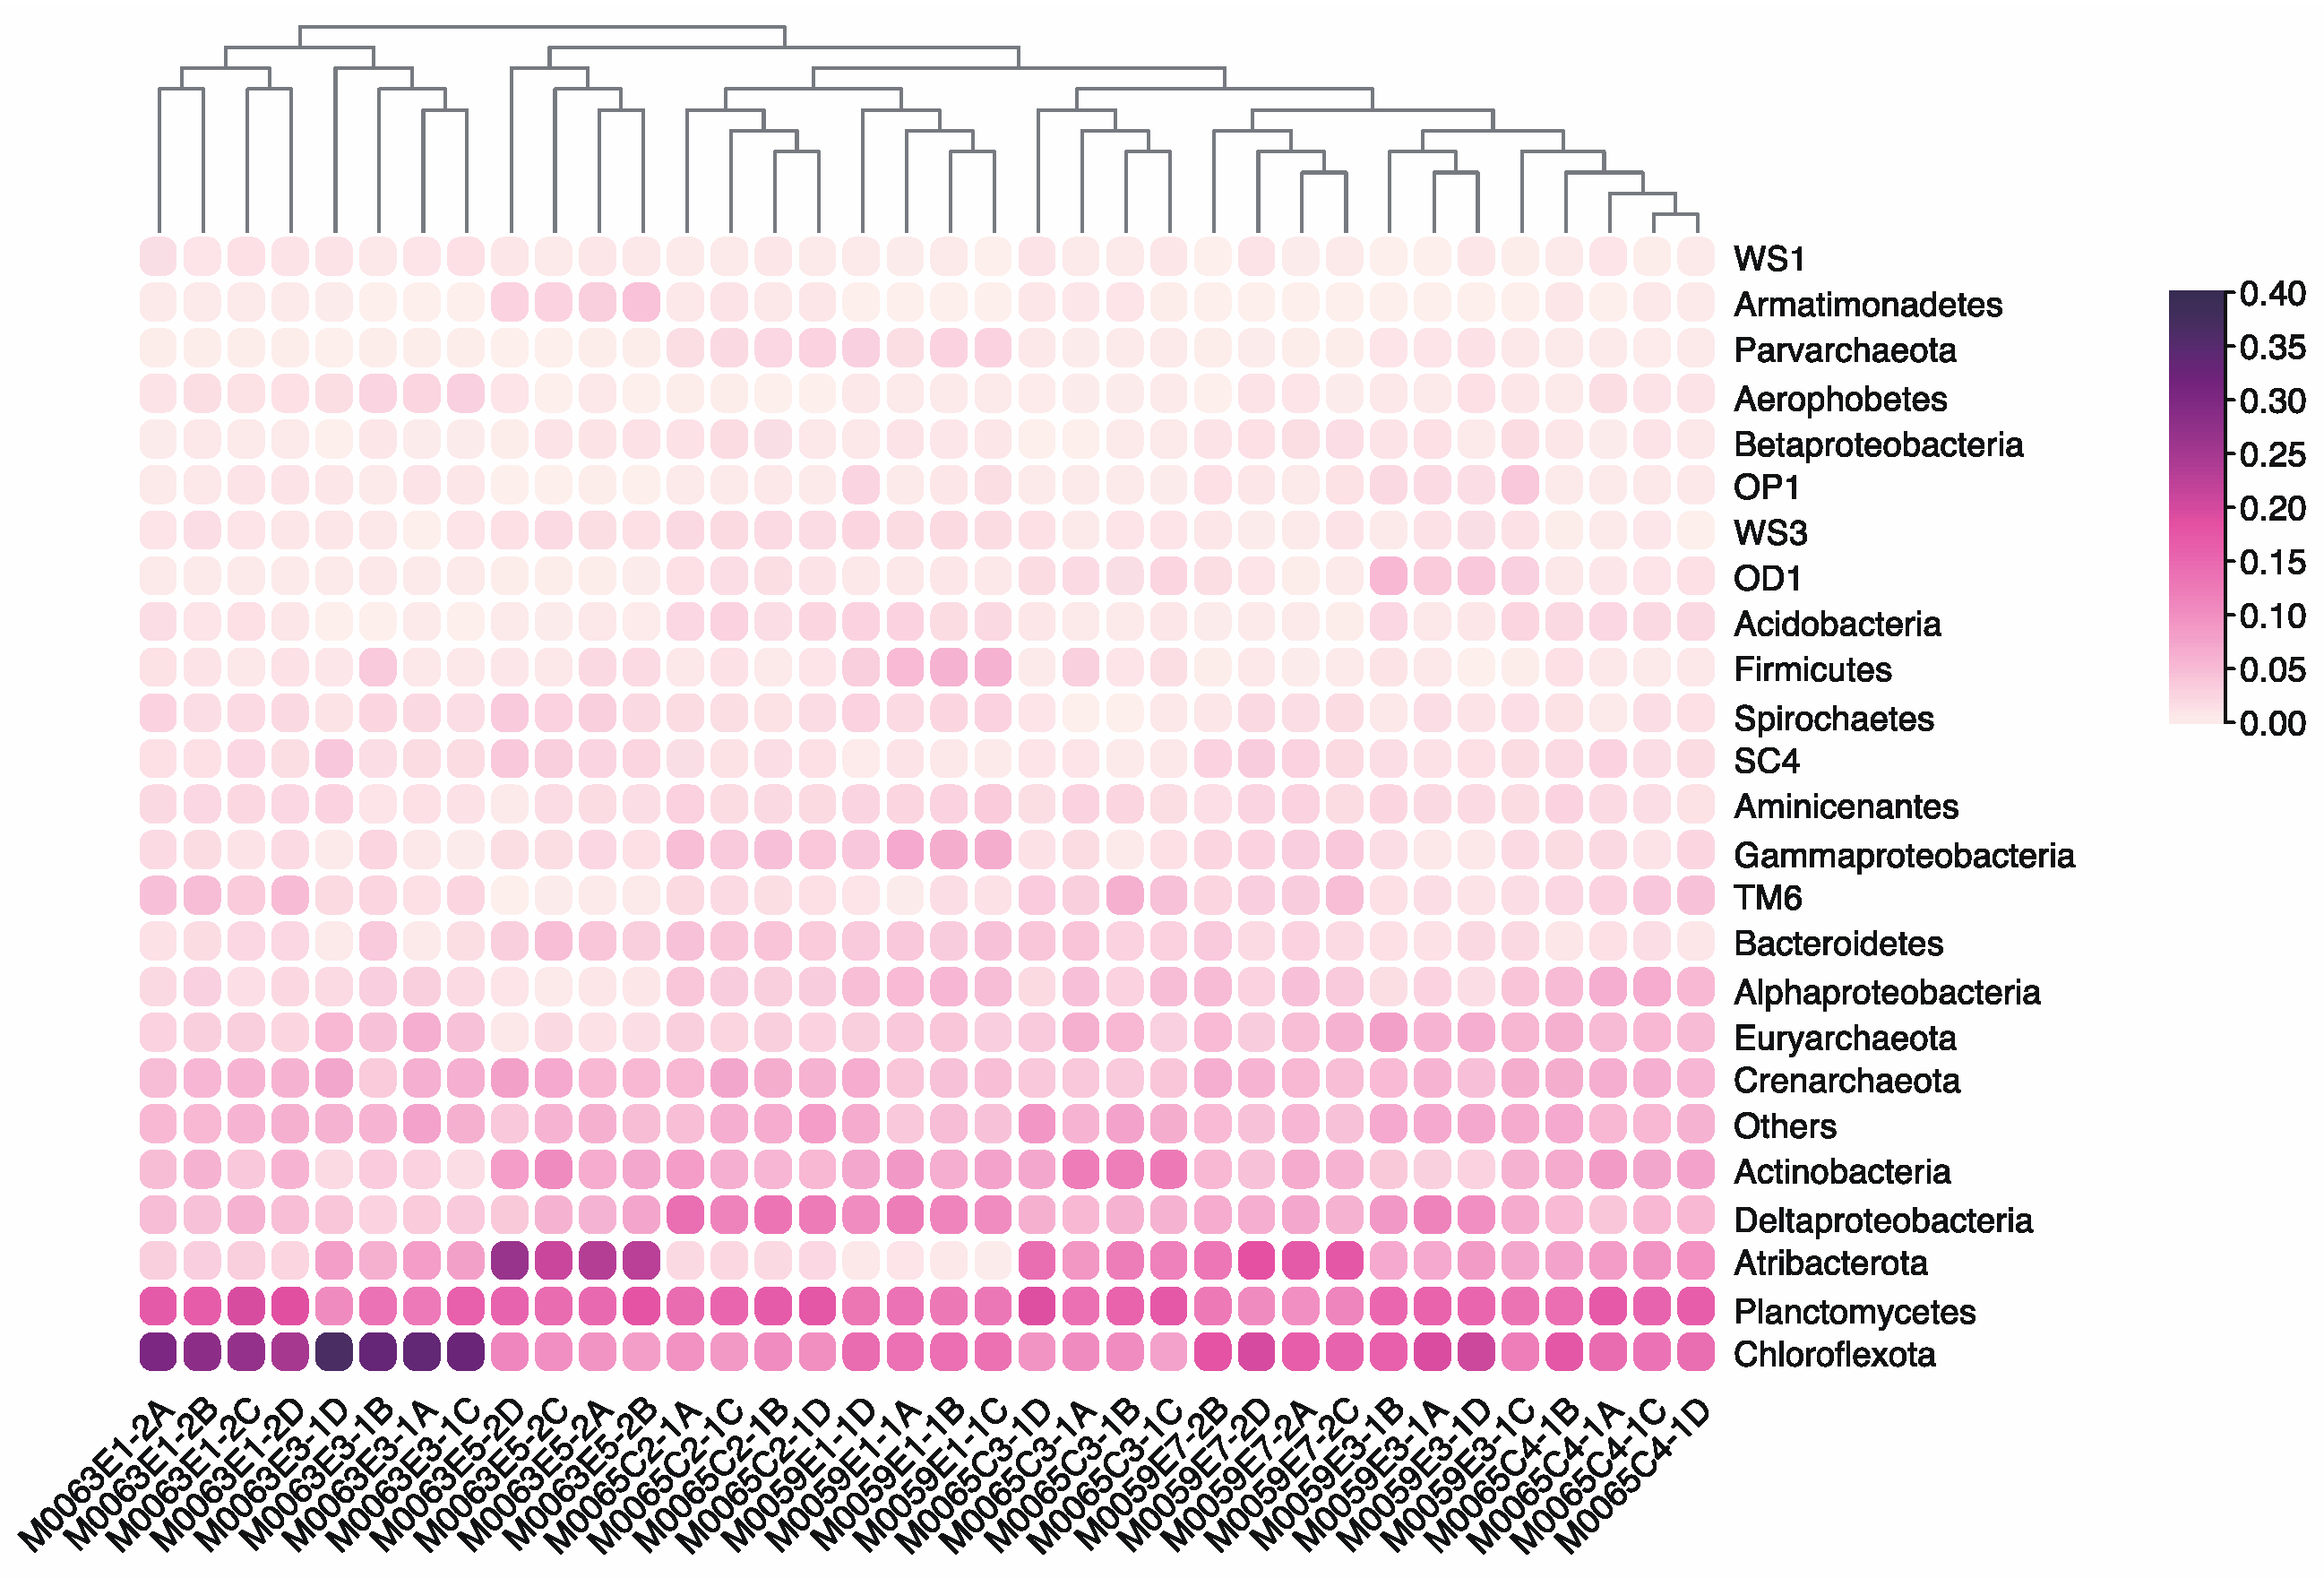
3.4. Effect of Grinding Beads on the Microbial Community Composition

Non-metric multidimensional scaling analysis showed that inter-sample variation was larger than that among the different groups of grinding beads (Figure 4a). Community dissimilarities among different groups of grinding beads for the same sample were calculated using the Bray–Curtis matrix (Figure 4b). Dramatic differences were observed among samples. Community dissimilarity caused by the grinding beads was significantly positively correlated with the cell abundance and water content but negatively correlated with the depth (Spearman, p = 0.036, p = 3.3 × 10⁻⁵, and p = 0.036, respectively).
The phyla Chloroflexota, Planctomycetes, Proteobacteria, Atribacteria (candidate phylum OP9 and JS1), and Actinobacteria were the most abundant members of the Baltic Sea sediment microbial community, comprising 59.88–74.88% of the sequences. Some rare (relative abundance < 5%) but widespread clades such as Aminicenantes, candidate SC4, and OD1 were detected in this study (Figure 5). Although there was no significant variation in the microbial communities recovered with the four groups of grinding beads from the phylum to the family level, a genus level comparison revealed many unique taxa among the different groups (Figure 6a). Group B obtained more unique genera than the other groups of beads. Generally, the unique genera were rare taxa, except for two unique genera in group B belonging to Stenotrophomonas (Gammaproteobacteria) and Leptotrichia (Fusobacteria) with contributions of >1% in M0065C3-1. Several genera (Streptococcus, Veillonella, Tepidibacter, and Ilumatobacter) affiliated with Firmicutes or Actinobacteria were observed for at least two of the groups of beads but were absent with group D. Overall, group B recovered the most diverse community among the four groups of beads. Group D was likely not suitable for studying the microbial diversity of the Baltic Sea sub-seafloor sediment.
Redundancy analysis was used to study the relationship between the microbial community and parameters (Figure 6b). Among the measured factors, only depth below the seafloor could significantly explain the distribution patterns of the microbial communities inhabiting the sub-seafloor sediment of the Baltic Sea (F = 1.76, p = 0.023). The relative abundances of Atribacteria and the miscellaneous Crenarchaeotic group (MCG) were positively correlated with depth (p < 0.05). By contrast, the percentage of Deltaproteobacteria decreased with depth at both M0059E and M0063E. The opposite vertical distribution pattern was observed for Chloroplast at M0059E and M0065C.

4. Discussion

The addition of a grinding step with beads increases DNA extraction from sediments [11,27,44]. The beads can break up the clay structure and large organic particles, which enables more efficient penetration of lysis reagents and release of DNA from aggregates and organic debris [30]. Compared with other methods of mechanical disruption of cells (such as sonication), the lysis process with beads is simpler and less expensive. Consequently, grinding with beads is widely used in DNA extraction for diverse environmental samples [26,29,31]. The grinding beads supplied with the Fast DNA® SPIN Kit for soil (1.2 g of 1.4-mm ceramic beads, 0.1-mm silica beads, and one 4-mm glass bead) are designed to extract DNA from a wide range of sources, including soil, marine sediment, feces, sand, and sludge [26,45,46,47]. However, the diameter and material of the grinding beads needs to be optimized for specific sources, such as the sub-seafloor sediment from the Baltic Sea used in the present study. The Baltic Sea has served as a depositional sink throughout at least the last glacial cycle, and its sediment is a unique high-resolution archive of paleoenvironmental history [48]. Extraction of DNA from this sediment is challenging because of the high ancient organic matter content and high biosiliceous clay composition, which can adsorb cells and DNA and affect the recovery [49]. Consequently, beads with small diameters (0.1 mm and 0.5 mm) and low-densities (glass) were selected in this study for DNA extraction from sub-seafloor sediment of the Baltic Sea.
The nine samples used in this study varied in biomass, TOC content, salinity, depth, and other parameters, which led to distinct DNA yields with the four groups of grinding beads (Figure 3a). Unexpectedly, significant differences were observed in the DNA yields obtained with the different groups of grinding beads for one sample that had a high cell quantity and two samples that had low cell quantities. The group A and C beads performed well for low biomass samples, which indicated that cell desorption might play an important role in increasing the DNA yield because these two groups contained more beads with large diameters [50]. When the sample contained large quantities of cells, mixtures of 0.1-mm and 0.5-mm glass beads could both sufficiently desorb cells from clay or large organic particles and break cells with tough cell walls [11,51]. There was a positive correlation between the DNA yield and microbial abundance (Figure 3b) [27,49,52]. However, the good fit between the biomass and DNA yield with the group B beads suggested that the mixture of 0.1-mm and 0.5-mm glass beads was the best choice for DNA extraction from sediments with a high proportion of fine clay minerals. By contrast, the significantly lower DNA yields obtained with group D beads indicated that beads that were too similar in size to the clay-rich sediments might cause insufficient homogenization and desorption. The grinding beads did not appear to affect the DNA purity. Positive relationships between DNA purity and the sulfate concentration suggested that the composition of organic matter in the sediments could affect the residual contamination in the extracted DNA because the sulfate concentration is an indicator of the proportion of recalcitrant organic matter in deep sea sediments [53].
Prokaryotic 16S rRNA gene sequencing results revealed that grinding beads did not affect the richness and evenness of microbial communities in the sub-seafloor sediments from the Baltic Sea. However, among the nine samples, a dramatic difference was observed for the intra sample average community dissimilarity for the four groups of grinding beads (Figure 4b), and this was positively correlated with the microbial abundance (Spearman, p = 0.036). This result suggests that grinding beads can influence the beta diversity of microbial communities, and the degree of this effect increases as the biomass content increases. Furthermore, different groups of grinding beads produced many unique clades at the genus level (Figure 6a). The genus Stenotrophomonas can efficiently colonize plants, humans, and marine sediments, partly because of the biosynthesis of variable outer membrane lipopolysaccharides (LPS) [54], which can protect the cell structure and absorb DNA [55,56]. The presence of Stenotrophomonas and high yields of DNA with group B suggested that the mixture of 0.1-mm and 0.5-mm glass beads could efficiently crush LPS and improve the DNA recovery. Similarly, another unique genus observed with group B (Leptotrichia) can also produce diverse LPS [57]. Previous research has indicated that grinding with beads can increase the extraction of DNA from Gram-positive bacteria [58]. The absence of several genera belonging to Firmicutes and Actinobacteria in the DNA obtained with the group D beads suggests that small grinding beads (ø = 0.1 mm) might not break the tougher cell walls of certain Gram-positive strains.
Previous studies have found that Chloroflexota, Planctomycetes, Atribacteria, and Crenarchaeota (MCG) are common in sub-seafloor ecosystems [59,60,61]. In the Baltic Sea, the above clades were also widespread with high relative abundances. The proportions of Atribacteria and MCG greatly increased with depth, which indicated that they adapted to the environment deep under the seafloor. Moreover, Deltaproteobacteria, which are typical heterotrophic anaerobes and sulfate-reducing bacteria [62], were abundant in all samples. An unexpectedly high percentage of green algae belonging to Cyanobacteria were detected in the sediment meters under the seafloor. Growth of Cyanobacteria is generally considered to depend on photosynthesis, but increasing evidence in recent years has found large numbers of Cyanobacteria surviving in dark environments [63,64,65,66]. The green algae found in this study might have been buried by rapidly deposited particles in the Baltic Sea [66] and survived by switching to heterotrophic metabolism [63]. A redundancy analysis revealed that only depth was significantly correlated with the microbial community (Figure 6b). In addition to typical limiting factors (e.g., TOC content, sulfate, ammonium, phosphate, and salinity), some unknown parameters probably play key roles in controlling the distribution patterns of prokaryotic communities in sub-seafloor ecosystems.

5. Conclusions

In conclusion, this study demonstrates that the composition of grinding beads can influence the quality of DNA extracted from organic-matter- and biosiliceous-clay-rich samples. In this study, these types of samples were represented by sub-seafloor sediment from the Baltic Sea. A mixture of 0.5-mm and 0.1-mm grinding beads produced high DNA yields and recovered more unique taxa, and may be more suitable than other beads for extraction of DNA from the samples used in this study. This advantage might be magnified in samples with high biomass. Extraction with only small beads might lead to underestimation for certain Gram-positive strains. Overall, the findings of this study provide an assessment of grinding beads with different physicochemical characteristics for DNA extraction from sub-seafloor sediments and an overview of the diversity of microorganisms in the deep biosphere of the Baltic Sea.

Supplementary Materials

The following supporting information can be downloaded at: https://www.mdpi.com/article/10.3390/microorganisms10122505/s1, Figure S1: The main physicochemical parameters of M0059E, M0065C, and M0063E with changes in the sediment depth [33,43]; Figure S2: A scheme of the DNA extraction process; Figure S3: Purity of DNA recovered from sediment samples obtained at different boreholes; Figure S4: Comparison of microbial community diversity between boreholes and samples. Table S1: Microbial abundance, physical, and chemical properties of sediment samples; Table S2: Read numbers of 16S rRNA genes of microbial communities obtained using different groups of beads for lysis extraction; Table S3: Alpha diversity indices based on DADA2.

Author Contributions

Conceptualization, R.Z.; methodology, H.C., L.C. and M.H.; software, J.N. and L.W.; validation, J.N., L.W., H.C., L.C., M.H. and R.Z.; formal analysis, J.N. and L.W.; investigation, H.C., L.C., M.H. and L.W.; resources, R.Z.; data curation, J.N. and L.W.; writing—original draft preparation, J.N. and L.W.; writing—review and editing, J.N., L.W., L.C. and R.Z.; visualization, J.N. and L.W.; supervision, R.Z.; project administration, R.Z.; funding acquisition, R.Z. All authors have read and agreed to the published version of the manuscript.

Funding

This research was funded by National Key Research and Development Program of China (2020YFA0608300, 2021YFE0193000) and Natural Science Foundation of China (91951209, 42188102).

Institutional Review Board Statement

Not applicable.

Informed Consent Statement

Not applicable.

Data Availability Statement

The raw sequences of 16S rRNA gene were deposited in the NCBI GenBank database with the accession number PRJNA897722.

Acknowledgments

This research used samples provided by the Integrated Ocean Drilling Program (IODP) Expedition 347. We would like to thank the drilling staff and crew of the R/V Greatship Manisha, co-chiefs Bo B. Jørgensen and Thomas Andrén, expedition project manager Carol Cotterill, and the scientific party of IODP expedition 347.

Conflicts of Interest

The authors declare no conflict of interest.

References

  1. Martin-Laurent, F.; Philippot, L.; Hallet, S.; Chaussod, R.; Germon, J.C.; Soulas, G.; Catroux, G. DNA Extraction from Soils: Old Bias for New Microbial Diversity Analysis Methods. Appl. Environ. Microb. 2001, 67, 4397. [Google Scholar] [CrossRef] [Green Version]
  2. Lipp, J.S.; Morono, Y.; Inagaki, F.; Hinrichs, K.-U. Significant Contribution of Archaea to Extant Biomass in Marine Subsurface Sediments. Nature 2008, 454, 991–994. [Google Scholar] [CrossRef] [PubMed]
  3. Morono, Y.; Terada, T.; Hoshino, T.; Inagaki, F. Hot-Alkaline DNA Extraction Method for Deep-Subseafloor Archaeal Communities. Appl. Environ. Microb. 2014, 80, 1985–1994. [Google Scholar] [CrossRef] [PubMed] [Green Version]
  4. Carrigg, C.; Rice, O.; Kavanagh, S.; Collins, G.; O’Flaherty, V. DNA Extraction Method Affects Microbial Community Profiles from Soils and Sediment. Appl. Microbiol. Biotechnol. 2007, 77, 955–964. [Google Scholar] [CrossRef] [PubMed]
  5. Morgan, J.L.; Darling, A.E.; Eisen, J.A. Metagenomic Sequencing of an In Vitro-Simulated Microbial Community. PLoS ONE 2010, 5, e10209. [Google Scholar] [CrossRef] [PubMed]
  6. Salonen, A.; Nikkilä, J.; Jalanka-Tuovinen, J.; Immonen, O.; Rajilić-Stojanović, M.; Kekkonen, R.A.; Palva, A.; de Vos, W.M. Comparative Analysis of Fecal DNA Extraction Methods with Phylogenetic Microarray: Effective Recovery of Bacterial and Archaeal DNA Using Mechanical Cell Lysis. J. Microbiol. Methods 2010, 81, 127–134. [Google Scholar] [CrossRef] [PubMed]
  7. Ariefdjohan, M.W.; Savaiano, D.A.; Nakatsu, C.H. Comparison of DNA Extraction Kits for PCR-DGGE Analysis of Human Intestinal Microbial Communities from Fecal Specimens. Nutr. J. 2010, 9, 23. [Google Scholar] [CrossRef] [Green Version]
  8. Scupham, A.J.; Jones, J.A.; Wesley, I.V. Comparison of DNA Extraction Methods for Analysis of Turkey Cecal Microbiota. J. Appl. Microbiol. 2007, 102, 401–409. [Google Scholar] [CrossRef]
  9. Inceoglu, O.; Hoogwout, E.F.; Hill, P.; Elsas, J.D. van Effect of DNA Extraction Method on the Apparent Microbial Diversity of Soil. Appl. Environ. Microb. 2010, 76, 3378–3382. [Google Scholar] [CrossRef] [Green Version]
  10. Yuan, S.; Cohen, D.B.; Ravel, J.; Abdo, Z.; Forney, L.J. Evaluation of Methods for the Extraction and Purification of DNA from the Human Microbiome. PLoS ONE 2012, 7, e33865. [Google Scholar] [CrossRef]
  11. Guo, F.; Zhang, T. Biases during DNA Extraction of Activated Sludge Samples Revealed by High Throughput Sequencing. Appl. Microbiol. Biotechnol. 2013, 97, 4607–4616. [Google Scholar] [CrossRef] [PubMed] [Green Version]
  12. Alain, K.; Callac, N.; Ciobanu, M.-C.; Reynaud, Y.; Duthoit, F.; Jebbar, M. DNA Extractions from Deep Subseafloor Sediments: Novel Cryogenic-Mill-Based Procedure and Comparison to Existing Protocols. J. Microbiol. Methods 2011, 87, 355–362. [Google Scholar] [CrossRef] [PubMed] [Green Version]
  13. Reed, D.W.; Fujita, Y.; Delwiche, M.E.; Blackwelder, D.B.; Sheridan, P.P.; Uchida, T.; Colwell, F.S. Microbial Communities from Methane Hydrate-Bearing Deep Marine Sediments in a Forearc Basin. Appl. Environ. Microbiol. 2002, 68, 3759–3770. [Google Scholar] [CrossRef] [PubMed] [Green Version]
  14. Roose-Amsaleg, C.L.; Garnier-Sillam, E.; Harry, M. Extraction and Purification of Microbial DNA from Soil and Sediment Samples. Appl. Soil Ecol. 2001, 18, 47–60. [Google Scholar] [CrossRef]
  15. Leff, L.G.; Dana, J.R.; McArthur, J.V.; Shimkets, L.J. Comparison of Methods of DNA Extraction from Stream Sediments. Appl. Environ. Microb. 1995, 61, 1141–1143. [Google Scholar] [CrossRef] [PubMed] [Green Version]
  16. Courtois, S.; Frostegård, Å.; Göransson, P.; Depret, G.; Jeannin, P.; Simonet, P. Quantification of Bacterial Subgroups in Soil: Comparison of DNA Extracted Directly from Soil or from Cells Previously Released by Density Gradient Centrifugation. Environ. Microbiol. 2001, 3, 431–439. [Google Scholar] [CrossRef] [PubMed]
  17. Luna, G.M.; Dell’Anno, A.; Danovaro, R. DNA Extraction Procedure: A Critical Issue for Bacterial Diversity Assessment in Marine Sediments. Environ. Microbiol. 2006, 8, 308–320. [Google Scholar] [CrossRef]
  18. Steffan, R.J.; Goksøyr, J.; Bej, A.K.; Atlas, R.M. Recovery of DNA from Soils and Sediments. Appl. Environ. Microbiol. 1988, 54, 2908–2915. [Google Scholar] [CrossRef] [Green Version]
  19. Lindahl, V. Improved Soil Dispersion Procedures for Total Bacterial Counts, Extraction of Indigenous Bacteria and Cell Survival. J. Microbiol. Methods 1996, 25, 279–286. [Google Scholar] [CrossRef]
  20. Gabor, E.M.; Vries, E.J.; Janssen, D.B. Efficient Recovery of Environmental DNA for Expression Cloning by Indirect Extraction Methods. FEMS Microbiol. Ecol. 2003, 44, 153–163. [Google Scholar] [CrossRef]
  21. Saidi-Mehrabad, A.; Neuberger, P.; Cavaco, M.; Froese, D.; Lanoil, B. Optimization of Subsampling, Decontamination, and DNA Extraction of Difficult Peat and Silt Permafrost Samples. Sci. Rep. 2020, 10, 14295. [Google Scholar] [CrossRef] [PubMed]
  22. Kuske, C.R.; Banton, K.L.; Adorada, D.L.; Stark, P.C.; Hill, K.K.; Jackson, P.J. Small-Scale DNA Sample Preparation Method for Field PCR Detection of Microbial Cells and Spores in Soil. Appl. Environ. Microb. 1998, 64, 2463–2472. [Google Scholar] [CrossRef] [PubMed] [Green Version]
  23. Robe, P.; Nalin, R.; Capellano, C.; Vogel, T.M.; Simonet, P. Extraction of DNA from Soil. Eur. J. Soil Biol. 2003, 39, 183–190. [Google Scholar] [CrossRef]
  24. Moré, M.I.; Herrick, J.B.; Silva, M.C.; Ghiorse, W.C.; Madsen, E.L. Quantitative Cell Lysis of Indigenous Microorganisms and Rapid Extraction of Microbial DNA from Sediment. Appl. Environ. Microbiol. 1994, 60, 1572–1580. [Google Scholar] [CrossRef] [Green Version]
  25. Whitehouse, C.A.; Hottel, H.E. Comparison of Five Commercial DNA Extraction Kits for the Recovery of Francisella Tularensis DNA from Spiked Soil Samples. Mol. Cell Probe 2007, 21, 92–96. [Google Scholar] [CrossRef]
  26. Vishnivetskaya, T.A.; Layton, A.C.; Lau, M.C.Y.; Chauhan, A.; Cheng, K.R.; Meyers, A.J.; Murphy, J.R.; Rogers, A.W.; Saarunya, G.S.; Williams, D.E.; et al. Commercial DNA Extraction Kits Impact Observed Microbial Community Composition in Permafrost Samples. FEMS Microbiol. Ecol. 2014, 87, 217–230. [Google Scholar] [CrossRef]
  27. Miller, D.N.; Bryant, J.E.; Madsen, E.L.; Ghiorse, W.C. Evaluation and Optimization of DNA Extraction and Purification Procedures for Soil and Sediment Samples. Appl. Environ. Microbiol. 1999, 65, 4715–4724. [Google Scholar] [CrossRef] [Green Version]
  28. Zhang, B.; Brock, M.; Arana, C.; Dende, C.; van Oers, N.S.; Hooper, L.V.; Raj, P. Impact of Bead-Beating Intensity on the Genus- and Species-Level Characterization of the Gut Microbiome Using Amplicon and Complete 16S RRNA Gene Sequencing. Front. Cell Infect. Microbiol. 2021, 11, 678522. [Google Scholar] [CrossRef]
  29. Bürgmann, H.; Pesaro, M.; Widmer, F.; Zeyer, J. A Strategy for Optimizing Quality and Quantity of DNA Extracted from Soil. J. Microbiol. Methods 2001, 45, 7–20. [Google Scholar] [CrossRef]
  30. Vanysacker, L.; Declerck, S.A.J.; Hellemans, B.; Meester, L.D.; Vankelecom, I.; Declerck, P. Bacterial Community Analysis of Activated Sludge: An Evaluation of Four Commonly Used DNA Extraction Methods. Appl. Microbiol. Biotechnol. 2010, 88, 299–307. [Google Scholar] [CrossRef]
  31. Lever, M.A.; Torti, A.; Eickenbusch, P.; Michaud, A.B.; Šantl-Temkiv, T.; Jørgensen, B.B. A Modular Method for the Extraction of DNA and RNA, and the Separation of DNA Pools from Diverse Environmental Sample Types. Front. Microbiol. 2015, 6, 476. [Google Scholar] [CrossRef] [PubMed] [Green Version]
  32. Andrén, T.; Björck, S.; Andrén, E.; Conley, D.; Zillén, L.; Anjar, J. The Baltic Sea Basin; Central and East European Development Studies (CEEDES); Springer: Berlin/Heidelberg, Germany, 2011; pp. 75–97. [Google Scholar]
  33. Andrén, T.; Jørgensen, B.B.; Cotterill, C.; Green, S.; the IODP Expedition 347 Scientific Party. IODP Expedition 347: Baltic Sea Basin Paleoenvironment and Biosphere. Sci. Drill. 2015, 20, 1–12. [Google Scholar] [CrossRef] [Green Version]
  34. Andrén, T.; Jørgensen, B.B.; Cotterill, C.; the IODP347 Scientists. Baltic Sea paleoenvironment. In Proceedings of the Integrated Ocean Drilling Program, Kiel, Germany, 12 September–1 November 2014; Volume 347. [Google Scholar]
  35. Hardisty, D.S.; Riedinger, N.; Planavsky, N.J.; Asael, D.; Andren, T.; Jorgensen, B.B.; Lyons, T.W. A Holocene History of Dynamic Water Column Redox Conditions in the Landsort Deep, Baltic Sea. Am. J. Sci. 2016, 316, 713–745. [Google Scholar] [CrossRef] [Green Version]
  36. Parada, A.E.; Needham, D.M.; Fuhrman, J.A. Every Base Matters: Assessing Small Subunit RRNA Primers for Marine Microbiomes with Mock Communities, Time Series and Global Field Samples. Environ. Microbiol. 2015, 18, 1403–1414. [Google Scholar] [CrossRef] [PubMed]
  37. Apprill, A.; McNally, S.; Parsons, R.; Weber, L. Minor Revision to V4 Region SSU RRNA 806R Gene Primer Greatly Increases Detection of SAR11 Bacterioplankton. Aquat. Microbiol. Ecol. 2015, 75, 129–137. [Google Scholar] [CrossRef] [Green Version]
  38. Caporaso, J.G.; Kuczynski, J.; Stombaugh, J.; Bittinger, K.; Bushman, F.D.; Costello, E.K.; Fierer, N.; Peña, A.G.; Goodrich, J.K.; Gordon, J.I.; et al. QIIME Allows Analysis of High-Throughput Community Sequencing Data. Nat. Methods 2010, 7, 335–336. [Google Scholar] [CrossRef] [Green Version]
  39. Bokulich, N.A.; Subramanian, S.; Faith, J.J.; Gevers, D.; Gordon, J.I.; Knight, R.; Mills, D.A.; Caporaso, J.G. Quality-Filtering Vastly Improves Diversity Estimates from Illumina Amplicon Sequencing. Nat. Methods 2013, 10, 57–59. [Google Scholar] [CrossRef]
  40. Callahan, B.J.; McMurdie, P.J.; Rosen, M.J.; Han, A.W.; Johnson, A.J.A.; Holmes, S.P. DADA2: High-Resolution Sample Inference from Illumina Amplicon Data. Nat. Methods 2015, 13, 581–583. [Google Scholar] [CrossRef] [Green Version]
  41. Hammer, Ø.; Harper, D.A.T.; Ryan, P.D. Past: Paleontological Statistics Software Package for Education and Data Analysis. Palaeontol. Electron. 2001, 4, 4–9. [Google Scholar]
  42. Robeson, M.S.; O’Rourke, D.R.; Kaehler, B.D.; Ziemski, M.; Dillon, M.R.; Foster, J.T.; Bokulich, N.A. RESCRIPt: Reproducible Sequence Taxonomy Reference Database Management for the Masses. bioRxiv 2020, 17, e1009581. [Google Scholar]
  43. Cai, L.; Jørgensen, B.B.; Suttle, C.A.; He, M.; Cragg, B.A.; Jiao, N.; Zhang, R. Active and Diverse Viruses Persist in the Deep Sub-Seafloor Sediments over Thousands of Years. ISME J. 2019, 13, 1857–1864. [Google Scholar] [CrossRef] [PubMed] [Green Version]
  44. Maukonen, J.; Simões, C.; Saarela, M. The Currently Used Commercial DNA−extraction Methods Give Different Results of Clostridial and Actinobacterial Populations Derived from Human Fecal Samples. FEMS Microbiol. Ecol. 2012, 79, 697–708. [Google Scholar] [CrossRef] [PubMed]
  45. Ferrand, J.; Patron, K.; Legrand-Frossi, C.; Frippiat, J.-P.; Merlin, C.; Alauzet, C.; Lozniewski, A. Comparison of Seven Methods for Extraction of Bacterial DNA from Fecal and Cecal Samples of Mice. J. Microbiol. Methods 2014, 105, 180–185. [Google Scholar] [CrossRef] [PubMed]
  46. Knauth, S.; Schmidt, H.; Tippkötter, R. Comparison of Commercial Kits for the Extraction of DNA from Paddy Soils. Lett. Appl. Microbiol. 2013, 56, 222–228. [Google Scholar] [CrossRef] [PubMed]
  47. Jarosz, W.; Durant, J.-F.; Irenge, L.M.W.B.; Fogt-Wyrwas, R.; Mizgajska-Wiktor, H.; Gala, J.-L. Optimized DNA-Based Identification of Toxocara spp. Eggs in Soil and Sand Samples. Parasite Vector 2021, 14, 426. [Google Scholar] [CrossRef]
  48. Jørgensen, B.B.; Andrén, T.; Marshall, I.P.G. Sub−seafloor Biogeochemical Processes and Microbial Life in the Baltic Sea. Environ. Microbiol. 2020, 22, 1688–1706. [Google Scholar] [CrossRef] [Green Version]
  49. Frostegård, Å.; Courtois, S.; Ramisse, V.; Clerc, S.; Bernillon, D.; Gall, F.L.; Jeannin, P.; Nesme, X.; Simonet, P. Quantification of Bias Related to the Extraction of DNA Directly from Soils. Appl. Environ. Microb. 1999, 65, 5409–5420. [Google Scholar] [CrossRef] [Green Version]
  50. Gobbi, A.; Santini, R.G.; Filippi, E.; Ellegaard-Jensen, L.; Jacobsen, C.S.; Hansen, L.H. Quantitative and Qualitative Evaluation of the Impact of the G2 Enhancer, Bead Sizes and Lysing Tubes on the Bacterial Community Composition during DNA Extraction from Recalcitrant Soil Core Samples Based on Community Sequencing and QPCR. PLoS ONE 2019, 14, e0200979. [Google Scholar] [CrossRef] [Green Version]
  51. Rantakokko-Jalava, K.; Jalava, J. Optimal DNA Isolation Method for Detection of Bacteria in Clinical Specimens by Broad-Range PCR. J. Clin. Microbiol. 2002, 40, 4211–4217. [Google Scholar] [CrossRef] [Green Version]
  52. Zhou, J.; Bruns, M.A.; Tiedje, J.M. DNA Recovery from Soils of Diverse Composition. Appl. Environ. Microbiol. 1996, 62, 316–322. [Google Scholar] [CrossRef] [Green Version]
  53. Glombitza, C.; Egger, M.; Røy, H.; Jørgensen, B.B. Controls on Volatile Fatty Acid Concentrations in Marine Sediments (Baltic Sea). Geochim. Cosmochim. Acta 2019, 258, 226–241. [Google Scholar] [CrossRef]
  54. Ryan, R.P.; Monchy, S.; Cardinale, M.; Taghavi, S.; Crossman, L.; Avison, M.B.; Berg, G.; van der Lelie, D.; Dow, J.M. The Versatility and Adaptation of Bacteria from the Genus Stenotrophomonas. Nat. Rev. Microbiol. 2009, 7, 514–525. [Google Scholar] [CrossRef] [PubMed]
  55. Volossiouk, T.; Robb, E.J.; Nazar, R.N. Direct DNA Extraction for PCR-Mediated Assays of Soil Organisms. Appl. Environ. Microbiol. 1995, 61, 3972–3976. [Google Scholar] [CrossRef] [Green Version]
  56. Hasty, D.L.; Ofek, I.; Courtney, H.S.; Doyle, R.J. Multiple Adhesins of Streptococci. Infect. Immun. 1992, 60, 2147–2152. [Google Scholar] [CrossRef] [PubMed] [Green Version]
  57. Birkeland, N.K.; Hofstad, T. Oligosaccharides Obtained by Partial Hydrolysis of Lipopolysaccharides from Leptotrichia Buccalis. Eur. J. Oral Sci. 1985, 93, 432–435. [Google Scholar] [CrossRef]
  58. Knudsen, B.E.; Bergmark, L.; Munk, P.; Lukjancenko, O.; Priemé, A.; Aarestrup, F.M.; Pamp, S.J. Impact of Sample Type and DNA Isolation Procedure on Genomic Inference of Microbiome Composition. Msystems 2016, 1, e00095-16. [Google Scholar] [CrossRef] [Green Version]
  59. Nobu, M.K.; Dodsworth, J.A.; Murugapiran, S.K.; Rinke, C.; Gies, E.A.; Webster, G.; Schwientek, P.; Kille, P.; Parkes, R.J.; Sass, H.; et al. Phylogeny and Physiology of Candidate Phylum ‘Atribacteria’ (OP9/JS1) Inferred from Cultivation-Independent Genomics. ISME J. 2016, 10, 273–286. [Google Scholar] [CrossRef] [PubMed]
  60. Parkes, R.J.; Cragg, B.; Roussel, E.; Webster, G.; Weightman, A.; Sass, H. A Review of Prokaryotic Populations and Processes in Sub-Seafloor Sediments, Including Biosphere: Geosphere Interactions. Mar. Geol. 2014, 352, 409–425. [Google Scholar] [CrossRef]
  61. Fullerton, H.; Moyer, C.L. Comparative Single-Cell Genomics of Chloroflexi from the Okinawa Trough Deep-Subsurface Biosphere. Appl. Environ. Microbiol. 2016, 82, 3000–3008. [Google Scholar] [CrossRef] [Green Version]
  62. Petro, C.; Zäncker, B.; Starnawski, P.; Jochum, L.M.; Ferdelman, T.G.; Jørgensen, B.B.; Røy, H.; Kjeldsen, K.U.; Schramm, A. Marine Deep Biosphere Microbial Communities Assemble in Near-Surface Sediments in Aarhus Bay. Front. Microbiol. 2019, 10, 758. [Google Scholar] [CrossRef] [Green Version]
  63. Puente-Sánchez, F.; Arce-Rodríguez, A.; Oggerin, M.; García-Villadangos, M.; Moreno-Paz, M.; Blanco, Y.; Rodríguez, N.; Bird, L.; Lincoln, S.A.; Tornos, F.; et al. Viable Cyanobacteria in the Deep Continental Subsurface. Proc. Natl. Acad. Sci. USA 2018, 115, 10702–10707. [Google Scholar] [CrossRef] [PubMed] [Green Version]
  64. Bianchi, T.S.; Engelhaupt, E.; Westman, P.; Andrén, T.; Rolff, C.; Elmgren, R. Cyanobacterial Blooms in the Baltic Sea: Natural or Human−induced? Limnol. Oceanogr. 2000, 45, 716–726. [Google Scholar] [CrossRef]
  65. Poutanen, E.-L.; Nikkil, K. Carotenoid Pigments as Tracers of Cyanobacterial Blooms in Recent and Post-Glacial Sediments of the Baltic Sea. Ambio J. Hum. Environ. 2001, 30, 179–183. [Google Scholar] [CrossRef]
  66. Funkey, C.P.; Conley, D.J.; Reuss, N.S.; Humborg, C.; Jilbert, T.; Slomp, C.P. Hypoxia Sustains Cyanobacteria Blooms in the Baltic Sea. Environ. Sci. Technol. 2014, 48, 2598–2602. [Google Scholar] [CrossRef] [PubMed]
Figure 1. (a) Coring sites of the IODP drilling expedition 347 with the specific holes sampled. (b) The picture of the neighbor section of sediment samples used in this study. WD: water depth, mbsf: meters below seafloor.
Microorganisms 10 02505 g001
Figure 2. (a) Four combinations of grinding beads. (b) Specific parameters for each combination of grinding beads.
Microorganisms 10 02505 g002
Figure 3. (a) For the same sediment sample, the differences in DNA concentrations extracted by four grinding bead combinations. (b) Relationship between DNA concentration and microbial abundance (log10 transformed), p < 0.05 by linear regression. (c) The differences in normalized DNA concentrations extracted by four grinding bead combinations. The line in data plots indicate median value with standard deviation (SD). Asterisks denote significance, “*” represent p < 0.05, “**” represent p < 0.01, respectively.
Microorganisms 10 02505 g003
Figure 4. (a) A NMDS analysis of a Bray−Curtis dissimilarity matrix. The 95% confidence ellipse was added for each sample. (b) Dissimilarities among different groups of grinding beads from the same sample. The line in data plots indicate median value with SD; different colors indicate that there is a significant difference between the samples (p < 0.05).
Microorganisms 10 02505 g004
Figure 5. Comparison of the phylogenetic composition at phylum level. The relative abundance is visualized as the changes of colors.
Microorganisms 10 02505 g005
Figure 6. (a) Venn diagram displaying the number of unique and shared genus for different combinations of grinding beads. (b) Redundancy analysis of ASV abundance constrained by the depth, TOC content (%), pH, concentrations of SO42− (mM) and PO43− (mM). Black labels indicate samples from different boreholes, blue labels indicate dominant taxa at the class level.
Microorganisms 10 02505 g006
Publisher’s Note: MDPI stays neutral with regard to jurisdictional claims in published maps and institutional affiliations.

