
View from the Top: Insights into the Diversity and Community Assembly of Ectomycorrhizal and Saprotrophic Fungi along an Altitudinal Gradient in Chinese Boreal Larix gmelinii-Dominated Forests
 , , , and
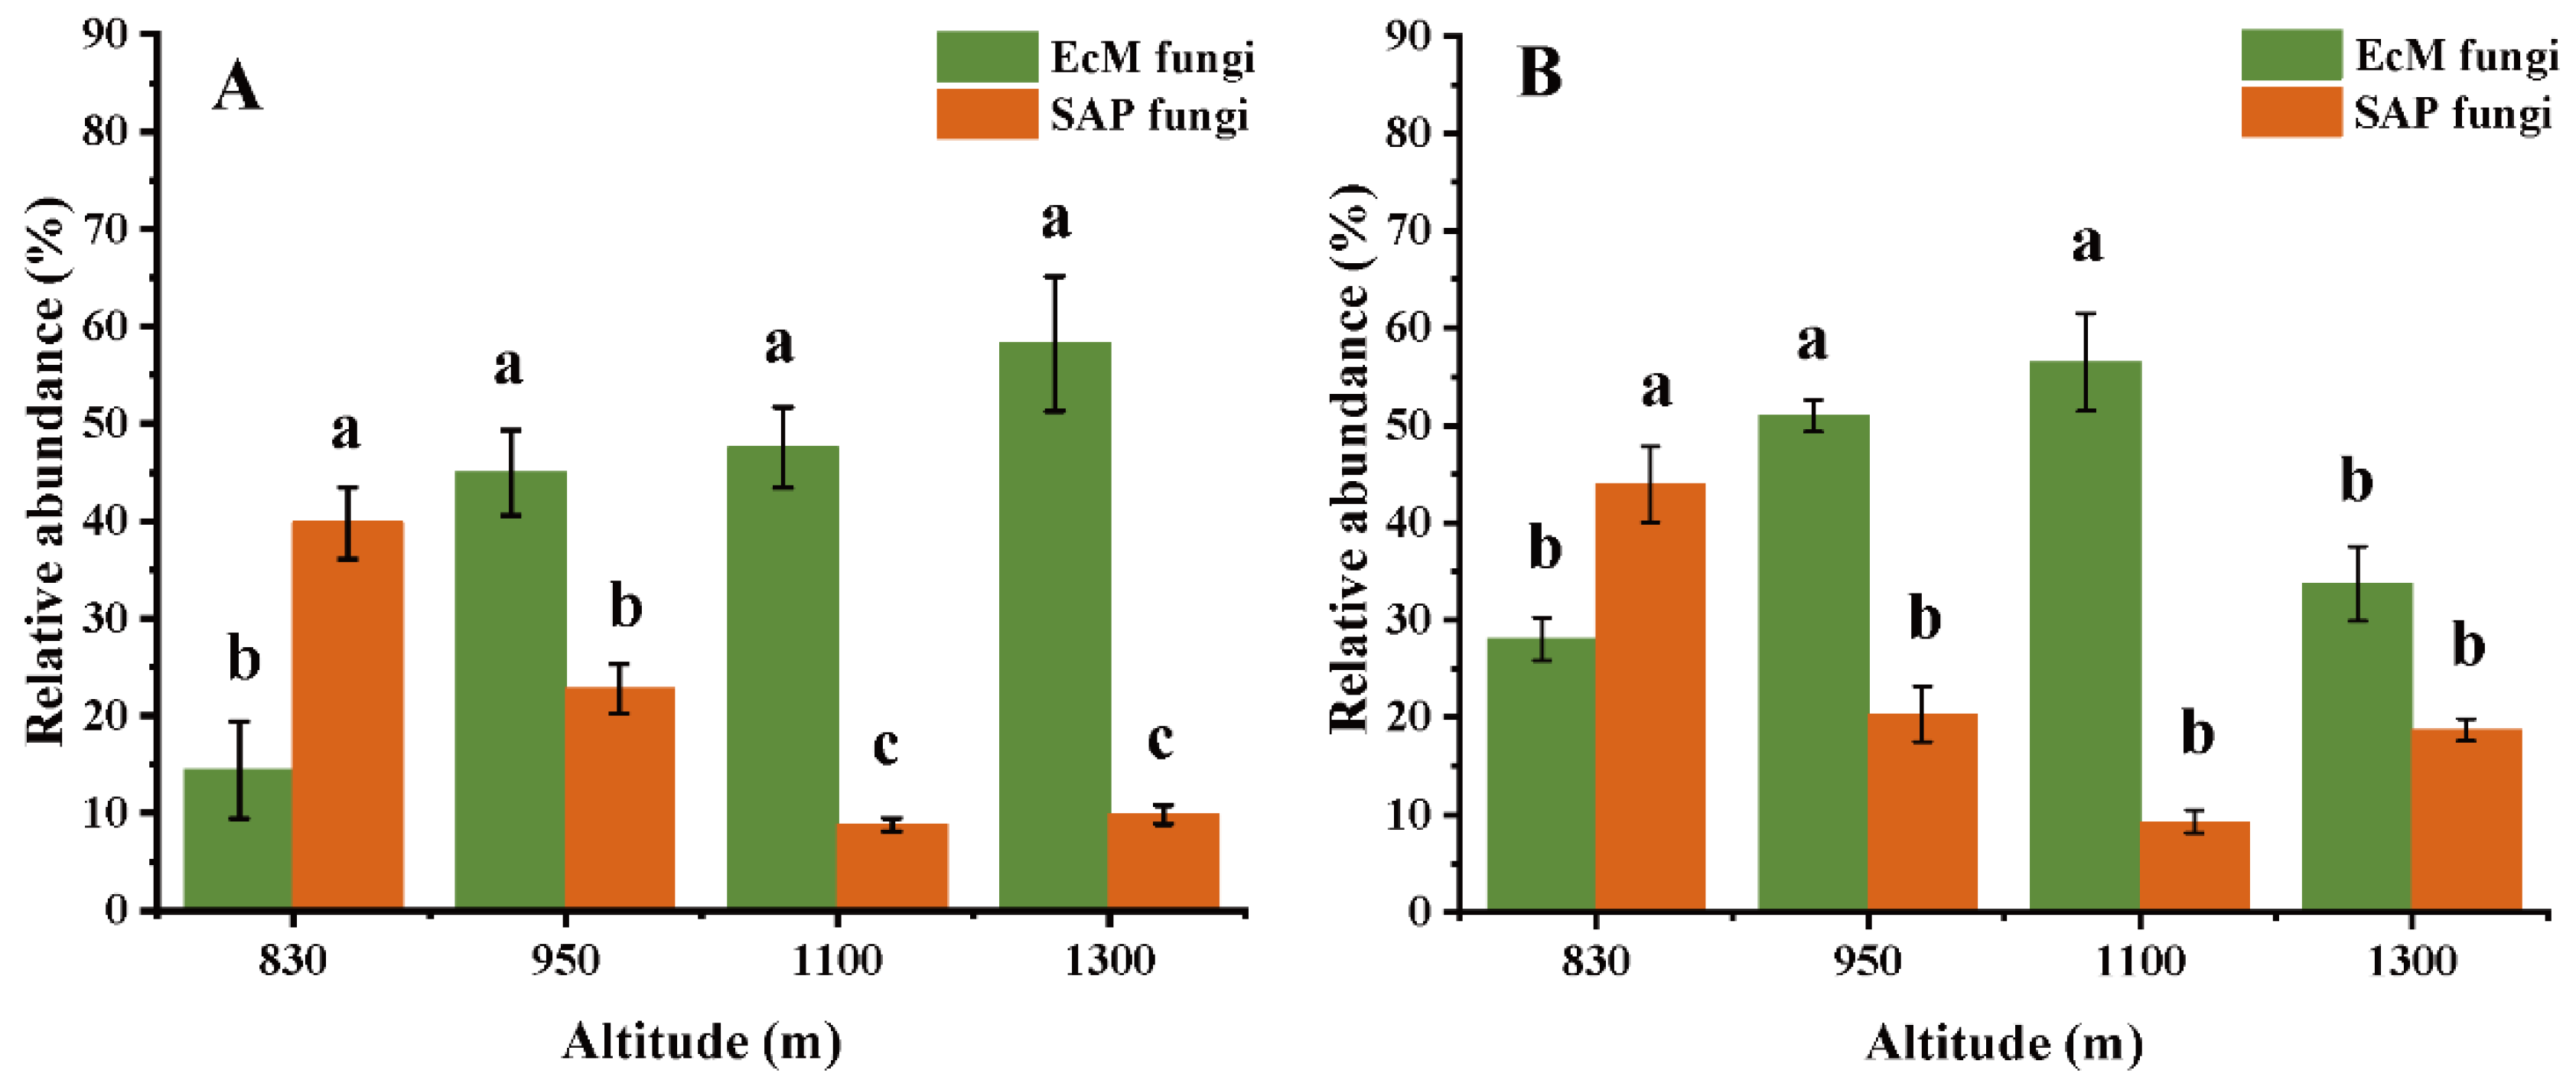
Abstract
:1. Introduction
2. Materials and Methods
2.1. Site Description and Soil Sampling
2.2. Soil Property Analysis
2.3. Soil Fungal DNA Extraction and Polymerase Chain Reaction Amplification
2.4. Illumina MiSeq Sequencing and Bioinformatic Analyses
2.5. Statistical Analyses
3. Results
3.1. General Descriptions of EcM and SAP Fungi
3.2. Shared and Unique OTUs of EcM and SAP Fungal among Different Altitude and Soil Depths
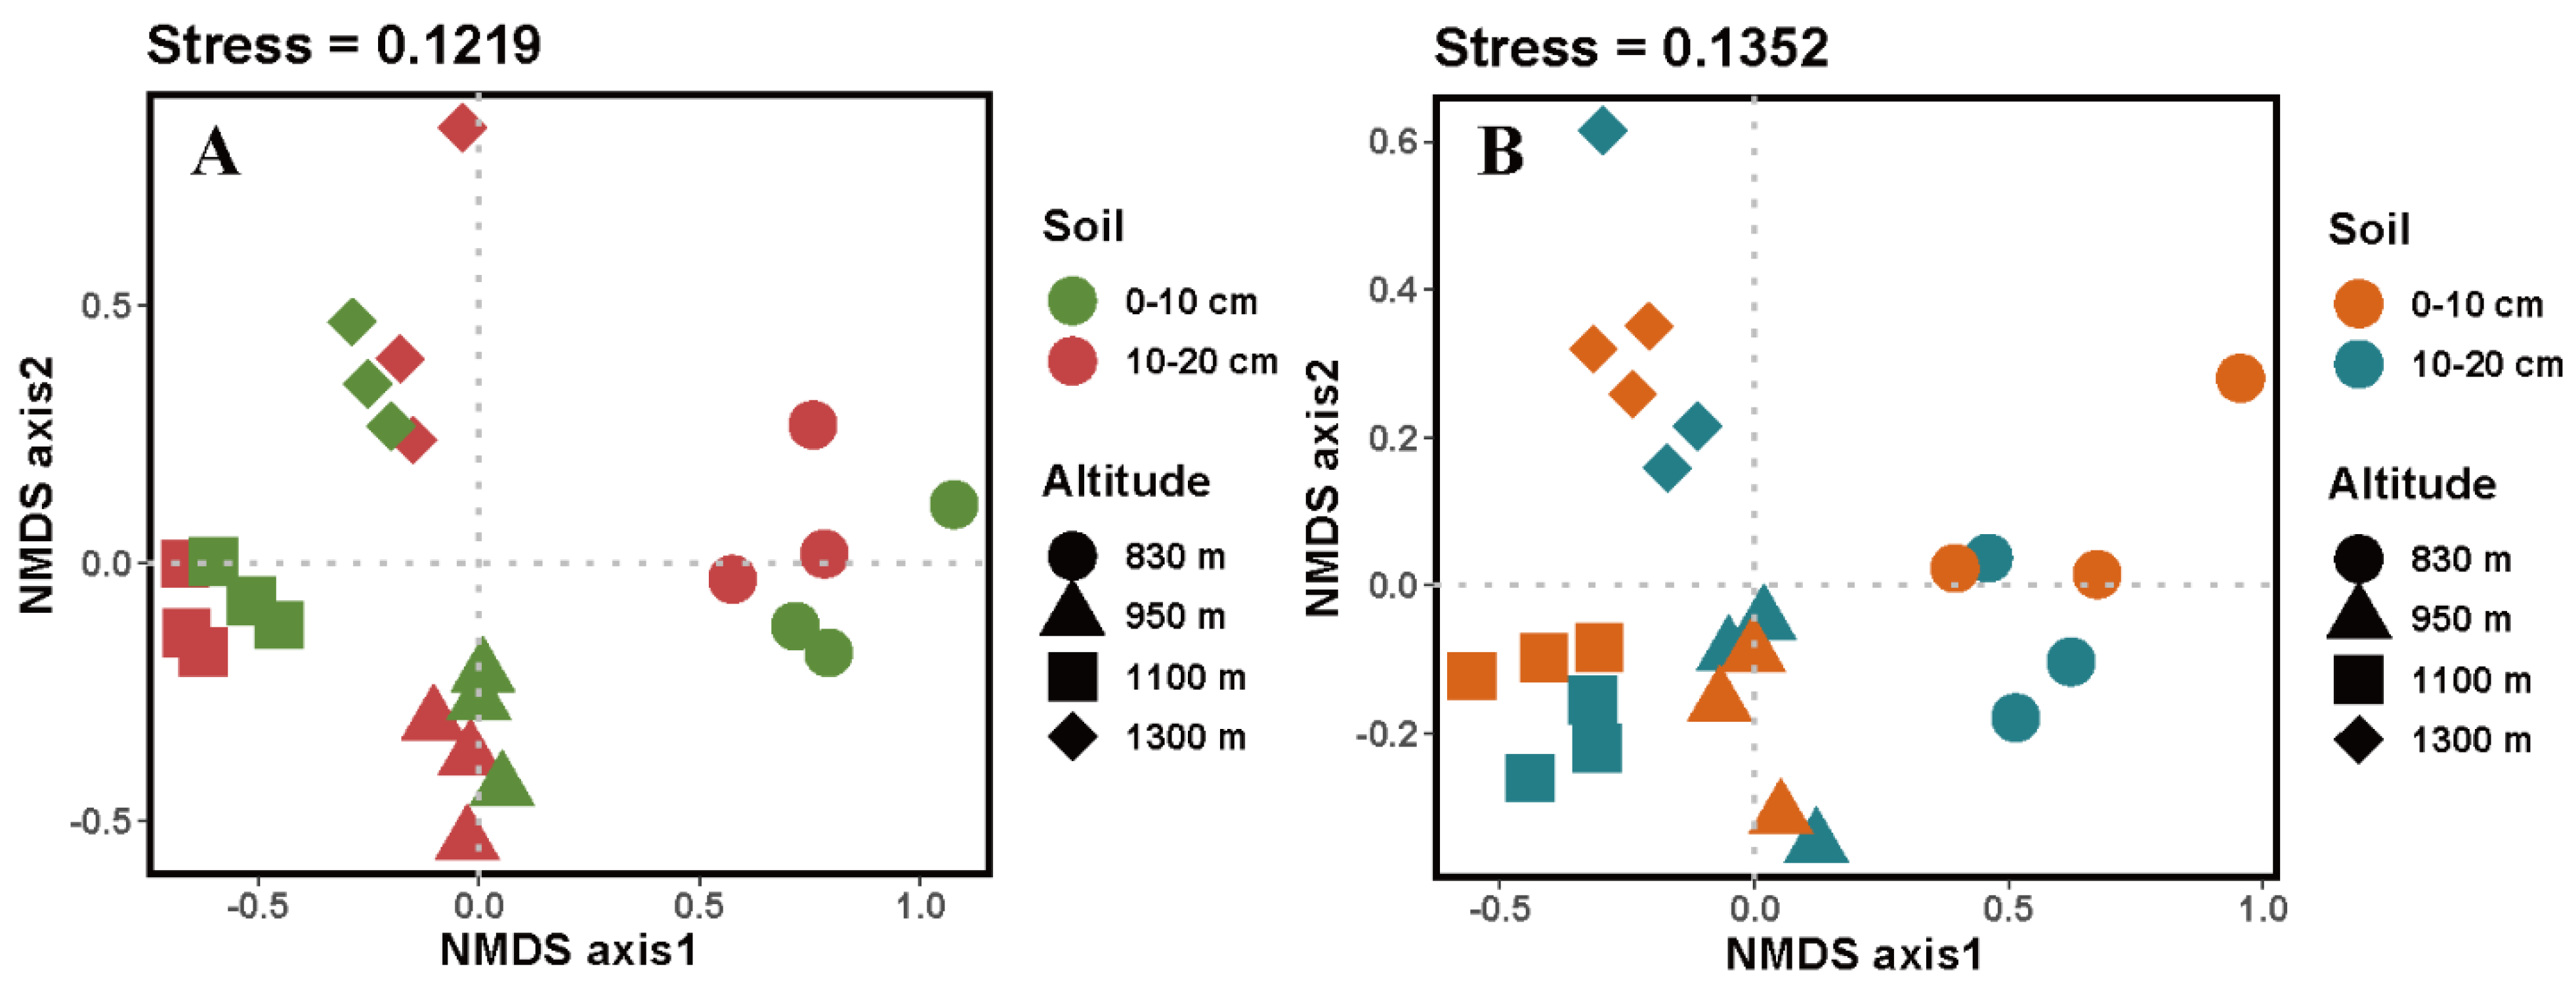
3.3. EcM and SAP Fungal α and β Diversity along an Altitudinal Gradient in Both Soil Layers
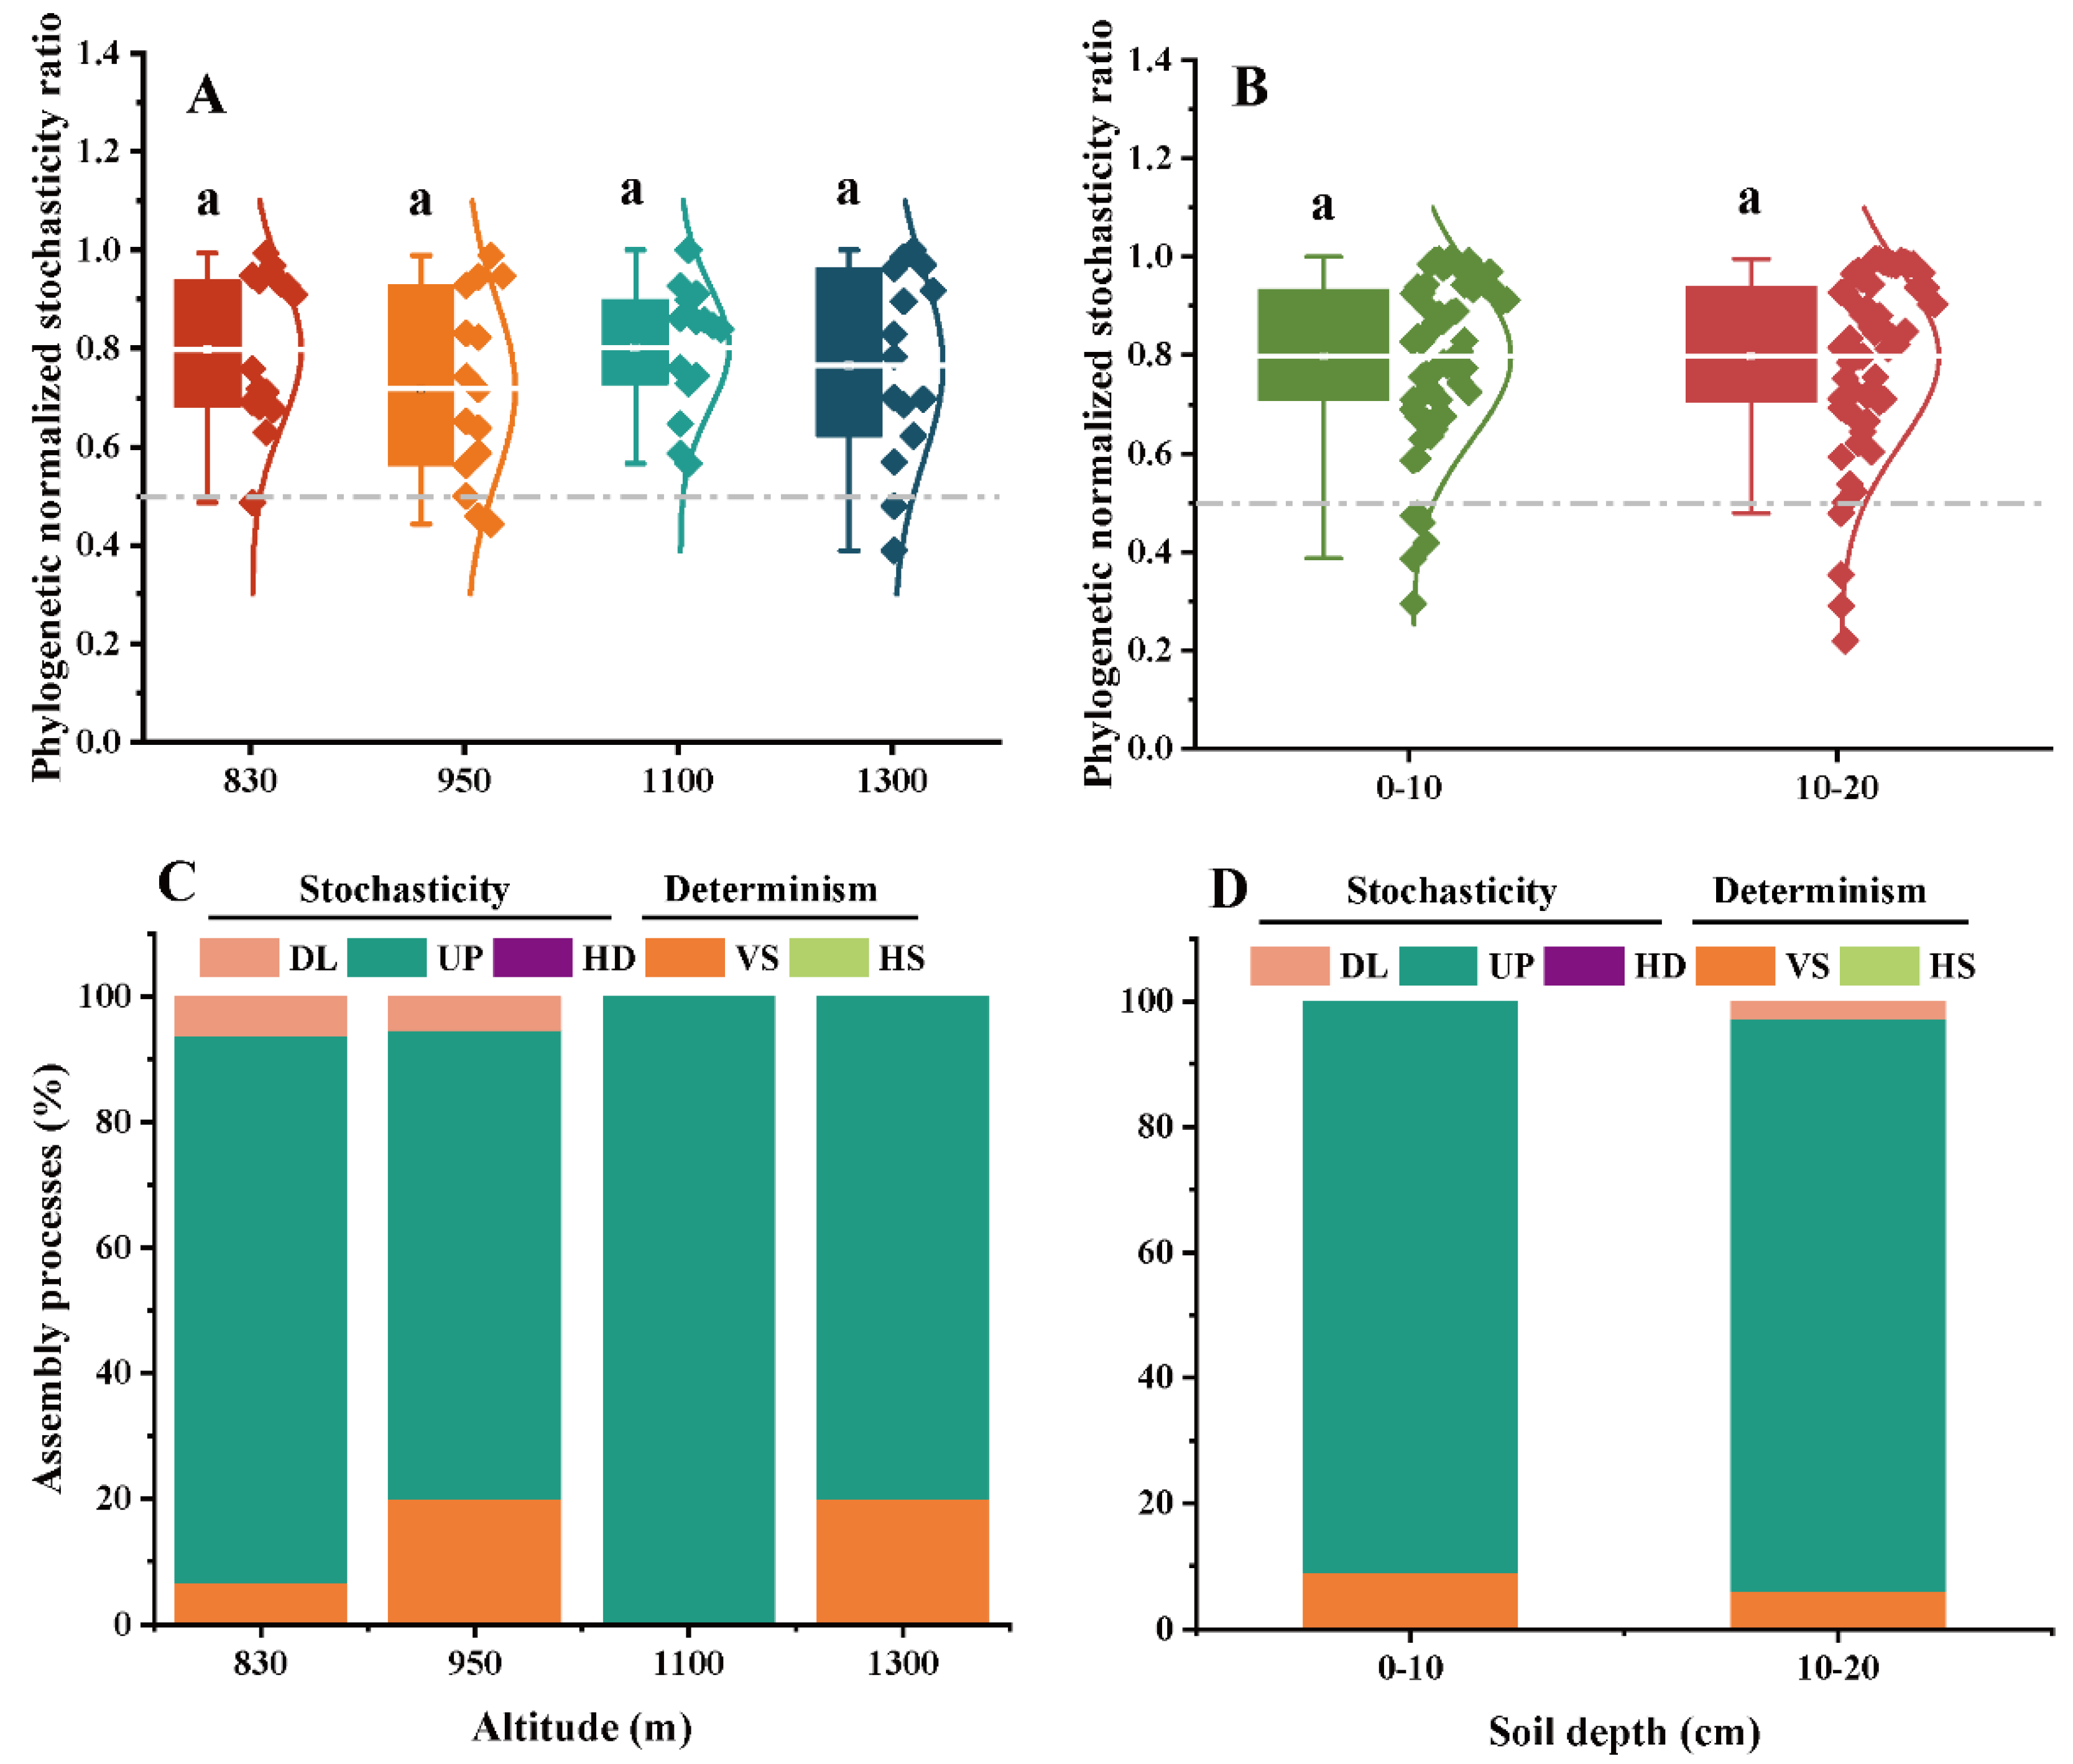
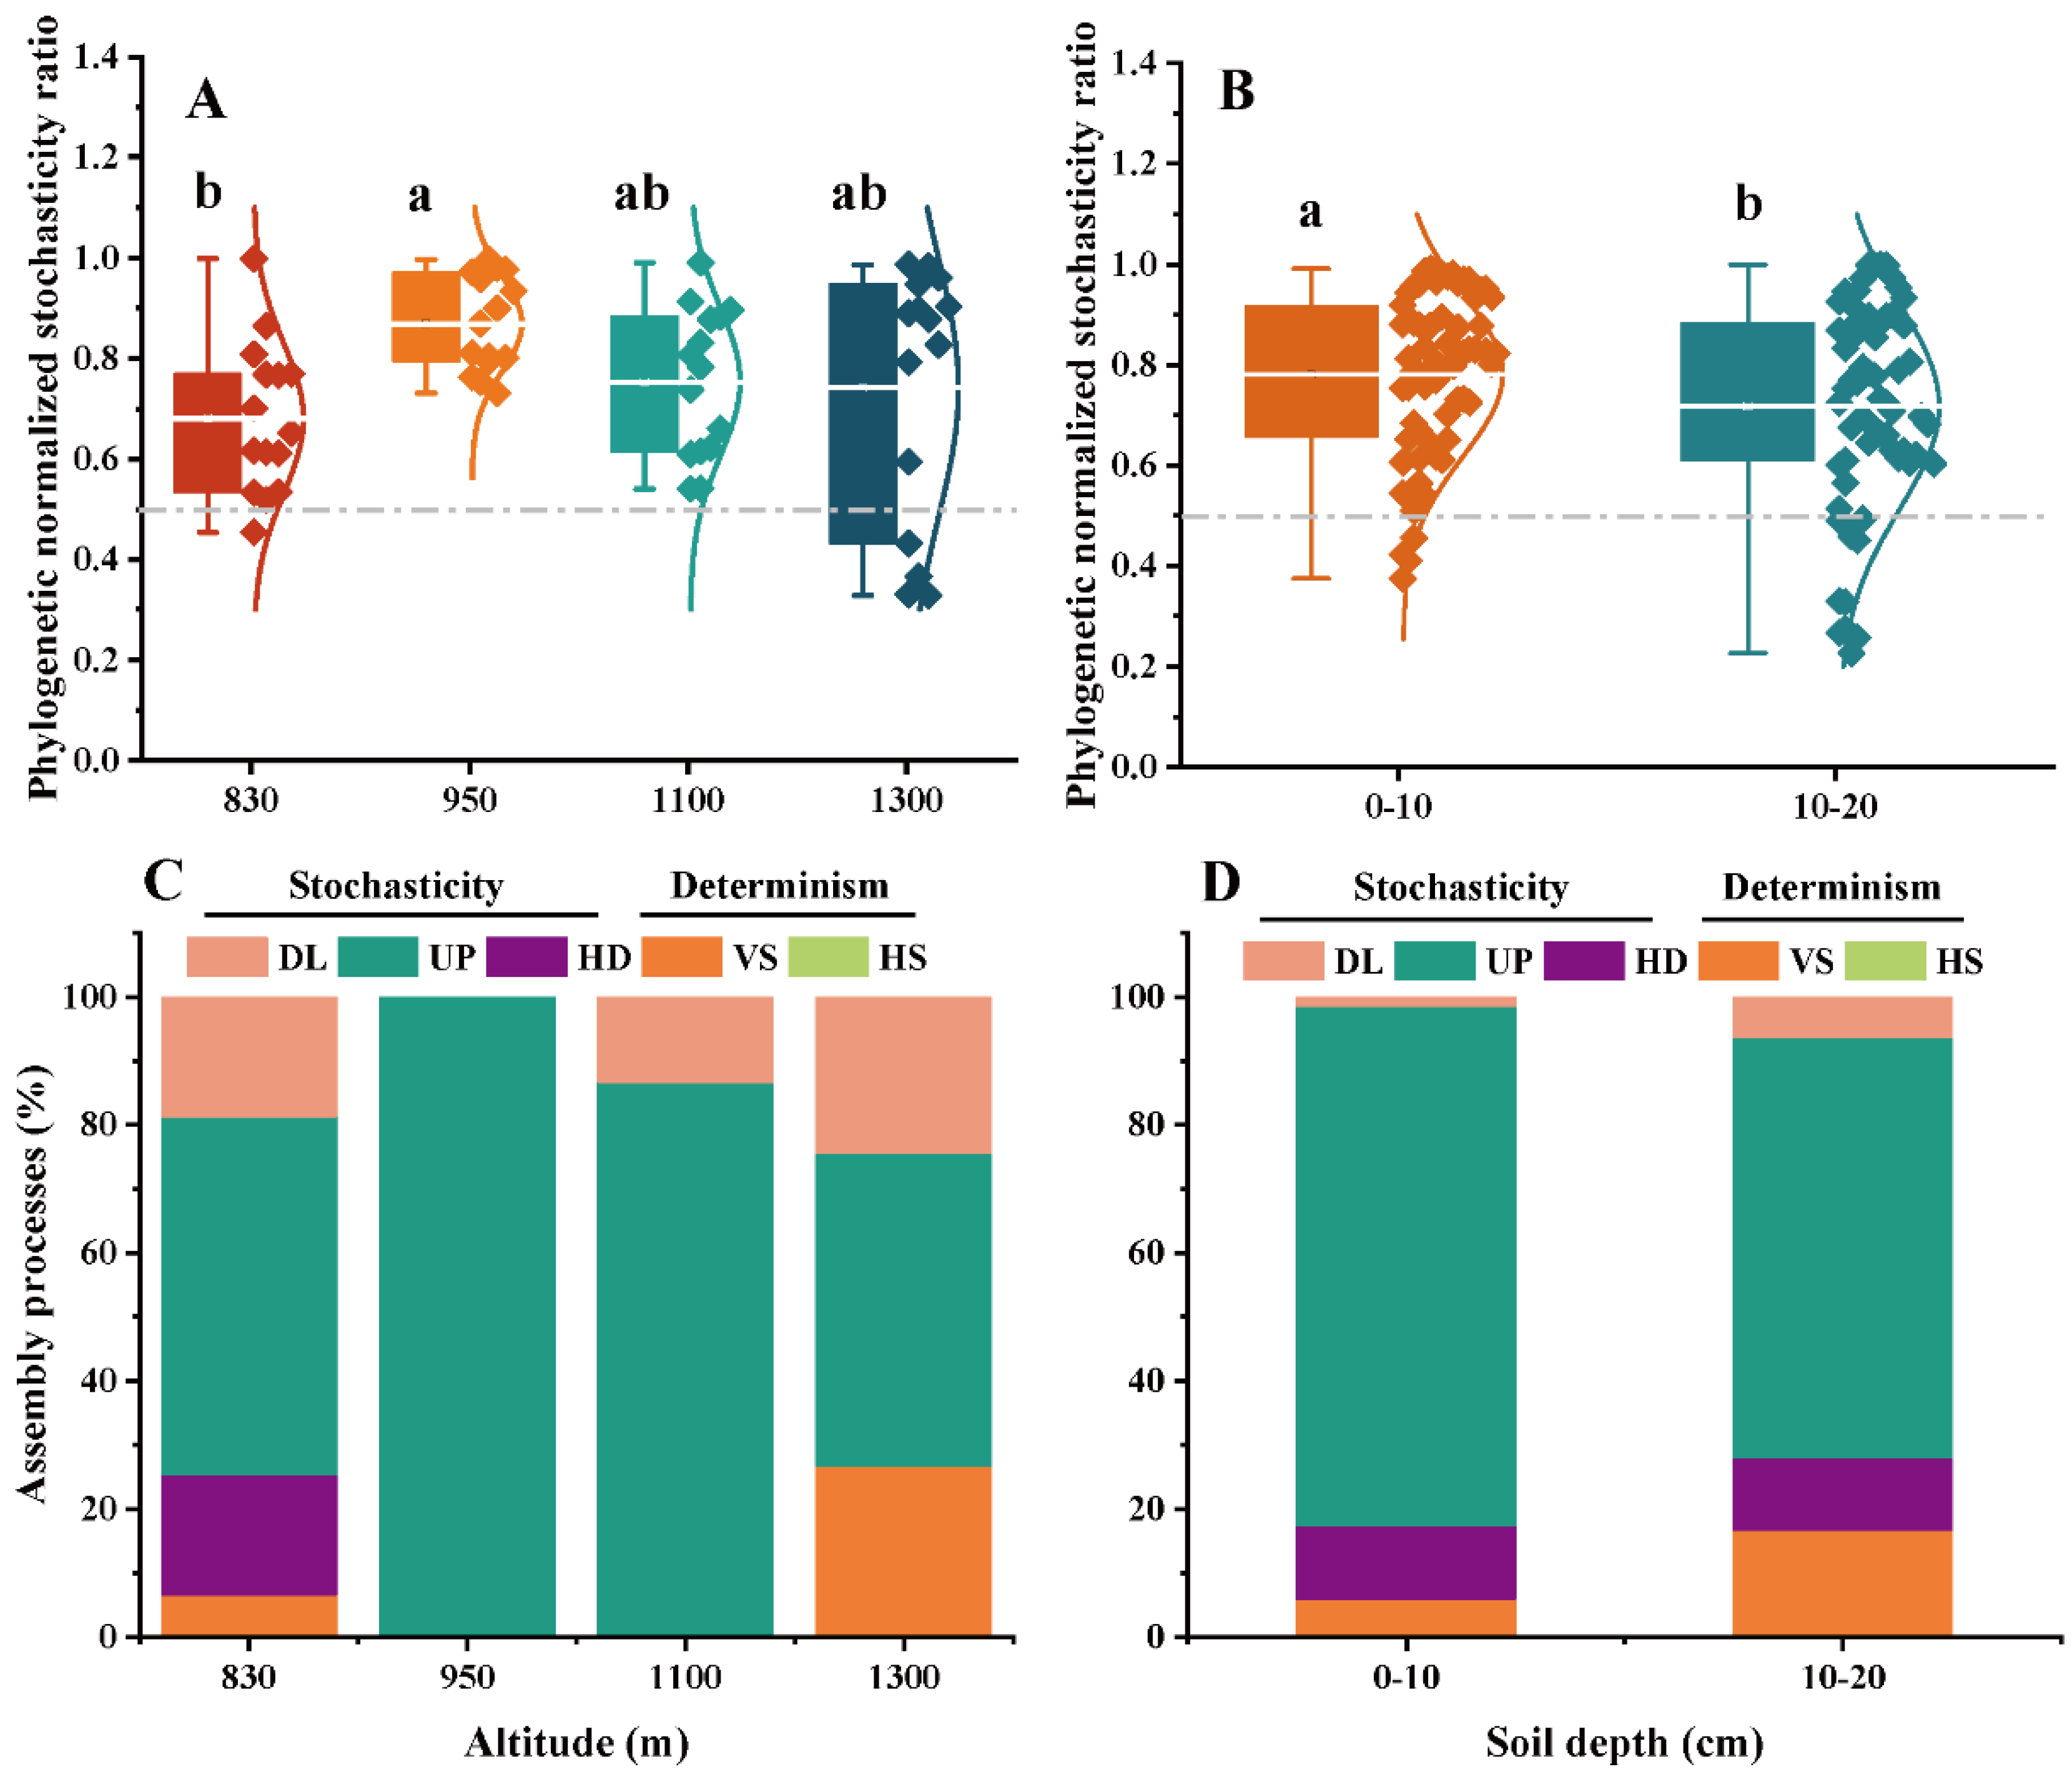
3.4. Ecological Stochasticity of EcM and SAP Fungal Communities
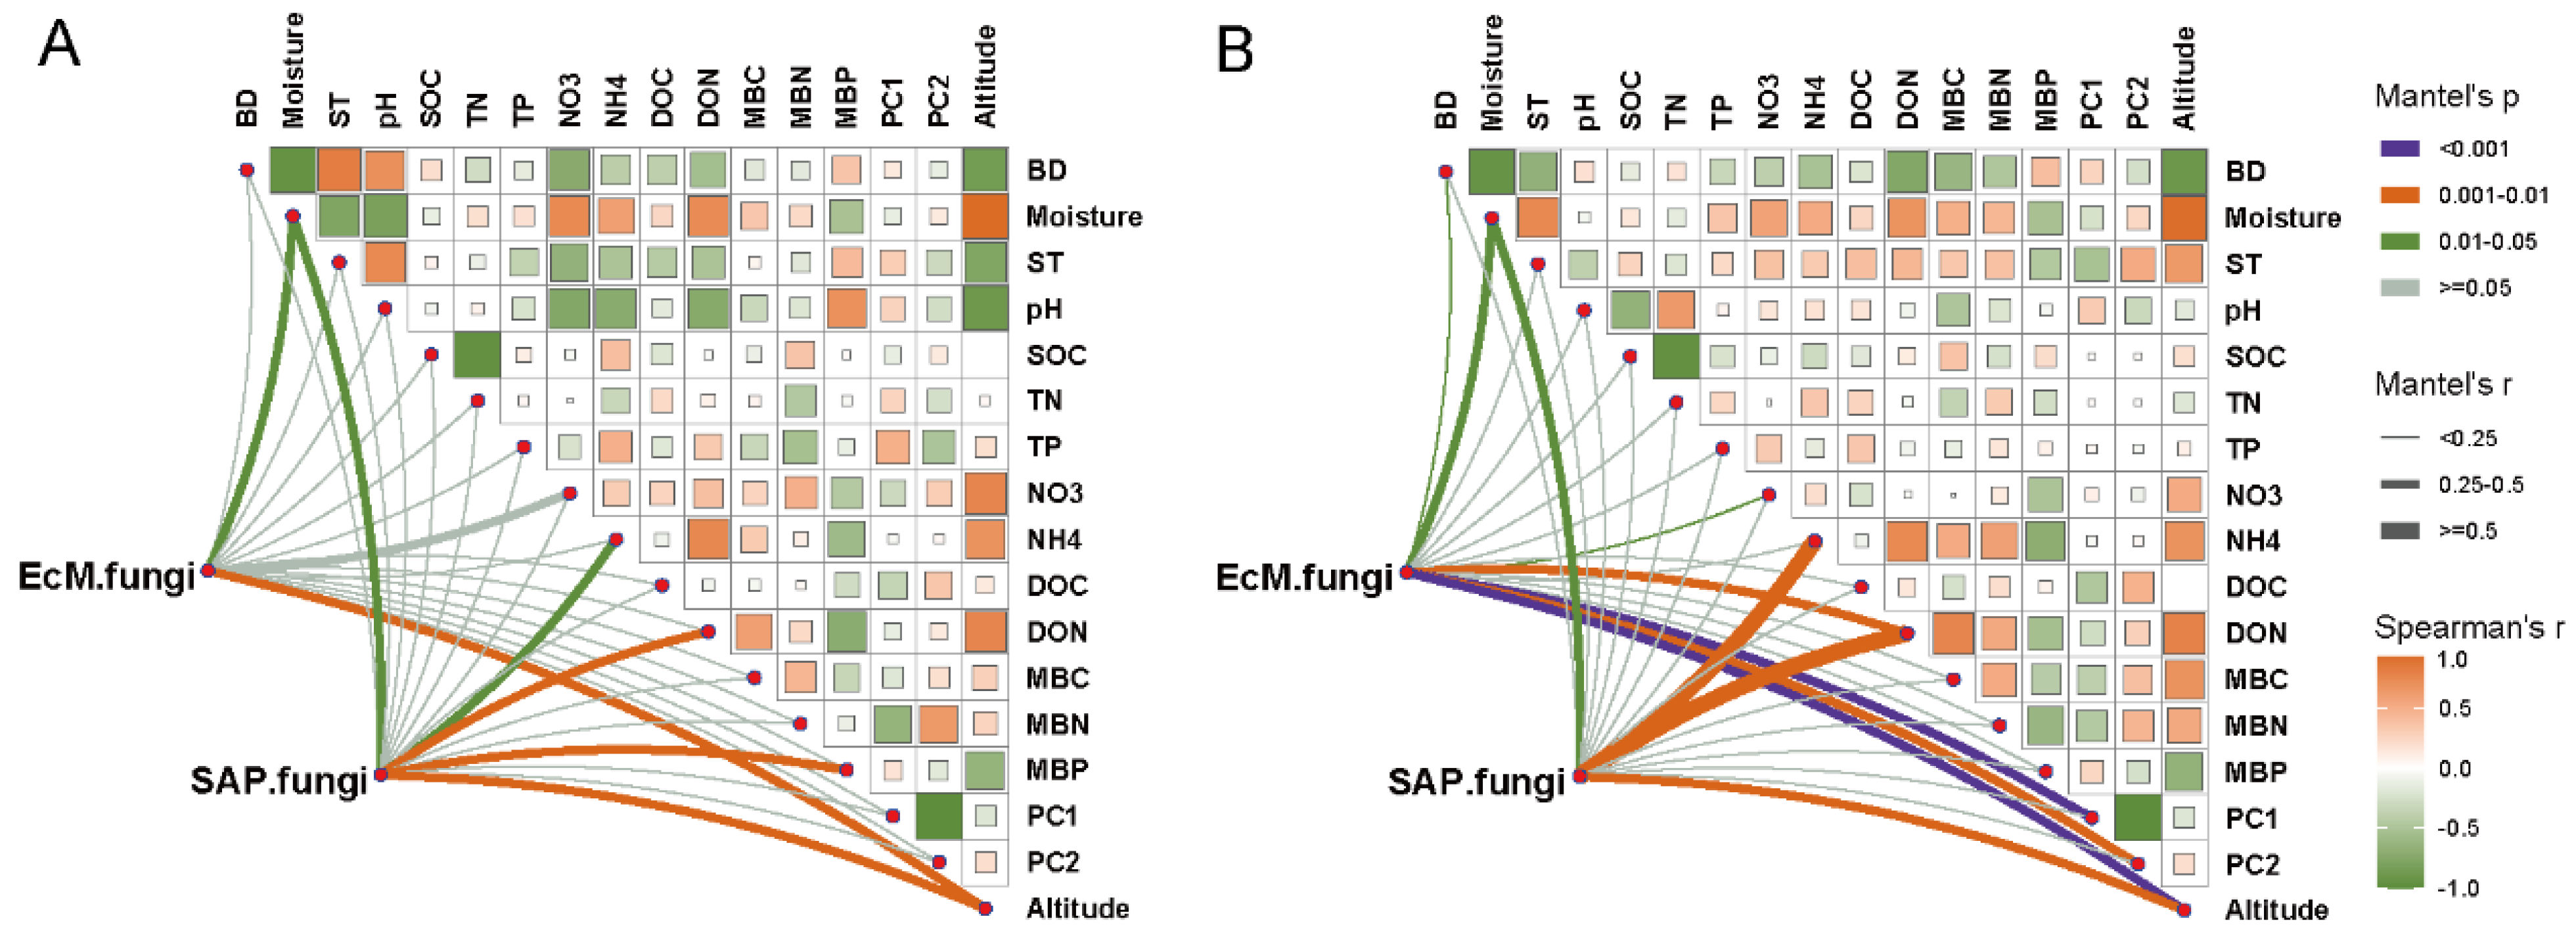
3.5. Explanatory Factors for Variations in EcM and SAP Fungal Communities
4. Discussion
4.1. Altitudinal Pattern of Relative Abundance Is Guild-Dependent, but Diversity Is Not
4.2. Soil Property and Plant Community Were the Driving Factors of SAP and EcM Fungal Communities
4.3. Stochastic Processes Dominated the Community Assembly of Two Key Fungal Guilds
5. Conclusions
Supplementary Materials
Author Contributions
Funding
Institutional Review Board Statement
Informed Consent Statement
Data Availability Statement
Acknowledgments
Conflicts of Interest
References
- Tedersoo, L.; Smith, M.E. Lineages of ectomycorrhizal fungi revisited: Foraging strategies and novel lineages revealed by sequences from belowground. Fungal Biol. Rev. 2013, 27, 83–99. [Google Scholar] [CrossRef] [Green Version]
- Buee, M.; Reich, M.; Murat, C.; Morin, E.; Nilsson, R.; Uroz, S.; Martin, F. 454 pyrosequencing analyses of forest soils reveal an unexpectedly high fungal diversity. New Phytol. 2009, 184, 449–456. [Google Scholar] [CrossRef] [PubMed]
- Schmidt, P.-A.; Bálint, M.; Greshake, B.; Bandow, C.; Römbke, J.; Schmitt, I. Illumina metabarcoding of a soil fungal community. Soil Biol. Biochem. 2013, 65, 128–132. [Google Scholar] [CrossRef]
- Looby, C.I.; Martin, P.H. Diversity and function of soil microbes on montane gradients: The state of knowledge in a changing world. FEMS Microbiol. Ecol. 2020, 96, fiaa122. [Google Scholar] [CrossRef] [PubMed]
- Nguyen, N.H.; Song, Z.; Bates, S.T.; Branco, S.; Tedersoo, L.; Menke, J.; Schilling, J.S.; Kennedy, P.G. Funguild: An open annotation tool for parsing fungal community datasets by ecological guild. Fungal Ecol. 2016, 20, 241–248. [Google Scholar] [CrossRef]
- Bik, H.M.; Porazinska, D.L.; Creer, S.; Caporaso, J.G.; Knight, R.; Thomas, W.K. Sequencing our way towards understanding global eukaryotic biodiversity. Trends Ecol. Evol. 2012, 27, 233–243. [Google Scholar] [CrossRef] [Green Version]
- Dighton, J. Fungi in Ecosystem Processes; CRC Press: Boca Raton, FL, USA, 2018. [Google Scholar]
- Read, D.J. Mycorrhizas in ecosystems. Experientia 1991, 47, 376–391. [Google Scholar] [CrossRef]
- Smith, S.E.; Read, D.J. Mycorrhizal Symbiosis; Academic Press: Cambridge, MA, USA, 2010. [Google Scholar]
- Rincón, A.; Santamaría-Pérez, B.; Rabasa, S.G.; Coince, A.; Marçais, B.; Buée, M. Compartmentalized and contrasted response of ectomycorrhizal and soil fungal communities of s cots pine forests along elevation gradients in f rance and s pain. Environ. Microbiol. 2015, 17, 3009–3024. [Google Scholar] [CrossRef]
- Eastwood, D.C.; Floudas, D.; Binder, M.; Majcherczyk, A.; Schneider, P.; Aerts, A.; Asiegbu, F.O.; Baker, S.E.; Barry, K.; Bendiksby, M. The plant cell wall–decomposing machinery underlies the functional diversity of forest fungi. Science 2011, 333, 762–765. [Google Scholar] [CrossRef] [Green Version]
- Yang, T.; Tedersoo, L.; Fu, X.; Zhao, C.; Liu, X.; Gao, G.; Cheng, L.; Adams, J.M.; Chu, H. Saprotrophic fungal diversity predicts ectomycorrhizal fungal diversity along the timberline in the framework of island biogeography theory. ISME Commun. 2021, 1, 15. [Google Scholar] [CrossRef]
- Shigyo, N.; Hirao, T. Saprotrophic and ectomycorrhizal fungi exhibit contrasting richness patterns along elevational gradients in cool-temperate montane forests. Fungal Ecol. 2021, 50, 101036. [Google Scholar] [CrossRef]
- Gong, S.; Feng, B.; Jian, S.-P.; Wang, G.S.; Ge, Z.-W.; Yang, Z.L. Elevation matters more than season in shaping the heterogeneity of soil and root associated ectomycorrhizal fungal community. Microbiol. Spectr. 2022, 10, e01950-21. [Google Scholar] [CrossRef] [PubMed]
- Miyamoto, Y.; Nakano, T.; Hattori, M.; Nara, K. The mid-domain effect in ectomycorrhizal fungi: Range overlap along an elevation gradient on mount Fuji, Japan. ISME J. 2014, 8, 1739–1746. [Google Scholar] [CrossRef] [PubMed] [Green Version]
- Bödeker, I.T.; Lindahl, B.D.; Olson, Å.; Clemmensen, K.E. Mycorrhizal and saprotrophic fungal guilds compete for the same organic substrates but affect decomposition differently. Funct. Ecol. 2016, 30, 1967–1978. [Google Scholar] [CrossRef] [Green Version]
- Cheeke, T.E.; Phillips, R.P.; Brzostek, E.R.; Rosling, A.; Bever, J.D.; Fransson, P. Dominant mycorrhizal association of trees alters carbon and nutrient cycling by selecting for microbial groups with distinct enzyme function. New Phytol. 2017, 214, 432–442. [Google Scholar] [CrossRef] [Green Version]
- Phillips, L.A.; Ward, V.; Jones, M.D. Ectomycorrhizal fungi contribute to soil organic matter cycling in sub-boreal forests. ISME J. 2014, 8, 699–713. [Google Scholar] [CrossRef] [Green Version]
- Fernandez, C.W.; Kennedy, P.G. Revisiting the ‘gadgil effect’: Do interguild fungal interactions control carbon cycling in forest soils? New Phytol. 2016, 209, 1382–1394. [Google Scholar] [CrossRef]
- Lindahl, B.; Stenlid, J.; Finlay, R. Effects of resource availability on mycelial interactions and 32P transfer between a saprotrophic and an ectomycorrhizal fungus in soil microcosms. FEMS Microbiol. Ecol. 2001, 38, 43–52. [Google Scholar] [CrossRef]
- Tedersoo, L.; May, T.W.; Smith, M.E. Ectomycorrhizal lifestyle in fungi: Global diversity, distribution, and evolution of phylogenetic lineages. Mycorrhiza 2010, 20, 217–263. [Google Scholar] [CrossRef]
- Baldrian, P.; Šnajdr, J.; Merhautová, V.; Dobiášová, P.; Cajthaml, T.; Valášková, V. Responses of the extracellular enzyme activities in hardwood forest to soil temperature and seasonality and the potential effects of climate change. Soil Biol. Biochem. 2013, 56, 60–68. [Google Scholar] [CrossRef]
- Wallenstein, M.D.; McMahon, S.K.; Schimel, J.P. Seasonal variation in enzyme activities and temperature sensitivities in arctic tundra soils. Glob. Chang. Biol. 2009, 15, 1631–1639. [Google Scholar] [CrossRef]
- Courty, P.E.; Buée, M.; Diedhiou, A.G.; Frey-Klett, P.; Le Tacon, F.; Rineau, F.; Turpault, M.P.; Uroz, S.; Garbaye, J. The role of ectomycorrhizal communities in forest ecosystem processes: New perspectives and emerging concepts. Soil Biol. Biochem. 2010, 42, 679–698. [Google Scholar] [CrossRef]
- Pickles, B.J.; Egger, K.N.; Massicotte, H.B.; Green, D.S. Ectomycorrhizas and climate change. Fungal Ecol. 2012, 5, 73–84. [Google Scholar] [CrossRef]
- Stegen, J.C.; Lin, X.; Fredrickson, J.K.; Konopka, A.E. Estimating and mapping ecological processes influencing microbial community assembly. Front. Microbiol. 2015, 6, 370. [Google Scholar] [CrossRef] [Green Version]
- Zhou, J.; Ning, D. Stochastic community assembly: Does it matter in microbial ecology? Microbiol. Mol. Biol. Rev. 2017, 81, e00002–e00017. [Google Scholar] [CrossRef] [Green Version]
- Montaño-Centellas, F.A.; Loiselle, B.A.; Tingley, M.W. Ecological drivers of avian community assembly along a tropical elevation gradient. Ecography 2021, 44, 574–588. [Google Scholar] [CrossRef]
- Glassman, S.I.; Wang, I.J.; Bruns, T.D. Environmental filtering by ph and soil nutrients drives community assembly in fungi at fine spatial scales. Mol. Ecol. 2017, 26, 6960–6973. [Google Scholar] [CrossRef] [Green Version]
- Sheng, Y.; Cong, W.; Yang, L.; Liu, Q.; Zhang, Y. Corrigendum: Forest soil fungal community elevational distribution pattern and their ecological assembly processes. Front. Microbiol. 2019, 10, 2226. [Google Scholar] [CrossRef]
- Hussain, S.; Liu, H.; Liu, S.; Yin, Y.; Yuan, Z.; Zhao, Y.; Cao, H. Distribution and assembly processes of soil fungal communities along an altitudinal gradient in tibetan plateau. J. Fungi 2021, 7, 1082. [Google Scholar] [CrossRef]
- Gao, C.; Zhang, Y.; Shi, N.N.; Zheng, Y.; Chen, L.; Wubet, T.; Bruelheide, H.; Both, S.; Buscot, F.; Ding, Q. Community assembly of ectomycorrhizal fungi along a subtropical secondary forest succession. New Phytol. 2015, 205, 771–785. [Google Scholar] [CrossRef]
- Matsuoka, S.; Mori, A.S.; Kawaguchi, E.; Hobara, S.; Osono, T. Disentangling the relative importance of host tree community, abiotic environment and spatial factors on ectomycorrhizal fungal assemblages along an elevation gradient. FEMS Microbiol. Ecol. 2016, 92, fiw044. [Google Scholar] [CrossRef] [PubMed] [Green Version]
- Ji, L.; Yang, Y.; Yang, L. Seasonal variations in soil fungal communities and co-occurrence networks along an altitudinal gradient in the cold temperate zone of china: A case study on Oakley mountain. Catena 2021, 204, 105448. [Google Scholar] [CrossRef]
- Ji, L.; Shen, F.; Liu, Y.; Yang, Y.; Wang, J.; Purahong, W.; Yang, L. Contrasting altitudinal patterns and co-occurrence networks of soil bacterial and fungal communities along soil depths in the cold-temperate montane forests of China. Catena 2022, 209, 105844. [Google Scholar] [CrossRef]
- Brookes, P.; Landman, A.; Pruden, G.; Jenkinson, D. Chloroform fumigation and the release of soil nitrogen: A rapid direct extraction method to measure microbial biomass nitrogen in soil. Soil Biol. Biochem. 1985, 17, 837–842. [Google Scholar] [CrossRef]
- Caporaso, J.G.; Lauber, C.L.; Walters, W.A.; Berglyons, D.; Huntley, J.; Fierer, N.; Owens, S.M.; Betley, J.R.; Fraser, L.; Bauer, M. Ultra-high-throughput microbial community analysis on the Illumina HiSeq and MiSeq platforms. ISME J. 2012, 6, 1621–1624. [Google Scholar] [CrossRef] [PubMed] [Green Version]
- Edgar, R.C. Uparse: Highly accurate OTU sequences from microbial amplicon reads. Nat. Methods 2013, 10, 996–998. [Google Scholar] [CrossRef]
- Tanunchai, B.; Ji, L.; Schroeter, S.A.; Wahdan, S.F.M.; Hossen, S.; Delelegn, Y.; Buscot, F.; Lehnert, A.S.; Alves, E.G.; Hilke, I. Fungaltraits vs. Funguild: Comparison of ecological functional assignments of leaf-and needle-associated fungi across 12 temperate tree species. Microb. Ecol. 2022, 1–18. [Google Scholar] [CrossRef]
- Ji, L.; Tanunchai, B.; Wahdan, S.F.M.; Schädler, M.; Purahong, W. Future climate change enhances the complexity of plastisphere microbial co-occurrence networks, but does not significantly affect the community assembly. Sci. Total Environ. 2022, 844, 157016. [Google Scholar] [CrossRef]
- Ning, D.; Yuan, M.; Wu, L.; Zhang, Y.; Guo, X.; Zhou, X.; Yang, Y.; Arkin, A.P.; Firestone, M.K.; Zhou, J. A quantitative framework reveals ecological drivers of grassland microbial community assembly in response to warming. Nat. Commun. 2020, 11, 1–12. [Google Scholar] [CrossRef]
- Phillips, R.P.; Brzostek, E.; Midgley, M.G. The mycorrhizal-associated nutrient economy: A new framework for predicting carbon–nutrient couplings in temperate forests. New Phytol. 2013, 199, 41–51. [Google Scholar] [CrossRef]
- Geml, J.; Morgado, L.N.; Semenova, T.A.; Welker, J.M.; Walker, M.D.; Smets, E. Long-term warming alters richness and composition of taxonomic and functional groups of arctic fungi. FEMS Microbiol. Ecol. 2015, 91, fiv095. [Google Scholar] [CrossRef] [PubMed]
- Miyamoto, Y.; Terashima, Y.; Nara, K. Temperature niche position and breadth of ectomycorrhizal fungi: Reduced diversity under warming predicted by a nested community structure. Glob. Chang. Biol. 2018, 24, 5724–5737. [Google Scholar] [CrossRef] [PubMed]
- Bragazza, L.; Bardgett, R.D.; Mitchell, E.A.; Buttler, A. Linking soil microbial communities to vascular plant abundance along a climate gradient. New Phytol. 2015, 205, 1175–1182. [Google Scholar] [CrossRef]
- Ren, C.; Zhou, Z.; Guo, Y.; Yang, G.; Zhao, F.; Wei, G.; Han, X.; Feng, L.; Feng, Y.; Ren, G. Contrasting patterns of microbial community and enzyme activity between rhizosphere and bulk soil along an elevation gradient. Catena 2021, 196, 104921. [Google Scholar] [CrossRef]
- McCain, C.M. Could temperature and water availability drive elevational species richness patterns? A global case study for bats. Global Ecol. Biogeogr. 2007, 16, 1–13. [Google Scholar] [CrossRef]
- Fisher, J.B.; Malhi, Y.; Torres, I.C.; Metcalfe, D.B.; van de Weg, M.J.; Meir, P.; Silva-Espejo, J.E.; Huasco, W.H. Nutrient limitation in rainforests and cloud forests along a 3,000-m elevation gradient in the peruvian andes. Oecologia 2013, 172, 889–902. [Google Scholar] [CrossRef]
- Collins, C.G.; Stajich, J.E.; Weber, S.E.; Pombubpa, N.; Diez, J.M. Shrub range expansion alters diversity and distribution of soil fungal communities across an alpine elevation gradient. Mol. Ecol. 2018, 27, 2461–2476. [Google Scholar] [CrossRef]
- Buscot, F. Implication of evolution and diversity in arbuscular and ectomycorrhizal symbioses. J. Plant Physiol. 2015, 172, 55–61. [Google Scholar] [CrossRef] [Green Version]
- Põlme, S.; Bahram, M.; Yamanaka, T.; Nara, K.; Dai, Y.C.; Grebenc, T.; Kraigher, H.; Toivonen, M.; Wang, P.-H.; Matsuda, Y. Biogeography of ectomycorrhizal fungi associated with alders (Alnus spp.) in relation to biotic and abiotic variables at the global scale. New Phytol. 2013, 198, 1239–1249. [Google Scholar] [CrossRef] [Green Version]
- Tedersoo, L.; Mett, M.; Ishida, T.A.; Bahram, M. Phylogenetic relationships among host plants explain differences in fungal species richness and community composition in ectomycorrhizal symbiosis. New Phytol. 2013, 199, 822–831. [Google Scholar] [CrossRef]
- Peay, K.G.; Schubert, M.G.; Nguyen, N.H.; Bruns, T.D. Measuring ectomycorrhizal fungal dispersal: Macroecological patterns driven by microscopic propagules. Mol. Ecol. 2012, 21, 4122–4136. [Google Scholar] [CrossRef] [PubMed]
- Wang, Y.L.; Zhang, X.; Xu, Y.; Babalola, B.J.; Xiang, S.M.; Zhao, Y.L.; Fan, Y.J. Fungal diversity and community assembly of ectomycorrhizal fungi associated with five pine species in inner mongolia, china. Front. Microbiol. 2021, 12, 646821. [Google Scholar] [CrossRef] [PubMed]
- Schröter, K.; Wemheuer, B.; Pena, R.; Schöning, I.; Ehbrecht, M.; Schall, P.; Ammer, C.; Daniel, R.; Polle, A. Assembly processes of trophic guilds in the root mycobiome of temperate forests. Mol. Ecol. 2019, 28, 348–364. [Google Scholar] [CrossRef] [PubMed]
- Liu, S.; Wang, H.; Deng, Y.; Tian, P.; Wang, Q. Forest conversion induces seasonal variation in microbial β-diversity. Environ. Microbiol. 2018, 20, 111–123. [Google Scholar] [CrossRef] [PubMed]


Publisher’s Note: MDPI stays neutral with regard to jurisdictional claims in published maps and institutional affiliations. |
© 2022 by the authors. Licensee MDPI, Basel, Switzerland. This article is an open access article distributed under the terms and conditions of the Creative Commons Attribution (CC BY) license (https://creativecommons.org/licenses/by/4.0/).
Share and Cite
Guo, Y.; Ji, L.; Wang, M.; Shan, C.; Shen, F.; Yang, Y.; He, G.; Purahong, W.; Yang, L. View from the Top: Insights into the Diversity and Community Assembly of Ectomycorrhizal and Saprotrophic Fungi along an Altitudinal Gradient in Chinese Boreal Larix gmelinii-Dominated Forests. Microorganisms 2022, 10, 1997. https://doi.org/10.3390/microorganisms10101997
Guo Y, Ji L, Wang M, Shan C, Shen F, Yang Y, He G, Purahong W, Yang L. View from the Top: Insights into the Diversity and Community Assembly of Ectomycorrhizal and Saprotrophic Fungi along an Altitudinal Gradient in Chinese Boreal Larix gmelinii-Dominated Forests. Microorganisms. 2022; 10(10):1997. https://doi.org/10.3390/microorganisms10101997
Chicago/Turabian StyleGuo, Yi, Li Ji, Mingwei Wang, Chengfeng Shan, Fangyuan Shen, Yuchun Yang, Gongxiu He, Witoon Purahong, and Lixue Yang. 2022. "View from the Top: Insights into the Diversity and Community Assembly of Ectomycorrhizal and Saprotrophic Fungi along an Altitudinal Gradient in Chinese Boreal Larix gmelinii-Dominated Forests" Microorganisms 10, no. 10: 1997. https://doi.org/10.3390/microorganisms10101997