Article

Effects of Allelochemicals, Soil Enzyme Activities, and Environmental Factors on Rhizosphere Soil Microbial Community of Stellera chamaejasme L. along a Growth-Coverage Gradient

1
Key Laboratory of Chemistry of Northwestern Plant Resources of Chinese Academy of Sciences/Key Laboratory for Natural Medicines of Gansu Province, Lanzhou Institute of Chemical Physics, Chinese Academy of Sciences, Lanzhou 730000, China
2
Center of Grassland Microbiome, State Key Laboratory of Grassland Agro-Ecosystems, Lanzhou University, Lanzhou 730000, China
3
Animal, Plant & Food Inspection Center of Nanjing Customs, Nanjing 210000, China
4
Institute of Biology, Gansu Academy of Sciences, Lanzhou 730000, China
*
Authors to whom correspondence should be addressed.
Microorganisms 2022, 10(1), 158; https://doi.org/10.3390/microorganisms10010158
Submission received: 14 December 2021 / Revised: 8 January 2022 / Accepted: 8 January 2022 / Published: 12 January 2022
(This article belongs to the Section Environmental Microbiology)

Abstract

:
Allelochemicals released from the root of Stellera chamaejasme L. into rhizosphere soil are an important factor for its invasion of natural grasslands. The aim of this study is to explore the interactions among allelochemicals, soil physicochemical properties, soil enzyme activities, and the rhizosphere soil microbial communities of S. chamaejasme along a growth-coverage gradient. High-throughput sequencing was used to determine the microbial composition of the rhizosphere soil sample, and high-performance liquid chromatography was used to detect allelopathic substances. The main fungal phyla in the rhizosphere soil with a growth coverage of 0% was Basidiomycetes, and the other sample plots were Ascomycetes. Proteobacteria and Acidobacteria were the dominant bacterial phyla in all sites. RDA analysis showed that neochamaejasmin B, chamaechromone, and dihydrodaphnetin B were positively correlated with Ascomycota and Glomeromycota and negatively correlated with Basidiomycota. Neochamaejasmin B and chamaechromone were positively correlated with Proteobacteria and Actinobacteria and negatively correlated with Acidobacteria and Planctomycetes. Allelochemicals, soil physicochemical properties, and enzyme activity affected the composition and diversity of the rhizosphere soil microbial community to some extent. When the growth coverage of S. chamaejasme reached the primary stage, it had the greatest impact on soil physicochemical properties and enzyme activities.

1. Introduction

The rhizosphere refers to the part of the soil mediated by microorganisms and affected by the root system, which is directly affected by root exudates and related soil microorganisms [1]. Rhizosphere soil is important not only for plant nutrition, health, and quality, but also for microbial-driven carbon sequestration, ecosystem function, and nutrient cycling in terrestrial ecosystems [2]. It is also the most important place for rhizosphere microorganisms to multiply and grow [3]. Soil microorganisms play an important role in improving soil physical and chemical properties, regulating soil microbial community and diversity, and maintaining soil quality and fertility [4].
Some studies have shown that one third of plant photosynthate is released into soil in the form of root exudates, which can affect the rhizosphere microbial community [5]. Allelopathy, as a new weapon of species invasion, has gained a prominent position in the field of invasive biology [6]. The chemical substances produced by plants affect neighboring plants and soil microorganisms, ultimately changing the structure of plant communities [7]. Currently, scholars are focusing more and more on the allelopathic interaction between plants and their rhizosphere soil, but there are still few related studies. Studies have shown that allelochemicals released by plant roots play a vital role in interactions between soil microorganisms [8]. Adding rice allelochemicals to the soil will stimulate or inhibit certain microbial populations in the soil, thereby affecting the release of allelochemicals and the soil nutrient composition [9]. Brazilian pepper trees use allelochemicals to manipulate the soil fungal and bacterial community structures and recruit AMF fungi to enhance nutrient uptake, drought resistance, and disease resistance, as well as to destroy local soil microbial communities [10]. Alliaria fololata is a cruciferous plant that successfully destroys the beneficial fungi that are symbiotic with local trees through isothiocyanate (ITC) allelopathy [11]. In addition, ITC also had a significant impact on the rhizosphere soil bacterial community of Arabidopsis thaliana [12]. Root exudates were growth regulators in the process of peanut–soil feedback. Phenolic acids in peanut root exudates promoted change in the microbial community of the rhizosphere soil and played an important role in soil diseases of the peanut [13]. These studies have shown that allelochemicals have significant effects on soil microorganisms, especially several specific fungi and bacteria that can cause disease or release nutrients. Allelopathic substances released by plant roots can affect the microbial community in the rhizosphere soil, and the soil microbial community can also affect the allelopathy between plants and soil to a certain extent [14,15]. Therefore, exploring the correlation between allelochemicals and soil microorganisms is an important part of exploring plant allelopathy.
Soil enzyme activity is a sensitive index for soil environmental change; it is often related to soil physical and chemical properties, reflects the direction and intensity of soil biochemical processes, and has an important impact on soil physical and chemical properties, fertility, and biological conditions. Therefore, it is often used as an important index for evaluating soil environmental quality [16,17]. The correlation between soil microorganisms and soil enzymes has received increasing attention from scholars [18]. Studies have shown that the environmental factors of soil, such as altitude, pH, organic matter, total nitrogen, alkali-hydrolyzable nitrogen, available potassium, and available phosphorus content, were related to the composition and diversity of the soil microbial communities [19], which also affect the soil enzyme activity [20]. Each soil enzyme and environmental factor has a different correlation to the rhizosphere soil microbial community of S. chamaejasme. Jin studied the bacterial community in the rhizosphere and root of S. chamaejasme on the Qinghai–Xizang Plateau and found that soil phosphorus, pH, latitude, altitude, and potassium were positively correlated with the bacterial community in the rhizosphere soil [21]. However, it is still unknown how soil enzyme activities, environmental factors, and allelochemicals interact to impact the rhizosphere soil microbial community.
Stellera chamaejasme L., a perennial herb of Stellera, is widely distributed in Gansu, Xinjiang, Ningxia, and other provinces and regions in China. It has become one of the iconic grassland degradation plants in China due to its predominant ecological adaptability and high competitiveness [21]. Studies suggest S. chamaejasme can release flavonoid allelochemicals to restrain the growth of other plants [22,23,24]. Pharmacological activity [25], chemical substances [26], ecology [27], and a few reports on rhizosphere soil microorganisms [21,28] are the bulk of the current research on S. chamaejasme. However, neither allelochemicals in the rhizosphere soil nor the soils physical and chemical properties’ interaction to impact soil microorganisms have been reported.
Allelochemicals released by plants during invasion may be an important factor in the competition of habitat expansion. Allelochemicals released by S. chamaejasme may be the main mechanism for its invasion of the process affecting the rhizosphere soil microbial community structure. However, the correlation between the microbial community structure and allelochemicals in the rhizosphere of S. chamaejasme is not clear. This study focused on how the soil enzyme activities, environmental factors, and allelochemicals interact to impact the soil microbial community in the rhizosphere of S. chamaejasme on the representative natural alpine steppe in the eastern foot of Qilian Mountain. Our purpose is to explore the correlation between soil enzymes, physical and chemical properties, and allelochemicals with soil microorganisms in different growth gradients. With the help of high-throughput sequencing technology and high-performance liquid chromatography (HPLC), we hope to explore the interactions among the microbial community, enzyme activity, environmental factors, and allelochemicals in the S. chamaejasme rhizosphere soil. We hope to reveal the interactive relationships that affect the S. chamaejasme rhizosphere microecosystem’s survival competition and ecological adaptation as well as provide a theoretical basis for scientific and effective ecological control strategies for poisonous weeds.

2. Materials and Methods

2.1. Sampling Location Information

The sample collection time was during the flowering stage of S. chamaejasme in July 2019. The sample plot was located in Tanyaogou Village, Xiulong Township, Tianzhu Tibetan Autonomous County, Wuwei City, Gansu Province (Table 1). The sample plots were selected according to the four growth coverages of S. chamaejasme at 0% (no invasion), 25.13% (primary invasion), 52.63% (moderate invasion), and 89.69% (severe invasion), and four replicates were set for each plot covered by growth coverage. The distance between each sample site was more than 100 m, and the distance between individual plants was more than 10 m. Fifteen plants that looked healthy and had similar characteristics were collected with aseptic shovel and gloves in each plot. Rhizosphere soil samples were collected by shaking the root in a sterile plastic bag [28]. The rhizosphere soils of each growth coverage were fully mixed and made into composite samples, which were returned to the laboratory at −4 ℃ for preservation and retention.

2.2. Soil Chemical Analysis

After shade drying, slight grinding, and impurity removal through a 0.4 mm sieve, the rhizosphere soil samples were sent to the Central Laboratory of Lanzhou Mineral Exploration Institute (http://www.gsyslky.com, accessed on 3 March 2022) for determination of soil characteristics, including pH value, organic matter, total nitrogen, alkali-hydrolyzable nitrogen, available potassium, and available phosphorus. Soil enzyme activity is measured by using a soil enzyme kit (Suzhou Comin Biotechnology Co., Ltd., Suzhou, Jiangsu, China) and an applicable UV-Vis spectrometer (UV-1750, Shimadzu Co., Ltd., Kyoto, Japan). All enzyme activities in the rhizosphere soil were determined by air-drying mass.

2.3. Quantification of Chemical Substances in Rhizosphere Soil

We shade dried and sieved the collected rhizosphere soil, and then removed plant roots, stones, and other impurities. We accurately weighed 100 g rhizosphere soil and extracted it repeatedly with 300 mL methanol 3 times with the aid of ultrasonic wave, each time for 30 min. We filtered the extract, steamed it dry it with a rotary evaporator, and collected the residue. The residue was dissolved in chromatographic methanol and passed through 0.22 μm filter membrane for quantitative analysis. HPLC was carried out with a Waters® Breeze™ 2 System instrument and Breeze 2 Software Add-On System; the analytical column was a 250 mm × 4.6 mm, 5 μm particle size Symmetry C18 reversed-phase column. The solvent of acetonitrile for HPLC analysis was of HPLC gradient grade (Anhui Fulltime Co., Ltd., Hefei, China). Ultrapure water was obtained from Hangzhou Wahaha Co., Ltd. (China) and recorded the ultraviolet spectrum at 300 nm. The flow rate was 1 mL/min, the injection volume was 20 μL, and the column temperature was 30 °C. Mobile phase A was acetonitrile, and phase B was water (0.2% acetic acid). This gradient was followed: 0–6 min, 20–30% A; 6–8 min, 30–35% A; 8–15 min, 35–45% A; 15–18 min, 45–60% A; 18–20 min, 60–80% A; 20–25 min, 80% A.
The chemicals in the rhizosphere soil were determined by comparing the retention time and ultraviolet spectrum of the standard. The allelochemicals secreted by S. chamaejasme were detected by the internal standard method of HPLC. The peak with the same retention time and ultraviolet spectral characteristics was considered to be the same allelopathic substance. We compared the measured peak area of the sample and the peak area of the standard product to estimate the allelochemical content in the rhizosphere soil [23].

2.4. High-Throughput Sequencing of Soil Microorganisms

The total genomic DNA was extracted from the rhizosphere soil by MoBio kit. Then, 1% agarose gel electrophoresis was used to detect the purity and concentration of the DNA, and the diluted DNA group was used as a template. In terms of fungi, the ITS1 region of the fungus was amplified by PCR, and the primers were sequenced as ITS1F (5′CTTG GTCA TTTA GAGG AAGT AA-3′) [29] and ITS2 (5′GCTG CGTT CTTCA TCGA TGC-3′) [30]. The 16s rRNA V3-V4 region of bacteria was amplified by PCR, and the primers were 341F (5′-ACTC CTAC GGGA GCAG CAGC AG-3′) and 806R (5′-GGAC TACH VGGG TWTC TAAT-3′) [31]. Specific barcode sequence tags were added to distinguish different samples. The PCR reaction system 5×Fast Pfu Buffer was 4 μL, the dNTPs (2.5 mmol/L) was 2 μL, the positive and reverse primers (5 μmol/L) were 0.8 μL each, the fast Pfu polymerase was 0.4 μL, and the template DNA was 10 ng, supplemented to 20 μL with ddH2O. The PCR reaction conditions of fungi were as follows: 94 °C, 20 min, 55 °C, 55 °C, 72 °C, 30 cycles, 72 °C, 5 min. The bacterial PCR reaction conditions were as follows: 94 °C 3 min; 94 °C 30 s 55 °C 30 s 72 °C 30 s, 25 cycles. The PCR products were detected by 2% agarose gel electrophoresis, recovered by a GeneJET (Thermo Scientific, Shanghai, China) gel recovery kit, and Illumina high-throughput sequencing was carried out by Shanghai Shenggong Bioengineering Co., Ltd.

2.5. Data Processing and Analysis

The high-throughput sequencing data were removed by Cutadapt software, and the pairs of reads were spliced by PEAR software; each sample data was identified and distinguished by barcode tag sequences. Finally, the quality of each sample data was filtered by PRINSEQ software, and effective data were obtained. Using USEARCH to remove the non-amplified region sequence UCHIME to identify chimerism, and BLAST alignment on the representative sequence of the database, the outer sequence of the target region below the threshold value of 0.8 was removed, and then the operational taxonomic units (OTUs) were divided according to 97% similarity by USEARCH software. Fungi and bacteria were compared with SILVA (http://www.arb-silva.de/, accessed on 21 March 2022) [32] and RDP (http://rdp.cme.msu.edu/misc/resources.jsp, accessed on 23 March 2022) databases, respectively, to obtain the species classification information corresponding to each OTU [33].
Taking OTU as the object, a rarefaction analysis was completed by using a software called mothur; the sparsity curve was drawn by R, and the α diversity index of the microbial community was calculated. This included the Shannon index and Simpson index, which represent the diversity of community distribution. Chao1 estimator and ACE estimator, which represent the richness of soil microbial community and coverage index, indicated the sequencing depth. The representative sequence of OTUs was selected to annotate and classify the microorganisms in different samples, and R was used to map the statistical results of species taxonomy. All data were checked by SPSS 26 Software for Windows to test whether they met the normal distribution and then complete statistical analysis. The statistical data used in this study were processed by IBM SPSS Statistics 26. A Pearson correlation analysis method with the SigmaPlot 12.5 tool was used to study the relationship between rhizosphere soil microbial community index and allelopathic substances, soil enzyme activities, and physical and chemical parameters (Systat Software, Inc., San Jose, CA, USA). Based on the correlation similarity matrix, principal component analysis was carried out by R software to analyze rhizosphere soil microbial community. Redundancy analysis (RDA) in Canoco5.0 was used to explore the correlation among environmental factors, soil enzyme activities, and allelochemicals.

2.6. Nucleotide Sequence Accession Numbers

The representative bacterial sequences generated in this study were submitted to GenBank under the following accession numbers: SRR14339806, SRR14339807, SRR14339808, SRR14339809, SRR14339811, SRR14339812, SRR14339813, SRR14339814, SRR14339815, SRR14339816, SRR14339817, and SRR14339818. The accession numbers of the representative fungal sequences were: SRR14339799, SRR14339800, SRR14339801, SRR14339802, SRR14339803, SRR14339804, SRR14339805, SRR14339810, SRR14339819, SRR14339820, SRR14339821, and SRR14339822.

3. Results

3.1. Soil Physical and Chemical Properties and Enzyme Activity

The physical and chemical properties of the soil at the sampling sites were different under different coverages (Table 2). The range of soil pH in the rhizosphere of S. chamaejasme was 7.46–7.61 under four cover degrees, and the soil pH increased when the S. chamaejasme growth coverage increased. Compared to the plots without S. chamaejasme, the contents of organic matter, total nitrogen, alkali-hydrolyzable nitrogen, available potassium, and available phosphorus in the plots with S. chamaejasme were relatively higher. Among them, the sample plots with 25.13% coverage had the highest contents of total nitrogen, alkali-hydrolyzable nitrogen, available potassium, and available phosphorus, followed by the sample plots with 89% coverage.
The trends of enzyme activities in seven kinds of rhizosphere soil were different in the four plots. The activities of peroxidase (POD) and dehydrogenases (DHA) have a similar trend in soil; that is, they have the same changing trend as the coverage changes. In the sample plots with S. chamaejasme growth, the activities of polyphenol oxidase (PPO), POD, and DHA in the rhizosphere soil were higher than the soil without S. chamaejasme. However, urease (UE), sucrose (SC), acid phosphatase (ACP), and alkaline phosphatase (AKP) were lower than those without S. chamaejasme.

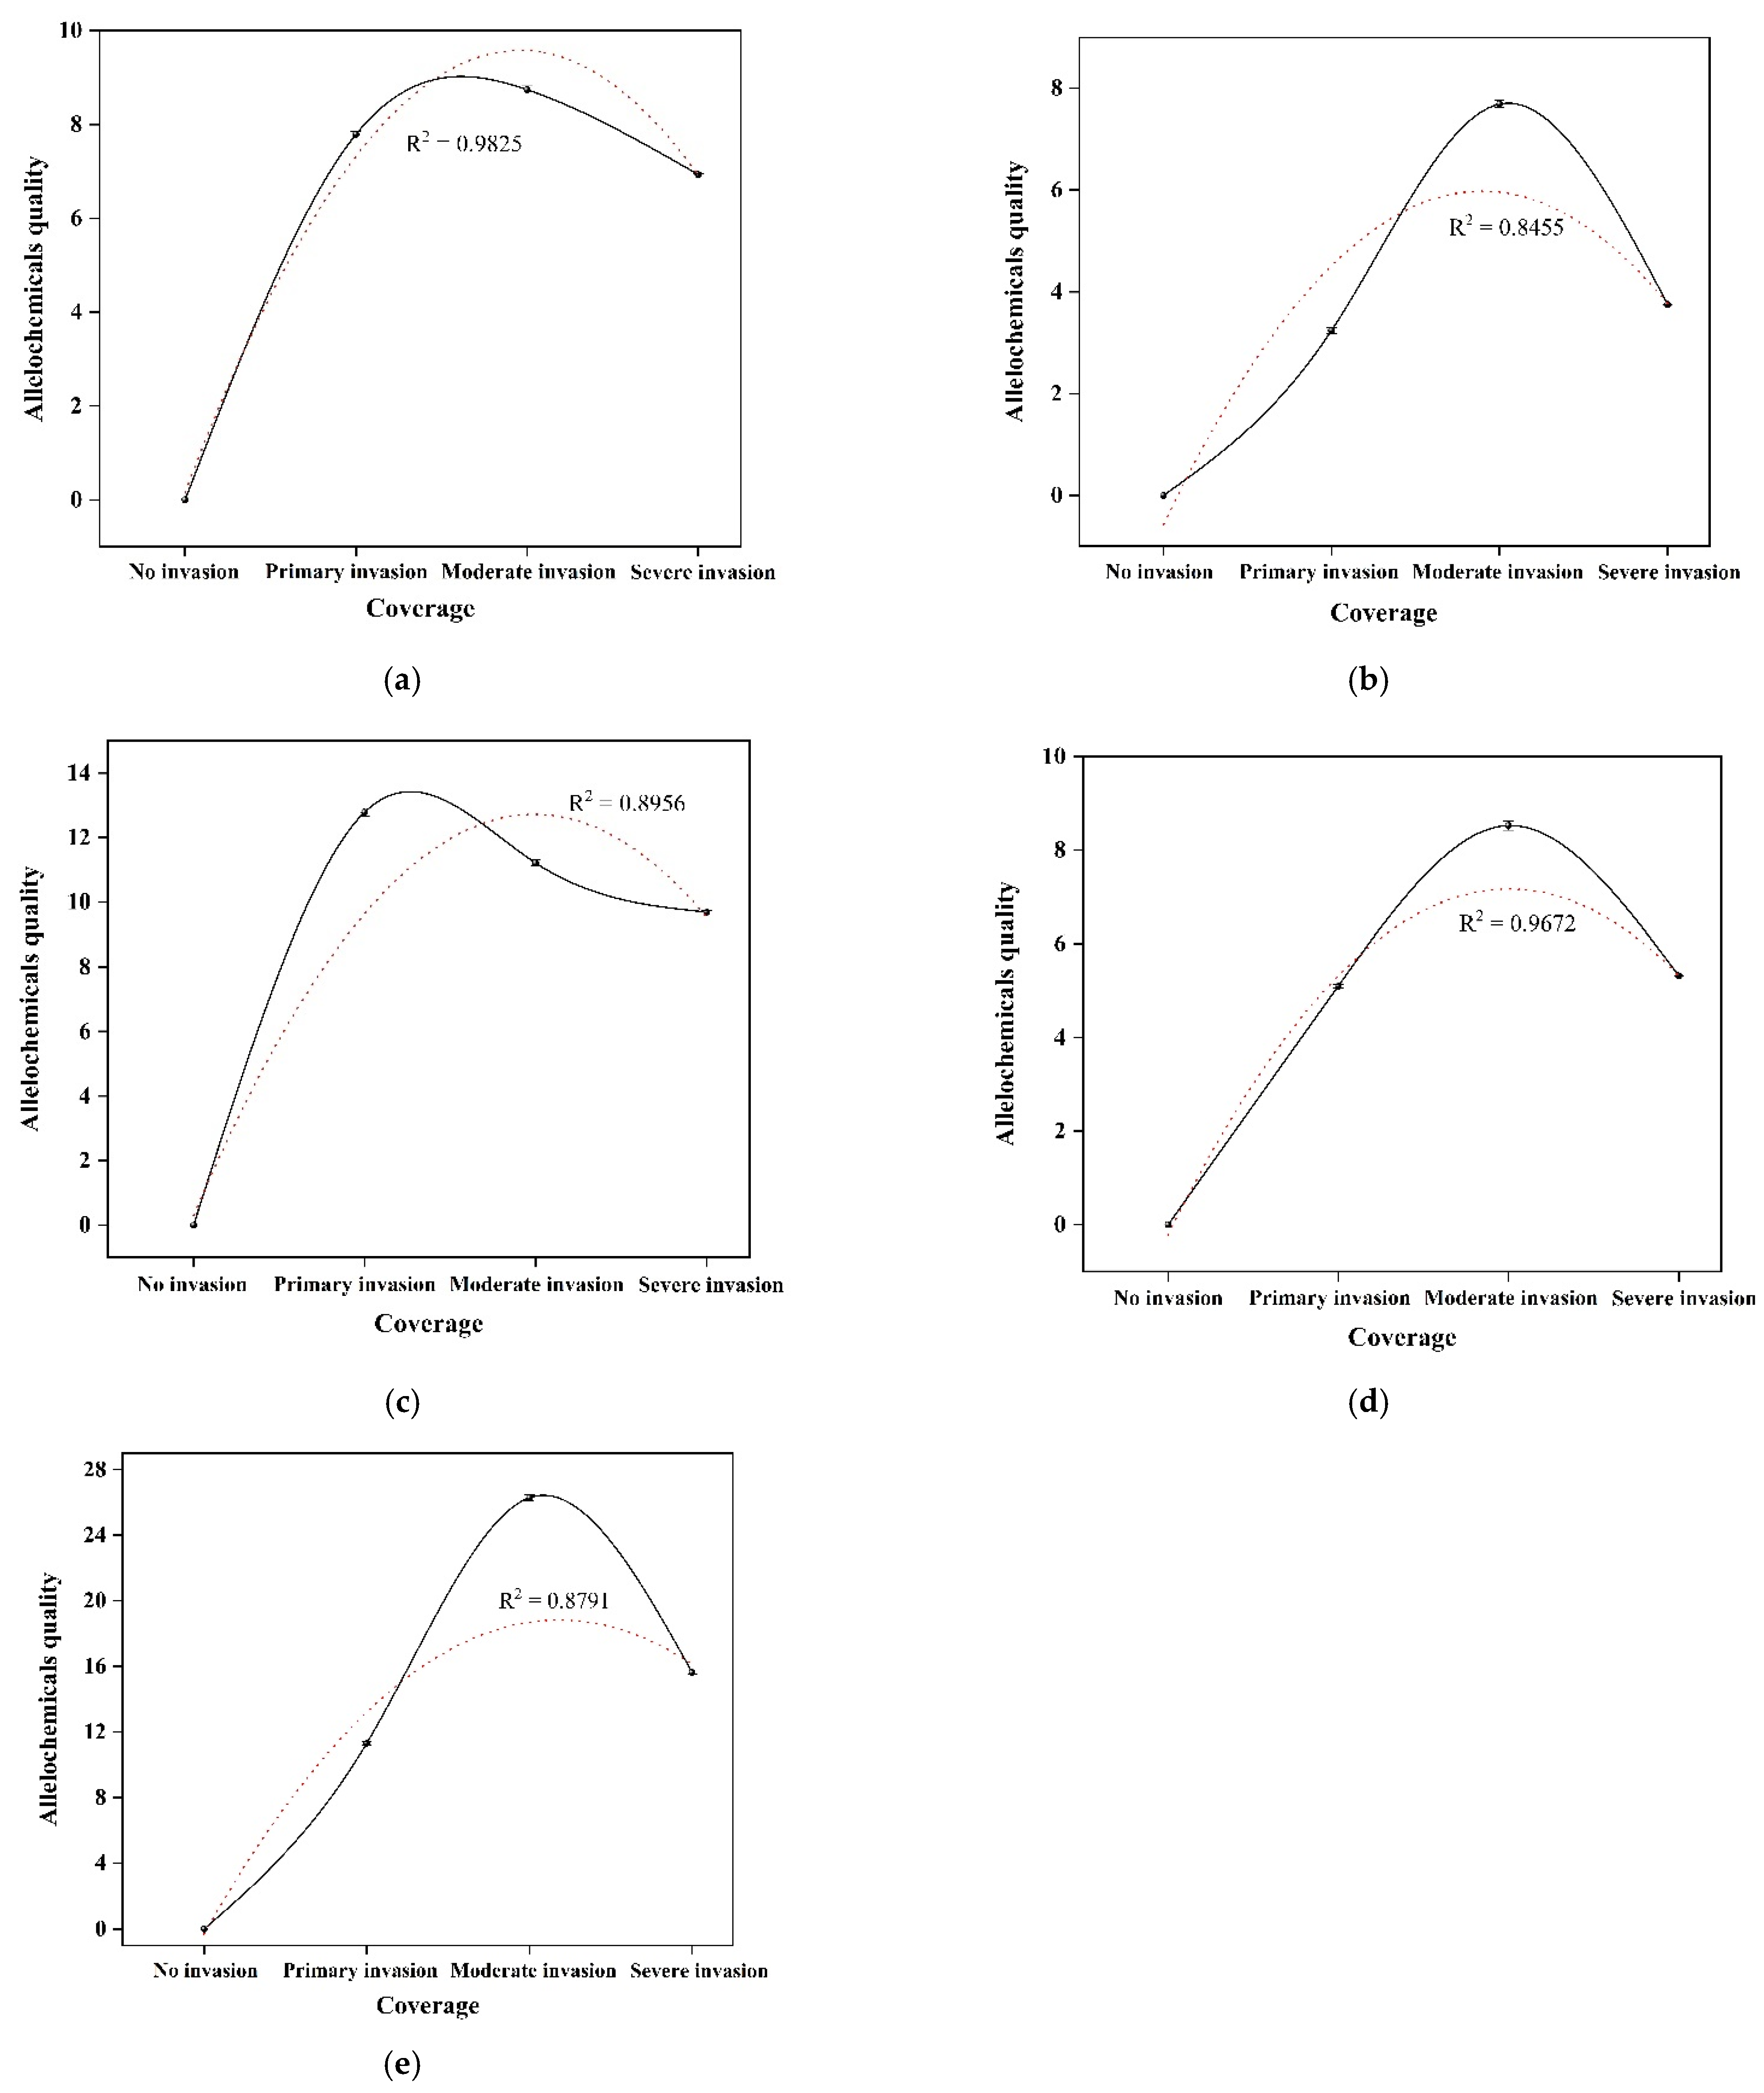
3.2. Quantitative Analysis of Allelochemicals in Rhizosphere Soil

Five flavonoids allelochemicals in rhizosphere soil were detected by HPLC; they were chamaechromone, mesoneochamaejasmin A, neochamaejasmin B, Dihydrodaphnodorin B, and 7-methoxyneochamaejasmine (Table 2). The results showed that the content of five allelochemicals was relatively high in the plot with 52.63% growth coverage, followed by the plot with 89.69% growth coverage, and relatively low content was found in the plot with 25.13% growth coverage. The concentrations of neochamaejasmin B and 7-methoxyneochamaejasmine A were higher than the other three allelochemicals. As can be seen in the picture, with the increase in the growing coverage of S. chamaejasme, the quality of allelochemicals secreted into the rhizosphere soil showed an increasing trend. When the growth coverage was more than 52.16%, the release of allelochemicals decreased (Table 2, Figure 1).

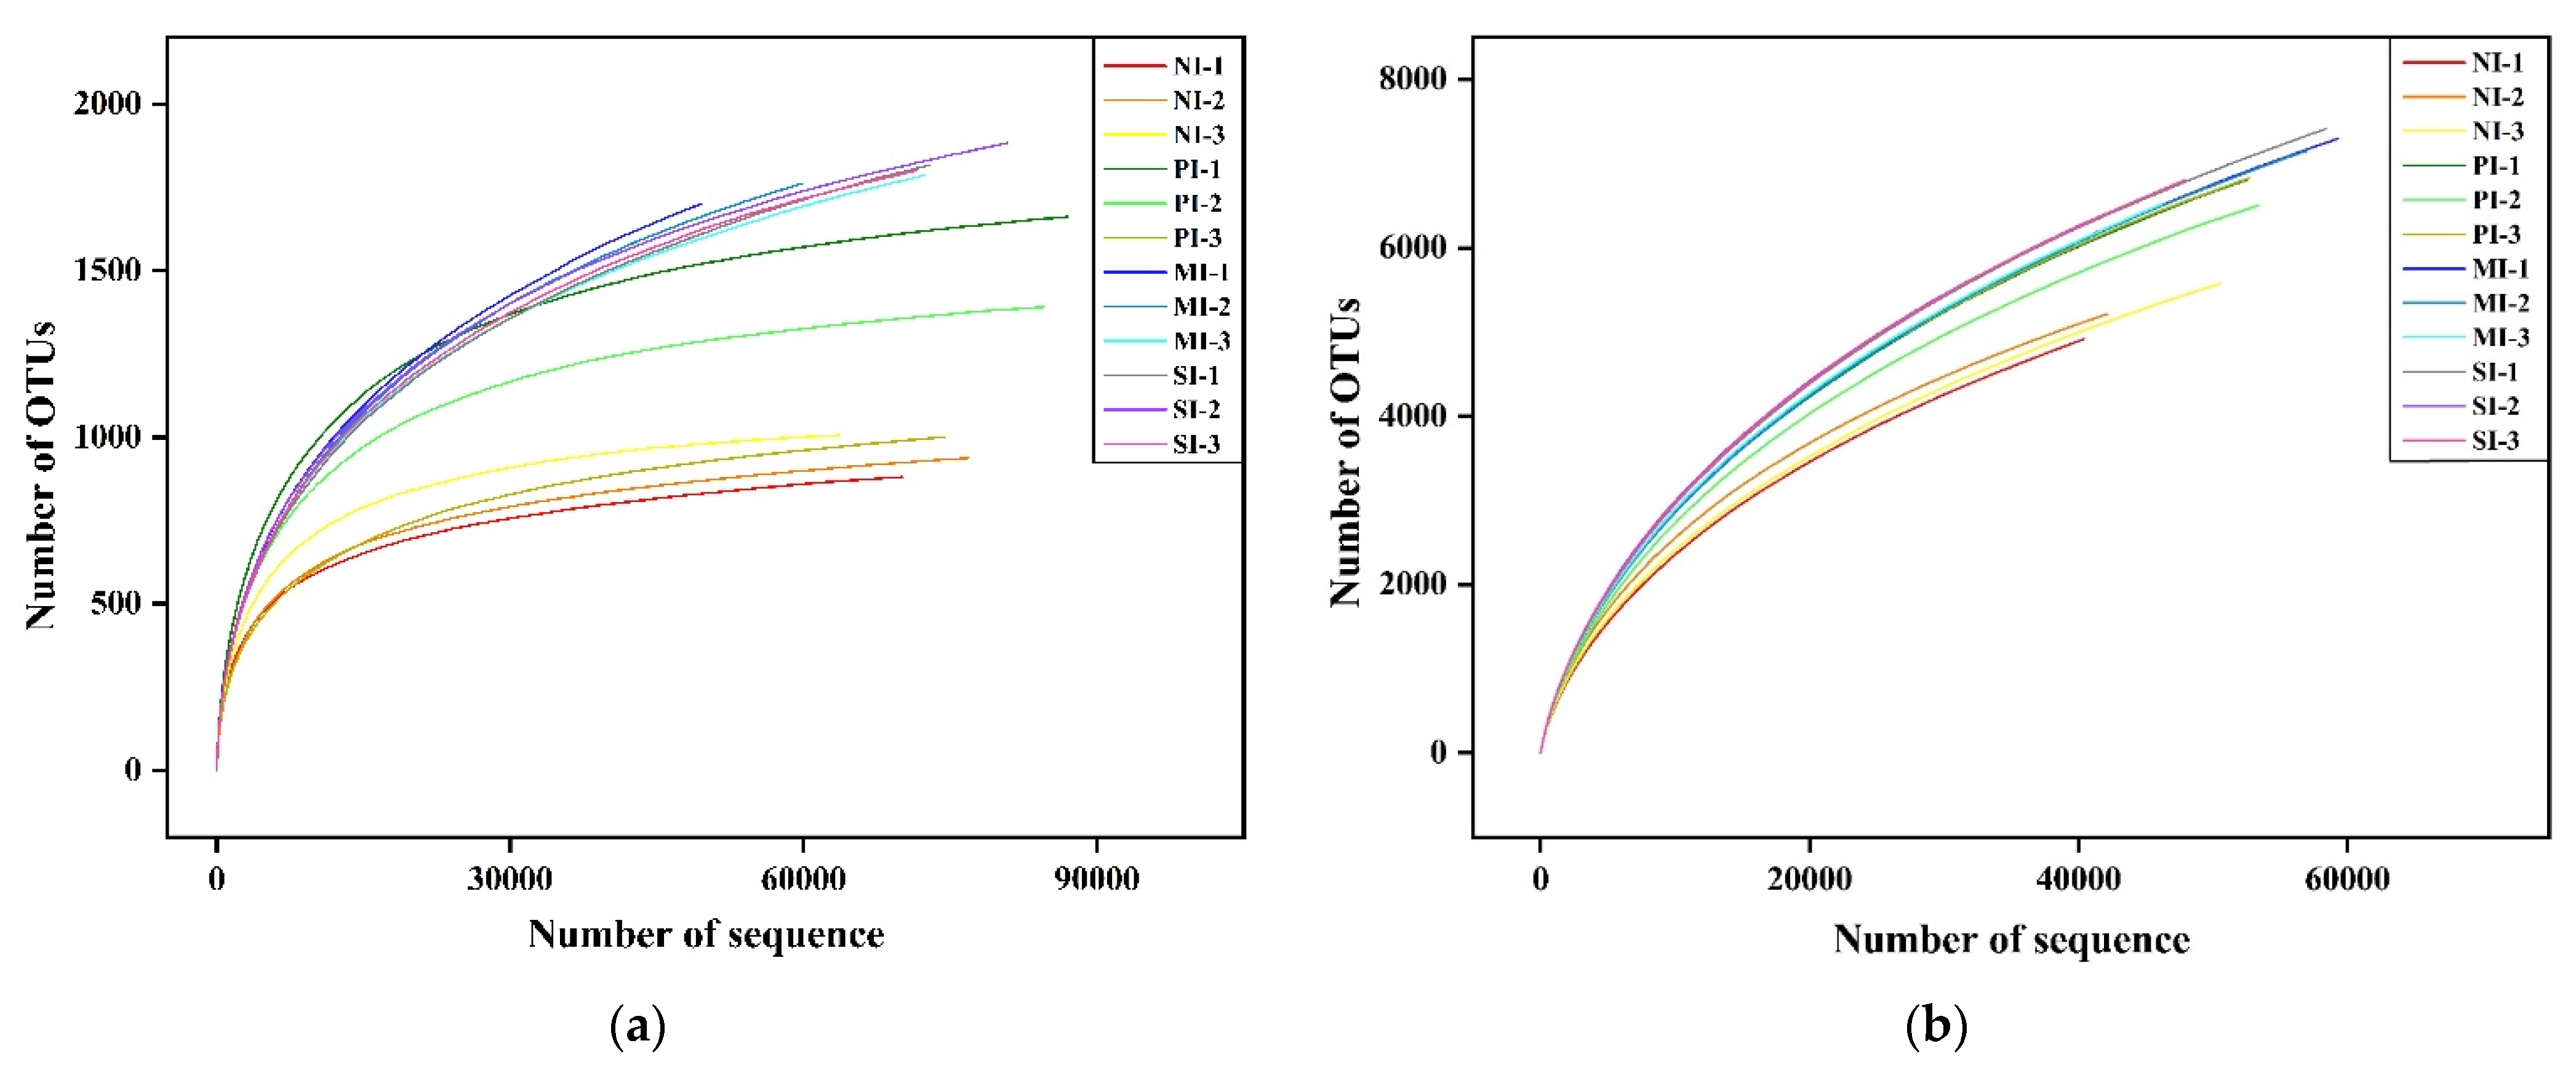
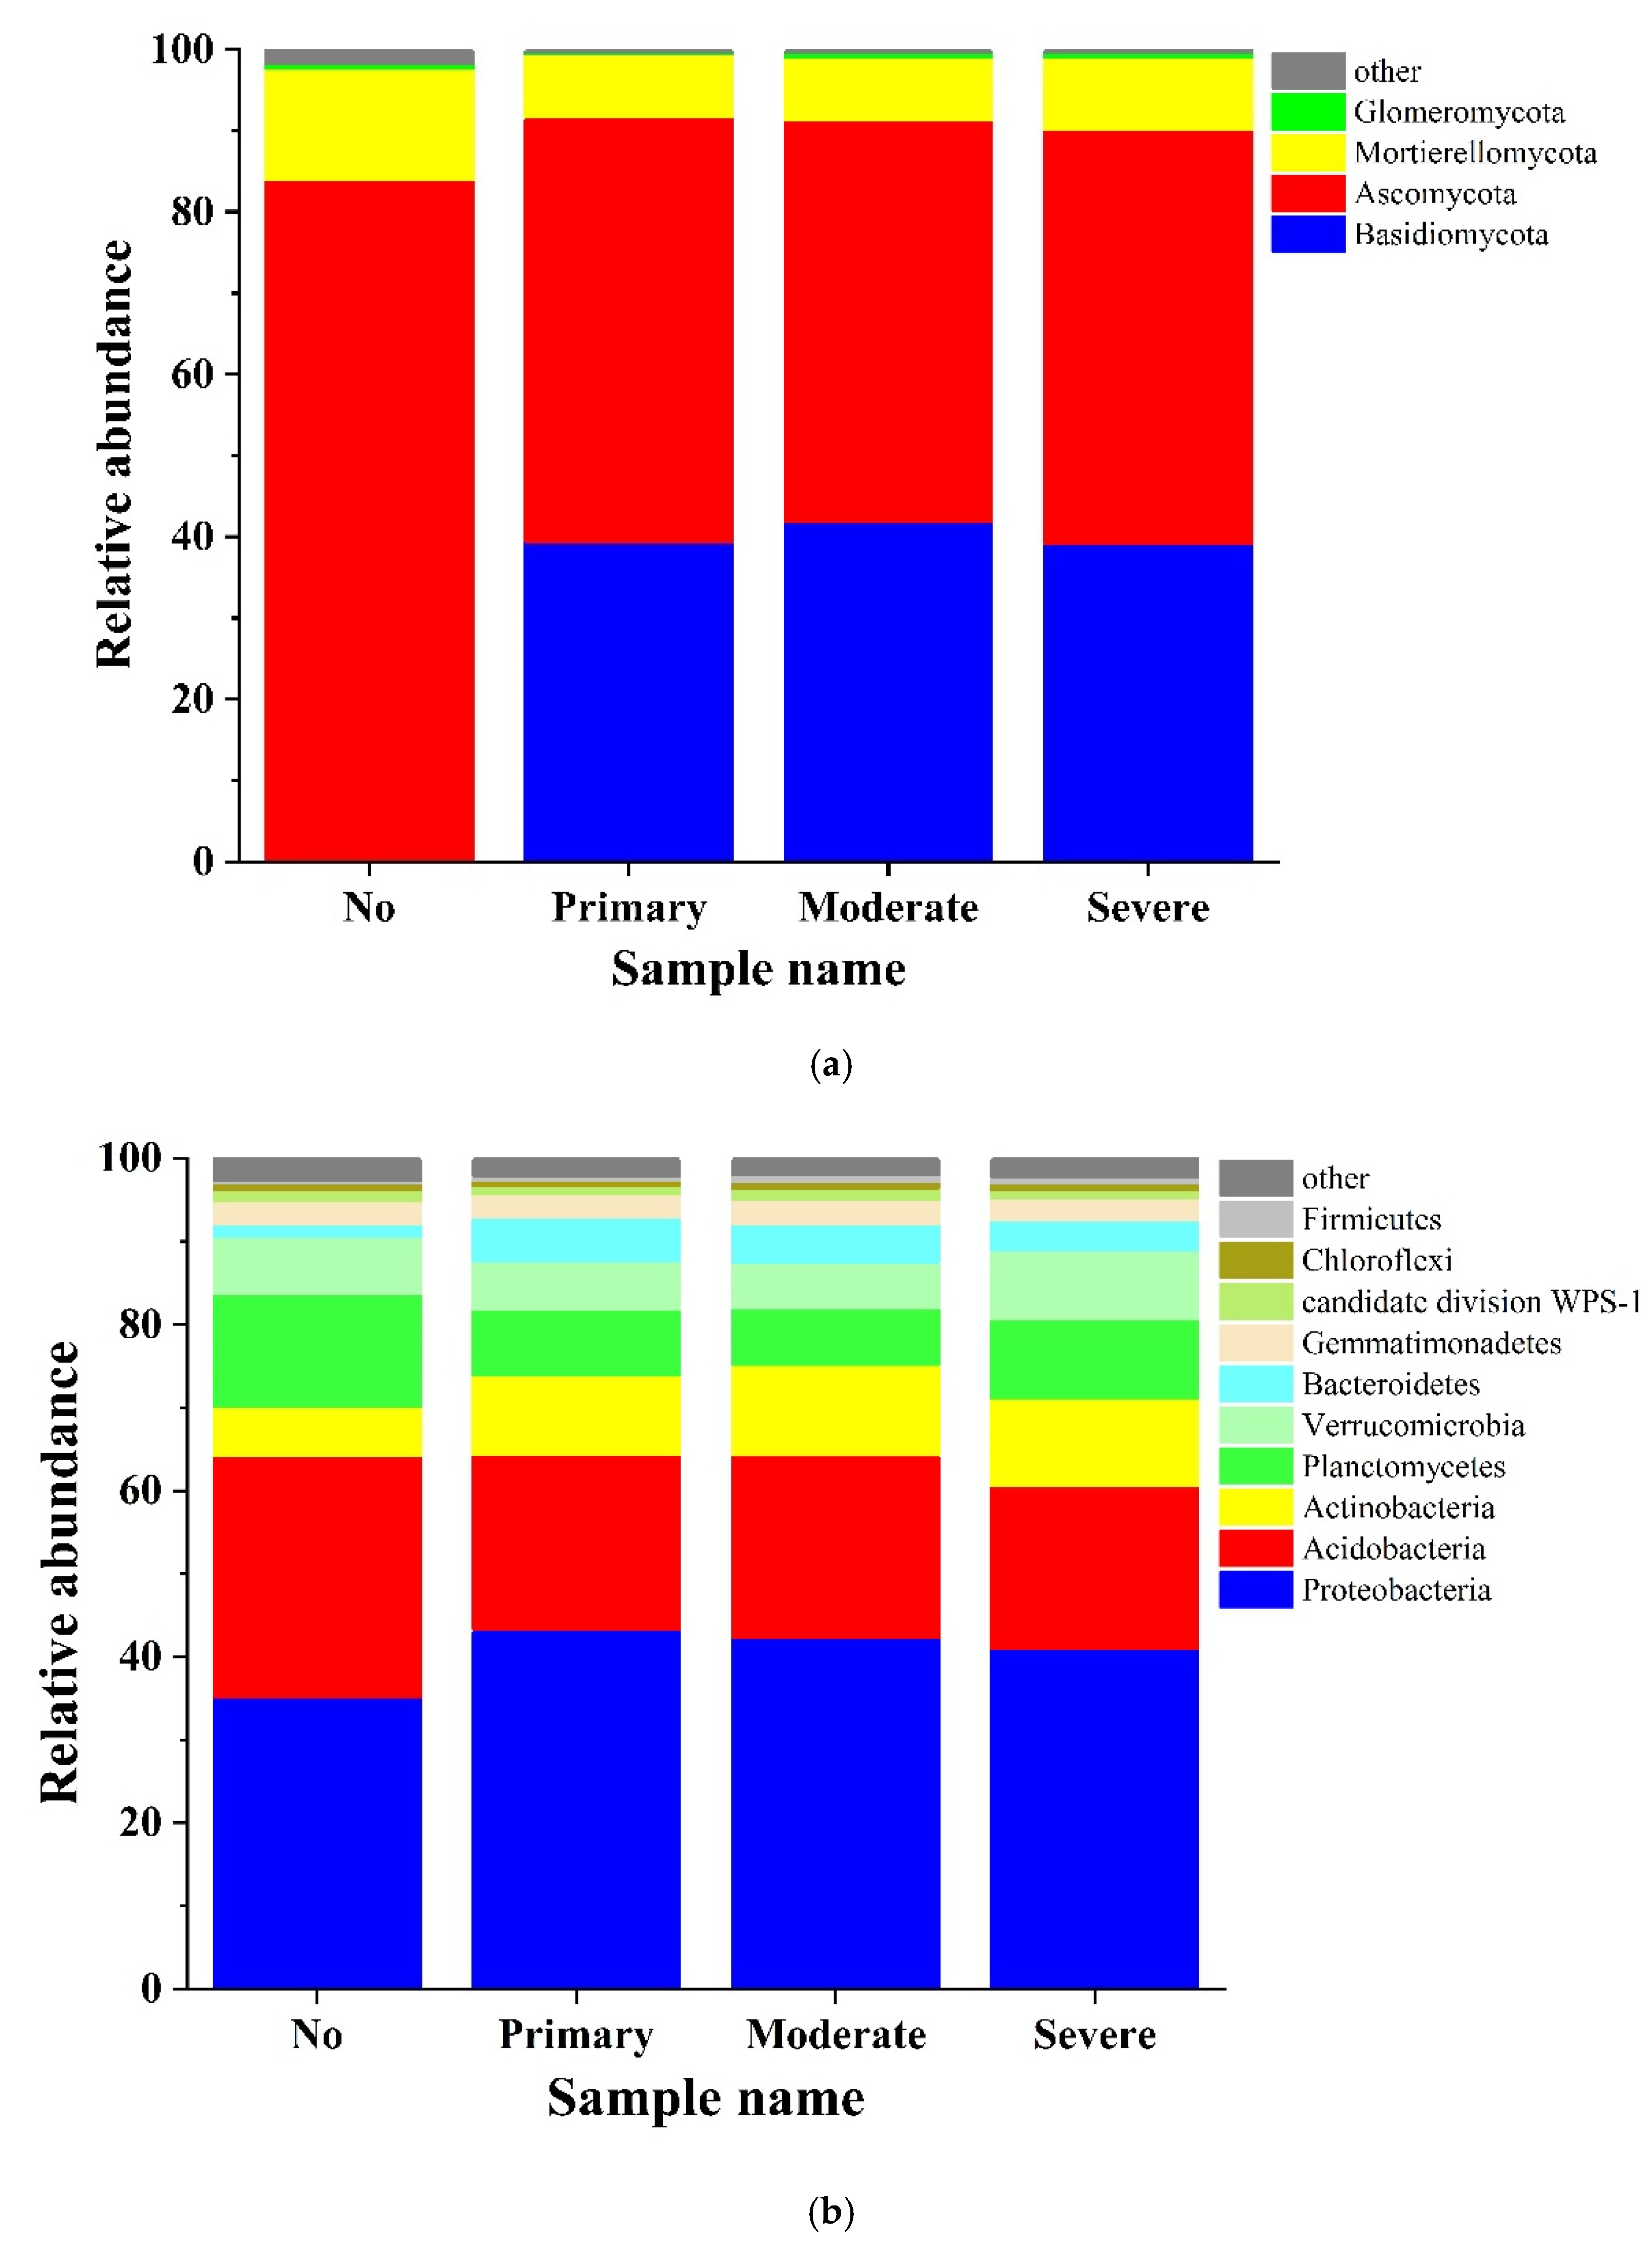
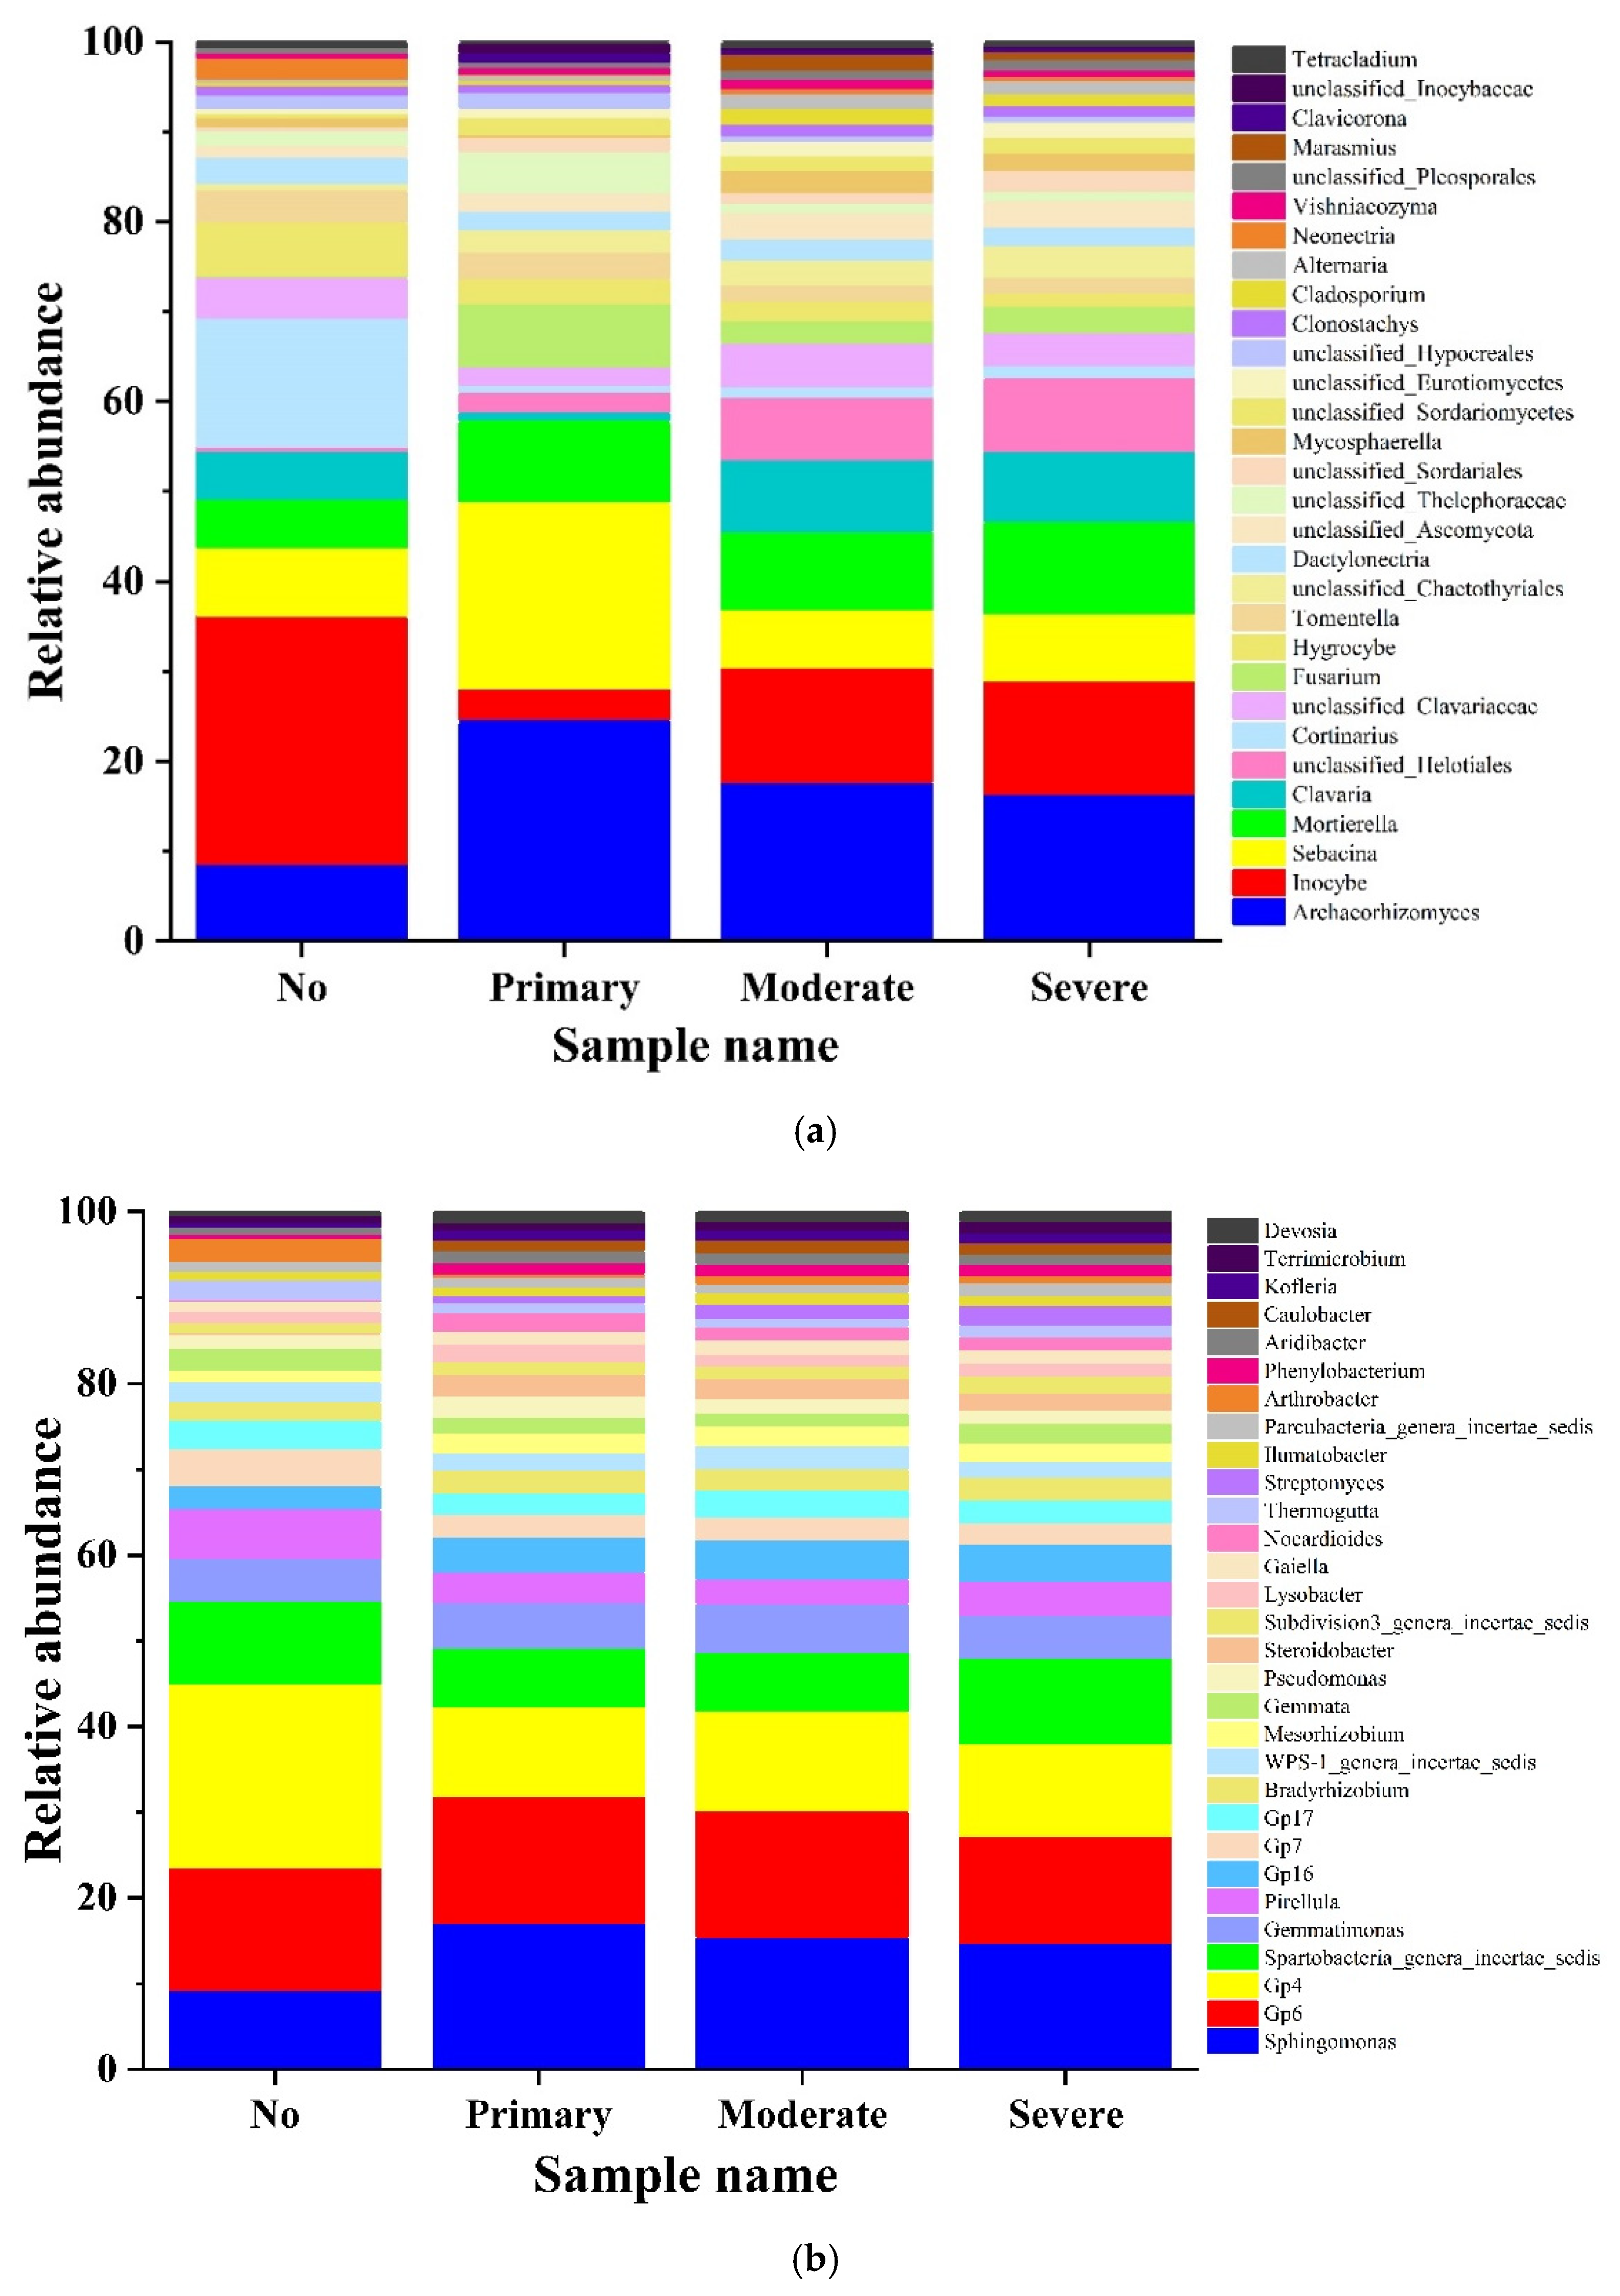
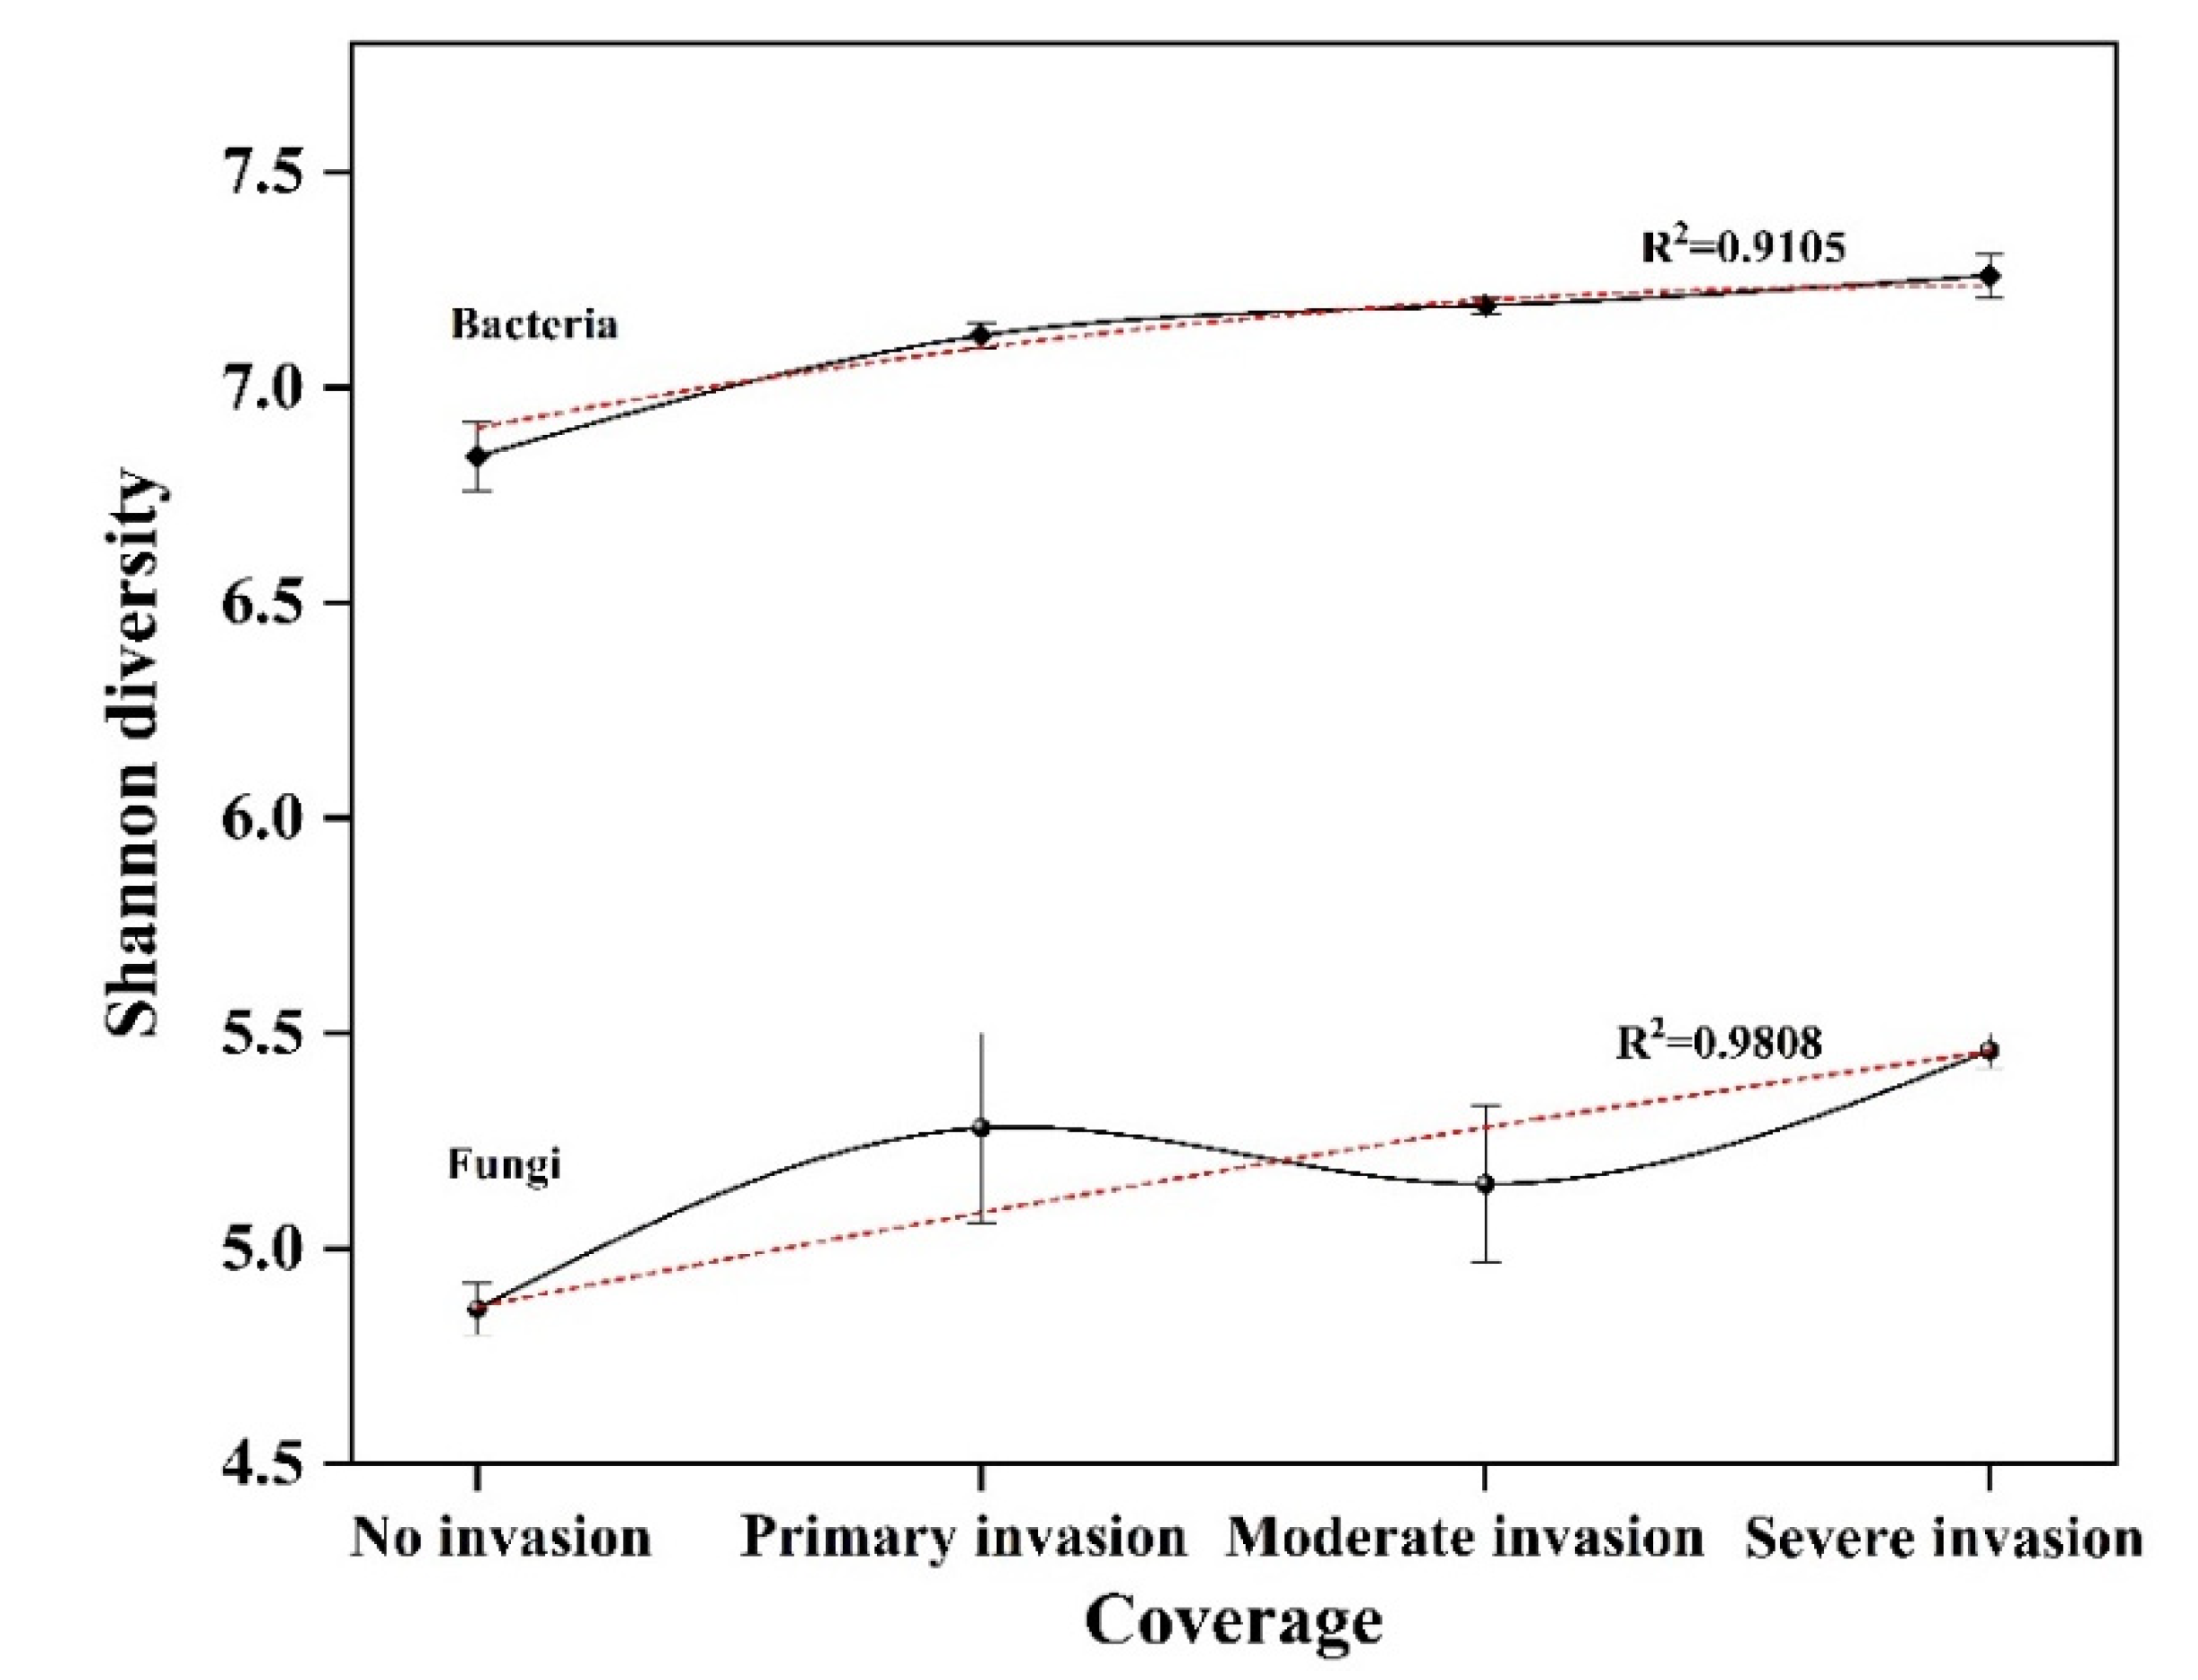
3.3. Analysis of High-Throughput Sequencing Data

We divided the samples with the same coverage into three repeated controls for high-throughput sequencing analysis and then summarized the data. Four samples from the rhizosphere soil of S. chamaejasme with different coverage were clustered with more than 97% similarity to obtain 3788 fungal OTU and 15,496 bacterial OTU. Good coverage of fungi or bacteria included more than 99% or 93%, respectively. Additionally, the sample rarefaction curve shows (Figure 2) that with the increase in the number of sequencing samples, the four samples’ OTU rarefaction curves tend to be smooth. This showed that the amount of data sequenced in this experiment was gradually reasonable and comprehensively reflected the microbial community composition. The increase in the amount of data contributes less to discovering new OTU numbers.
As the species composition of the S. chamaejasme rhizosphere soil fungi at the phylum level under different growth coverage shows, 12 phyla of fungi were obtained from four rhizosphere soil samples with different growth coverages (Figure 3a). Basidiomycetes were the main dominant fungi in the code “No” sample, accounting for 65.31% of the total fungi sequence in the samples. This was then followed by Ascomycetes, accounting for 29.08%. Among the other plot types with S. chamaejasme growing, Ascomycetes were the main dominant phyla, accounting for 52.30%, 49.49%, and 50.88% of the total sequence, followed by basidiomycetes, accounting for 39.35%, 41.79%, and 39.16%. Additionally, 32 phyla of bacteria were obtained; the differences in the bacterial composition in different coverage plots were similar (Figure 3b). The main dominant bacterial phylum was Proteobacteria, accounting for 35.11%, 43.34%, 42.34%, and 40.90% of the total sequence at the phylum level. Additionally, the dominant bacteria were Acidobacteria, Actinobacteria, Planctomycetes, and Verrucomicrobia.
At the genus level, the composition of the microbial community in rhizosphere soil with different coverages of S. chamaejasme is shown in the bar plot (Figure 4). We selected the top 30 fungi and bacteria with the highest abundance and made statistical maps. Inocybe was the main genus of fungi in the rhizosphere soil of the 0% plot, accounting for 27.61%. Additionally, Cortinarius, Archaeorhizomyces, and Sebacina accounted for 10.21%, 6.21%, and 5.47%, respectively. The composition of the fungal genus was similar in the samples growing S. chamaejasme, and the main dominant fungal genus was Archaeorhizomyces, followed by Sebacina, Inocybe, and Mortierella (Figure 4a). The composition structure of the bacterial community was similar in the rhizosphere soil of different coverage plots with S. chamaejasme. However, among the samples with 0% coverage, the abundance of Gp4 was the highest, accounting for 21.56% of the top 30 species. Additionally, this was followed by Gp6 (14.30%), Spartobacteria genera incertae sedis (9.63%), and Sphingomonas (9.19%). Among the other three samples with S. chamaejasme, the order of abundance from high to low was Sphingomonas (17.14%, 15.46%, and 14.76%, according to coverage from a high quantity to low quantity), Gp6 (14.80%, 14.7%, and 12.51%), Gp4 (10.43%, 11.64%, and 10.77%), and Spartobacteria genera incertae sedis (6.83%, 6.82%, and 9.98%) (Figure 4b).
Alpha diversity analysis of microorganisms in the rhizosphere soil of S. chamaejasme is shown in Table 3. Chao1 index and ACE index increased with the increase in coverage, while the Simpson index decreased with the increase in coverage. Rhizosphere soil bacteria have the same changing trend as fungi. To synthesize the above, as the S. chamaejasme growth coverage increased, the richness and diversity of the fungi and bacteria in the sample plot increased. The Shannon diversity index also showed that the diversity of the bacterial community in the rhizosphere soil samples was higher than that of the fungi. With the increase in the growth coverage of S.chamaejasme, the Shannon diversity index showed an increasing trend (Figure 5).

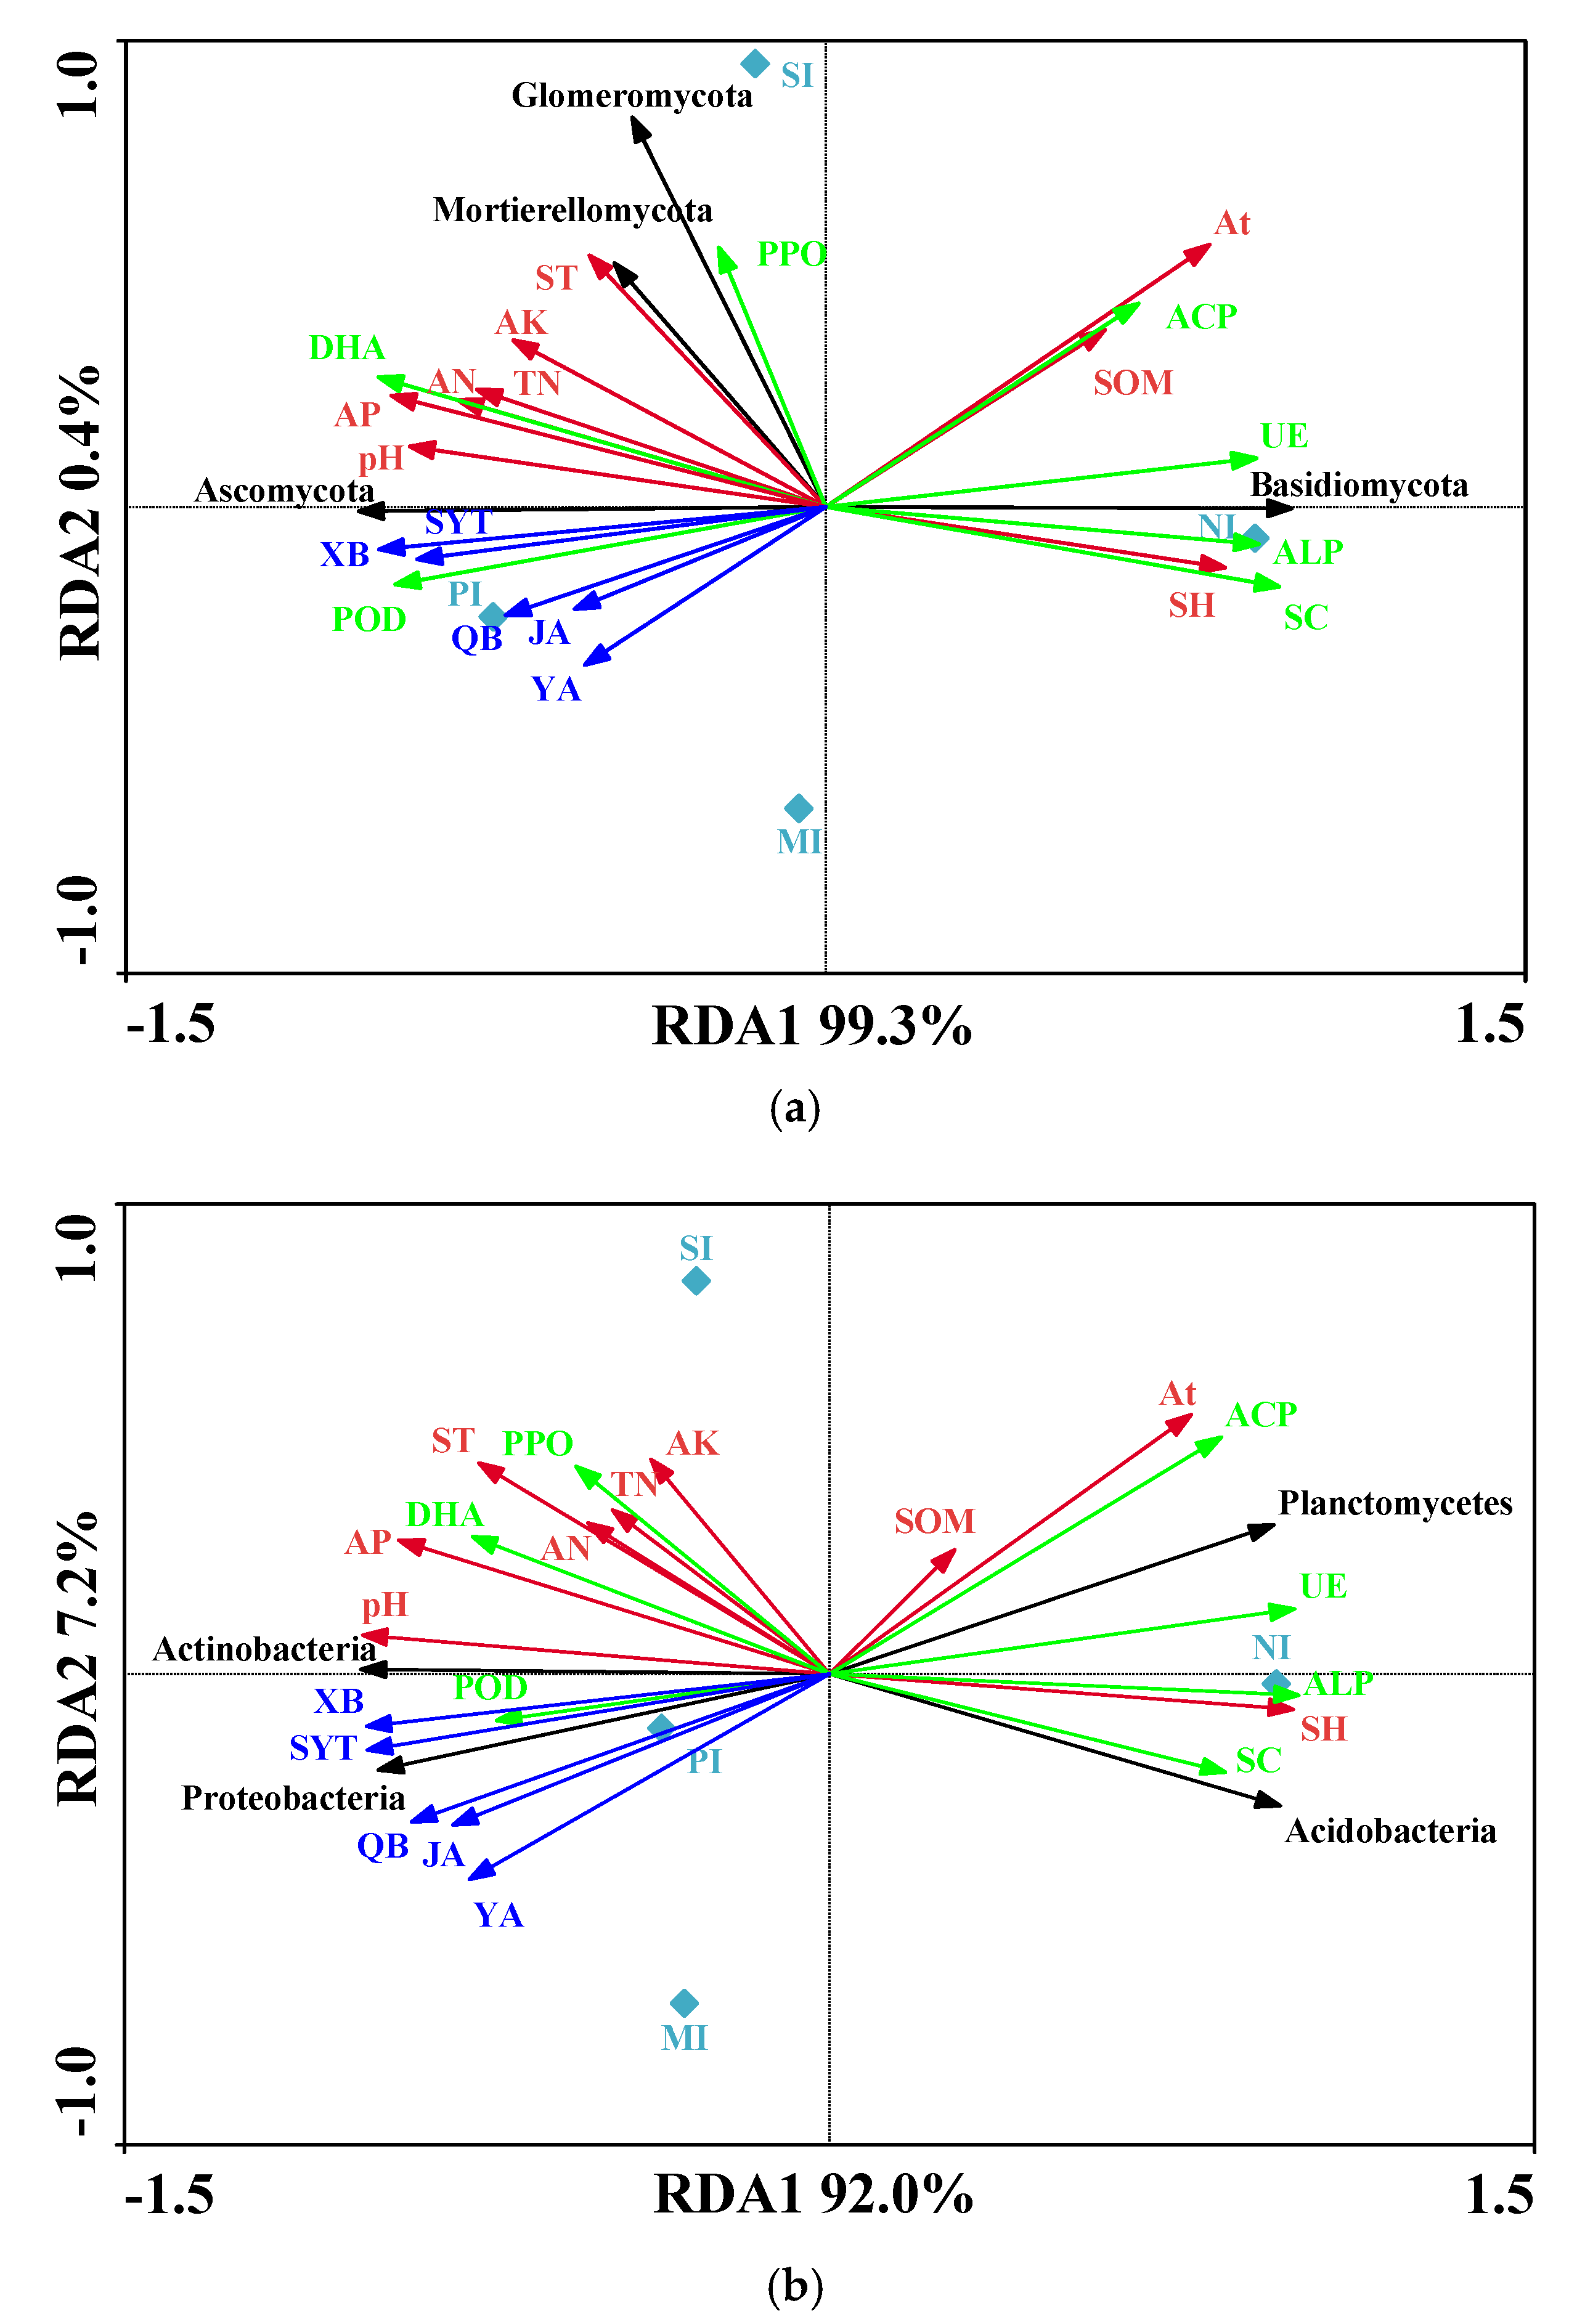
3.4. Relationship between Soil Environmental Factors, Soil Enzyme Activity, and Allelopathic Substances and Bacterial Community

Pearson correlation analysis revealed that Basidiomycetes were negatively correlated with AP and XB and positively correlated with SC. Ascomycetes were positively correlated with AP and negatively correlated with SC. Conversely, Mortierellomycota was positively correlated with AK (Table 4). Bacterial Pearson correlation analysis shows that Proteobacteria was negatively correlated with UE and ALP and positively correlated with SYT and XB. Acidobacteria was negatively correlated with soil pH and AP and positively correlated with SH and ALP. Actinobacteria was positively correlated with soil pH, SYT, and XB and negatively correlated with SH and UE. Planctomycetes were positively correlated with UE and ACP and negatively correlated with allelochemicals SYT, XB, and QB (Table 5). It seemed that enzyme activity, environmental factors, and allelochemicals in rhizosphere soil have more effects on the bacterial community.
Redundancy analysis (RDA) was used to explain the microbial community (response variables) using soil enzyme activities, allelochemicals, and environmental factors (explanatory variables) at the different study sites. A Monte Carlo test of fungi and bacteria showed p < 0.05, indicating a linear relationship between the environmental factors and rhizosphere soil microorganisms. The fungi RDA analysis showed that the RDA1 was 99.3%, and the RDA2 was 0.4%, which can better reflect the relationship between enzyme activity, environmental factors, and the allelopathic and soil fungal community (Figure 6a). Basidiomycota was related to SH, At, ALP, UE, and SC and had a certain correlation with SOM. Mortierellomycota and Glomeromycota were related to soil DHA and POD. Glomeromycota had a certain correlation with PPO and ST. Five allelochemicals were positively correlated with Ascomycota and negatively correlated with Basidiomycota. The bacteria RDA analysis showed that the RDA1 was 92.0%, and the RDA2 was 7.2% (Figure 6b). Acidobacteria and Planctomycetes were highly correlated with soil SH, SC, ALP, UE, ACP, and At and were correlated with SOM. Proteobacteria and Actinobacteria were correlated with soil pH, AP, PPO, POD, and DHA, as well as all allelochemicals. However, there was little correlation between Proteobacteria, Actinobacteria, and the contents of POD, AN, TN, and AK in soil.

4. Discussion

An invasion of plants will release a variety of compounds, and some of the allelochemicals released into soil will impact other plants around them. Some studies have shown that S. chamaejasme releases different amounts of flavonoids into the soil through its roots [23]. The root is one of the main ways that plants release flavonoids to the outside world [34], and flavonoids can adapt plants to environmental stresses, including biological stress and abiotic stress [35]. Several studies have shown that flavonoids secreted by plants into rhizosphere soil can inhibit the growth of surrounding plants [36]. Yan confirmed that the flavonoid allelochemicals released by S. chamaejasme have an obvious inhibitory effect on Arabidopsis thaliana seedlings [24]. This paper is the first study on the rhizosphere allelochemicals and microbial diversity of S. chamaejasme with different coverages. When plants secrete flavonoid allelochemicals to inhibit the growth of other weeds, autotoxicity easily occurs with the extension of the planting time [37].
Using the high-throughput sequencing technique, we found that the similarity of microbial composition in the growing area of S. Stellera was higher, and, the higher the community coverage was, the closer the similarity was. With the increase in the growth coverage, the abundance and diversity of microorganisms in the rhizosphere soil showed an increasing trend (Table 3, Figure 5). In addition, Basidiomycetes and Ascomycetes were the main fungi in the soil, while Proteobacteria and Acidobacteria were the main bacteria. This was similar to the investigation and study of Minxian County and Cuiying Mountain in Gansu Province by Jin and others [28,38]. By comparison, Basidiomycetes was the dominant phylum in the rhizosphere soil at a 0% S. chamaejasme cover. The invasion of S. chamaejasme might result in the dominance of the Ascomycetes in the soil, and the growth of S. chamaejasme increases the enrichment of Proteobacteria and reduces the composition of Acidobacteria in the rhizosphere soil. It seemed that the invasion of S. chamaejasme destroyed the original microbial composition and made it more conducive to its own expansion. Basidiomycetes and Ascomycetes were important decomposers in soil, and under the action of enzymes, they can decompose complex organic compounds, including polycyclic aromatic hydrocarbons [39,40]. Proteobacteria can significantly promote the cycle of nitrogen, phosphorus, sulfur, and organic matter in soil [41], and some studies have shown that acid bacilli have a certain ability to decompose cellulose [42]. These were the main components of the microorganisms in the rhizosphere of S. chamaejasme and played an important role in their growth, development, and invasion.
Studies have shown that allelochemicals can change the growth of neighboring plants and soil microbial communities [43]. Currently, research on rhizosphere fungi and allelochemicals of S. chamaejasme has not been reported. The influence of plant growth coverage on the secretion of allelochemicals is also unknown. With the increase in the growth coverage of S. chamaejasme, the quality of allelochemicals released into the rhizosphere soil showed an increasing trend. When the growth coverage was more than 52%, the release of allelochemicals decreased (Table 2, Figure 1). Therefore, the increase in growth coverage weakens the secretion of allelochemicals once it reaches a threshold. The results of Pearson correlation analysis in this study showed that bacteria were more greatly affected by allelochemicals. RDA analysis showed that Ascomycota and Glomeromycota were positively correlated with neochamaejasmin B, chamaechromone, and dihydrodaphnetin B, indicating that these three allelochemicals had important effects on Ascomycota and Glomeromycota. In addition, neochamaejasmin B and chamaechromone were highly correlated with Proteobacteria and Actinobacteria of bacteria. This may be due to the fact that neochamaejasmin B, chamaechromone, and dihydrodaphnetin B promote the competitiveness of microorganisms in the rhizosphere of S. chamaejasme. Studies have shown that the invasion of exotic plants may change the structure and function of some microorganisms [44]. Ni found that Centaurea diffusa can also release 8-hydroxyquinoline through its root system, which can change the microbial community in susceptible soil [45]. It can also improve the competitiveness of invasive plants. Therefore, S. chamaejasme secretes allelochemicals to affect soil microorganisms and create a rhizosphere microbial community suitable for its own growth, so as to enhance its invasion competitiveness. In addition, the metabolism of flavonoids by the soil microbial community may change the relative abundance of some native microbial species, the activity of the microbial population, and the availability of pollutants in the soil [46]. Vivanco et al. found that allelopathic substances were decomposed and transformed by soil microorganisms after entering the soil, resulting in allelopathic effects on the surrounding plants [47]. Therefore, the interaction between the allelochemicals and microorganisms in rhizosphere soil may play an important role in the invasion of S. chamaejasme.
Soil enzyme activity is one important indicators that reflects changes in the natural environment [48]. The results of Pearson correlation analysis showed that there was little correlation between soil microorganisms and seven kinds of soil enzyme activities. RDA analysis showed a significant positive correlation between DHA and soil allelochemicals, which affected some soil microorganisms. The results show that dehydrogenase can characterize the activity of soil microorganisms [49]. Some studies have also shown that root exudates change the microbial community structure and soil enzyme activity in rhizosphere soil [50]. Therefore, the soil microbial community structure of S. chamaejasme is not only related to allelochemicals but also affects the activity of soil enzymes. In this study, we found that the increase in the growth coverage of S. chamaejasme would increase the activity of some soil enzymes and weaken the activity of other soil enzymes. When we compared the changes in enzyme activity in the soil with different growth coverages, we found that the enzyme activity has a greater change in soil without the growth of S. chamaejasme. Secondly, when the growth coverage was about 25%, the change in enzyme activity was the largest. When the coverage increases, the changes in soil enzyme activity tend to be gradual. Therefore, the invasion of S. chamaejasme greatly affects soil enzyme activity in the initial stage.
Soil environmental factors play an important role in determining the composition of soil microbial communities [51]. Pearson analysis showed that the correlation between soil physical and chemical properties and microbial community was low. Principal component analysis showed little correlation between these and soil microorganisms. In RDA analysis, we found a great correlation between environmental factors and allelochemicals, and this was consistent with the trend of allelopathic substances affecting the microbial community. Mulderij found that the allelopathy of submerged plants was obvious under nutrient stress [52]. Yu found that the soil NH4+, NO3, and available P and K in the heavily invasive soil of Eupatorium adenophorum were significantly higher than those in the slightly invasive soil, and there were significant differences in the characteristics of the soil bacterial community [53]. In the invaded soil of S. chamaejasme, the physical and chemical properties gradually increased with the growth coverage, and it had a higher content of nutrient elements. In addition, similar to the soil enzyme activity results, we found that when the growth coverage was 25%, the rhizosphere soil had a higher content of TN, AN, AK, and AP. Therefore, the initial invasion stage of S. chamaejasme affects the physical and chemical properties of soil and the content of various nutrient elements.

5. Conclusions

In the soil invaded by S. chamaejasme, the physical and chemical properties gradually increased with the growth coverage, and the soil had a higher content of nutrient elements. In the initial invasion stage, S. chamaejasme obviously affected the nutrient element content and enzyme activity of the soil. The invasion of S. chamaejasme changed the microbial community structure of the original soil. As the growth coverage gradually increased, the microbial community structure became more similar. When the microbial community changed, it increased the soil nutrient elements around the rhizosphere of S. chamaejasme and improved the soil physical and chemical properties. It also changed the soil enzyme activity. The effects of the initial invasion stage were greater than in the other invasion stages. The release of allelopathic substances increases with the increase in growth coverage. When the growth coverage exceeds 52%, the secretion of allelopathic substances into the soil is inhibited.

Author Contributions

Conceptualization, D.L., H.J. and B.Q.; methodology, J.C., H.J. and J.Z.; software: J.C. and Z.X.; validation, J.C. and H.L.; formal analysis, J.C.; investigation, J.C., H.J., X.Y., X.X. and D.M.; resources: H.J. and B.Q.; data curation, J.C. and H.J.; writing—original draft preparation, J.C., H.J., J.Z., X.Y., X.X., H.L., D.M. and B.Q.; writing—review and editing, J.C., H.J., X.Y., X.X., H.L., D.M. and B.Q.; visualization, J.C.; supervision, H.J., J.Z., D.L. and B.Q.; project administration, H.J. and B.Q.; funding acquisition, H.J., J.Z. and B.Q. All authors have read and agreed to the published version of the manuscript.

Funding

This research received no external funding.

Institutional Review Board Statement

Not applicable.

Informed Consent Statement

Not applicable.

Data Availability Statement

All relevant data are contained within this article.

Acknowledgments

The authors are grateful for the financial support provided by the National Natural Science Foundation of China (31772668), the Chinese Academy of Sciences Strategic Priority Science and Technology Special Program Class A (XDA26020201-3), the Collaboration Project of Lanzhou Institute of Chinese Academy of Sciences (2021HZ-03), and the sub-project of the National Key Research and Development Program (2019YFC0507703-2).

Conflicts of Interest

The authors declare no conflict of interest.

References

  1. de la Fuente Cantó, C.; Simonin, M.; King, E.; Moulin, L.; Bennett, M.J.; Castrillo, G.; Laplaze, L. An extended root phenotype: The rhizosphere, its formation and impacts on plant fitness. Plant. J. 2020, 103, 951–964. [Google Scholar] [CrossRef] [PubMed] [Green Version]
  2. Berg, G.; Smalla, K. Plant species and soil type cooperatively shape the structure and function of microbial communities in the rhizosphere. FEMS Microbiol. Ecol. 2009, 68, 1–13. [Google Scholar] [CrossRef] [PubMed] [Green Version]
  3. Raaijmakers, J.M.; Paulitz, T.C.; Steinberg, C.; Alabouvette, C.; Moënne-Loccoz, Y. The rhizo-sphere: A playground and battlefield for soilborne pathogens and beneficial microorganisms. Plant. Soil. 2009, 321, 341–361. [Google Scholar] [CrossRef] [Green Version]
  4. Tang, H.; Li, C.; Wen, L.; Li, W.; Shi, L.; Cheng, K.; Xiao, X. Microbial carbon source utilization in rice rhizosphere and non-rhizosphere soils in a 34-year fertilized paddy field. J. Basic Microb. 2020, 60, 1004–1013. [Google Scholar] [CrossRef] [PubMed]
  5. Razavi, B.S.; Zarebanadkouki, M.; Blagodatskaya, E.; Kuzyakov, Y. Rhizosphere shape of lentil and maize: Spatial distribution of enzyme activities. Soil Biol. Biochem. 2016, 96, 229–237. [Google Scholar] [CrossRef]
  6. Inderjit; Seastedt, T.R.; Callaway, R.M.; Pollock, J.L.; Kaur, J. Allelopathy and plant invasions: Traditional, congeneric, and bio-geographical approaches. Biol. Invasions 2008, 10, 875–890. [Google Scholar] [CrossRef]
  7. Kalisz, S.; Kivlin, S.N.; Bialic-Murphy, L. Allelopathy is pervasive in invasive plants. Biol. Invasions 2020, 1–5. [Google Scholar] [CrossRef]
  8. Vishwakarma, K.; Mishra, M.; Jain, S.; Singh, J.; Sharma, S. Exploring the role of plant-microbe interactions in improving soil structure and function through root exudation: A key to sustainable agriculture. Plant.-Microbe Agro-Ecol. Perspect. 2017, 467–487. [Google Scholar] [CrossRef]
  9. Xiao, Z.X.; Lu, S.G.; Xu, Z.H. Biochemistry of allelopathic plant residues in soil. Ekoloji 2019, 28, 2997–3006. [Google Scholar]
  10. Dawkins, K.; Esiobu, N. Emerging Insights on Brazilian Pepper Tree (Schinus terebinthifolius) Invasion: The Potential Role of Soil Microorganisms. Front. Plant. Sci. 2016, 7, 712. [Google Scholar] [CrossRef] [Green Version]
  11. Lankau, R.A. Intraspecific variation in allelochemistry determines an invasive species’ impact on soil microbial communities. Oecologia 2011, 165, 453–463. [Google Scholar] [CrossRef]
  12. Bressan, M.; Roncato, M.-A.; Bellvert, F.; Comte, G.; Haichar, F.Z.; Achouak, W.; Berge, O. Exogenous glucosinolate produced by Arabidopsis thaliana has an impact on microbes in the rhizosphere and plant roots. ISME J. 2009, 3, 1243–1257. [Google Scholar] [CrossRef]
  13. Li, X.G.; Ding, C.F.; Hua, K.; Zhang, T.L.; Zhang, Y.N.; Zhao, L.; Yang, Y.R.; Liu, J.G.; Wang, X.X. Soil sickness of peanuts is attributable to modifications in soil microbes induced by peanut root exudates rather than to direct allelopathy. Soil Biol. Biochem. 2014, 78, 149–159. [Google Scholar] [CrossRef]
  14. Cheng, F.; Cheng, Z.H. Corrigendum: Research Progress on the use of Plant Allelopathy in Agriculture and the Physiological and Ecological Mechanisms of Allelopathy. Front. Plant. Sci. 2016, 7, 1697. [Google Scholar] [CrossRef] [Green Version]
  15. Lu, F.L.; Zheng, L.L.; Chen, Y.Y.; Li, D.P.; Zeng, R.S.; Li, H.S. Soil microorganisms alleviate the allelopathic effect of Eucalyptus grandis × E. urophylla leachates on Brassica chinensis. J. For. Res. 2017, 28, 1203–1207. [Google Scholar] [CrossRef]
  16. Błońska, E.; Lasota, J.; Zwydak, M. The relationship between soil properties, enzyme activity and land use. For. Res. Pap. 2017, 78, 39–44. [Google Scholar] [CrossRef] [Green Version]
  17. Guo, K.Y.; Zhao, Y.Z.; Liu, Y.; Chen, J.H.; Wu, Q.F.; Ruan, Y.F.; Li, S.H.; Shi, J.; Zhao, L.; Sun, X.; et al. Pyrolysis temperature of biochar affects ecoenzymatic stoichiometry and microbial nutrient-use efficiency in a bamboo forest soil. Geoderma 2020, 363, 114162. [Google Scholar] [CrossRef]
  18. Bian, X.B.; Xiao, S.Y.; Zhao, Y.; Xu, Y.H.; Yang, H.; Zhang, L.X. Comparative analysis of rhizosphere soil physiochemical characteristics and microbial communities between rusty and healthy ginseng root. Sci. Rep.-UK 2020, 10, 15756. [Google Scholar] [CrossRef]
  19. Batista, É.R.; Carneiro, J.J.; Pinto, F.A.; Santos, J.V.D.; Carneiro, M.A.C. Environmental drivers of shifts on microbial traits in sites disturbed by a large-scale tailing dam collapse. Sci. Total Environ. 2020, 738, 139453. [Google Scholar] [CrossRef]
  20. Peng, X.Q.; Wang, W. Stoichiometry of soil extracellular enzyme activity along a climatic transect in temperate grasslands of northern China. Soil Biol. Biochem. 2016, 98, 74–84. [Google Scholar] [CrossRef]
  21. Jin, H.; Yang, X.Y.; Liu, R.T.; Yan, Z.Q.; Li, X.D.; Li, X.Z.; Su, A.X.; Zhao, Y.H.; Qin, B. Bacterial community structure associated with the rhizosphere soils and roots of S. chamaejasme along a Tibetan elevation gradient. Ann. Microbiol. 2018, 68, 273–286. [Google Scholar] [CrossRef]
  22. Guo, H.R.; Cui, H.Y.; Jin, H.; Yan, Z.Q.; Ding, L.; Qin, B. Potential allelochemicals in root zone soils of S. chamaejasme and variations at different geographical growing sites. Plant. Growth Regul. 2015, 77, 335–342. [Google Scholar] [CrossRef]
  23. Guo, H.R.; Zeng, L.M.; Yan, Z.Q.; Jin, H.; Li, X.Z.; Guan, J.F.; Qin, B. Allelochemical from the root exudates of S. chamaejasme and its degradation. Allelopath. J. 2016, 38, 103–112. [Google Scholar]
  24. Yan, Z.Q.; Guo, H.R.; Yang, J.Y.; Liu, Q.; Jin, H.; Xu, R.; Cui, H.Y.; Qin, B. Phytotoxic flavonoids from roots of S. chamaejasme (Thymelaeaceae). Phytochemistry 2014, 106, 61–68. [Google Scholar] [CrossRef]
  25. Huang, X.Q.; Chen, Y.; Zhang, X.; Li, F.M.; Ye, H.T. Extract of S. chamaejasme inhibits the progression of hepatocellular carcinoma by regulating miR-134-5p and JAK1/STAT3 pathway. Cancer Biother. Radiopharm. 2020, 35, 586–595. [Google Scholar] [CrossRef]
  26. Jing, C.X.; Guo, J.J.; Yang, B.J.; Fan, S.R.; Wang, Y.T.; Chen, D.Z.; Hao, X.J. Stelleraguaianone B and C, two new sesquiterpenoids from Stellera chamaejasme L. Fitoterapia 2019, 134, 443–446. [Google Scholar] [CrossRef]
  27. Guo, L.Z.; Li, J.H.; He, W.; Liu, L.; Huang, D.; Wang, K. High nutrient uptake efficiency and high water use efficiency facilitate the spread of S. chamaejasme in degraded grasslands. BMC Ecol. 2019, 19, 50. [Google Scholar] [CrossRef] [Green Version]
  28. Jin, H.; Yang, X.Y.; Yan, Z.Q.; Liu, Q.; Li, X.Z.; Chen, J.X.; Zhang, D.H.; Zeng, L.M.; Qin, B. Characterization of rhizosphere and endophytic bacterial communities from leaves, stems and roots of medicinal S. chamaejasme. Syst. App. Microbiol. 2014, 37, 376–385. [Google Scholar] [CrossRef]
  29. Gardes, M.; Bruns, T.D. ITS primers with enhanced specificity for basidiomycetes - application to the identification of mycorrhizae and rusts. Mol. Ecol. 1993, 2, 113–118. [Google Scholar] [CrossRef]
  30. White, T.J.; Bruns, T.; Lee, S.; Taylor, J. Amplification and direct sequencing of fungal ribosomal RNA genes for phylogenetics - ScienceDirect. PCR Protoc. 1990, 315–322. [Google Scholar] [CrossRef]
  31. Sofie, T.; Michiel, O.D.B.; Bram, B.; Sascha, T.; Vincent, S.; Van, H.J.D.; Nele, W.; Jaco, V. Comparative evaluation of four bacteria-specific primer pairs for 16S rRNA gene surveys. Front. Microbiol. 2017, 8, 494. [Google Scholar] [CrossRef]
  32. Cole, J.R.; Wang, Q.; Fish, J.A.; Chai, B.; McGarrell, D.M.; Sun, Y.; Brown, C.T.; Porras-Alfaro, A.; Kuske, C.R.; Tiedje, J.M. Ribosomal database project: Tools and data for high throughput rRNA analysis. Nucleic Acids Res. 2014, 42, 633–642. [Google Scholar] [CrossRef] [Green Version]
  33. Quast, C.; Pruesse, E.; Yilmaz, P.; Gerken, J.; Schweer, T.; Yarza, P.; Peplies, J.; Glöckner, F.O. The SILVA ribosomal RNA gene database project: Improved data processing and web-based tools. Nucleic Acids Res. 2012, 41, D590–D596. [Google Scholar] [CrossRef] [PubMed]
  34. Deng, J.C.; Yang, C.Q.; Zhang, J.; Zhang, Q.; Yang, F.; Yang, W.Y.; Liu, J. Organ-specific differential NMR-based metabonomic analysis of soybean [Glycine max (L.) Merr.] fruit reveals the metabolic shifts and potential protection mechanisms involved in field mold infection. Front. Plant. Sci. 2017, 8, 508. [Google Scholar] [CrossRef] [PubMed] [Green Version]
  35. Liu, Z.H.; Liu, Y.X.; Pu, Z.E.; Wang, J.R.; Zheng, Y.L.; Li, Y.H.; Wei, Y.M. Regulation, evolution, and functionality of flavonoids in cereal crops. Biotechnol. Lett. 2013, 35, 1765–1780. [Google Scholar] [CrossRef]
  36. Saito, K.; Yonekura-Sakakibara, K.; Nakabayashi, R.; Higashi, Y.; Yamazaki, M.; Tohge, T.; Fernie, A. The flavonoid biosynthetic pathway in Arabidopsis: Structural and genetic diversity. Plant. Physiol. Bioch. 2013, 72, 21–34. [Google Scholar] [CrossRef] [PubMed] [Green Version]
  37. Weston, L.A.; Mathesius, U. Flavonoids: Their structure, biosynthesis and role in the rhizosphere, including allelopathy. J. Chem. Ecol. 2013, 39, 283. [Google Scholar] [CrossRef]
  38. Jin, H.; Yang, X.Y.; Lu, D.X.; Li, C.J.; Yan, Z.Q.; Li, X.Z.; Zeng, L.M.; Qin, B. Phylogenic diversity and tissue specificity of fungal endophytes associated with the pharmaceutical plant, S. chamaejasme revealed by a cultivation-independent approach. Anton. Leeuw. 2015, 108, 835–850. [Google Scholar] [CrossRef] [PubMed]
  39. Syed, K.; Doddapaneni, H.; Subramanian, V.; Lam, Y.W.; Yadav, J.S. Genome-to-function characterization of novel fungal P450 monooxygenases oxidizing polycyclic aromatic hydrocarbons (PAHs). Biochem. Bioph. Res. Co. 2010, 399, 492–497. [Google Scholar] [CrossRef] [Green Version]
  40. Godoy, P.; Reina, R.; Calderón, A.; Wittich, R.M.; García-Romera, I.; Aranda, E. Exploring the potential of fungi isolated from PAH-polluted soil as a source of xenobiotics-degrading fungi. Environ. Sci. Pollut. R. 2016, 23, 20985–20996. [Google Scholar] [CrossRef]
  41. Lv, X.F.; Yu, J.B.; Fu, Y.Q.; Ma, B.; Qu, F.Z.; Ning, K.; Wu, H.F. A Meta-Analysis of the bacterial and archaeal diversity observed in wetland soils. Sci. World J. 2014, 437684. [Google Scholar] [CrossRef] [Green Version]
  42. Eichorst, S.A.; Kuske, C.R.; Schmidt, T.M. Influence of plant polymers on the distribution and cultivation of bacteria in the phylum Acidobacteria. Appl. Environ. Microb. 2011, 77, 586–596. [Google Scholar] [CrossRef] [PubMed] [Green Version]
  43. Zhalnina, K.; Louie, K.B.; Hao, Z.; Mansoori, N.; da Rocha, U.N.; Shi, S.J.; Cho, H.J.; Karaoz, U.; Loqué, D.; Bowen, B.P.; et al. Dynamic root exudate chemistry and microbial substrate preferences drive patterns in rhizosphere microbial community assembly. Nat. Microbiol. 2018, 3, 470–480. [Google Scholar] [CrossRef] [Green Version]
  44. McLeod, M.L.; Cleveland, C.C.; Lekberg, Y.; Maron, J.L.; Philippot, L.; Bru, D.; Callaway, R.M. Exotic invasive plants increase productivity, abundance of ammonia-oxidizing bacteria and nitrogen availability in intermountain grasslands. J. Ecol. 2016, 104, 994–1002. [Google Scholar] [CrossRef] [Green Version]
  45. Ni, G.Y.; Song, L.Y.; Zhang, J.L.; Peng, S.L. Effects of root extracts of Mikania micrantha H.B.K. on soil microbial community. Alleloapthy J. 2006, 17, 247–254. [Google Scholar]
  46. Shaw, L.J.; Morris, P.; Hooker, J.E. Perception and modification of plant flavonoid signals by rhizosphere microorganisms. Environ. Microbiol. 2006, 8, 1867–1880. [Google Scholar] [CrossRef]
  47. Vivanco, J.M.; Bais, H.P.; Stermitz, F.R.; Thelen, G.C.; Callaway, R.M. Biogeographical variation in community response to root allelochemistry: Novel weapons and exotic invasion. Ecol. Lett. 2004, 7, 285–292. [Google Scholar] [CrossRef]
  48. Ma, S.H.; Chen, G.P.; Tang, W.G.; Xing, A.J.; Chen, X.; Xiao, W.; Zhou, L.H.; Zhu, J.L.; Li, Y.D.; Zhu, B.; et al. Inconsistent responses of soil microbial community structure and enzyme activity to nitrogen and phosphorus additions in two tropical forests. Plant. Soil. 2021, 460, 1–16. [Google Scholar] [CrossRef]
  49. Chu, H.Y.; Lin, X.G.; Fujii, T.; Morimoto, S.; Yagi, K.; Hu, J.L.; Zhang, J.B. Soil microbial biomass, dehydrogenase activity, bacterial community structure in response to long-term fertilizer management. Soil Biol. Biochem. 2007, 39, 2971–2976. [Google Scholar] [CrossRef]
  50. Liu, J.G.; Li, Y.B.; Jiang, G.Y.; Bian, X.M.; Geng, W. Allelopathic effects of cotton in continuous cropping. Allelopathy J. 2008, 21, 299–305. [Google Scholar]
  51. Gong, Z.Z.; Xiong, L.M.; Shi, H.Z.; Yang, S.H.; Herrera-Estrella, L.; Xu, G.H.; Chao, D.Y.; Li, J.R.; Wang, P.Y.; Qin, F.; et al. Plant abiotic stress response and nutrient use efficiency. Sci. China Life Sc. 2020, 63, 635–674. [Google Scholar] [CrossRef] [PubMed]
  52. Mulderij, G.; Mooij, W.M.; Smolders, A.J.P.; Donk, E.V. Allelopathic inhibition of phytoplankton by exudates from Stratiotes aloides. Aquat. Bot. 2005, 82, 284–296. [Google Scholar] [CrossRef]
  53. Yu, X.J.; Yu, D.; Lu, Z.J.; Keping, M.A. A new mechanism of invader success: Ex-otic plant inhibits natural vegetation restoration by changing soil mi-crobe community. Chin. Sci. Bull. 2005, 50, 1105–1112. [Google Scholar] [CrossRef]
Figure 1. The relationship between growth coverage and quantity of allelochemicals: (a) chamaechromone; (b) mesoneochamaejasmin A; (c) neochamaejasmin B; (d) dihydrodaphnodorin B; and (e) 7-methoxyneochamaejasmine A.
Microorganisms 10 00158 g001
Figure 2. Fungi (a) and bacteria (b) rarefaction curves. NI, no invasion; PI, primary invasion; MI, moderate invasion; SI, severe invasion. OTUs, operational taxonomic units.
Microorganisms 10 00158 g002
Figure 3. Phylum composition of fungi (a) and bacteria (b). No, no invasion; primary, primary invasion; moderate, moderate invasion; severe, severe invasion.
Microorganisms 10 00158 g003
Figure 4. Genus composition of fungi (a) and bacteria (b).
Microorganisms 10 00158 g004
Figure 5. Shannon diversity of fungi and bacteria varies with coverage.
Microorganisms 10 00158 g005
Figure 6. Redundancy analysis (RDA) of fungi (a) and bacteria (b). The red arrow and the green arrow represent the relative position of soil physical and chemical properties and enzyme activity on the horizontal plane; the blue arrow represents the relative position of soil allelochemicals on the horizontal plane. The black arrow represents the species distribution at the phylum level, and the longer the arrow, the greater the impact of the species in the sample. Where the angle between the arrow and the sort axis is different, the correlation strength is also different. The smaller the angle, the greater the correlation, and, the longer the length of the arrow, the greater the effect of the environmental factor. Note: pH, hydrogen ion concentration; At, altitude; ST, soil temperature; SH, soil humidity; SOM, soil organic matter; TN, total nitrogen; AN, alkali-hydrolyzable nitrogen; AK, available potassium; AP, available phosphorous; PPO, polyphenol oxidase; POD, peroxidase; UE, urease; DHA, dehydrogenases; SC, sucrase; ALP, alkaline phosphatase; ACP, acid phosphatase; SYT, chamaechromone; YA, mesoneochamaejasmin A; XB, neochamaejasmin B; QB, dihydrodaphnodorin B; JA, 7-methoxyneochamaejasmine A; NI, no invasion; PI, primary invasion; MI, moderate invasion; SI, severe invasion.
Microorganisms 10 00158 g006
Table 1. Sample plot information table.
Sample NumberAltitude (m)Northern LatitudeEastern LongitudePopulation CoverageCoverage Gradient (%)
1296037°7′37″102°50′3″0.000
2297037°7′36″102°50′3″0.00
3297037°7′33″102°49′38″0.00
4297037°7′33″102°50′0″0.00
5296037°7′36″102°50′4″25.5025.13 ± 1.26
6289037°7′33″102°49′56″26.75
7293037°7′37″102°50′17″25.00
8294037°7′36″102°50′17″23.25
9294037°7′34″102°50′1″50.5052.63 ± 2.76
10292037°7′42″102°50′14″57.25
11293037°7′48″102°50′16″50.50
12295037°7′42″102°50′5″52.25
13296037°7′35″102°50′2″85.0089.69 ± 4.81
14297037°7′35″102°49′59″85.75
15295037°7′43″102°50′12″97.00
16295037°7′45″102°50′16″91.00
Table 2. Statistical table of physical and chemical properties, enzyme activities, and allelochemicals in rhizosphere soil.
NameNo InvasionPrimary InvasionModerate InvasionSevere Invasion
pH7.46 ± 0.01 b7.60 ± 0.01 a7.60 ± 0.02 a7.61 ± 0.01 a
At (m)2968 ± 2.50 a2930 ± 14.72 b2935 ± 6.45 b2958 ± 4.79 a
ST (°C)4.80 ± 0.15 a4.93 ± 0.09 a5.03 ± 0.09 a5.17 ± 0.09 a
SH (%)39.39 ± 2.56 a30.48 ± 0.34 b29.63 ± 0.18 b29.18 ± 0.37 b
SOM (g/kg)131.41 ± 0.94 b113.83 ± 0.29 c132.11 ± 0.52 b135.45 ± 0.85 a
TN (g/kg)6.83 ± 0.04 c8.24 ± 0.01 a6.66 ± 0.01 d7.45 ± 0.01 b
AN (mg/kg)586.23 ± 0.96 c690.35 ± 2.56 a582.06 ± 1.91 c634.12 ± 2.74 b
AK (mg/kg)255.4 ± 0.68 c368.1 ± 1.36 a223.42 ± 1.99 d310.28 ± 1.88 b
AP (mg/kg)38.4 ± 0.21 d58.94 ± 0.17 a49.97 ± 0.41 c56.91 ± 0.23 b
PPO (mg/d/g)13.53 ± 0.12 c13.74 ± 0.12 c16.03 ± 0.10 b17.61 ± 0.05 a
POD (mg/d/g)30.44 ± 0.17 c45.59 ± 0.26 b35.79 ± 0.06 a35.59 ± 0.46 b
UE (μg/d/g)860.93 ± 1.41 a756.62 ± 0.29 c758.08 ± 0.41 c776.10 ± 0.48 b
DHA (μg/d/g)6.09 ± 0.08 d23.03 ± 0.16 a10.85 ± 0.13 c17.33 ± 0.15 b
SC (mg/d/g)62.81 ± 0.17 a59.79 ± 0.16 d61.56 ± 0.13 b60.74 ± 0.31 c
AKP (umol/d/g)8.11 ± 0.13 a4.25 ± 0.06 b4.55 ± 0.06 b4.41 ± 0.14 b
ACP (umol/d/g)15.63 ± 0.10 a13.99 ± 0.10 b12.99 ± 0.20 c14.45 ± 0.15 b
SYT (mg/kg)--7.79 ± 0.06 b8.74 ± 0.08 a6.93 ± 0.02 c
YA (mg/kg)--3.24 ± 0.06 c7.69 ± 0.07 a3.75 ± 0.01 b
XB (mg/kg)--12.78 ± 0.13 a11.21 ± 0.09 b9.69 ± 0.05 c
QB (mg/kg)--5.10 ± 0.04 b8.52 ± 0.10 a5.32 ± 0.01 c
JA (mg/kg)--11.31 ± 0.10 c26.28 ± 0.20 a15.62 ± 0.09 b
Note: pH, hydrogen ion concentration; At, altitude; ST, soil temperature; SH, soil humidity; SOM, soil organic matter; TN, total nitrogen; AN, alkali-hydrolyzable nitrogen; AK, available potassium; AP, available phosphorous; PPO, polyphenol oxidase; POD, peroxidase; UE, urease; DHA, dehydrogenases; SC, sucrase; ALP, alkaline phosphatase; ACP, acid phosphatase; SYT, chamaechromone; YA, mesoneochamaejasmin A; XB, neochamaejasmin B; QB, dihydrodaphnodorin B; JA, 7-methoxyneochamaejasmine A. a, b, c, d, significant difference.
Table 3. Alpha diversity of rhizosphere soil microorganisms.
Sample NameEffective TagsOTUShannon IndexSimpson IndexChao1 IndexACE IndexCoverage (%)
FungiF-070,240 ± 3823 b938 ± 40 b4.86 ± 0.06 b0.026 ± 0.003 a1039.00 ± 38.65 b1028.29 ± 34.01 b99.80
F-181,977 ± 3836 a1387 ± 201 a5.28 ± 0.22 a0.013 ± 0.003 a1553.82 ± 208.18 a1525.87 ± 203.69 a99.08
F-289,715 ± 13232 a1429 ± 57 a5.15 ± 0.18 a0.017 ± 0.007 a1678.31 ± 33.62 a1665.56 ± 53.87 a99.10
F-377,406 ± 8489 a1634 ± 92 a5.46 ± 0.04 a0.010 ± 0.000 b1841.96 ± 90.65 a1844.77 ± 97.90 a99.30
BacteriaB-044,335 ± 3130 a5235 ± 191 b6.84 ± 0.08 b0.005 ± 0.000 b8413.62 ± 309.63 b10,702.66 ± 442.60 c94.60
B-152,847 ± 271 a6713 ± 181 a7.12 ± 0.03 a0.004 ± 0.000 a10,251.66 ± 116.19 a12,729.96 ± 125.85 b94.40
B-254,133 ± 4029 a6989 ± 414 a7.19 ± 0.02 a0.004 ± 0.000 a10,912.19 ± 146.59 a14,014.21 ± 220.17 a94.10
B-350,430 ± 6233 a6940 ± 423 a7.26 ± 0.05 a0.003 ± 0.000 a10,914.76 ± 254.76 a13,567.63 ± 224.51 a93.80
a, b, c, d, significant difference.
Table 4. Pearson correlation analysis of fungi community.
BasidiomycotaAscomycotaMortierellomycotaGlomeromycotaTotal FungiDiversity
CCpCCpCCpCCpCCpCCp
pH−0.9060.094 0.8750.125 0.1600.840 0.6330.367 0.7600.240 0.939 0.061
At0.8210.179 −0.8270.173 −0.0210.979 0.1000.900 −0.4140.586 −0.602 0.398
ST−0.5330.4670.4770.5230.0270.9730.9030.0970.8190.1810.8640.136
SH0.8730.127−0.8380.162−0.0970.903−0.6420.358−0.8060.194−0.9620.038
SOM0.5730.427 −0.6270.373 −0.5830.417 0.3240.676 0.3970.603 0.106 0.894
TN−0.7290.271 0.7640.236 0.9150.085 0.2980.702 −0.2560.744 0.097 0.903
AN−0.7710.229 0.8030.197 0.8900.110 0.3120.688 −0.2000.800 0.155 0.845
AK−0.6510.349 0.6860.314 0.9610.039 0.3420.658 −0.3210.679 0.024 0.976
AP−0.9620.038 0.9520.048 0.5380.462 0.6500.350 0.4450.555 0.727 0.273
PPO−0.2580.742 0.1940.806 −0.1830.817 0.8470.153 0.8210.179 0.761 0.239
POD−0.9090.091 0.9350.065 0.5850.415 0.1160.884 0.0580.942 0.385 0.615
UE0.9340.066 −0.9120.088 −0.0990.901 −0.4270.573 −0.7150.285 −0.902 0.098
DHA−0.9230.077 0.9360.064 0.7470.253 0.4850.515 0.1280.872 0.466 0.534
SC0.9680.032 −0.9750.025 −0.6440.356 −0.4890.511 −0.2550.745 −0.577 0.423
ALP0.9410.059 −0.9150.085 −0.2020.798 −0.5810.419 −0.7100.290 −0.911 0.089
ACP0.6870.313 −0.6570.343 0.3550.645 −0.1270.873 −0.8220.178 −0.872 0.128
SYT−0.890.110 0.8610.139 0.0010.999 0.4370.563 0.7870.213 0.940 0.060
YA−0.5390.461 0.4950.505 −0.5100.490 0.2120.788 0.9300.070 0.903 0.097
Table 5. Pearson correlation analysis of bacteria community.
ProteobacteriaAcidobacteriaActinobacteriaPlanctomycetesTotal BacteriaDiversity
CCpCCpCCpCCpCCpCCp
pH0.924 0.076 −0.979 0.021 0.997 0.003 −0.921 0.079 0.850 0.150 0.968 0.032
At−0.914 0.086 0.586 0.414 −0.736 0.264 0.879 0.121 −0.215 0.785 −0.517 0.483
ST0.5300.470−0.8440.1560.7880.212−0.6020.3980.9830.0170.9300.070
SH−0.9050.0950.9700.030−0.9960.0040.9220.078−0.8640.136−0.9800.020
SOM−0.488 0.512 0.179 0.821 −0.191 0.809 0.271 0.729 0.230 0.770 0.064 0.936
TN0.526 0.474 −0.537 0.463 0.400 0.600 −0.272 0.728 0.280 0.720 0.278 0.722
AN0.579 0.421 −0.581 0.419 0.455 0.545 −0.332 0.668 0.315 0.685 0.328 0.672
AK0.424 0.576 −0.489 0.511 0.321 0.679 −0.162 0.838 0.276 0.724 0.228 0.772
AP0.874 0.126 −0.959 0.041 −0.761 0.239 −0.761 0.239 0.781 0.219 0.841 0.159
PPO0.289 0.711 −0.643 0.357 0.598 0.402 −0.423 0.577 0.890 0.110 0.798 0.202
POD0.834 0.166 −0.652 0.348 0.651 0.349 −0.654 0.346 0.280 0.720 0.449 0.551
UE−0.985 0.015 0.913 0.087 −0.982 0.018 0.979 0.021 −0.697 0.303 −0.889 0.111
DHA0.780 0.220 −0.809 0.191 0.716 0.284 −0.589 0.411 0.563 0.437 0.612 0.388
SC−0.860 0.140 0.866 0.134 −0.804 0.196 0.699 0.301 −0.612 0.388 −0.696 0.304
ALP−0.953 0.047 0.972 0.028 −0.995 0.005 0.931 0.069 −0.805 0.195 −0.941 0.060
ACP−0.861 0.139 0.663 0.337 −0.843 0.157 0.963 0.037 −0.468 0.532 −0.739 0.261
SYT0.964 0.036 −0.902 0.098 0.985 0.015 −0.988 0.012 0.717 0.283 0.910 0.090
YA0.736 0.264 −0.618 0.382 0.796 0.204 −0.895 0.105 0.530 0.470 0.759 0.241
XB0.993 0.007 −0.916 0.084 0.971 0.029 −0.959 0.041 0.676 0.324 0.864 0.136
QB0.856 0.144 −0.770 0.230 0.910 0.090 −0.964 0.036 0.646 0.354 0.861 0.139
JA0.739 0.261 −0.684 0.316 0.835 0.165 −0.895 0.105 0.630 0.370 0.826 0.174
Publisher’s Note: MDPI stays neutral with regard to jurisdictional claims in published maps and institutional affiliations.

