
Experimental Study on the Snowfall Flow Control of Backward-Facing Steps Using a High-Durability Designed Plasma Electrode
 ,
,
Abstract
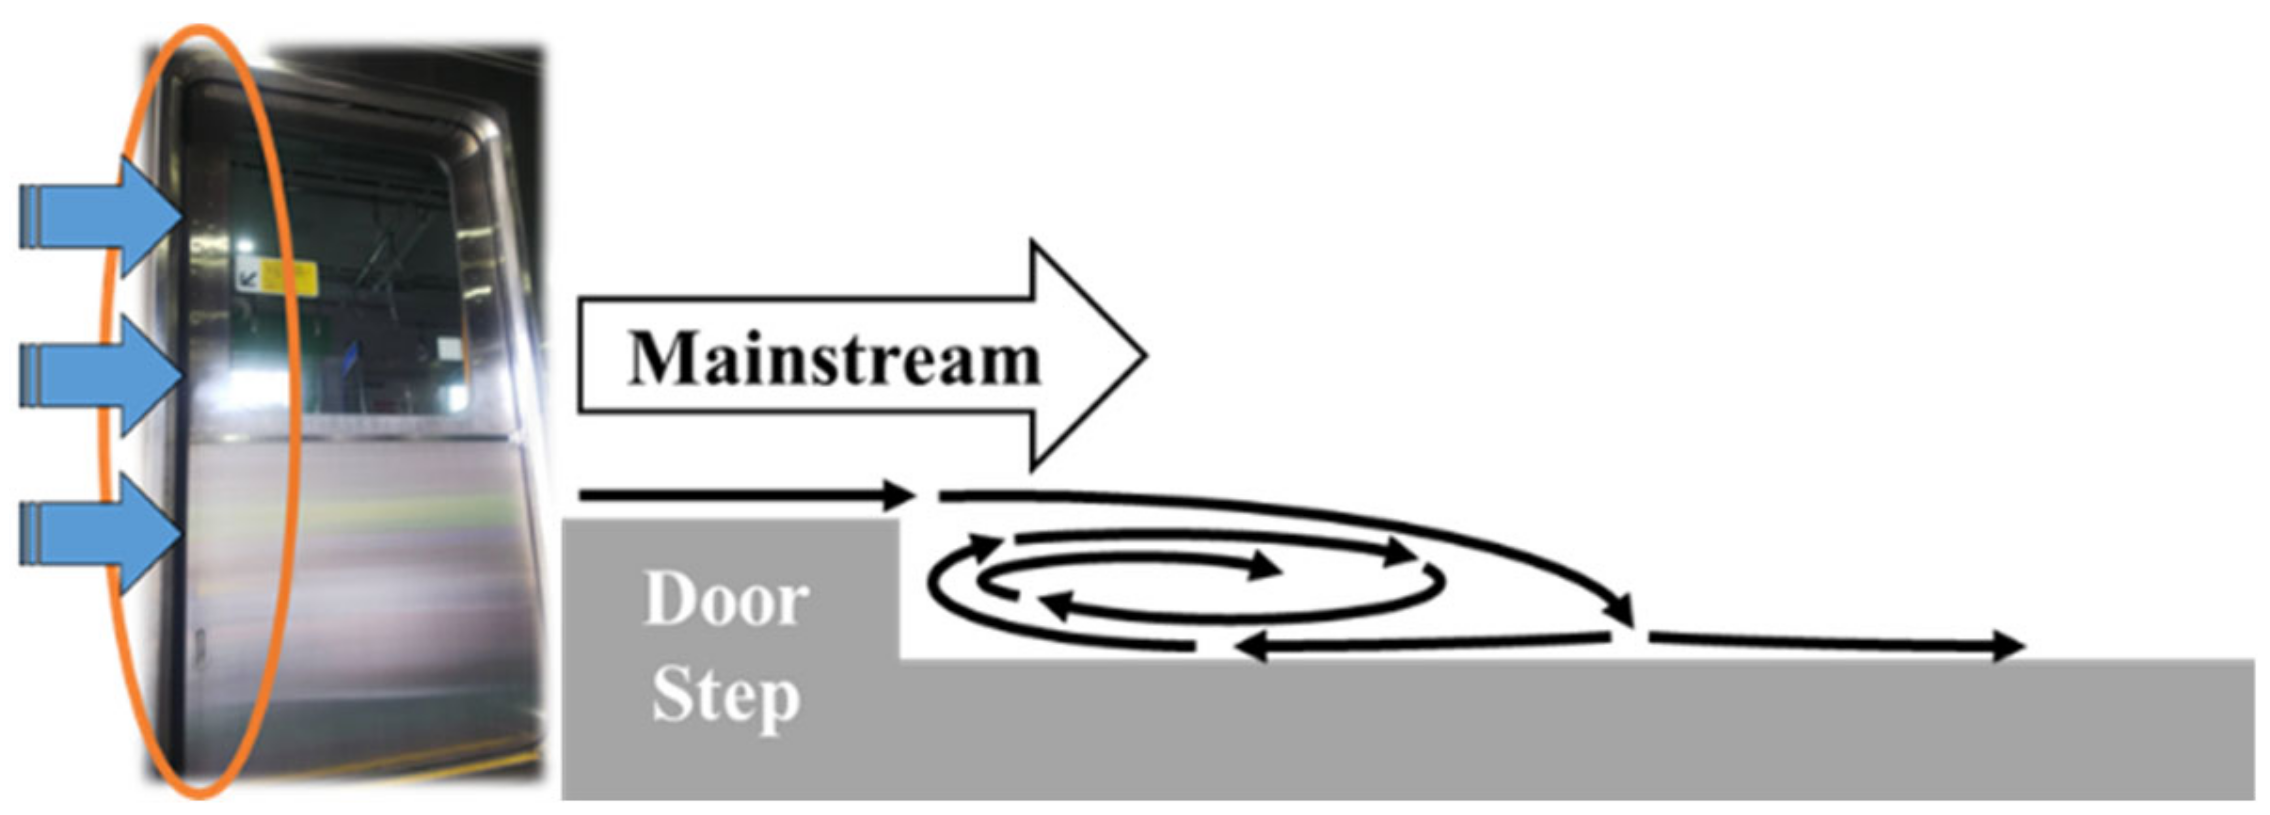
:1. Introduction
2. Materials and Methods
2.1. Wind Tunnels
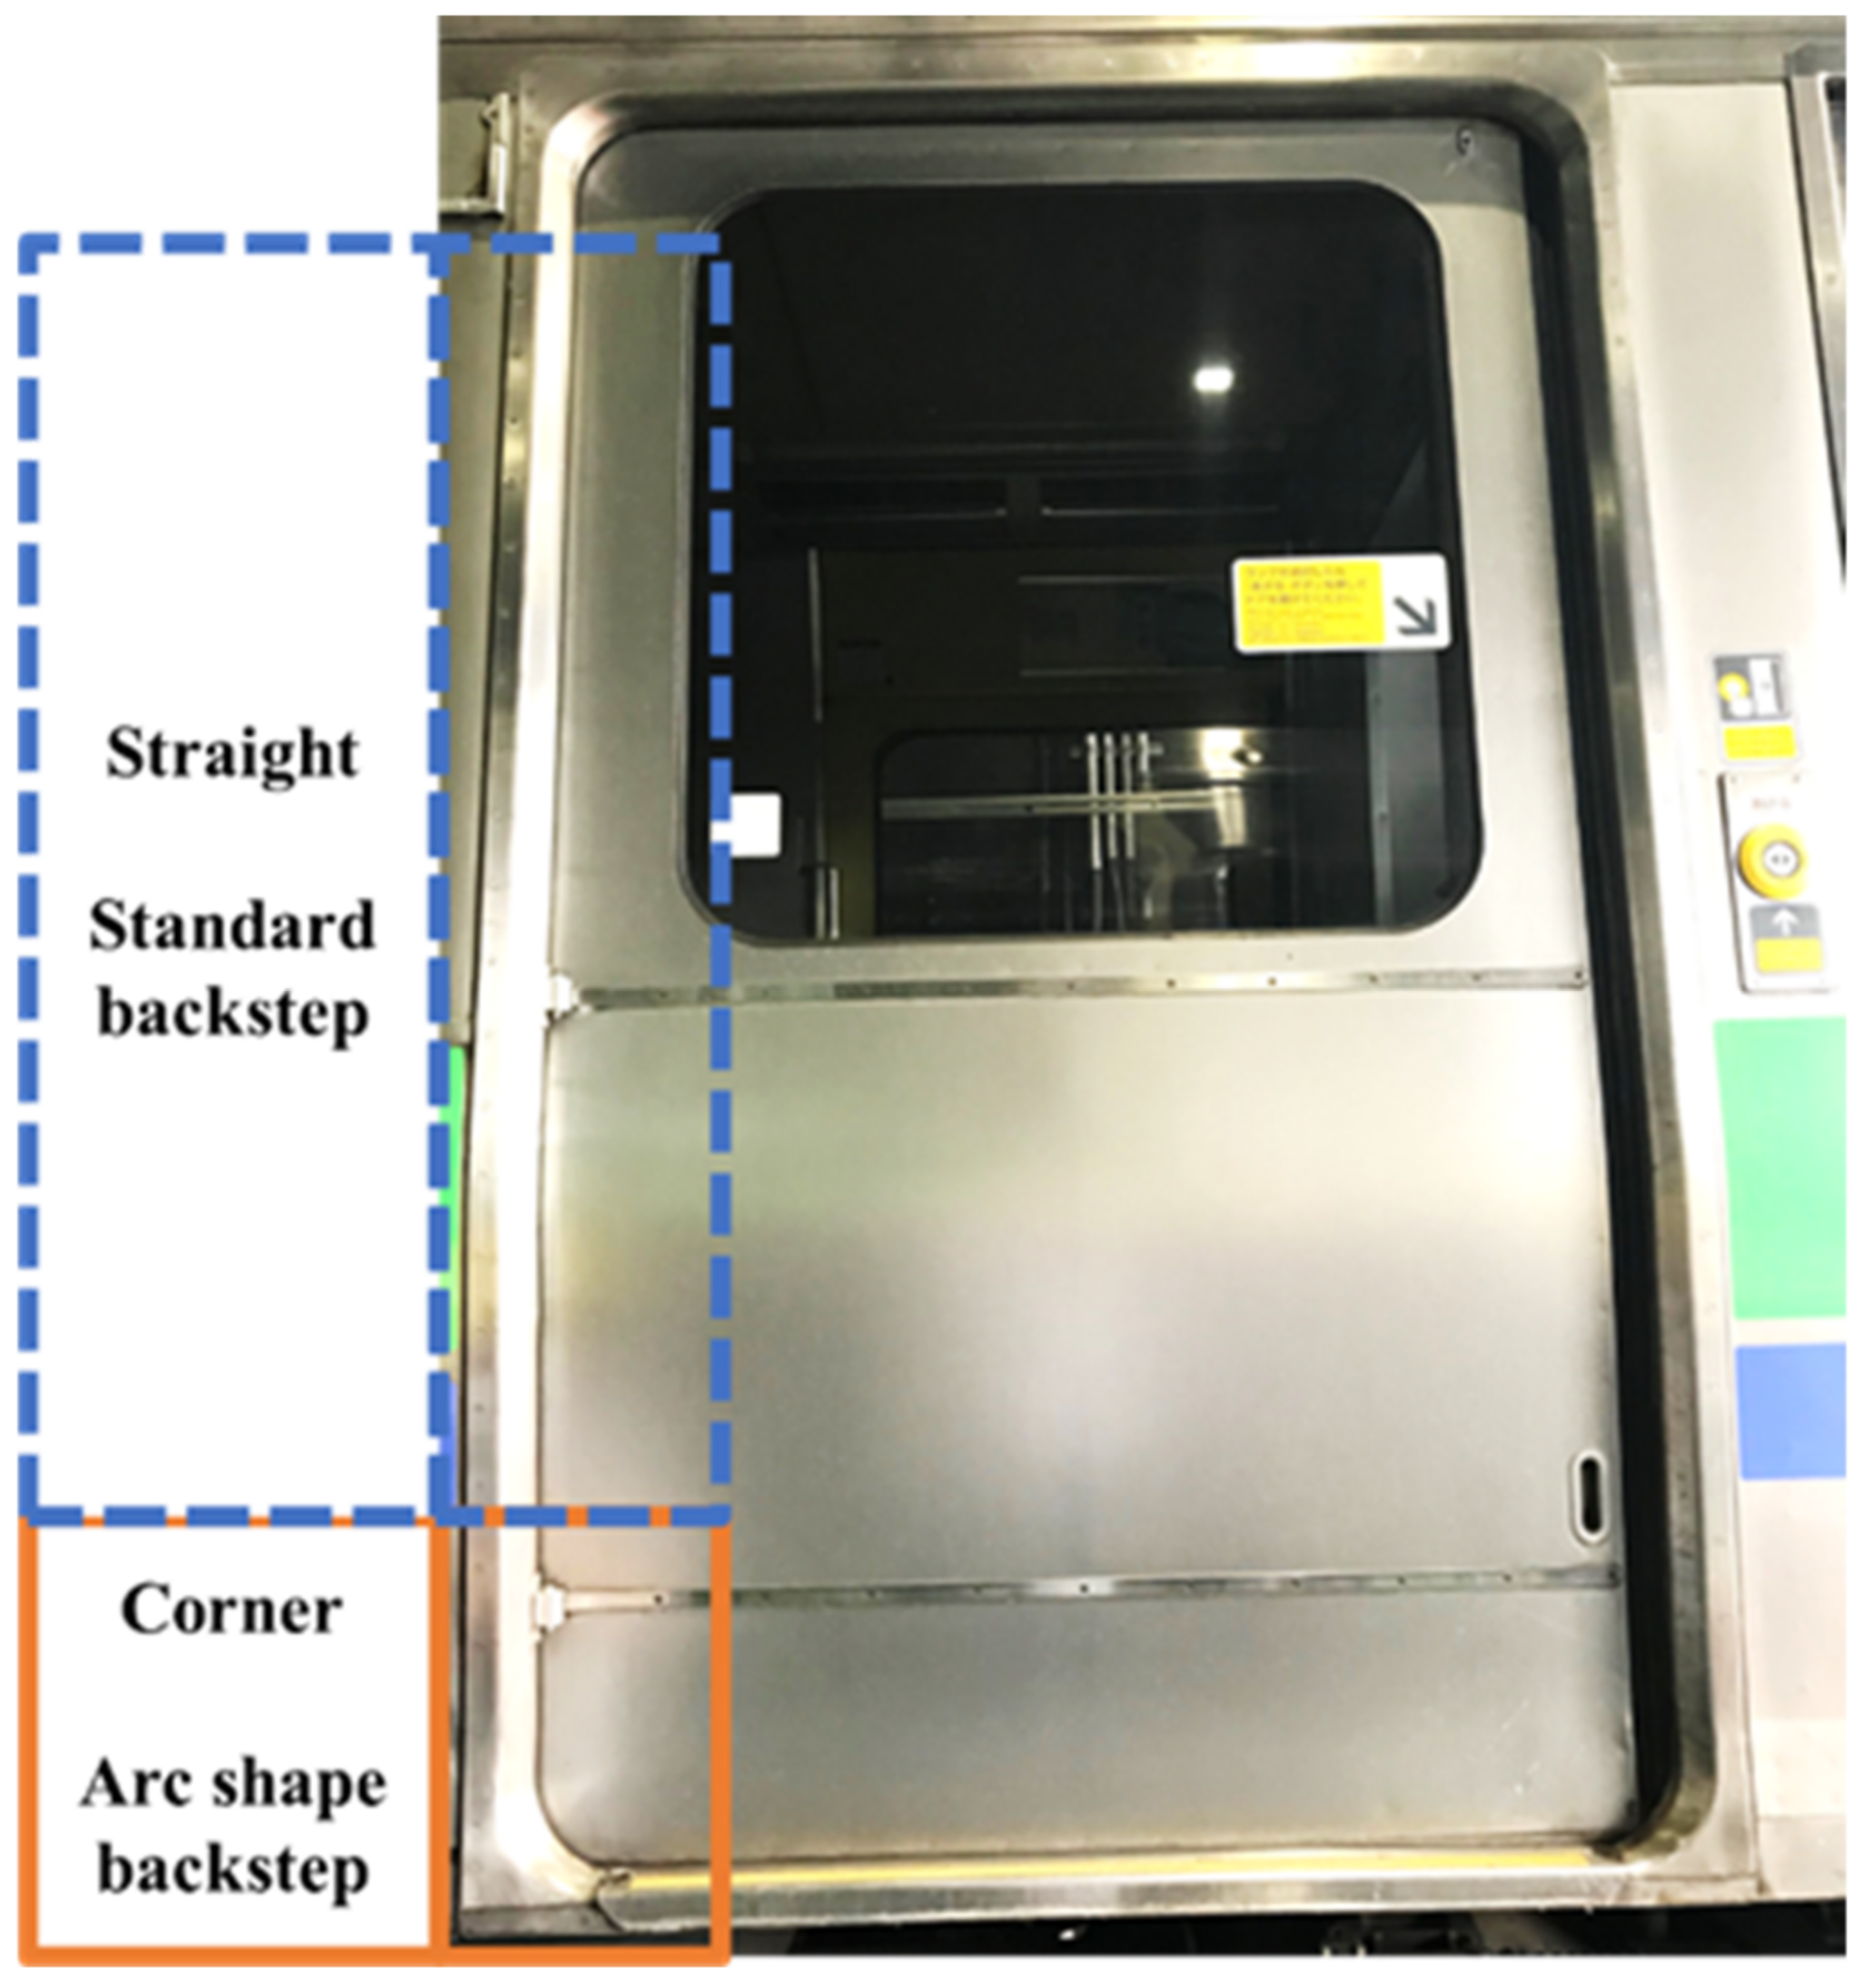
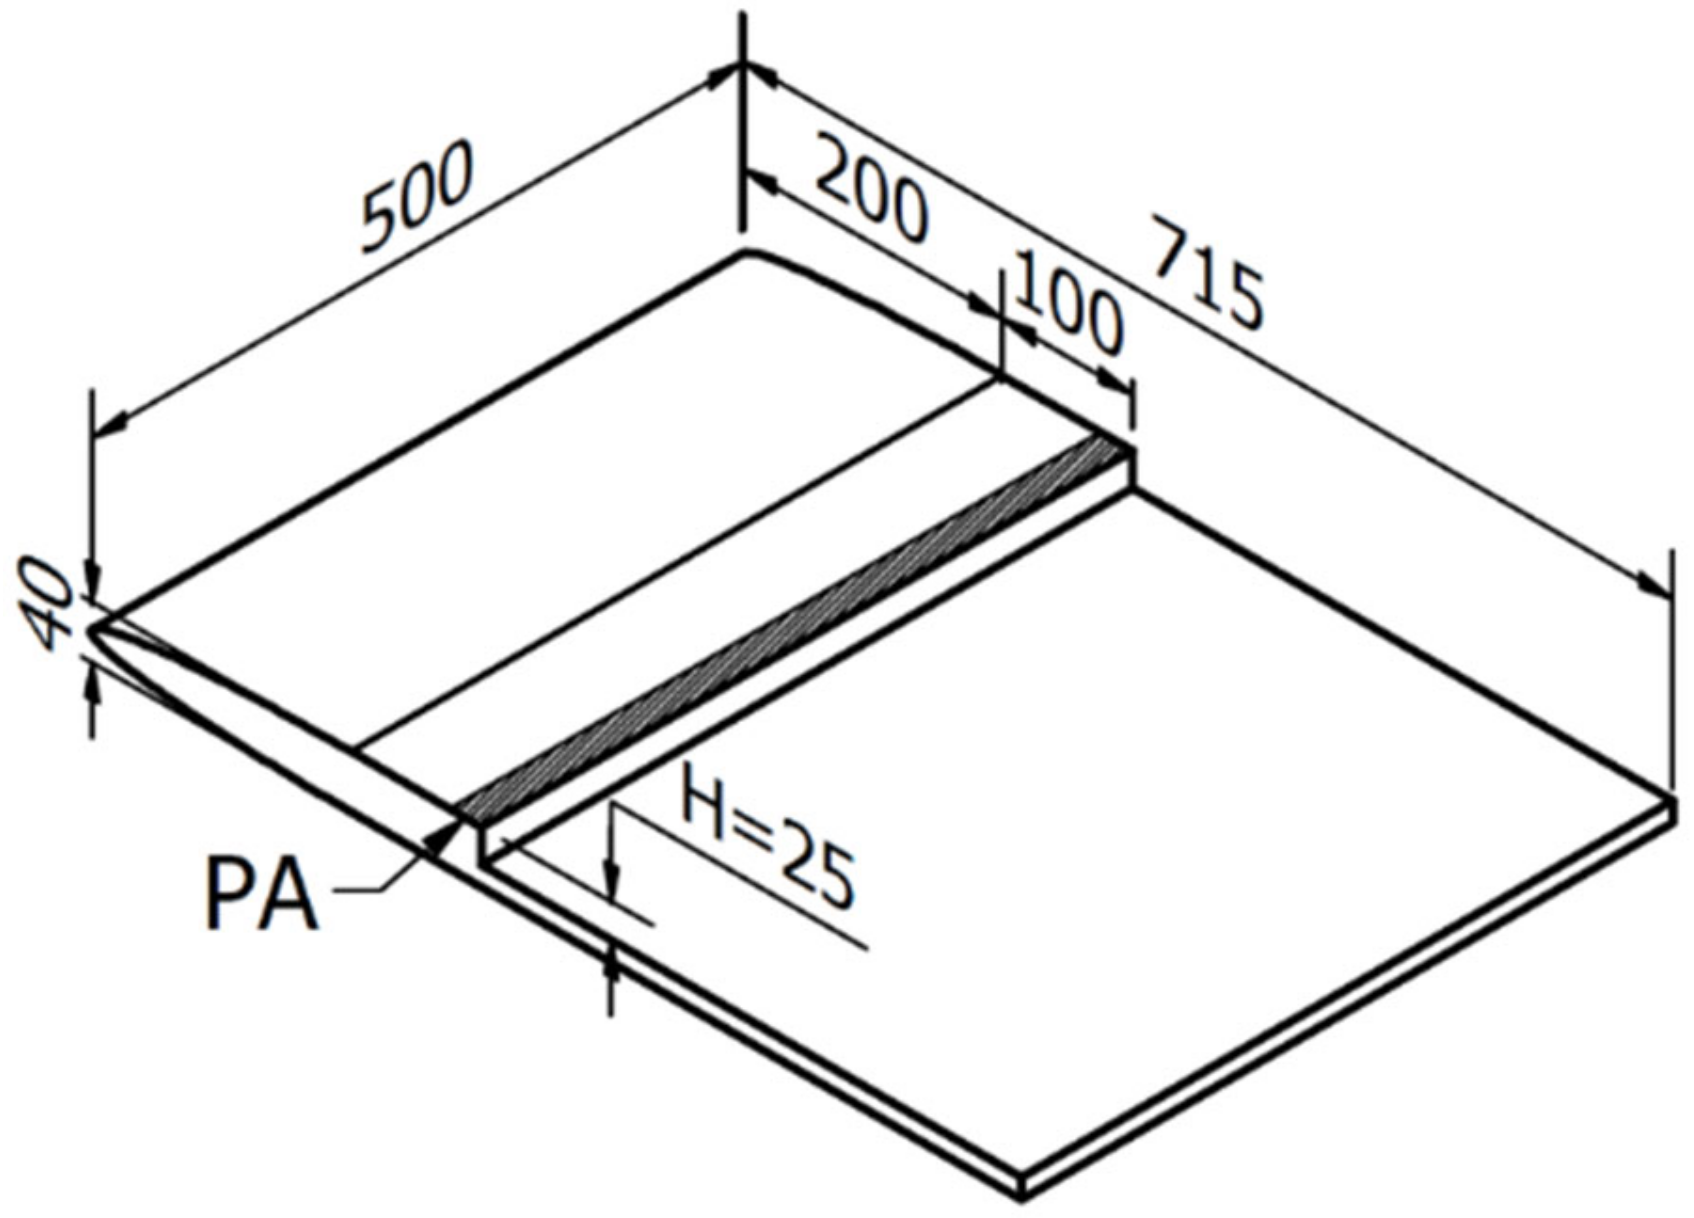
2.2. Test Models
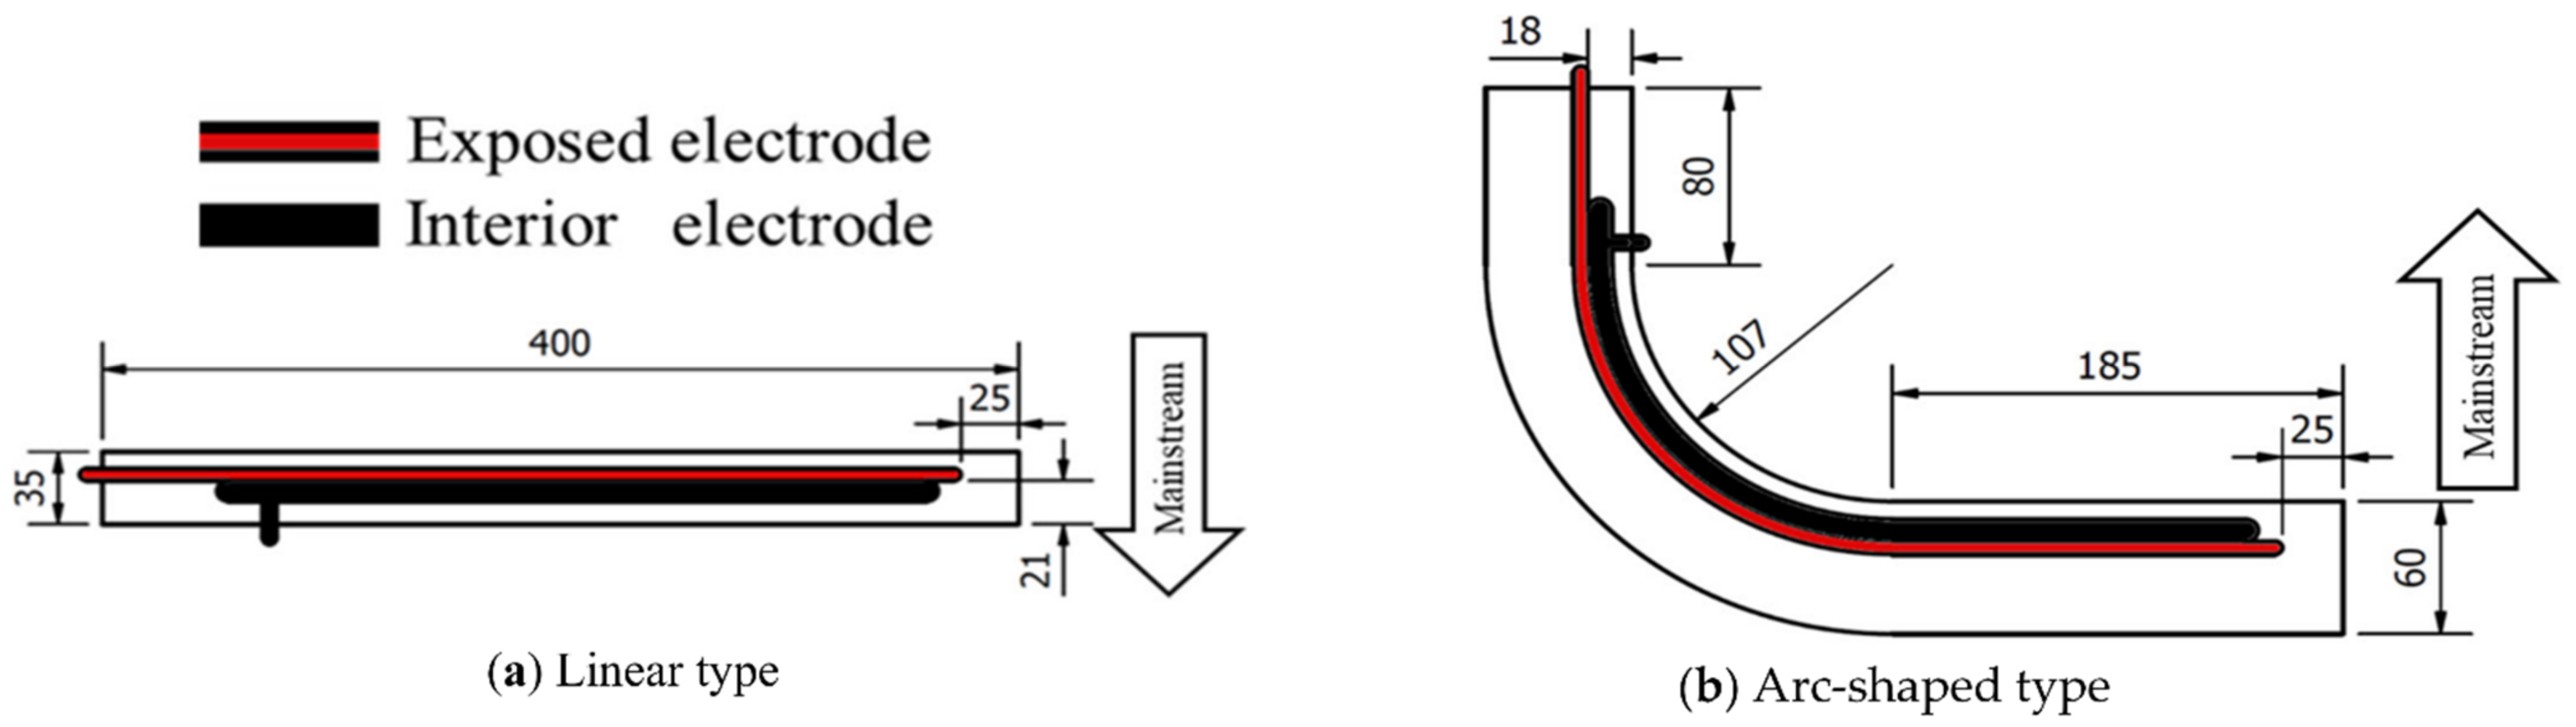
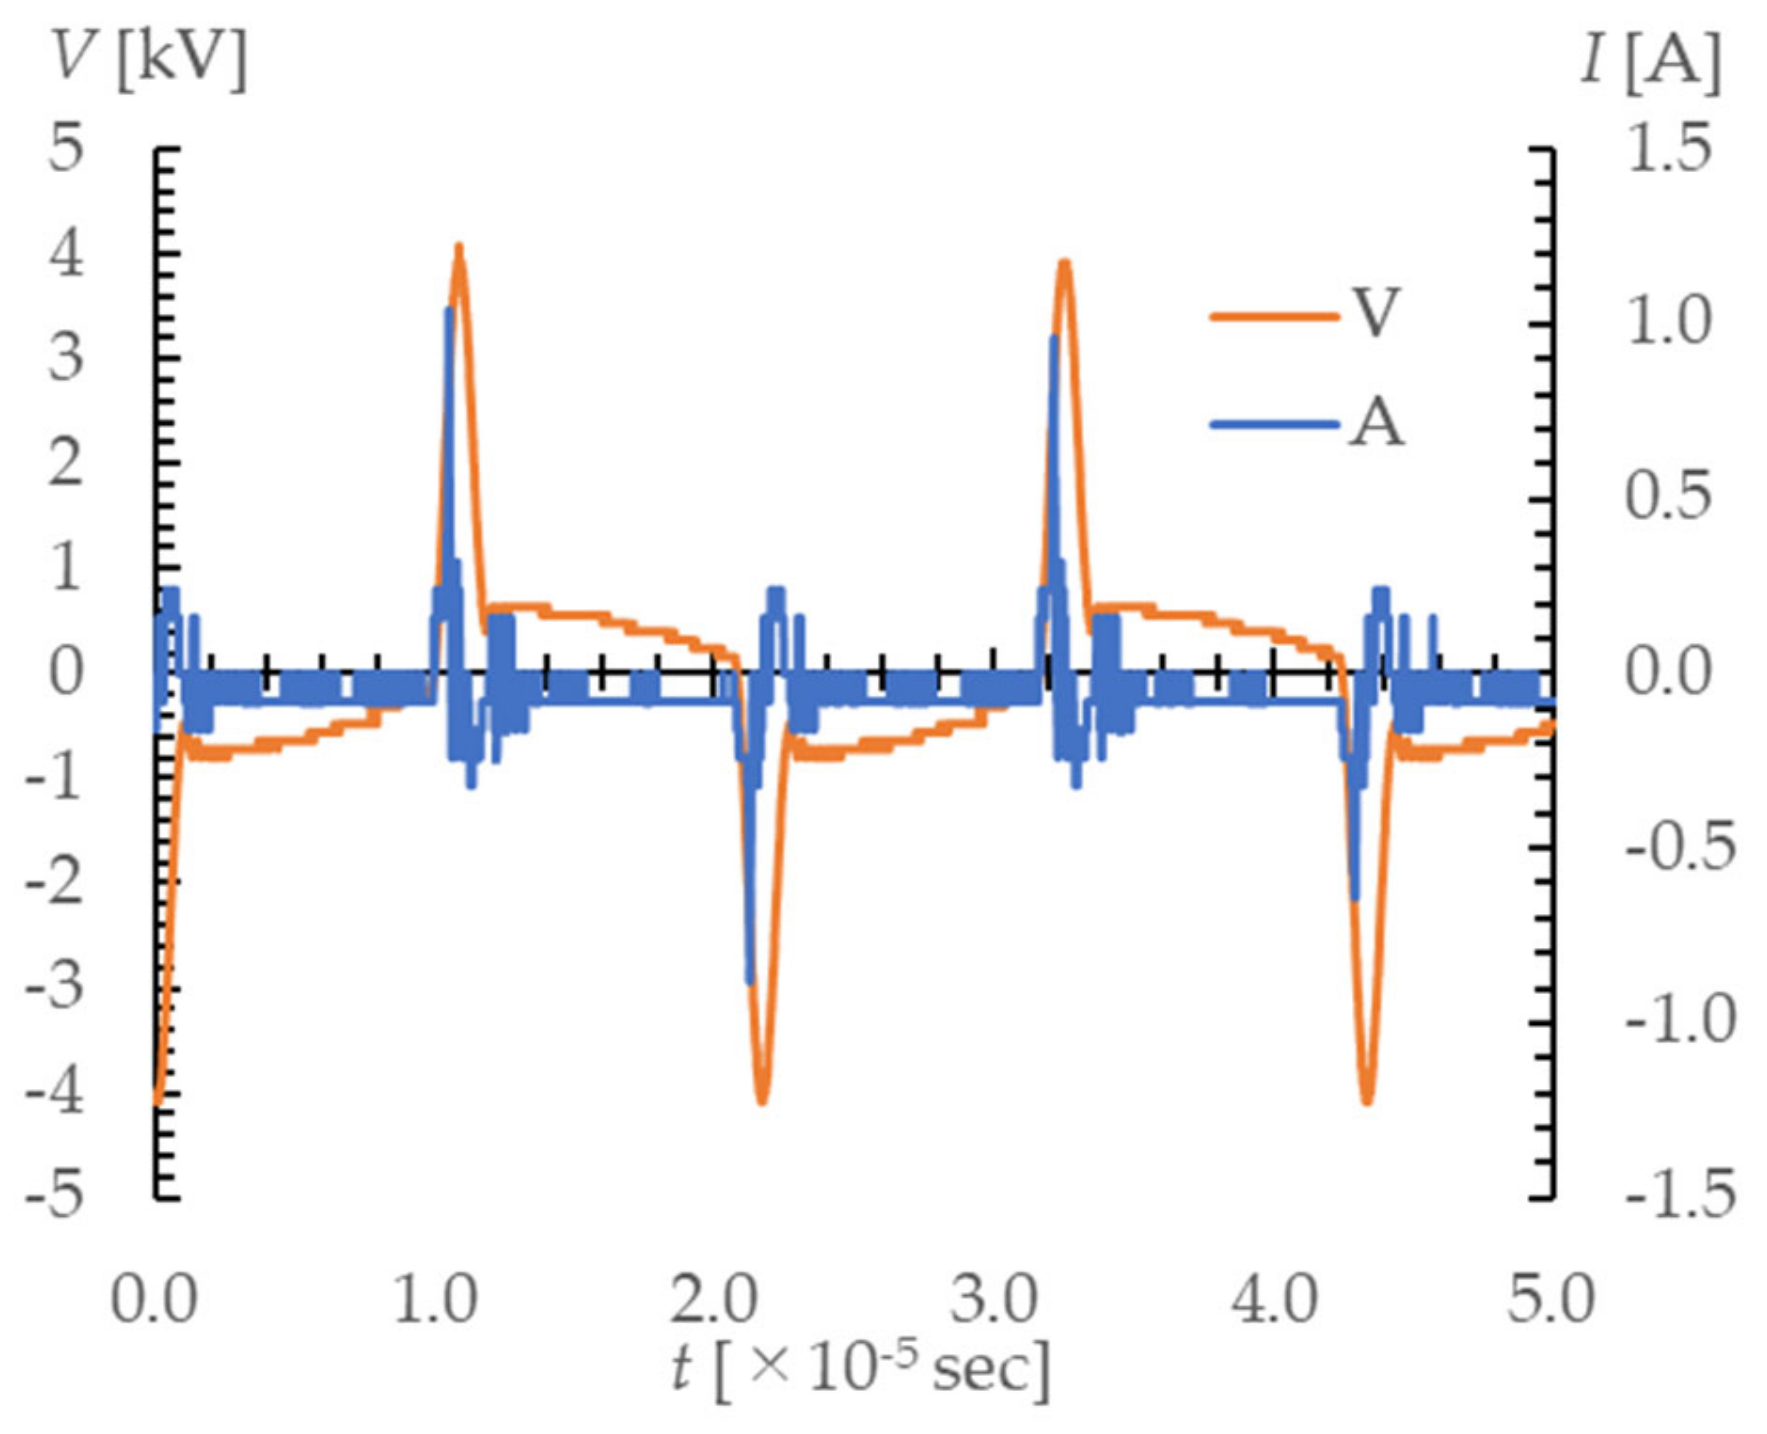
2.3. High-Durability Designed Plasma Electrodes (Asahi Rubber Inc.) and the PA Electrode Drive Control Condition
3. Experimental Results
3.1. Oil Flow Visualization (Standard Model, Circulating Wind Tunnel)
3.2. PIV Measurement Using Micro Soap Bubbles (Standard Model, Circulating Wind Tunnel)
3.3. FFT Analysis: Investigation of Periodic Structure in Separation Shear Layer (Standard Model, Circulating Wind Tunnel)
3.4. Oil Flow Visualization (Arc-Shaped Model, Circulating Wind Tunnel)
3.5. Natural-Snow Wind Tunnel Test
3.5.1. PIV Measurement Using Dry Snowflakes as Tracers (Standard Model)
Velocity Distribution (Streamwise Component: Ux)
Velocity Gradient (dUx/dY)
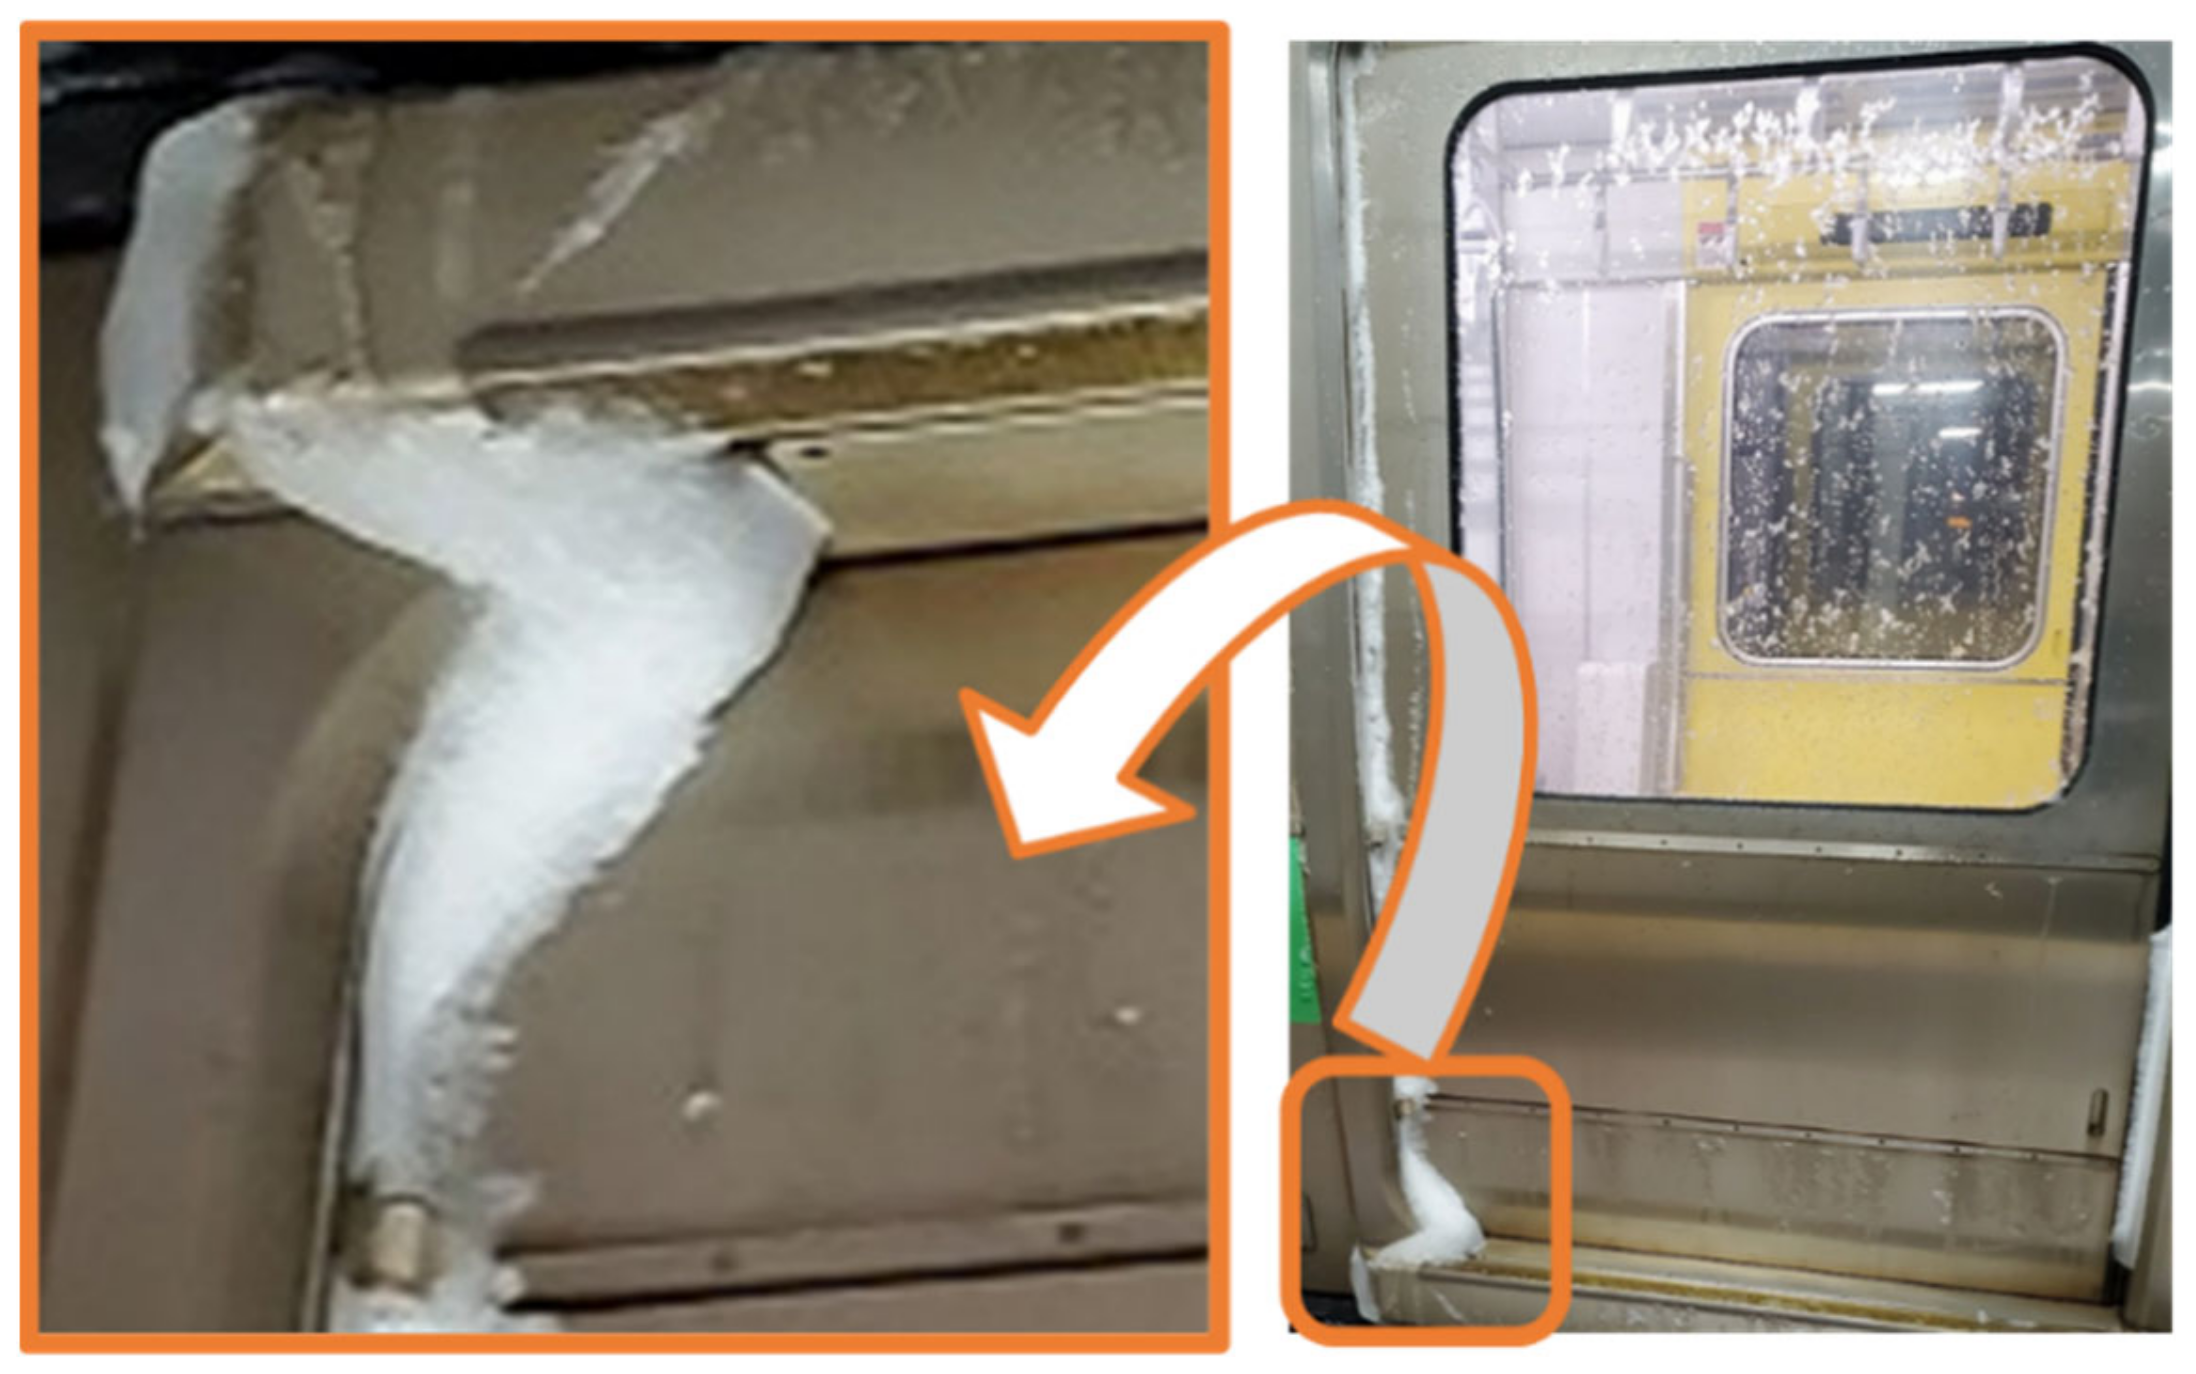
3.5.2. Snow Accumulation Test
Snow Accumulation Test in 2021 (Standard Model)
Snow Accumulation Test in 2022 (Standard Model)
Snow Accumulation Test in 2022 (Arc Model)
4. Conclusions
Author Contributions
Funding
Data Availability Statement
Acknowledgments
Conflicts of Interest
References
- Corke, T.C.; Post, M.L.; Orlov, D.M. SDBD plasma enhanced aerodynamics: Concepts, optimization and applications. Prog. Aerosp. Sci. 2007, 43, 193–217. [Google Scholar] [CrossRef]
- Touchard, G. Plasma actuators for aeronautics applications: State of art review. Int. J. Plasma Environ. Sci. Technol. 2008, 2, 1–25. [Google Scholar]
- Moreau, E.; Debien, N.; Bénard, T.; Jukes, T.; Whalley, R.; Choi, K.-S.; Berendt, A.; Podlinski, J.; Mizeraczyk, J. Surface Dielectric Barrier Discharge Plasma Actuators. ERCOFTAC Bull. 2013, 94, 5–10. [Google Scholar]
- Akbıyık, H.; Yavuz, H.; Akansu, Y.E. A Study on the Plasma Actuator Electrode Geometry Configurations for Improvement of the Aerodynamic Performance of an Airfoil. Strojniški vestnik. J. Mech. Eng. 2018, 64, 719–725. [Google Scholar]
- Asaumi, N.; Matsuno, S.; Matsuno, T.; Sugahara, M.; Kawazoe, H. Multi-Electrode Plasma Actuator to Improve Performance of Flow Separation Control. Int. J. Gas Turbine Propuls. Power Syst. 2017, 9, 1–8. [Google Scholar] [CrossRef]
- Wang, L.; Wong, C.W.; Alam, M.; Zhou, Y. Post-stall flow control using a sawtooth plasma actuator in burst mode. Aerosp. Sci. Technol. 2020, 107, 106251. [Google Scholar] [CrossRef]
- Berendt, A.; Podliński, J.; Mizeraczyk, J. Multi-DBD plasma actuator for flow separation control around NACA 0012 and NACA 0015 airfoil models. Prz. Elektrotech. 2012, 88, 18–21. [Google Scholar]
- Segawa, T.; Suzuki, D.; Fujino, T.; Jukes, T.; Matsunuma, T. Feedback Control of Flow Separation Using Plasma Actuator and FBG Sensor. Int. J. Aerosp. Eng. 2016, 2016, 8648919. [Google Scholar] [CrossRef] [Green Version]
- Sato, S.; Enokido, T.; Ashikawa, K.; Matsubara, M.; Kanie, K.; Ohnishi, N. Development of a flexible dielectric-barrier-discharge plasma actuator fabricated by inkjet printing using silver nanoparticles-based ink. Sens. Actuators A Phys. 2021, 330, 112823. [Google Scholar] [CrossRef]
- Ashpis, D.E.; Laun, M.C.; Griebeler, E.L. Progress Toward Accurate Measurement of Dielectric Barrier Discharge Plasma Actuator Power. AIAA J. 2017, 55, 2254–2268. [Google Scholar] [CrossRef] [PubMed]
- Ashpis, D.E.; Laun, M.C. Dielectric Barrier Discharge Plasma Actuator Thrust Measurement Methodology Incorporating Antithrust Hypothesis. AIAA J. 2017, 55, 4181–4192. [Google Scholar] [CrossRef] [PubMed] [Green Version]
- Matsunuma, T. Effects of Burst Ratio and Frequency on the Passage Vortex Reduction of a Linear Turbine Cascade Using a Dielectric Barrier Discharge Plasma Actuator. Actuators 2022, 11, 210. [Google Scholar] [CrossRef]
- Zhang, X.; Cui, Y.D.; Tay, C.M.J.; Khoo, B.C. Flow field generated by a dielectric barrier discharge plasma actuator in quiescent air at initiation stage. Chin. J. Aeronaut. 2021, 34, 13–24. [Google Scholar] [CrossRef]
- Chedevergne, F.; Casalis, G.; Léon, O.; Forte, M.; Laurendeau, F.; Szulga, N.; Vermeersch, O.; Piot, E. Applications of Dielectric Barrier Discharges and Plasma Synthetic Jet Actuators at ONERA. Aerosp. Lab 2015, AL10-06, 1–10. [Google Scholar]
- Benard, N.; Balcon, N.; Moreau, E. Electric wind produced by a surface dielectric barrier discharge operating in air at different pressures: Aeronautical control insights. J. Phys. D Appl. Phys. 2008, 41, 042002. [Google Scholar] [CrossRef]
- Anderson, R.; Roy, S. Preliminary Experiments of Barrier Discharge Plasma Actuators using Dry and Humid Air. In Proceedings of the 44th AIAA Aerospace Sciences Meeting and Exhibit, Reno, NV, USA, 9–12 January 2006; p. 369. [Google Scholar]
- Benard, N.; Balcon, N.; Moreau, E. Electric Wind Produced by a Surface Dielectric Barrier Discharge Operating Over a Wide Range of Relative Humidity. In Proceedings of the 47th AIAA Aerospace Sciences Meeting Including the New Horizons Forum and Aerospace Exposition, Orlando, FL, USA, 5–8 January 2009; p. 488. [Google Scholar]
- Wicks, M.; Thomas, F.O. Effect of Relative Humidity on Dielectric Barrier Discharge Plasma Actuator Body Force. AIAA J. 2015, 53, 2801–2805. [Google Scholar] [CrossRef]
- Lilley, A.J.; Roy, S.; Michels, L.; Roy, S. Performance recovery of plasma actuators in wet conditions. J. Phys. D Appl. Phys. 2022, 55, 155201. [Google Scholar] [CrossRef]
- Fujii, K.; Asada, K. Resistance Reduction by Automotive Rear Flow Control Using DBD Plasma Actuators—Based on high-resolution simulation using HPC. SENAC 2020, 53, 15–24. (In Japanese) [Google Scholar]
- Lai, C.; Fu, H.; Hu, B.; Ling, Z.; Jiang, L. Aerodynamic Drag Reduction and Optimization of MIRA Model Based on Plasma Actuator. Actuators 2020, 9, 64. [Google Scholar] [CrossRef]
- Zainuddin, F.A.; Daud, N.M. A Review on Dielectric Barrier Discharge (DBD) Plasma Actuator in Aeronautics Applications. J. Adv. Res. Fluid Mech. Therm. Sci. 2018, 48, 125–132. [Google Scholar]
- Keisar, D.; Hasin, D.; Greenblatt, D. Plasma Actuator Application on a Full-Scale Aircraft Tail. AIAA J. 2019, 57, 616–627. [Google Scholar] [CrossRef]
- Sekimoto, S.; Kato, H.; Fujii, K.; Yoneda, H. In-Flight Demonstration of Stall Improvement Using a Plasma Actuator for a Small Unmanned Aerial Vehicle. Aerospace 2022, 9, 144. [Google Scholar] [CrossRef]
- Xie, L.; Liang, H.; Han, M.; Niu, Z.; Wei, B.; Su, Z.; Tang, B. Experimental Study on Plasma Flow Control of Symmetric Flying Wing Based on Two Kinds of Scaling Models. Symmetry 2019, 11, 1261. [Google Scholar] [CrossRef] [Green Version]
- Matsuda, H.; Tanaka, M.; Osako, T.; Yamazaki, K.; Shimura, N.; Asayama, M.; Oryu, Y. Plasma actuation effect on a MW class wind turbine. Int. J. Gas Turbine Propuls. Power Syst. 2017, 9, 47–52. [Google Scholar] [CrossRef]
- Tanaka, M.; Kubo, N.; Kawabata, H. Plasma actuation for leading edge separation control on 300 kW rotor blades with chord length around 1 m at a Reynolds number around 1.6 × 10⁶. J. Phys. Conf. Ser. 2020, 1618, 052013. [Google Scholar] [CrossRef]
- Aono, H.; Fukumoto, H.; Abe, Y.; Sato, M.; Nonomura, T.; Fujii, K. Separated Flow Control of Small Horizontal-Axis Wind Turbine Blades Using Dielectric Barrier Discharge Plasma Actuators. Energies 2020, 13, 1218. [Google Scholar] [CrossRef] [Green Version]
- Ogawa, T.; Asada, K.; Sekimoto, S.; Tatsukawa, T.; Fujii, K. Dynamic Burst Actuation to Enhance the Flow Control Authority of Plasma Actuators. Aerospace 2021, 8, 396. [Google Scholar] [CrossRef]
- Van den Broecke, J. De-Icing Using Ns-DBD Plasma Actuators. Master’s Thesis, Faculty of Aerospace Engineering, Delft University of Technology, Delft, The Netherlands, 2016. [Google Scholar]
- Kolbakir, C.; Liu, Y.; Hu, H.; Starikovskiy, A.Y.; Miles, R. An Experimental Investigation on the Thermal Effects of NS-DBD and AC-DBD Plasma Actuators for Aircraft Icing Mitigation. In Proceedings of the AIAA SciTech Forum, AIAA Aerospace Sciences Meeting, Kissimmee, FL, USA, 8–12 January 2018. [Google Scholar]
- Tian, Y.; Zhang, Z.; Cai, J.; Yang, L.; Kang, L. Experimental study of an anti-icing method over an air foil based on pulsed dielectric barrier discharge plasma. Chin. J. Aeronaut. 2018, 31, 1449–1460. [Google Scholar] [CrossRef]
- Matsuda, H.; Chiba, T.; Yagami, M.; Tajima, Y.; Watanabe, N.; Sato, H.; Takeyama, M. Control of Snow Falling Flow around NACA0015 Blade using a Plasma Electrode with Weather Resistant Design. J. Therm. Sci. 2022, 31, 72–81. [Google Scholar] [CrossRef]
- Matsuda, H.; Tanaka, M.; Goshima, S.; Okubo, T.; Atobe, T.; Kobayashi, H. Experimental Study on Flow Control of Separated Flows behind a Backward-Facing Step using Dielectric-Barrier-Discharge Plasma Actuator. NAGARE 2010, 29, 411–416. (In Japanese) [Google Scholar]
- Urita, A.; Tanaka, S. Active Control of Separated Flows behind a Backward-Facing Step with Synthetic Jet (2nd Report, Study on Details of the Flow Structures and Consideration of Mechanism of Flow Modification from a Viewpoint of Coherent Structure). Trans. JSME Part B 2011, 77, 2422–2430. (In Japanese) [Google Scholar] [CrossRef]
- Shibata, S.; Yamazaki, T.; Matsuda, H. Development of micro soap bubble generator for PIV tracer using home stereolithography 3D printer. In Proceedings of the 14th International Symposium on Particle Image Velocimetry, Chicago, IL, USA, 1–4 August 2021; p. 1. [Google Scholar]
- Matsuda, H.; Uchida, T.; Tanaka, M.; Otomo, F.; Shimura, N.; Osako, T. Phase-locked PIV Measurements on Flow around Plasma Actuated 2D Wind Turbine Blade. J. Gas Turbine Soc. Jpn. 2014, 42, 535–540. (In Japanese) [Google Scholar]


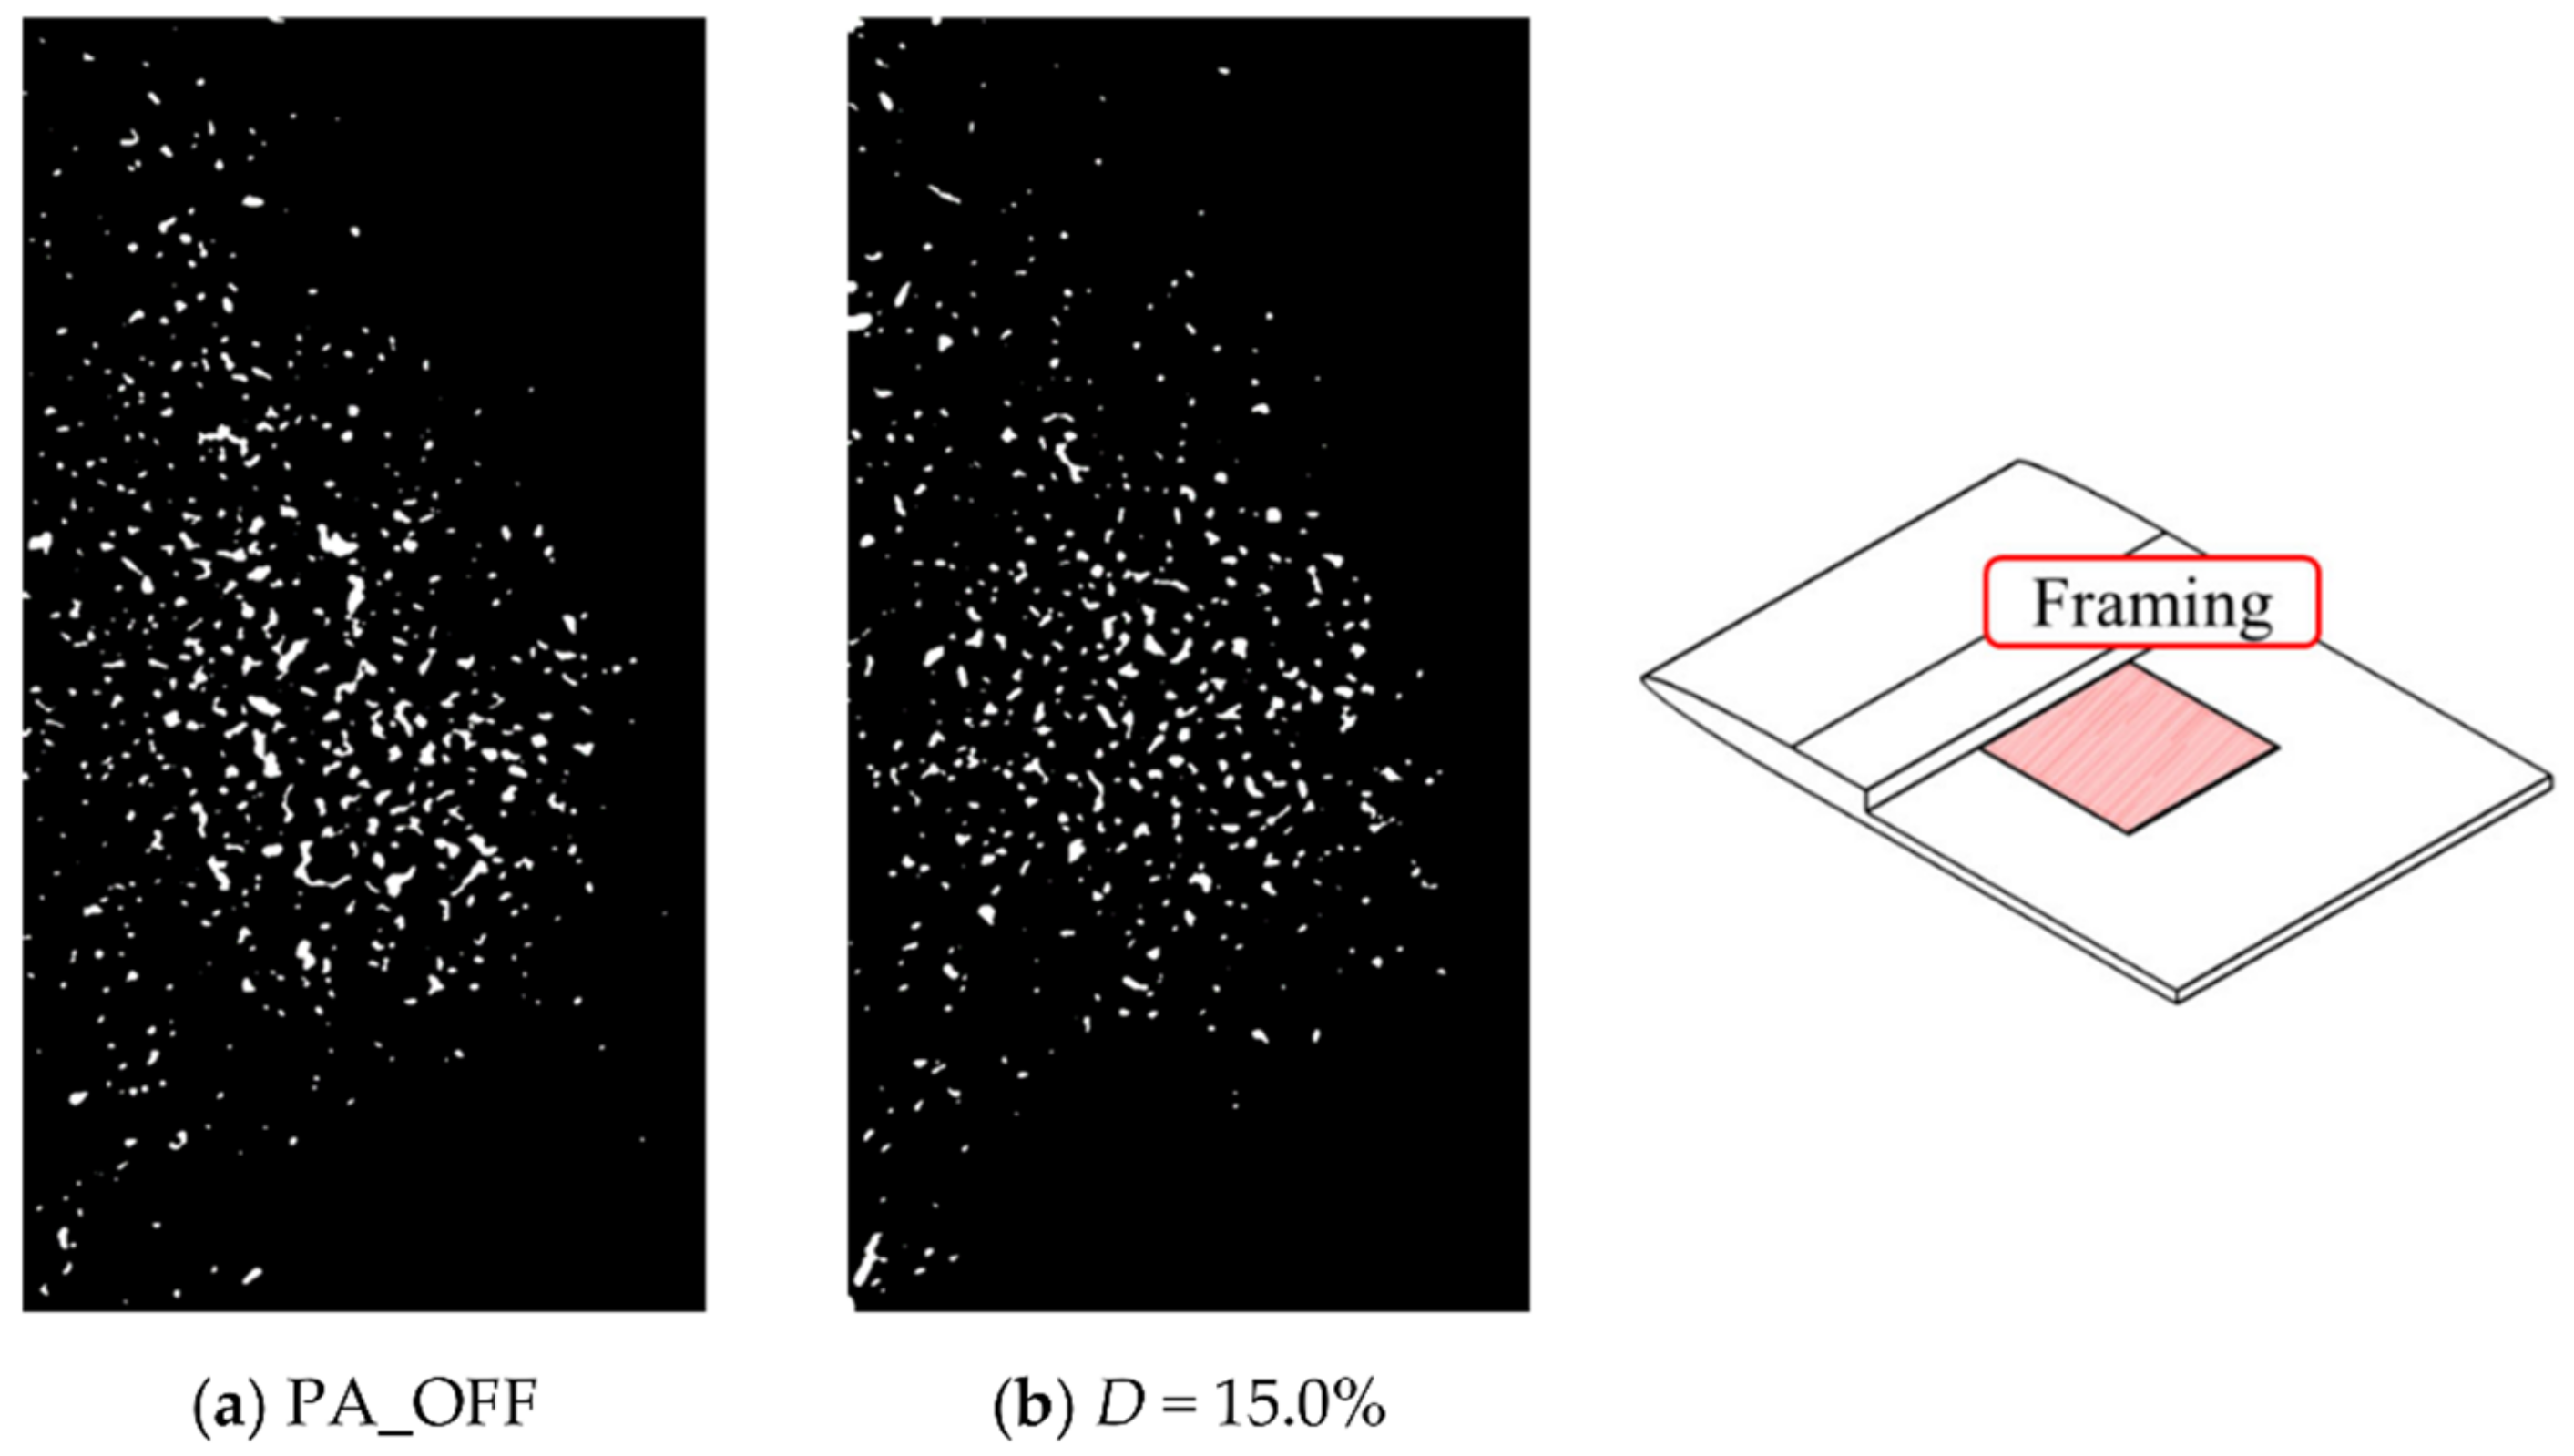
| Duty | Off | 15.0% |
|---|---|---|
| White ratio [%] Rate of decrease [%] | 3.60 - | 2.91 −19.17 |
| Duty | Off | 1.0% | 15.0% |
|---|---|---|---|
| White ratio [%] Rate of decrease [%] | 13.68 - | 12.84 −6.14 | 13.31 −2.70 |
| Duty | Off | 1.0% | 15.0% |
|---|---|---|---|
| White ratio [%] Rate of decrease [%] | 0.89 - | 0.44 −50.56 | 0.86 −3.37 |
| Duty | Off | 1.0% | 15.0% |
|---|---|---|---|
| White ratio [%] Rate of decrease [%] | 3.22 - | 2.59 −19.57 | 2.59 −19.57 |
Publisher’s Note: MDPI stays neutral with regard to jurisdictional claims in published maps and institutional affiliations. |
© 2022 by the authors. Licensee MDPI, Basel, Switzerland. This article is an open access article distributed under the terms and conditions of the Creative Commons Attribution (CC BY) license (https://creativecommons.org/licenses/by/4.0/).
Share and Cite
Tanaka, T.; Matsuda, H.; Takahashi, T.; Chiba, T.; Watanabe, N.; Sato, H.; Takeyama, M. Experimental Study on the Snowfall Flow Control of Backward-Facing Steps Using a High-Durability Designed Plasma Electrode. Actuators 2022, 11, 313. https://doi.org/10.3390/act11110313
Tanaka T, Matsuda H, Takahashi T, Chiba T, Watanabe N, Sato H, Takeyama M. Experimental Study on the Snowfall Flow Control of Backward-Facing Steps Using a High-Durability Designed Plasma Electrode. Actuators. 2022; 11(11):313. https://doi.org/10.3390/act11110313
Chicago/Turabian StyleTanaka, Tasuku, Hisashi Matsuda, Toshiki Takahashi, Takahiro Chiba, Nobuyoshi Watanabe, Hideaki Sato, and Masafumi Takeyama. 2022. "Experimental Study on the Snowfall Flow Control of Backward-Facing Steps Using a High-Durability Designed Plasma Electrode" Actuators 11, no. 11: 313. https://doi.org/10.3390/act11110313