
Expression of Cytokine Profiles in Human THP-1 Cells during Phase Transition of Talaromyces marneffei

 ,
,  , and
, and
Abstract
:1. Introduction
2. Materials and Methods
2.1. Preparation of T. marneffei Conidia
2.2. THP-1 Cell Culture and Infection
2.3. Confirmation of the Presence of Yeasts in THP-1 Cells
2.4. Flow Cytometry for Determining the Percentage of T. marneffei Yeasts in THP-1 Cells
2.5. Real-Time Reverse Transcription-Polymerase Chain Reaction (qRT-PCR)
2.6. Cytokine Determination and Macrophage Killing Assay
2.7. Immunofluorescence Staining to Identify Macrophage Surface Markers
2.8. Statistical Analysis
3. Results
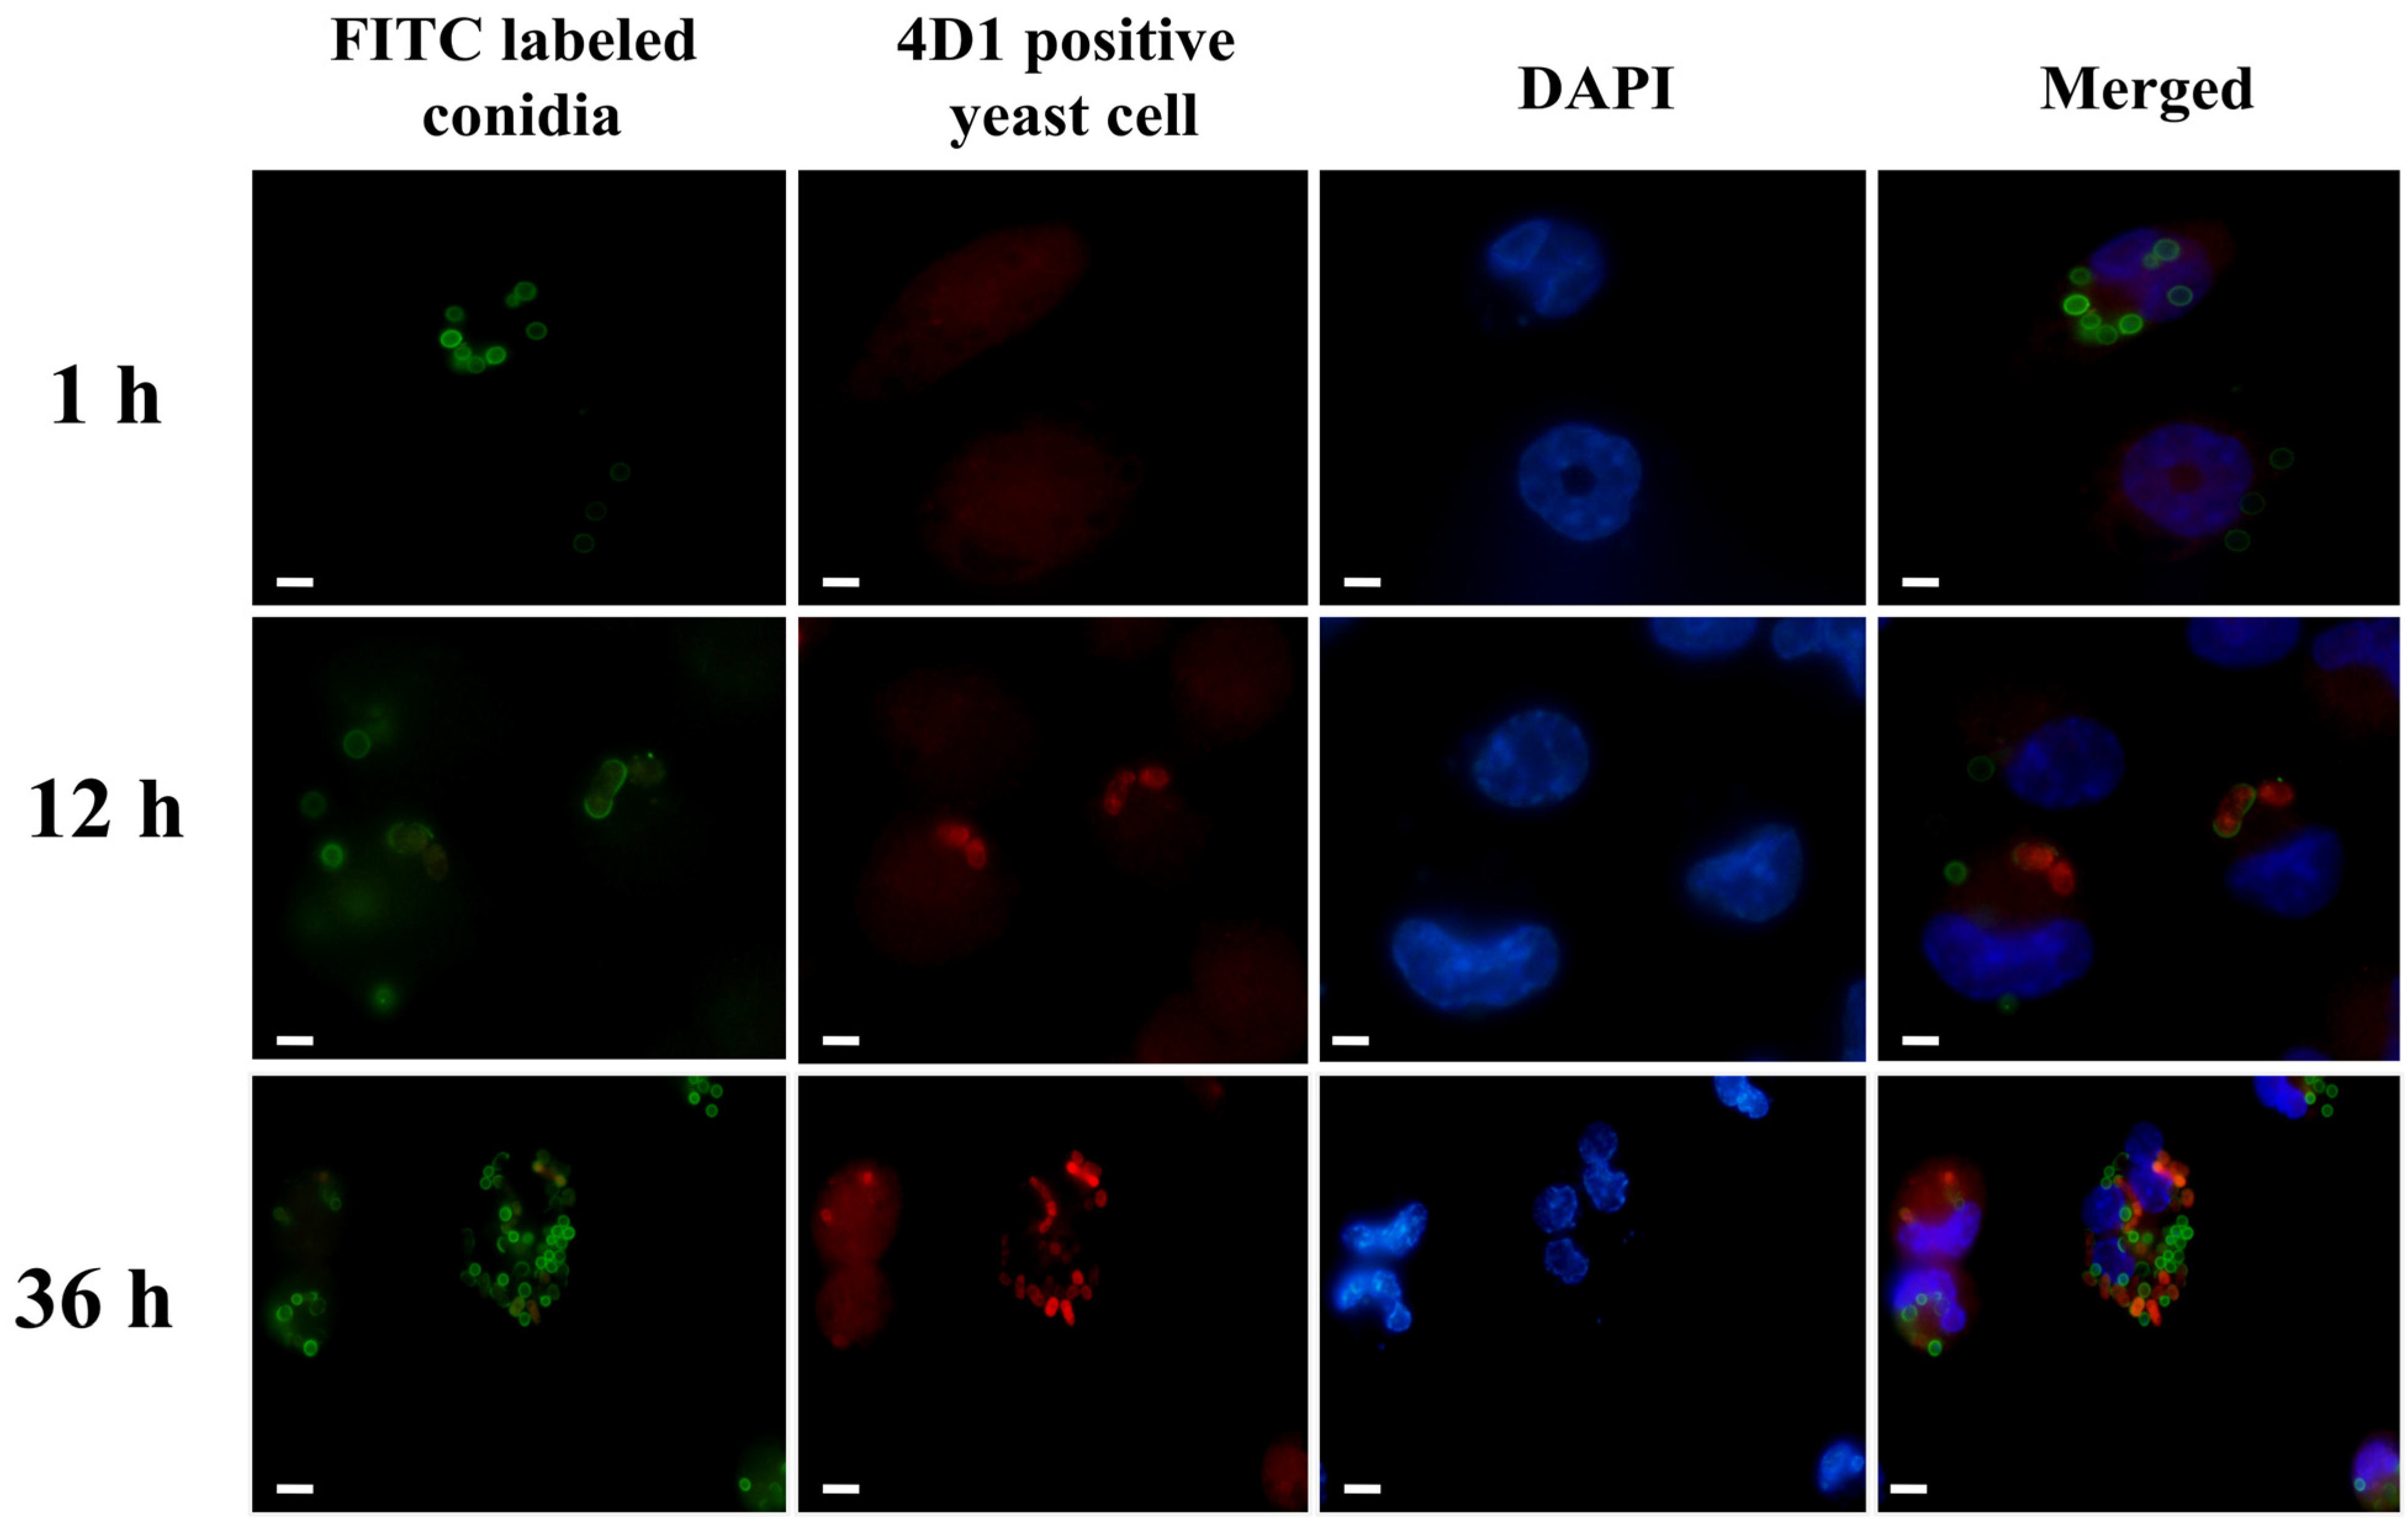
3.1. T. marneffei Shows an Intracellular Transition to Yeast Cells after Phagocytosis
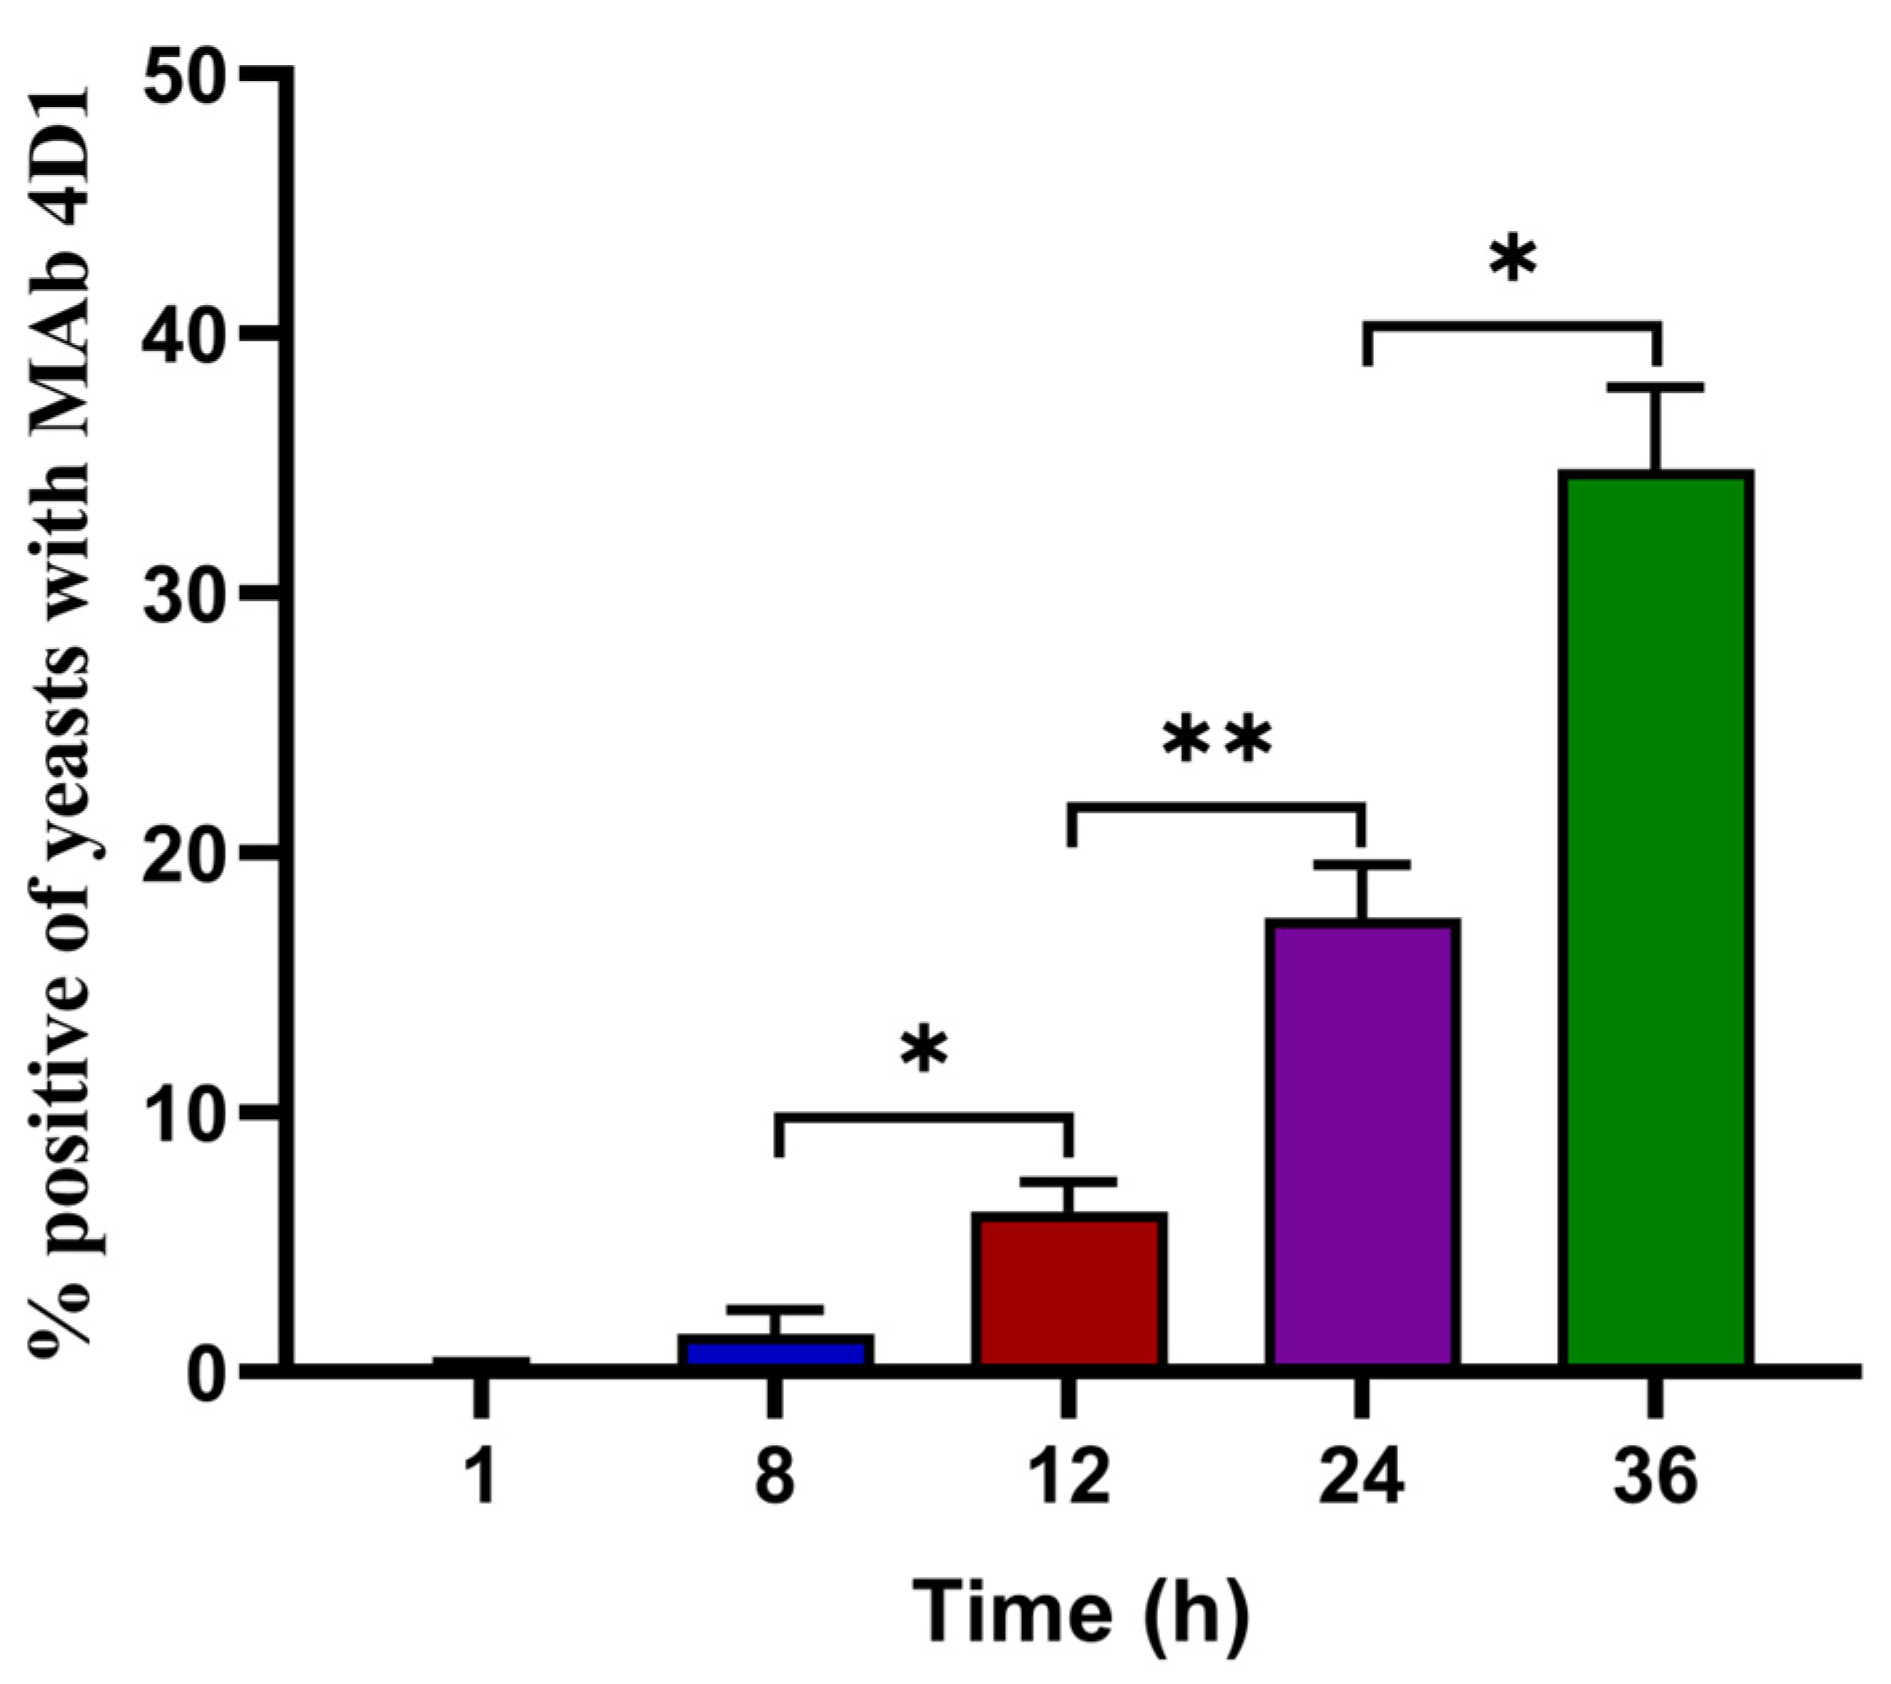
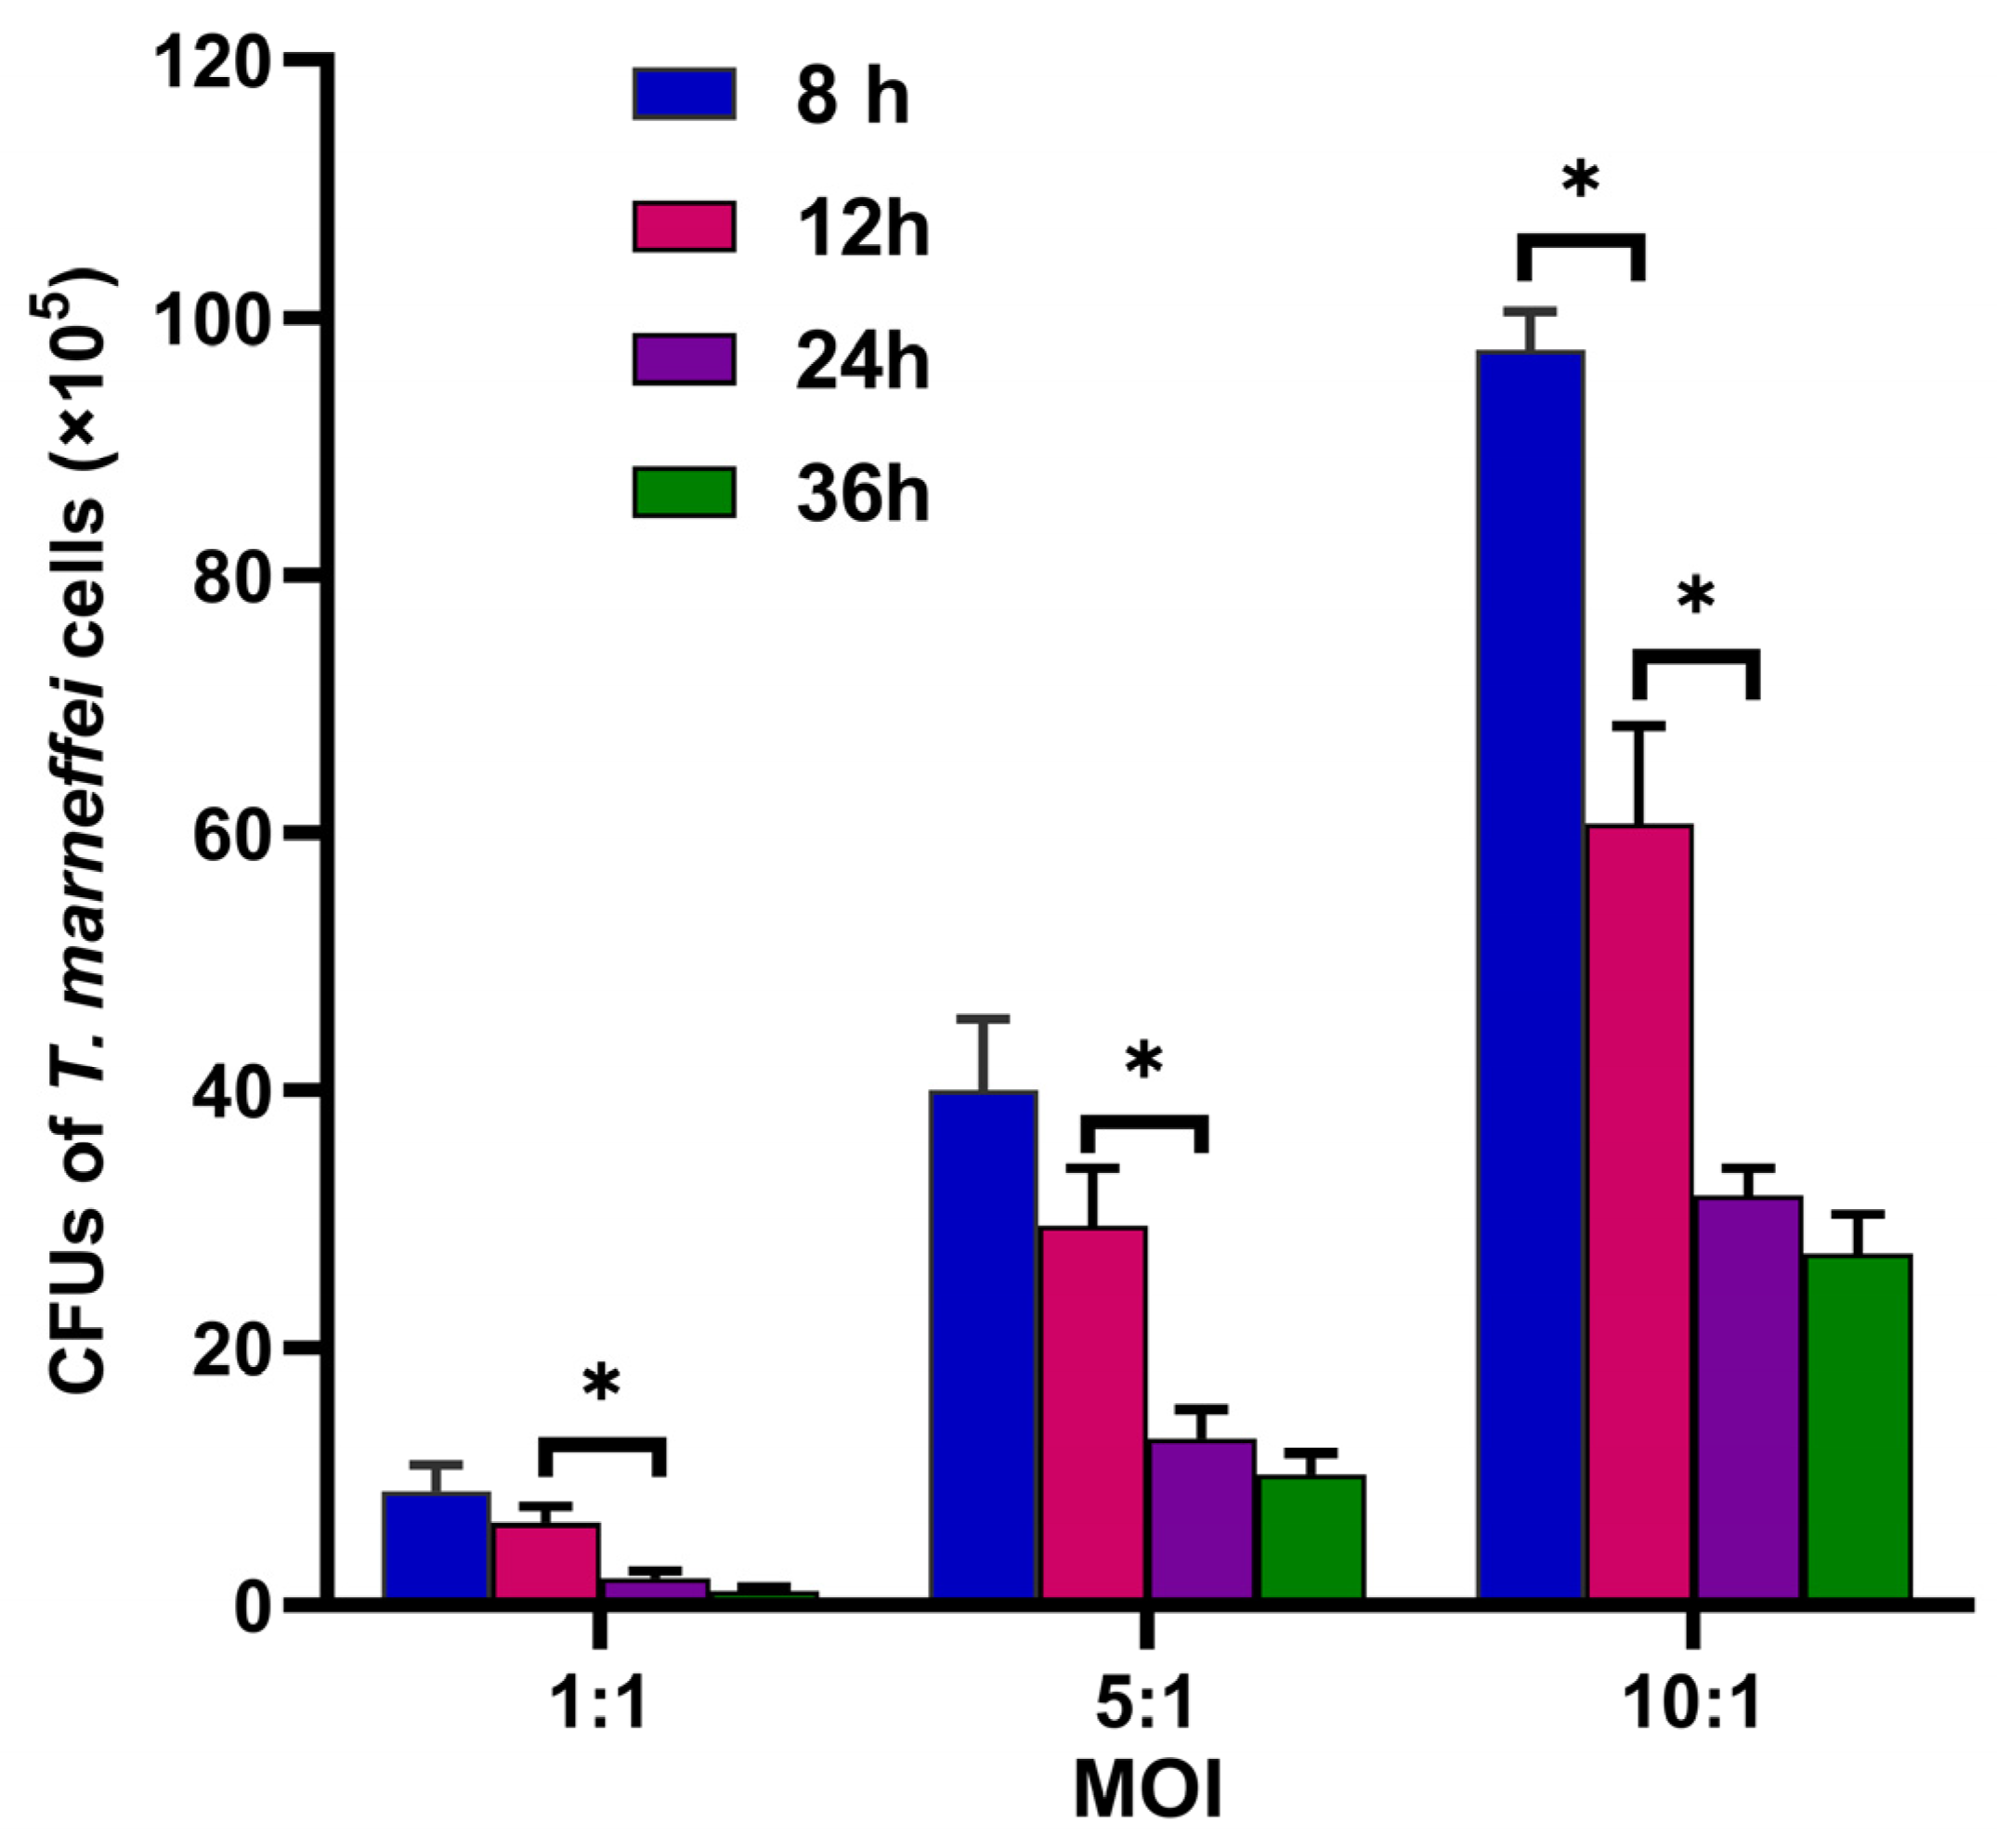
3.2. The Percentage of T. marneffei Yeast Cells Increased
3.3. Expression of Cytokines in THP-1 Cells
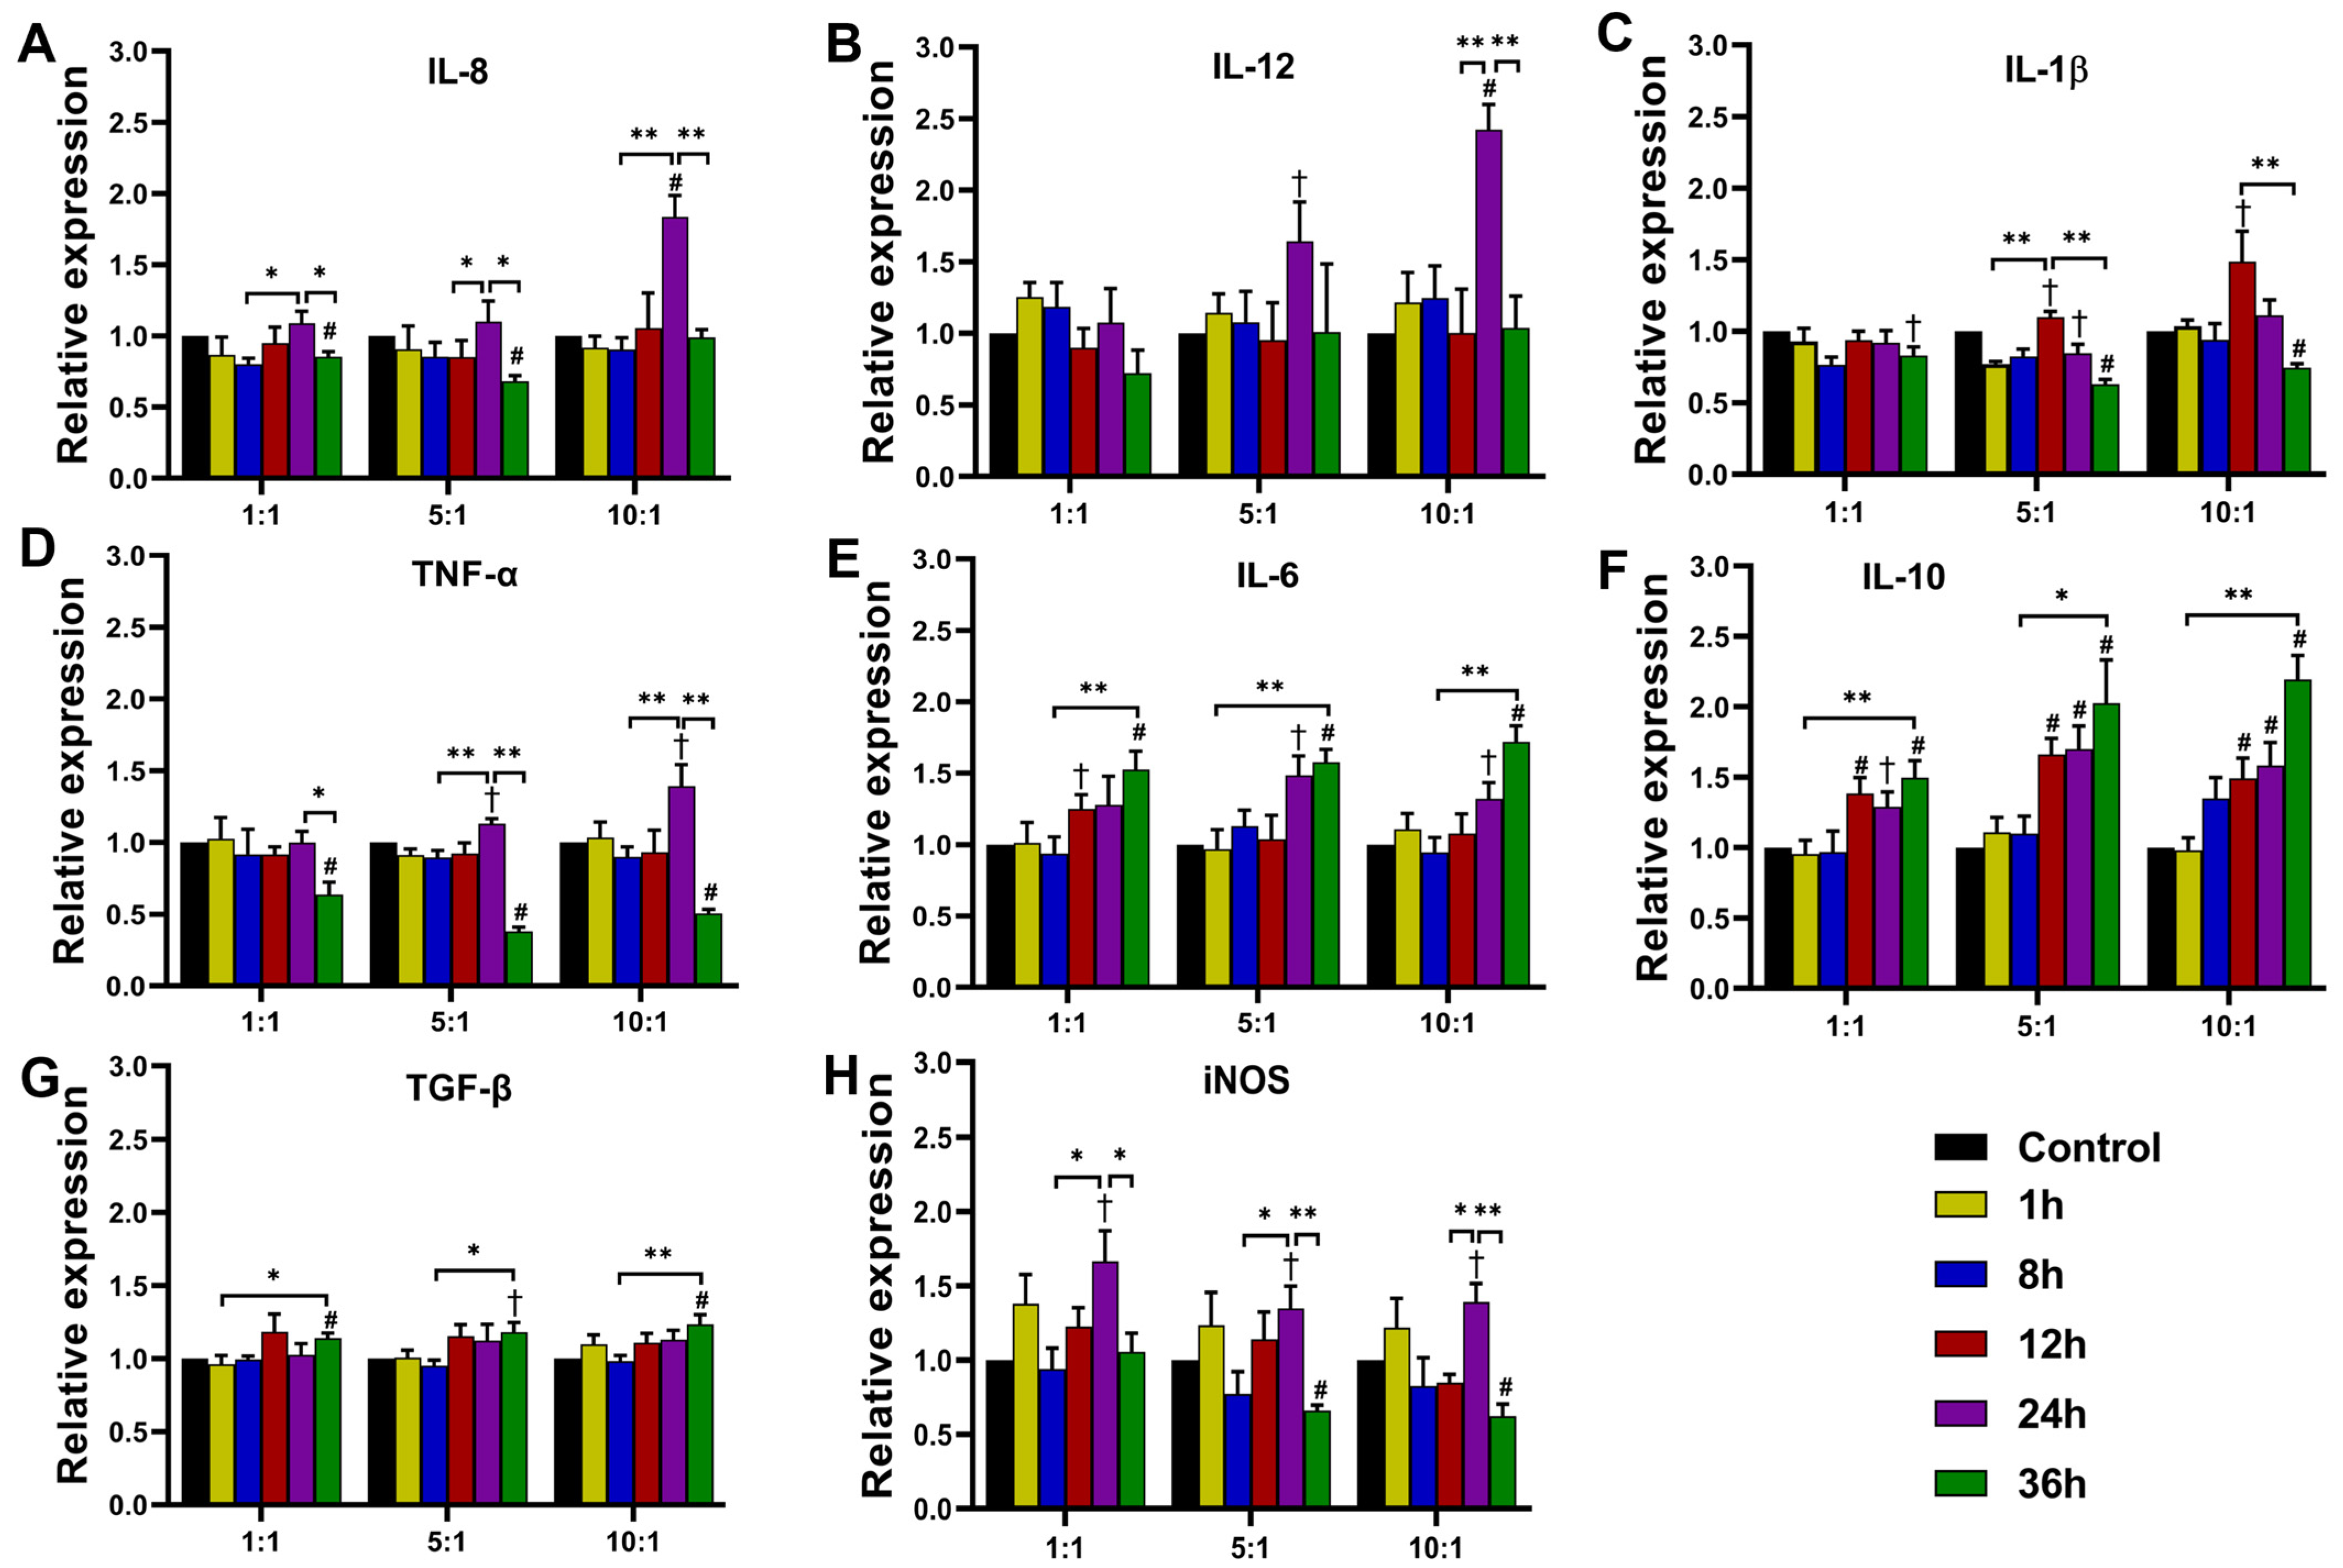
3.3.1. Expression at Transcription Level
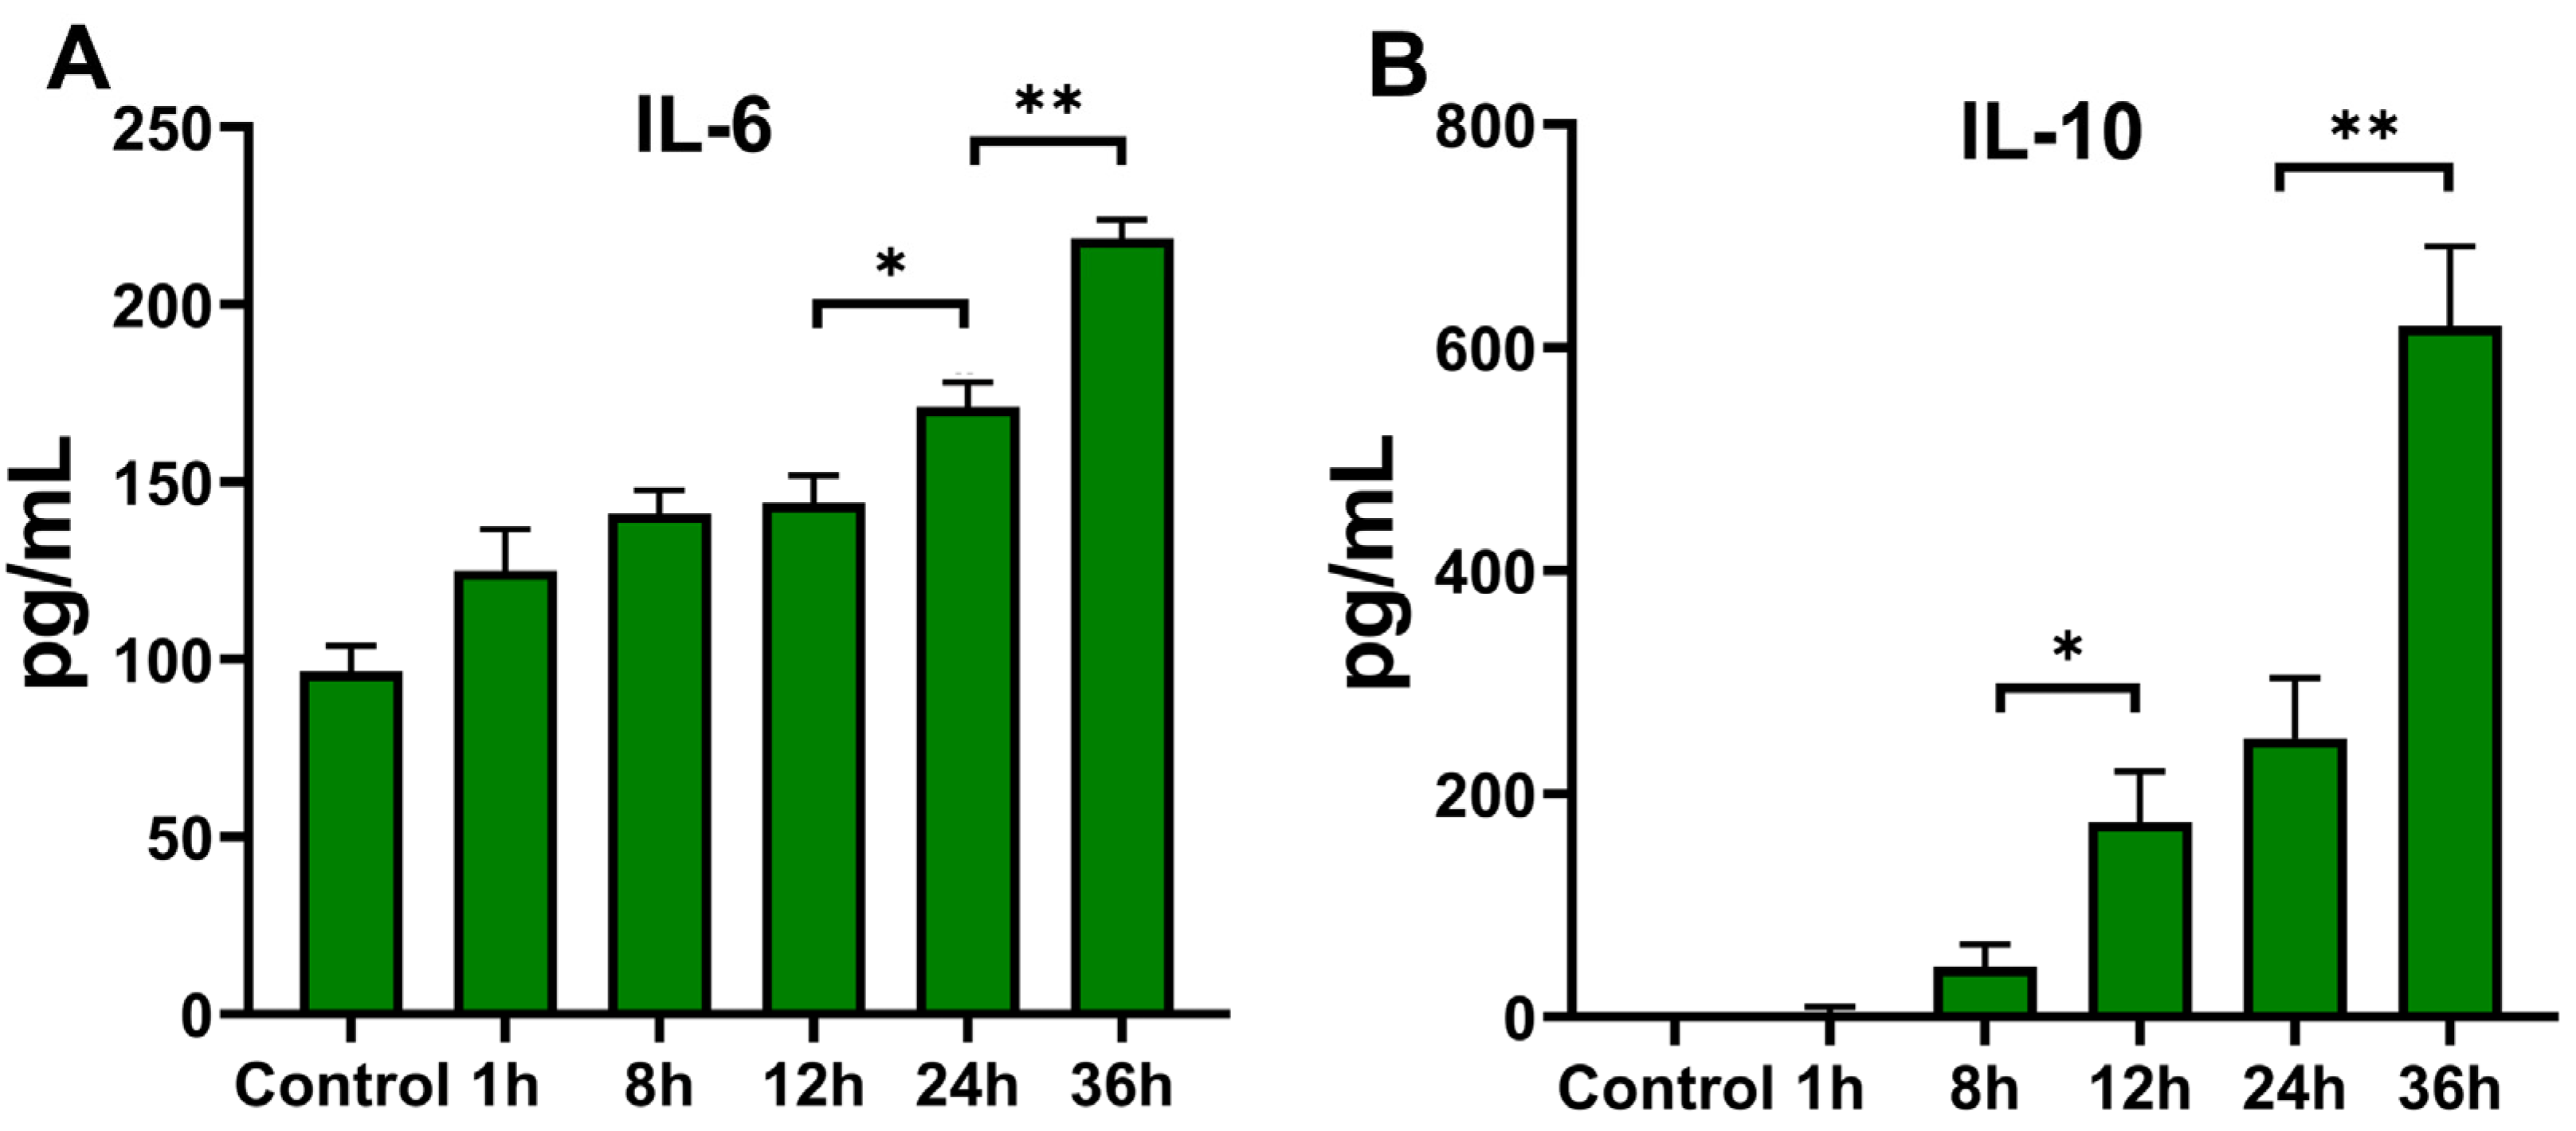
3.3.2. Cytokine Secretion of THP-1 Cells after T. marneffei Infection
3.4. Fungicidal Capacity of THP-1 Cells Changed Dynamically
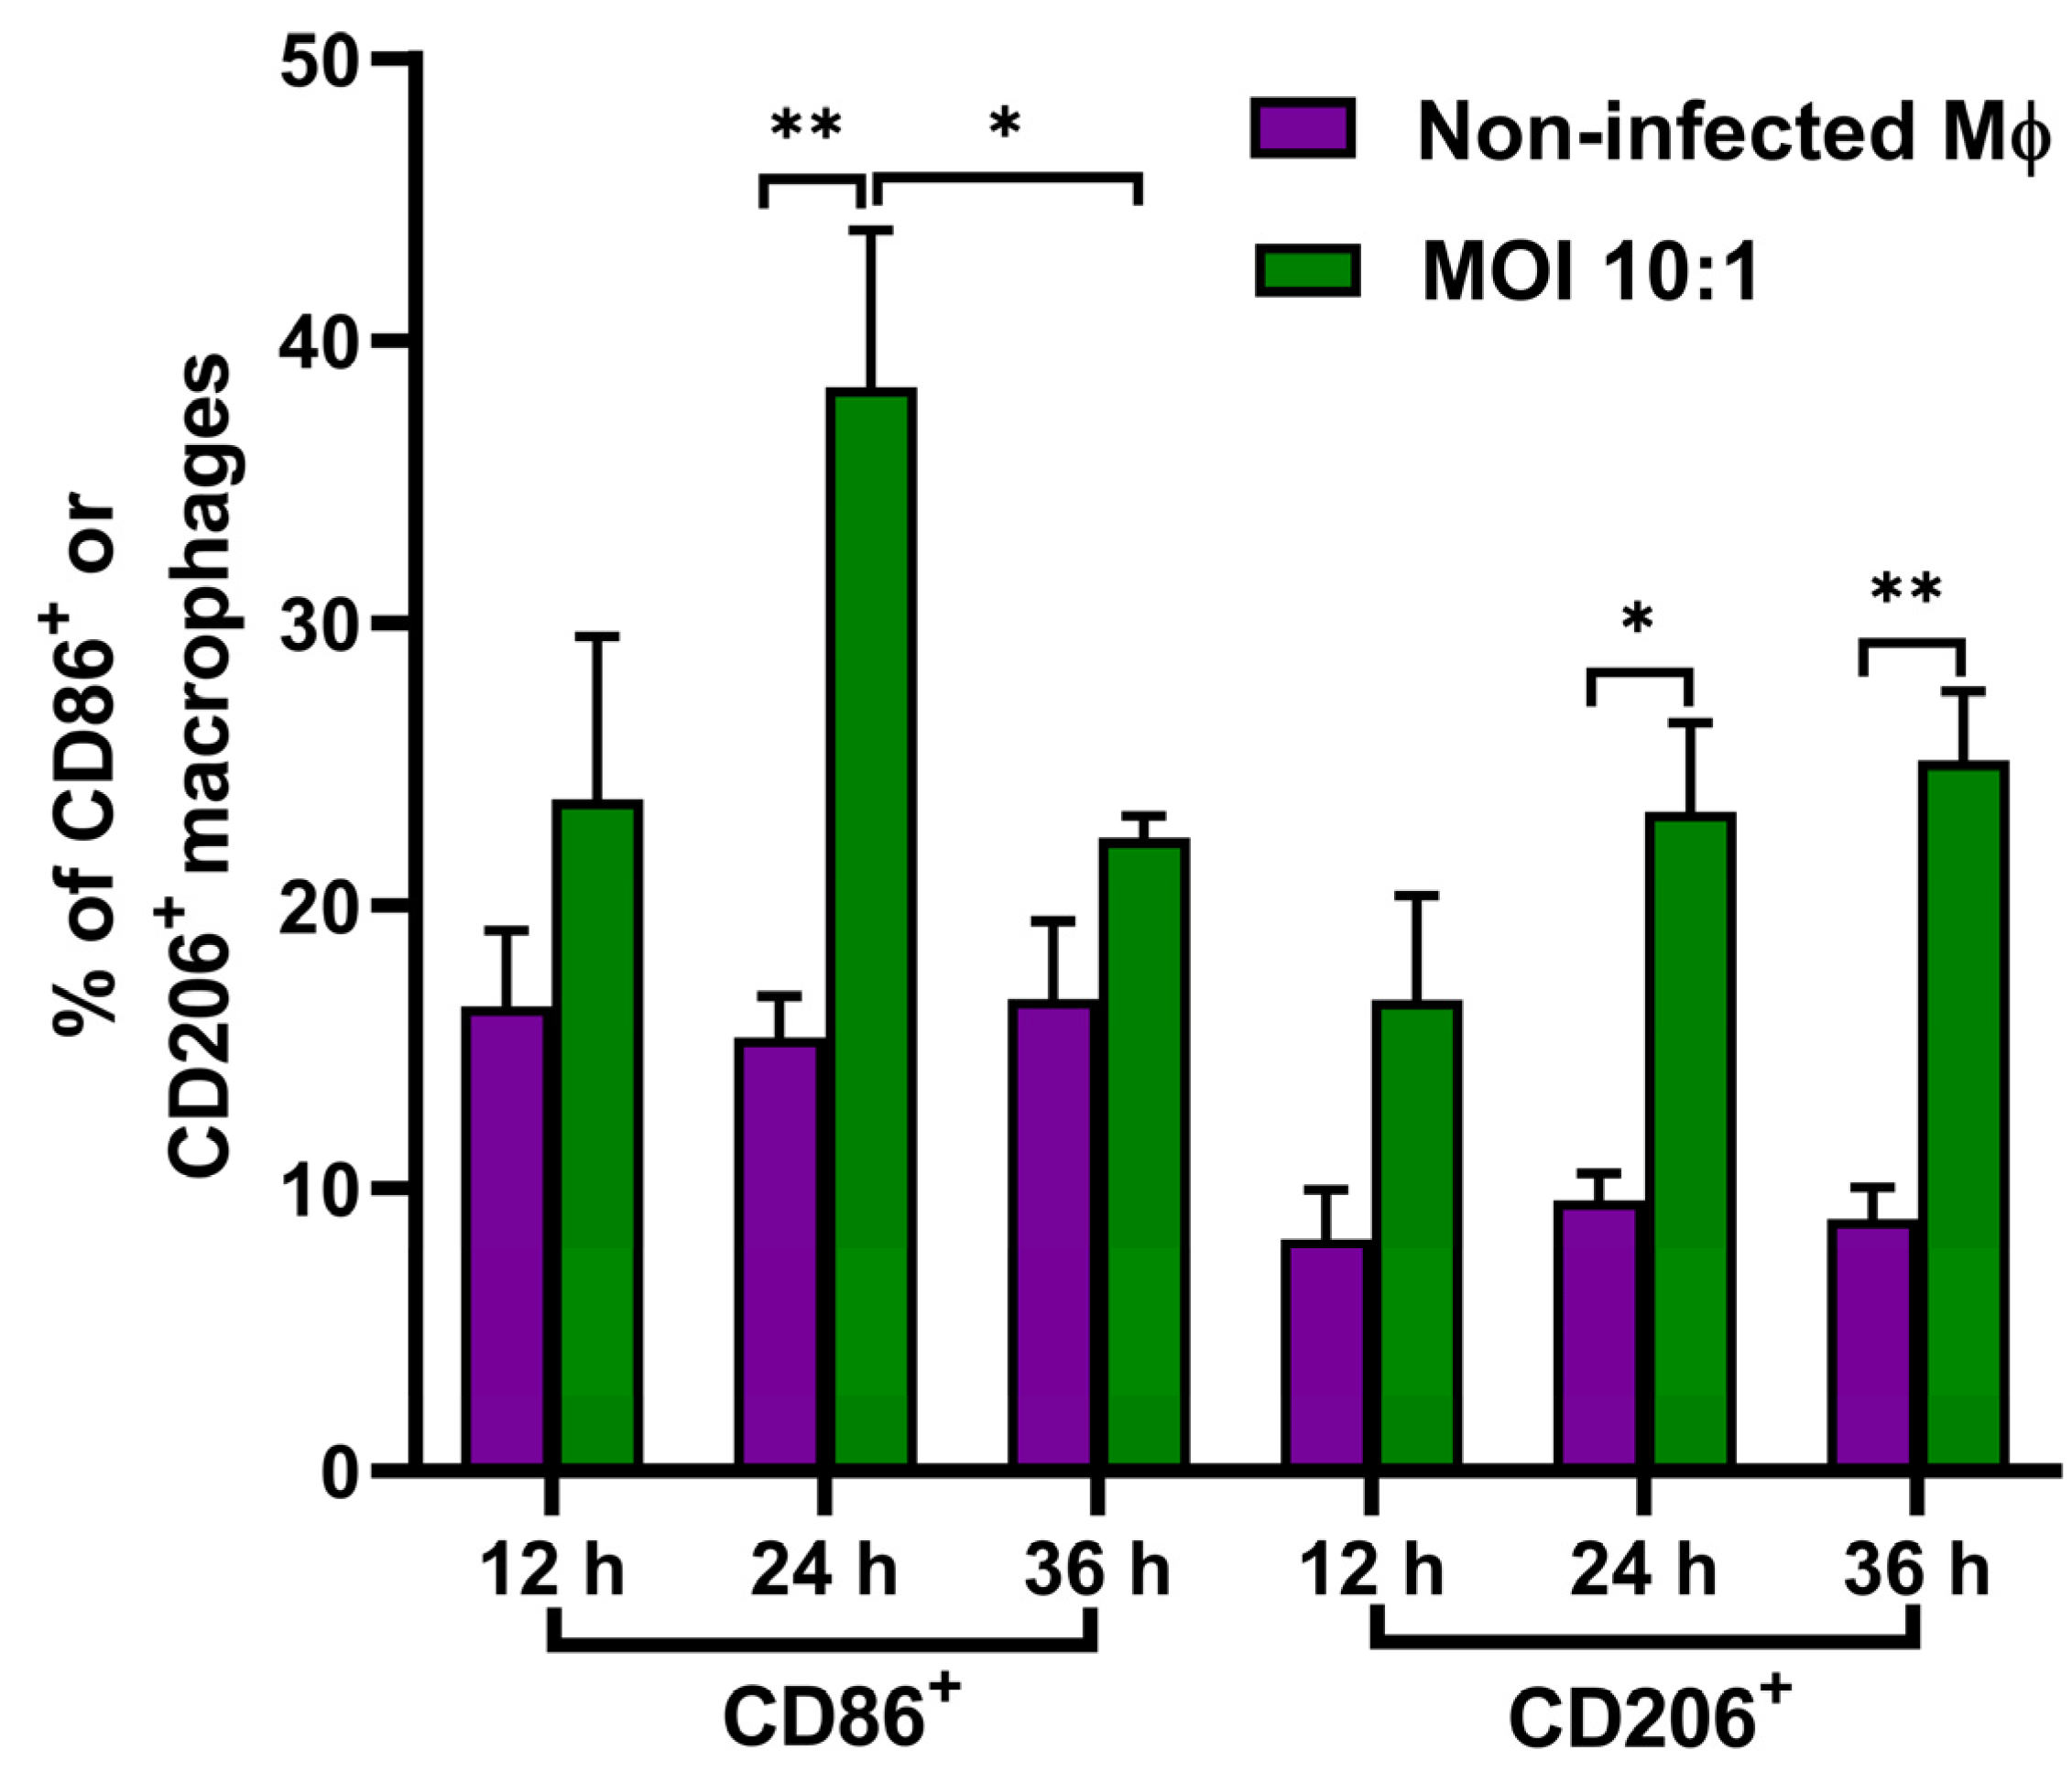
3.5. Analyzed Expression of the Macrophage Surface Markers CD86 and CD206
4. Discussion
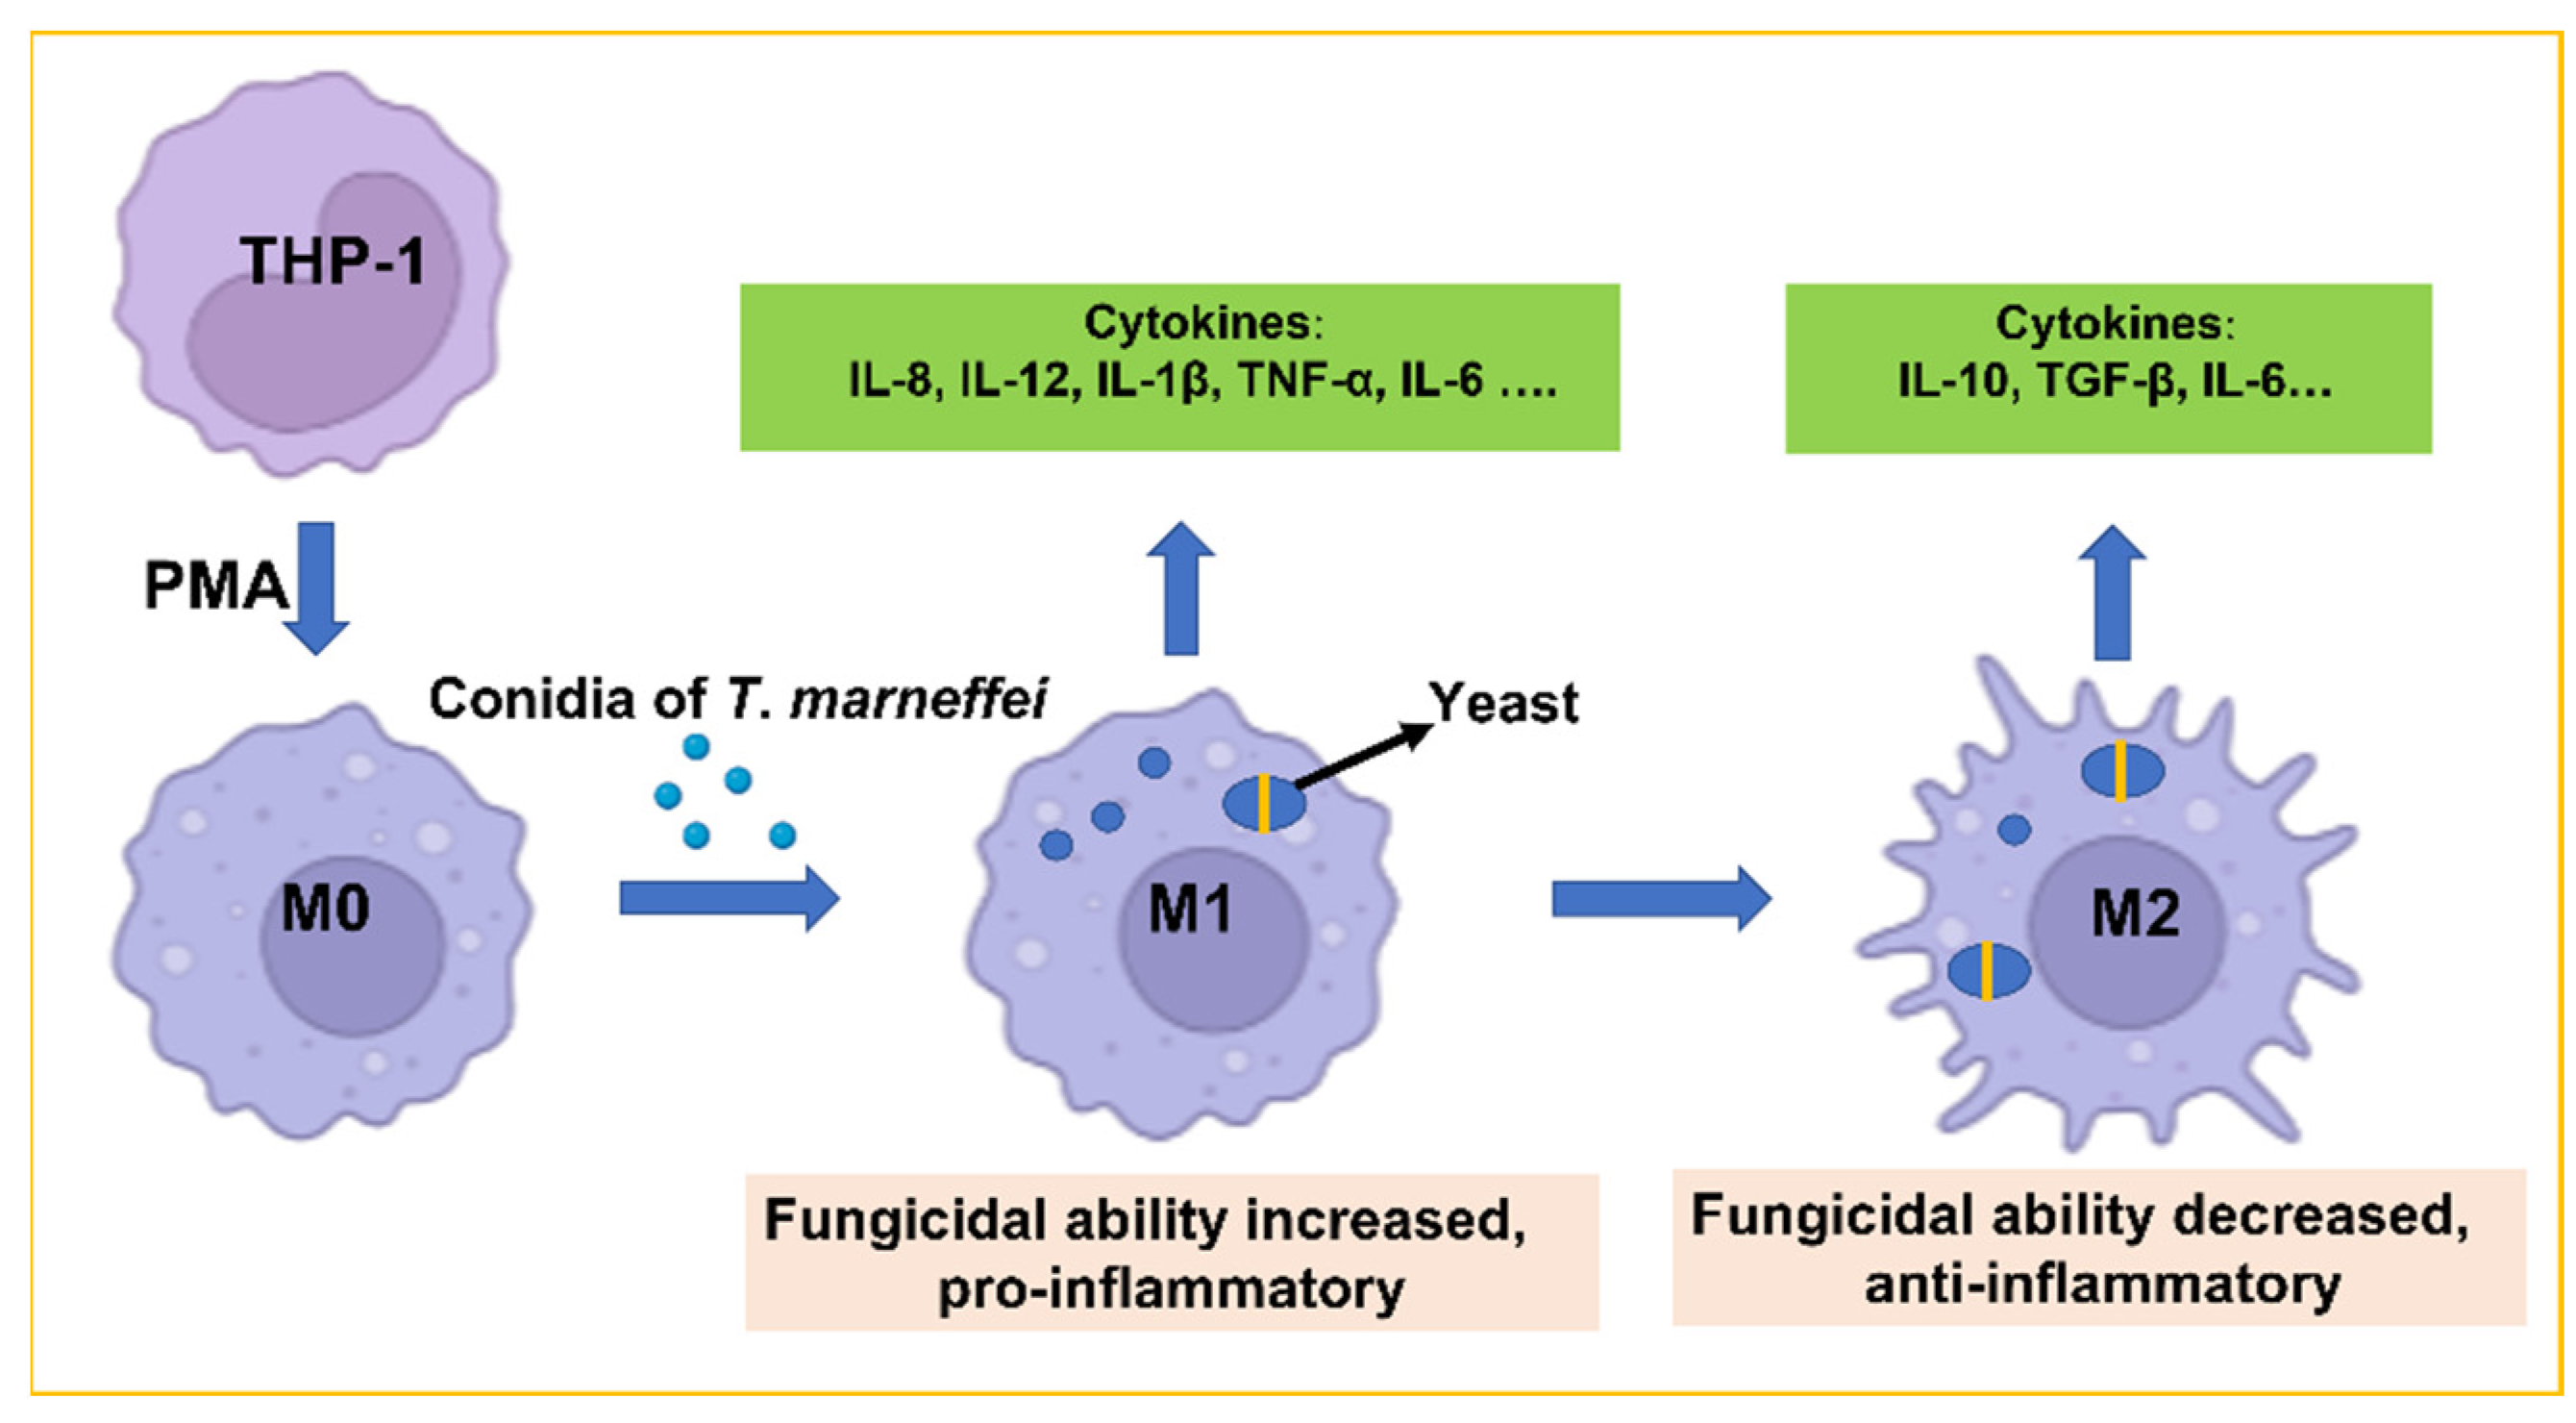
5. Conclusions
Supplementary Materials
Author Contributions
Funding
Conflicts of Interest
References
- Narayanasamy, S.; Dat, V.Q.; Thanh, N.T.; Ly, V.T.; Chan, J.F.; Yuen, K.Y.; Ning, C.; Liang, H.; Li, L.; Chowdhary, A.; et al. A global call for talaromycosis to be recognised as a neglected tropical disease. Lancet Glob. Health 2021, 9, e1618–e1622. [Google Scholar] [CrossRef]
- Rongrungruang, Y.; Levitz, S.M. Interactions of Penicillium marneffei with human leukocytes in vitro. Infect. Immun. 1999, 67, 4732–4736. [Google Scholar] [CrossRef] [PubMed] [Green Version]
- Mosser, D.M.; Edwards, J.P. Exploring the full spectrum of macrophage activation. Nat. Rev. Immunol. 2008, 8, 958–969. [Google Scholar] [CrossRef] [PubMed]
- Ren, Y.; Khan, F.A.; Pandupuspitasari, N.S.; Zhang, S. Immune evasion strategies of pathogens in macrophages: The potential for limiting pathogen transmission. Curr. Issues Mol. Biol. 2017, 21, 21–40. [Google Scholar]
- Becker, K.L.; Ifrim, D.C.; Quintin, J.; Netea, M.G.; van de Veerdonk, F.L. Antifungal innate immunity: Recognition and inflammatory networks. Semin Immunopathol. 2015, 37, 107–116. [Google Scholar] [CrossRef] [PubMed]
- Davis, M.J.; Tsang, T.M.; Qiu, Y.; Dayrit, J.K.; Freij, J.B.; Huffnagle, G.B.; Olszewski, M.A. Macrophage M1/M2 polarization dynamically adapts to changes in cytokine microenvironments in Cryptococcus neoformans infection. mBio 2013, 4, e00264-13. [Google Scholar] [CrossRef] [Green Version]
- Chen, R.; Ji, G.; Wang, L.; Ren, H.; Xi, L. Activation of ERK1/2 and TNF-α production are regulated by calcium/calmodulin signaling pathway during Penicillium marneffei infection within human macrophages. Microb. Pathog. 2016, 93, 95–99. [Google Scholar] [CrossRef]
- Chen, R.; Ji, G.; Ma, T.; Huang, X.; Ren, H.; Xi, L. Role of intracellular free calcium in killing Penicillium marneffei within human macrophages. Microb. Pathog. 2015, 83–84, 29–34. [Google Scholar] [CrossRef]
- Dai, X.; Mao, C.; Lan, X.; Chen, H.; Li, M.; Bai, J.; Deng, J.; Liang, Q.; Zhang, J.; Zhong, X.; et al. Acute Penicillium marneffei infection stimulates host M1/M2a macrophages polarization in BALB/C mice. BMC Microbiol. 2017, 17, 177. [Google Scholar] [CrossRef] [Green Version]
- Dong, R.J.; Zhang, Y.G.; Zhu, L.; Liu, H.L.; Liu, J.; Kuang, Y.Q.; Wang, R.R.; Li, Y.Y. Innate immunity acts as the major regulator in Talaromyces marneffei coinfected AIDS patients: Cytokine profile surveillance during initial 6-month antifungal therapy. Open Forum Infect. Dis. 2019, 6, ofz205. [Google Scholar] [CrossRef]
- Vanittanakom, N.; Cooper, C.R., Jr.; Fisher, M.C.; Sirisanthana, T. Penicillium marneffei infection and recent advances in the epidemiology and molecular biology aspects. Clin. Microbiol. Rev. 2006, 19, 95–110. [Google Scholar] [CrossRef] [PubMed]
- Pongpom, M.; Vanittanakom, P.; Nimmanee, P.; Cooper, C.R., Jr.; Vanittanakom, N. Adaptation to macrophage killing by Talaromyces Marneffei. Future Sci. OA 2017, 3, FSO215. [Google Scholar] [CrossRef] [PubMed] [Green Version]
- Pruksaphon, K.; Ching, M.M.N.; Nosanchuk, J.D.; Kaltsas, A.; Ratanabanangkoon, K.; Roytrakul, S.; Martinez, L.R.; Youngchim, S. Characterization of a novel yeast phase-specific antigen expressed during in vitro thermal phase transition of Talaromyces Marneffei. Sci. Rep. 2020, 10, 21169. [Google Scholar] [CrossRef] [PubMed]
- Srinoulprasert, Y.; Pongtanalert, P.; Chawengkirttikul, R.; Chaiyaroj, S.C. Engagement of Penicillium marneffei conidia with multiple pattern recognition receptors on human monocytes. Microbiol. Immunol. 2009, 53, 162–172. [Google Scholar] [CrossRef] [PubMed]
- Livak, K.J.; Schmittgen, T.D. Analysis of relative gene expression data using real-time quantitative PCR and the 2(-Delta Delta C(T)) Method. Methods 2001, 25, 402–408. [Google Scholar] [CrossRef]
- Toth, E.J.; Boros, E.; Hoffmann, A.; Szebenyi, C.; Homa, M.; Nagy, G.; Vagvolgyi, C.; Nagy, I.; Papp, T. Interaction of THP-1 monocytes with conidia and hyphae of different Curvularia strains. Front Immunol. 2017, 8, 1369. [Google Scholar] [CrossRef] [Green Version]
- Zhang, X.; Li, S.; Li, M.; Huang, H.; Li, J.; Zhou, C. Hypoxia-inducible factor-1alpha mediates the toll-like receptor 4 signaling pathway leading to anti-tumor effects in human hepatocellular carcinoma cells under hypoxic conditions. Oncol. Lett. 2016, 12, 1034–1040. [Google Scholar] [CrossRef] [Green Version]
- Yi, L.; Shen, H.; Zhao, M.; Shao, P.; Liu, C.; Cui, J.; Wang, J.; Wang, C.; Guo, N.; Kang, L.; et al. Inflammation-mediated SOD-2 upregulation contributes to epithelial-mesenchymal transition and migration of tumor cells in aflatoxin G(1)-induced lung adenocarcinoma. Sci. Rep. 2017, 7, 7953. [Google Scholar] [CrossRef] [Green Version]
- Takizawa, H.; Tanaka, M.; Takami, K.; Ohtoshi, T.; Ito, K.; Satoh, M.; Okada, Y.; Yamasawa, F.; Nakahara, K.; Umeda, A. Increased expression of transforming growth facto-rbeta1 in small airway epithelium from tobacco smokers and patients with chronic obstructive pulmonary disease (COPD). Am. J. Respir. Crit. Care Med. 2001, 163, 1476–1483. [Google Scholar] [CrossRef]
- Harrison, L.M.; van den Hoogen, C.; van Haaften, W.C.; Tesh, V.L. Chemokine expression in the monocytic cell line THP-1 in response to purified shiga toxin 1 and/or lipopolysaccharides. Infect. Immun. 2005, 73, 403–412. [Google Scholar] [CrossRef] [Green Version]
- Sapan, H.B.; Paturusi, I.; Islam, A.A.; Yusuf, I.; Patellongi, I.; Massi, M.N.; Pusponegoro, A.D.; Arief, S.K.; Labeda, I.; Rendy, L.; et al. Interleukin-6 and interleukin-10 plasma levels and mRNA expression in polytrauma patients. Chin. J. Traumatol. 2017, 20, 318–322. [Google Scholar] [CrossRef] [PubMed]
- Zhang, W.; Chen, L.; Ma, K.; Zhao, Y.; Liu, X.; Wang, Y.; Liu, M.; Liang, S.; Zhu, H.; Xu, N. Polarization of macrophages in the tumor microenvironment is influenced by EGFR signaling within colon cancer cells. Oncotarget 2016, 7, 75366–75378. [Google Scholar] [CrossRef] [PubMed] [Green Version]
- Maess, M.B.; Sendelbach, S.; Lorkowski, S. Selection of reliable reference genes during THP-1 monocyte differentiation into macrophages. BMC Mol. Biol. 2010, 11, 90. [Google Scholar] [CrossRef] [Green Version]
- Roszer, T. Understanding the mysterious M2 macrophage through activation markers and effector mechanisms. Mediat. Inflamm. 2015, 2015, 816460. [Google Scholar] [CrossRef] [Green Version]
- Bertani, F.R.; Mozetic, P.; Fioramonti, M.; Iuliani, M.; Ribelli, G.; Pantano, F.; Santini, D.; Tonini, G.; Trombetta, M.; Businaro, L.; et al. Classification of M1/M2-polarized human macrophages by label-free hyperspectral reflectance confocal microscopy and multivariate analysis. Sci. Rep. 2017, 7, 8965. [Google Scholar] [CrossRef] [Green Version]
- Sathongdejwisit, P.; Pruksaphon, K.; Intaramat, A.; Aiumurai, P.; Sookrung, N.; Ratanabanangkoon, K.; Nosanchuk, J.D.; Youngchim, S. A Novel, Inexpensive in-house immunochromatographic strip test for cryptococcosis based on the Cryptococcal glucuronoxylomannan specific monoclonal antibody 18B7. Diagnostics 2021, 11, 758. [Google Scholar] [CrossRef] [PubMed]
- Ellett, F.; Pazhakh, V.; Pase, L.; Benard, E.L.; Weerasinghe, H.; Azabdaftari, D.; Alasmari, S.; Andrianopoulos, A.; Lieschke, G.J. Macrophages protect Talaromyces marneffei conidia from myeloperoxidase-dependent neutrophil fungicidal activity during infection establishment in vivo. PLoS Pathog. 2018, 14, e1007063. [Google Scholar] [CrossRef] [Green Version]
- Peng, Y.; Chen, Y.; Ma, J.; Zhou, W.; Wang, Y.; Wang, Y.; Zheng, H.; Shi, W. Role and mechanism of the Dectin-1-mediated Syk/NF-κB signaling pathway in Talaromyces marneffei infection. Exp. Med. 2022, 23, 84. [Google Scholar] [CrossRef]
- Netea, M.G.; Kullberg, B.J.; Van der Meer, J.W. Proinflammatory cytokines in the treatment of bacterial and fungal infections. BioDrugs 2004, 18, 9–22. [Google Scholar] [CrossRef]
- Vonk, A.G.; Netea, M.G.; van Krieken, J.H.; Iwakura, Y.; van der Meer, J.W.; Kullberg, B.J. Endogenous interleukin (IL)-1 alpha and IL-1 beta are crucial for host defense against disseminated candidiasis. J. Infect. Dis. 2006, 193, 1419–1426. [Google Scholar] [CrossRef] [Green Version]
- Antachopoulos, C.; Roilides, E. Cytokines and fungal infections. Br. J. Haematol. 2005, 129, 583–596. [Google Scholar] [CrossRef] [PubMed]
- Maddur, M.S.; Bayry, J. B cells drive Th2 responses by instructing human dendritic cell maturation. Oncoimmunology 2015, 4, e1005508. [Google Scholar] [CrossRef] [PubMed] [Green Version]
- Diehl, S.; Anguita, J.; Hoffmeyer, A.; Zapton, T.; Ihle, J.N.; Fikrig, E.; Rincon, M. Inhibition of Th1 differentiation by IL-6 is mediated by SOCS1. Immunity 2000, 13, 805–815. [Google Scholar] [CrossRef] [PubMed] [Green Version]
- Sanjabi, S.; Oh, S.A.; Li, M.O. Regulation of the immune response by TGF-β: From conception to autoimmunity and infection. Cold Spring Harb Perspect. Biol. 2017, 9, a022236. [Google Scholar] [CrossRef] [PubMed] [Green Version]
- Katakura, T.; Miyazaki, M.; Kobayashi, M.; Herndon, D.N.; Suzuki, F. CCL17 and IL-10 as effectors that enable alternatively activated macrophages to inhibit the generation of classically activated macrophages. J. Immunol. 2004, 172, 1407–1413. [Google Scholar] [CrossRef] [PubMed] [Green Version]
- Chen, Z.; Wang, N.; Huang, Y.; Wang, M. Clinical characteristics and cerebro-spinal fluid cytokine changes in patients with acquired immunodeficiency syndrome and central nervous system infection. Exp. Med. 2019, 18, 523–530. [Google Scholar] [CrossRef] [PubMed]
- Li, Z.; Lu, G.; Meng, G. Pathogenic fungal infection in the lung. Front Immunol. 2019, 10, 1524. [Google Scholar] [CrossRef]


| No | Cytokines | Forward Primer (5′-3′) | Reverse Primer (5′-3′) | Ref. |
|---|---|---|---|---|
| 1 | IL-1β | AGCTGGAGAGTGTAGATCCCAA | GGGAACTGGGCAGACTCAAA | [16] |
| 2 | IL-6 | TGCAATAACCACCCCTGACC | GTGCCCATGCTACATTTGCC | [17] |
| 3 | TNF-α | CCCAGGGACCTCTCTCTAATC | ATGGGCTACAGGCTTGTCACT | [18] |
| 4 | TGF-β1 | GCCCTGGACACCAACTATTGCT | AGGCTCCAAATGTAGGGGCAGG | [19] |
| 5 | IL-8 | AAGGAACCATCTCACTGTGTGTAAAC | ATCAGGAAGGCTGCCAAGAG | [20] |
| 6 | IL-10 | GTGATGCCCCAAGCTGAGA | CACGGCCTTGCTCTTGTTTT | [21] |
| 7 | IL-12 | GCGGAGCTGCTACACTCTCT | GGTGGGTCAGGTTTGATGAT | [22] |
| 8 | iNOS | TCCAAGGTATCCTGGAGCGA | CAGGGACGGGAACTCCTCTA | [22] |
| 9 | β-actin | ATTGCCGACAGGATGCAGAA | GCTGATCCACATCTGCTGGAA | [23] |
Publisher’s Note: MDPI stays neutral with regard to jurisdictional claims in published maps and institutional affiliations. |
© 2022 by the authors. Licensee MDPI, Basel, Switzerland. This article is an open access article distributed under the terms and conditions of the Creative Commons Attribution (CC BY) license (https://creativecommons.org/licenses/by/4.0/).
Share and Cite
Shu, F.; Thammasit, P.; Pruksaphon, K.; Nosanchuk, J.D.; Youngchim, S. Expression of Cytokine Profiles in Human THP-1 Cells during Phase Transition of Talaromyces marneffei. Pathogens 2022, 11, 1465. https://doi.org/10.3390/pathogens11121465
Shu F, Thammasit P, Pruksaphon K, Nosanchuk JD, Youngchim S. Expression of Cytokine Profiles in Human THP-1 Cells during Phase Transition of Talaromyces marneffei. Pathogens. 2022; 11(12):1465. https://doi.org/10.3390/pathogens11121465
Chicago/Turabian StyleShu, Fangyi, Patcharin Thammasit, Kritsada Pruksaphon, Joshua D. Nosanchuk, and Sirida Youngchim. 2022. "Expression of Cytokine Profiles in Human THP-1 Cells during Phase Transition of Talaromyces marneffei" Pathogens 11, no. 12: 1465. https://doi.org/10.3390/pathogens11121465