
Models for Studying the Distribution of Ticks and Tick-Borne Diseases in Animals: A Systematic Review and a Meta-Analysis with a Focus on Africa

 ,
,  , ,
, ,
Abstract
:1. Introduction
2. Results
2.1. General Description of the Included Studies
2.2. Modeling Ticks Distribution or Habitats
2.3. Spatio-Temporal Modeling of Tick-Borne Diseases
2.4. Models with Estimation of Sensitivity, Specificity or Accuracy Values
2.5. Models without Any Estimation of Sensitivity, Specificity and Accuracy Values
2.6. Focus on Modeling Ticks and Tick-Borne Pathogens in Africa
2.7. Meta-Analysis of the Models’ Accuracy
3. Discussion
3.1. Models Used in the Selected Papers
3.2. Performance of Models
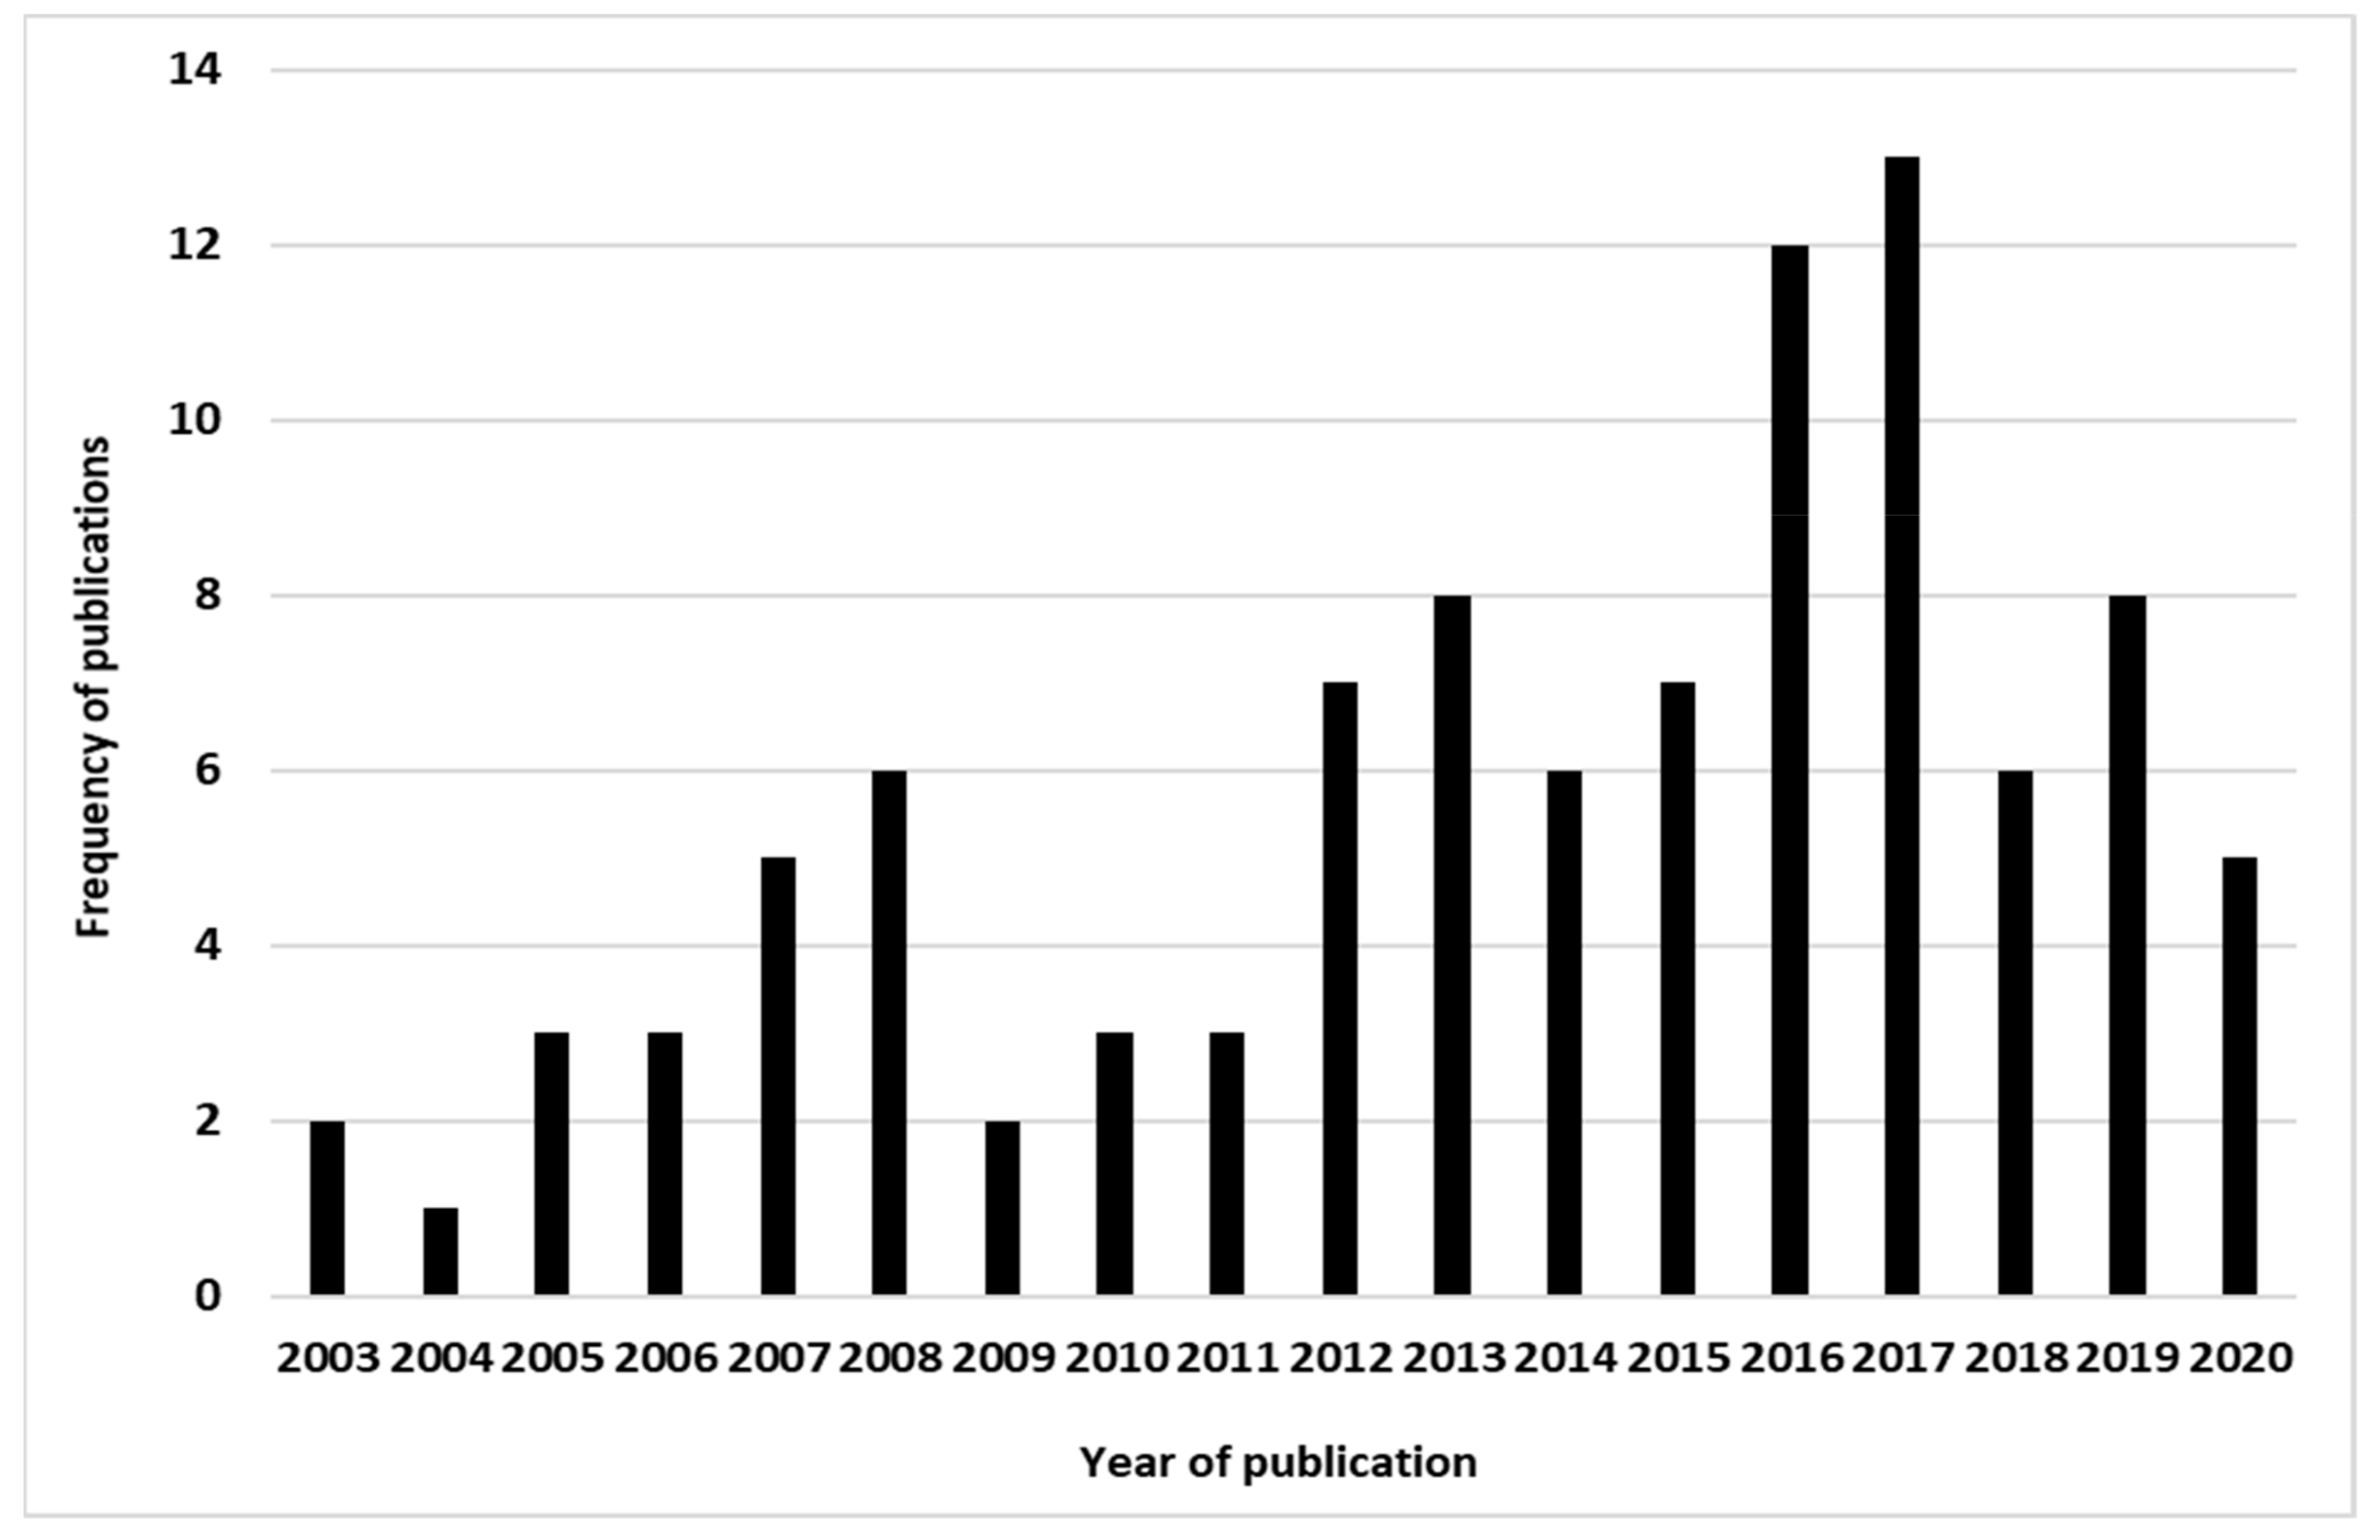
3.3. Evolution in Time of the Number of the Ticks and Tick-Borne Disease Modeling Studies
3.4. Geographical Distribution of the Ticks and Tick-Borne Disease Modeling Studies
3.5. Ticks and Pathogens Modeled
3.6. Focus on Modeling Ticks and Tick-Borne Diseases in Africa
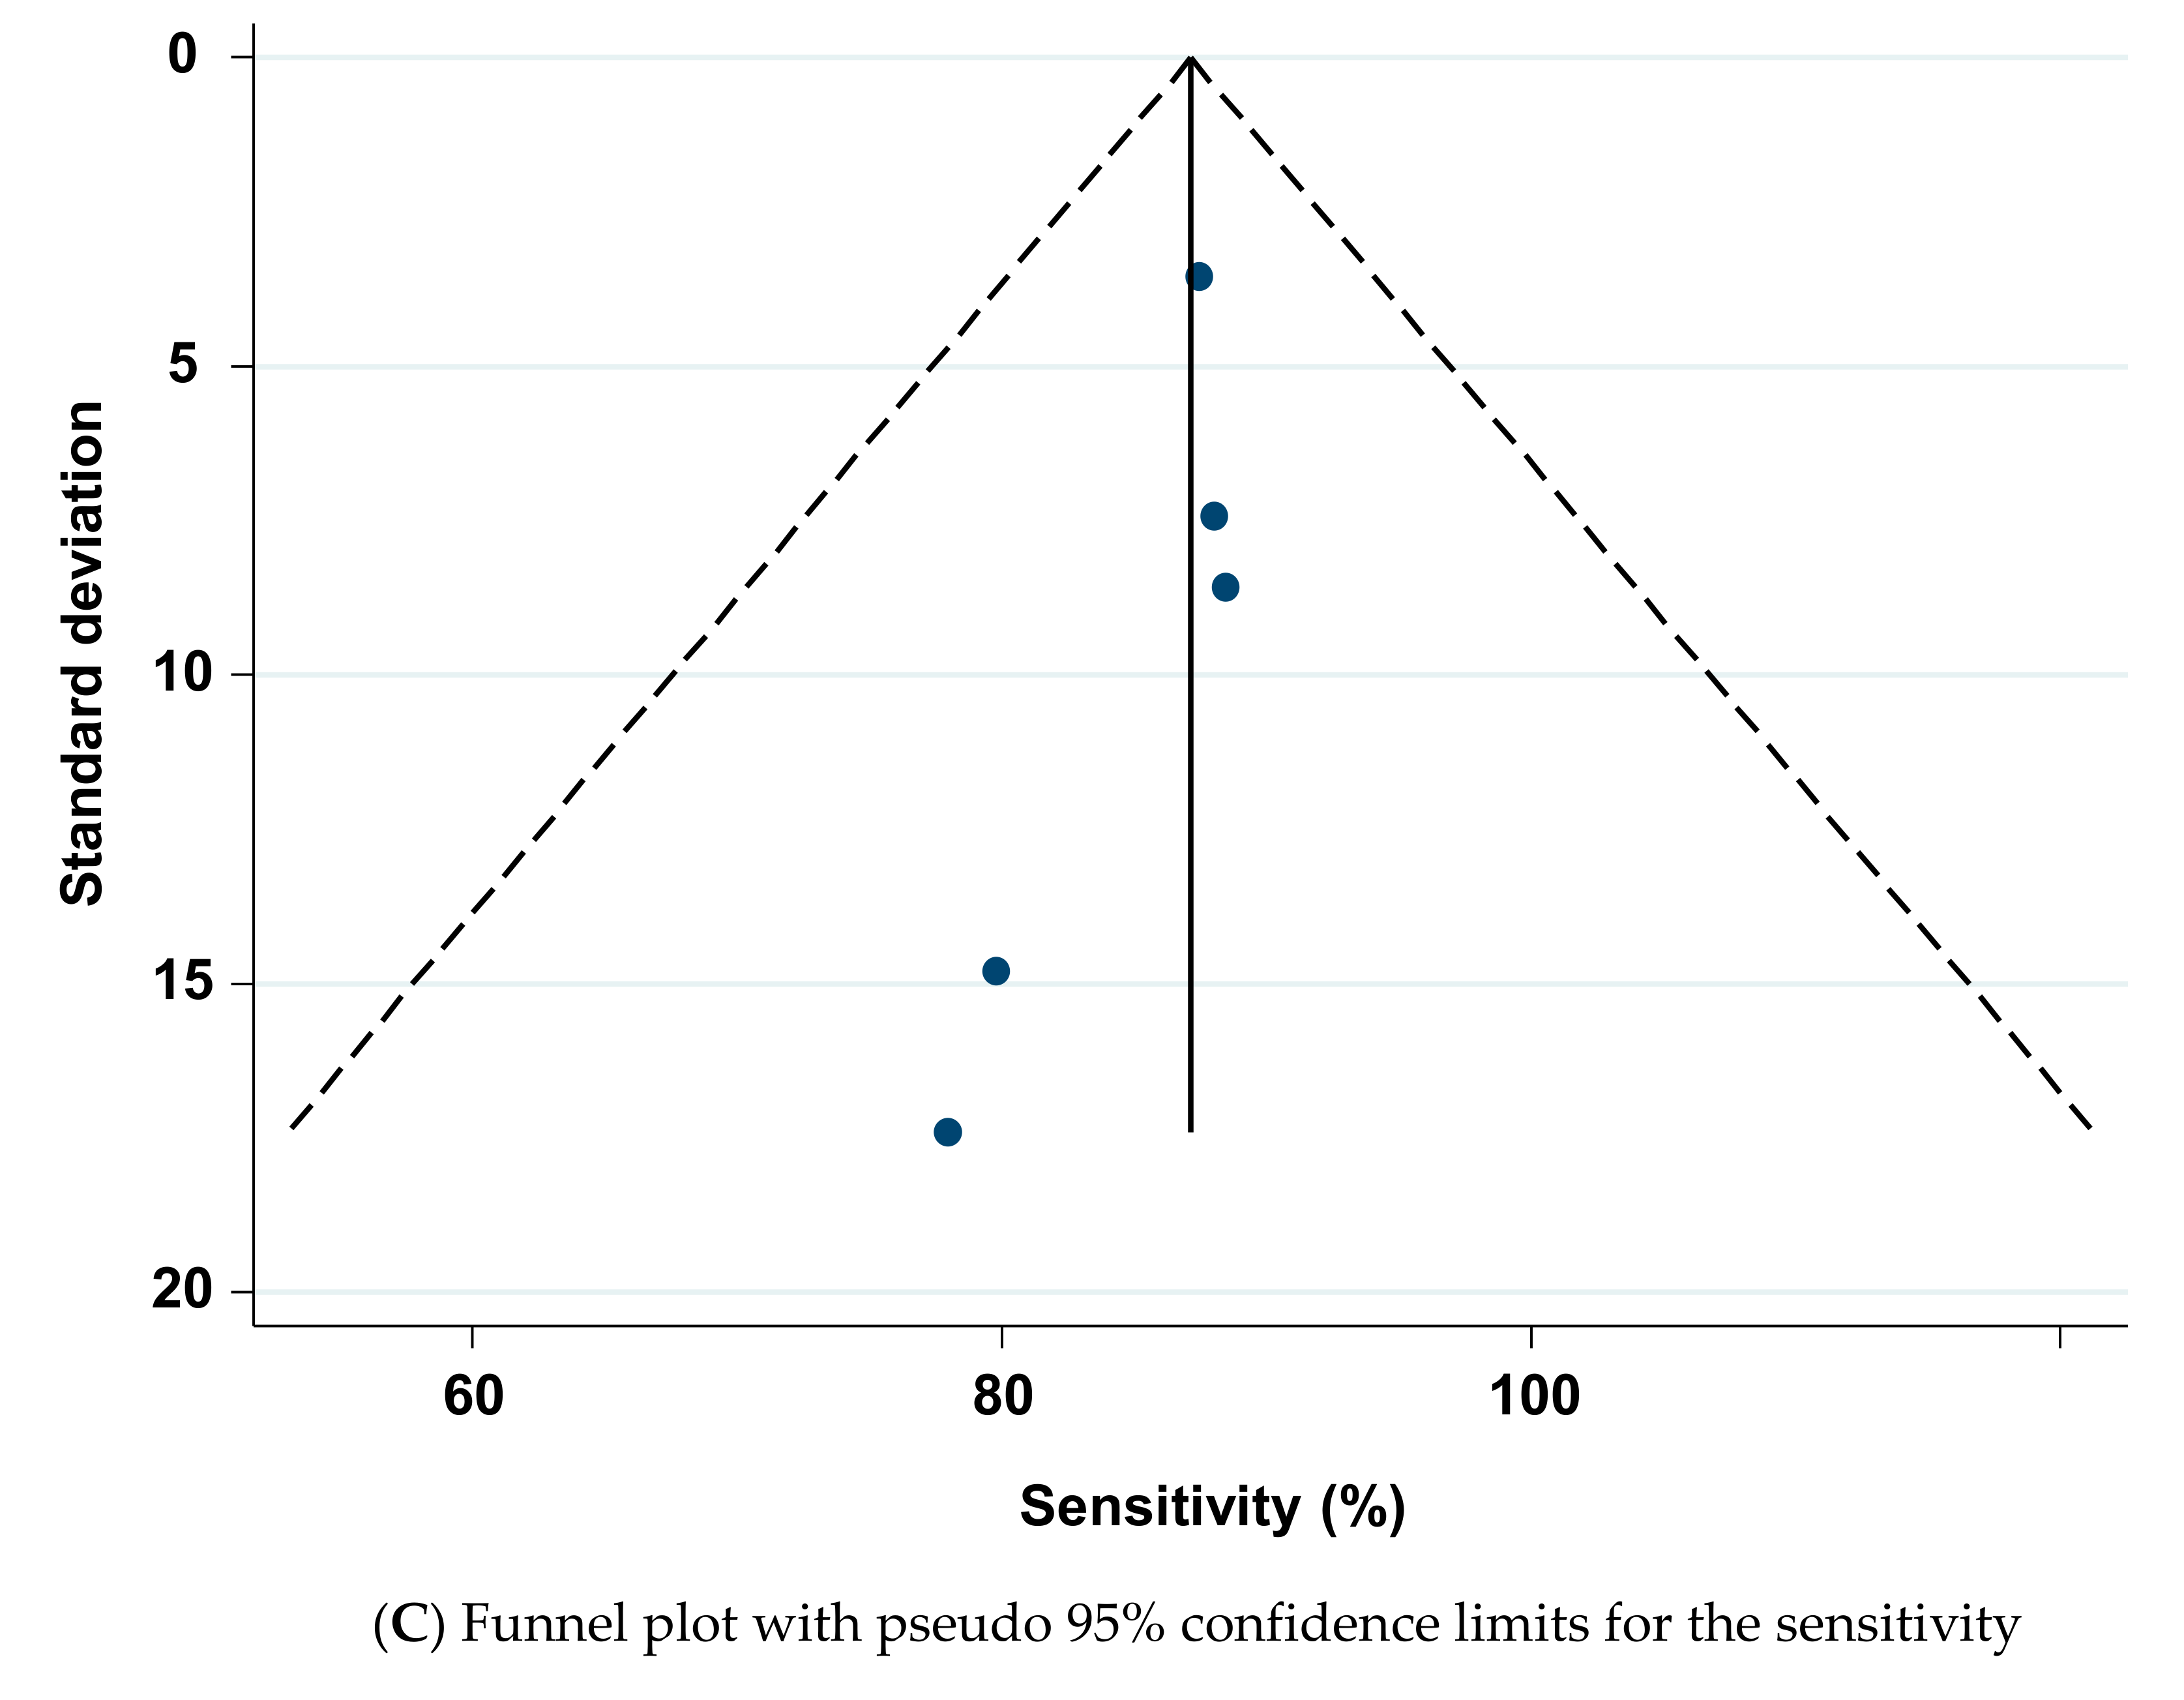
3.7. Meta-Analysis of the Models’ Accuracy
4. Materials and Methods
4.1. Search Strategy and Study Selection
4.2. Eligibility Criteria
4.3. Meta-Analysis of the Accuracy of Models in the Selected Studies
5. Conclusions
Author Contributions
Funding
Institutional Review Board Statement
Informed Consent Statement
Data Availability Statement
Acknowledgments
Conflicts of Interest
Appendix A
| Section/Topic | # | Checklist Item | Reported on Page # |
| Title | |||
| Title | 1 | Identify the report as a systematic review, meta-analysis, or both. | 1 |
| Abstract | |||
| Structured summary | 2 | Provide a structured summary including, as applicable: background; objectives; data sources; study eligibility criteria, participants, and interventions; study appraisal and synthesis methods; results; limitations; conclusions and implications of key findings; systematic review registration number. | 1 |
| Introduction | |||
| Rationale | 3 | Describe the rationale for the review in the context of what is already known. | 2 |
| Objectives | 4 | Provide an explicit statement of questions being addressed with reference to Participants, Interventions, Comparisons, Outcomes, and Study design (PICOS). | 4 |
| Methods | |||
| Protocol and registration | 5 | Indicate if a review protocol exists, if and where it can be accessed (e.g., Web address), and, if available, provide registration information including registration number. | 4 |
| Eligibility criteria | 6 | Specify study characteristics (e.g., PICOS, length of follow-up) and report characteristics (e.g., years considered, language, publication status) used as criteria for eligibility, giving rationale. | 4–5 |
| Information sources | 7 | Describe all information sources (e.g., databases with dates of coverage, contact with study authors to identify additional studies) in the search and date last searched. | 4–5 |
| Search | 8 | Present full electronic search strategy for at least one database, including any limits used, such that it could be repeated. | 4–5 |
| Study selection | 9 | State the process for selecting studies (i.e., screening, eligibility, included in systematic review, and, if applicable, included in the meta-analysis). | 4–5 |
| Data collection process | 10 | Describe the method of data extraction from reports (e.g., piloted forms, independently, in duplicate) and any processes for obtaining and confirming data from investigators. | 4–5 |
| Data items | 11 | List and define all variables for which data were sought (e.g., PICOS, funding sources) and any assumptions and simplifications made. | 4–5 |
| Risk of bias in individualstudies | 12 | Describe methods used for assessing the risk of bias of individual studies (including specification of whether this was done at the study or outcome level), and how this information is to be used in any data synthesis. | 5 |
| Summary measures | 13 | State the principal summary measures (e.g., risk ratio, the difference in means). | 5 |
| Synthesis of results | 14 | Describe the methods of handling data and combining results of studies, if done, including measures of consistency (e.g., I2) for each meta-analysis. | 5 |
| Risk of bias across studies | 15 | Specify any assessment of the risk of bias that may affect the cumulative evidence (e.g., publication bias, selective reporting within studies). | 5 |
| Additional analyses | 16 | Describe methods of additional analyses (e.g., sensitivity or subgroup analyses, meta-regression), if done, indicating which were pre-specified. | 5 |
| Results | |||
| Study selection | 17 | Give numbers of studies screened, assessed for eligibility, and included in the review, with reasons for exclusions at each stage, ideally with a flow diagram. | 5–9 |
| Study characteristics | 18 | For each study, present characteristics for which data were extracted (e.g., study size, PICOS, follow-up period) and provide the citations. | 5–9 |
| Risk of bias within studies | 19 | Present data on the risk of bias of each study and, if available, any outcome level assessment (see item 12). | 9 |
| Results of individual studies | 20 | For all outcomes considered (benefits or harms), present, for each study: (a) simple summary data for each intervention group (b) effect estimates and confidence intervals, ideally with a forest plot. | 9 |
| Synthesis of results | 21 | Present results of each meta-analysis done, including confidence intervals and measures of consistency. | 9 |
| Risk of bias across studies | 22 | Present results of any assessment of the risk of bias across studies (see Item 15). | 9 |
| Additional analysis | 23 | Give results of additional analyses, if done (e.g., sensitivity or subgroup analyses, meta-regression (see Item 16)). | 7–9 |
| Discussion | |||
| Summary of evidence | 24 | Summarize the main findings including the strength of evidence for each main outcome; consider their relevance to key groups (e.g., healthcare providers, users, and policymakers). | 9–15 |
| Limitations | 25 | Discuss limitations at study and outcome level (e.g., risk of bias), and review-level (e.g., incomplete retrieval of identified research, reporting bias). | 9–15 |
| Conclusions | 26 | Provide a general interpretation of the results in the context of other evidence and implications for future research. | 15 |
| Funding | |||
| Funding | 27 | Describe sources of funding for the systematic review and other support (e.g., supply of data); the role of funders for the systematic review. | 16 |
Appendix B
| Last Date of Search | Database Consulted | Search Algorithms Applied | Results |
| 28 September 2018 | Scopus | ((modelling or modeling or models) and (animals and ticks) and (tick and borne and diseases) and (distribution or spread) and dynamic) | 901 |
| 28 September 2018 | Pubmed | ((modelling or modeling or models) and (animals and ticks) and (tick and borne and diseases) and (distribution or spread) and dynamic) | 445 |
| 28 September 2018 | Scopus | modelling the distribution dynamic of animals ticks AND tick borne disease | 306 |
| 28 September 2018 | Pubmed | modelling the distribution dynamic of animals ticks AND tick borne disease | 128 |
| 28 September 2018 | Scopus | qualitative modelling of the distribution dynamic of animals ticks AND tick borne disease | 57 |
| 28 September 2018 | Pubmed | qualitative modelling of the distribution dynamic of animals ticks AND tick borne disease | 29 |
| 28 September 2018 | Scopus | quantitative modelling of the distribution dynamic of animals ticks AND tick borne disease | 183 |
| 28 September 2018 | Pubmed | quantitative modelling of the distribution dynamic of animals ticks AND tick borne disease | 63 |
| 28 September 2018 | Scopus | animals ticks and tick-borne disease spread risk modelling | 543 |
| 28 September 2018 | Pubmed | animals ticks and tick-borne disease spread risk modelling | 217 |
| 15 January 2021 | Scopus | ((modelling or modeling or models) and (animals and ticks) and (tick and borne and diseases) and (distribution or spread) and dynamic) | 64 |
| 15 January 2021 | Pubmed | ((modelling or modeling or models) and (animals and ticks) and (tick and borne and diseases) and (distribution or spread) and dynamic) | 36 |
| All results for Scopus | 2054 | ||
| All results for Pubmed | 918 | ||
| Overall results | 2972 | ||
Appendix C
| Models | References | Accuracy |
| Bayesian hierarchical model | [102] | Useful |
| Classification and regression tree (CART) | [17,91] | Highly accurate |
| [17,33,71,77] | Useful | |
| Ecological niche factor analysis | [39] | Highly accurate |
| [39] | Useful | |
| Environmental niche model (ENM) | [75,93] | Highly accurate |
| Generalized linear model (GLM) | [17,38,53,91] | Highly accurate |
| [17,33,59,63,71,83,99,108,109] | Useful | |
| Linear discriminant analysis (LDA) | [91] | Highly accurate |
| [17] | Useful | |
| Maximum entropy (MaxEnt) | [17,20,21,43,44,46,50,84,88,94,95,103,107] | Highly accurate |
| [17,30,33,35,40,44,49,50,58,64,70,71] | Useful | |
| [44] | Poorly accurate | |
| Multi-criteria decision analysis (MCDA) | [12] | Useful |
| Specie distribution modeling (SDM) | [17,41] | Useful |
| [17] | Poorly accurate | |
| Survival model | [76] | Useful |
References
- Rajput, Z.I.; Hu, S.; Chen, W.; Arijo, A.G.; Xiao, C. Importance of ticks and their chemical and immunological control in livestock. J. Zhejiang Univ. Sci. B 2006, 7, 912–921. [Google Scholar] [CrossRef]
- Kivaria, F.M. Estimated direct economic costs associated with tick-borne diseases on cattle in Tanzania. Trop. Anim. Health Prod. 2006, 38, 291–299. [Google Scholar] [CrossRef] [PubMed]
- Jongejan, F. Integrated Control of Ticks and Tick-Borne Diseases. Parassitologia 1999, 41 (Suppl. 1), 57–58. [Google Scholar] [CrossRef]
- Madder, M.; Thys, E.; Geysen, D.; Baudoux, C.; Horak, I. Boophilus microplus ticks found in West Africa. Exp. Appl. Acarol. 2007, 43, 233–234. [Google Scholar] [CrossRef]
- Madder, M.; Adehan, S.; De Deken, R.; Adehan, R.; Lokossou, R. New foci of Rhipicephalus microplus in West Africa. Exp. Appl. Acarol. 2012, 56, 385–390. [Google Scholar] [CrossRef] [Green Version]
- Robinson, S.J.; Neitzel, D.F.; Moen, R.A.; Craft, M.E.; Hamilton, K.E.; Johnson, L.B.; Mulla, D.J.; Munderloh, U.G.; Redig, P.T.; Smith, K.E.; et al. Disease Risk in a Dynamic Environment: The Spread of Tick-Borne Pathogens in Minnesota, USA. EcoHealth 2015, 12, 152–163. [Google Scholar] [CrossRef] [PubMed] [Green Version]
- Garner, M.; Dubé, C.; AStevenson, M.; Sanson, R.; Estrada, C.; Griffin, J. Evaluating alternative approaches to managing animal disease outbreaks—The role of modelling in policy formulation. Vet. Ital. 2007, 43, 285–298. [Google Scholar] [PubMed]
- Singer, A.; Salman, M.; Thulke, H.-H. Reviewing model application to support animal health decision making. Prev. Vet. Med. 2011, 99, 60–67. [Google Scholar] [CrossRef] [PubMed]
- Taylor, N. Review of the use of models in informing disease control policy development and adjustment. DEFRA UK 2003, 26. [Google Scholar]
- Requena-García, F.; Cabrero-Sañudo, F.; Olmeda-García, S.; González, J.; Valcárcel, F. Influence of environmental temperature and humidity on questing ticks in central Spain. Exp. Appl. Acarol. 2017, 71, 277–290. [Google Scholar] [CrossRef]
- Estrada-Peña, A. Climate, niche, ticks, and models: What they are and how we should interpret them. Parasitol Res. 2008, 103, S87–S95. [Google Scholar] [CrossRef]
- Vial, L.; Ducheyne, E.; Filatov, S.; Gerilovych, A.; McVey, D.S.; Sindryakova, I. Spatial multi-criteria decision analysis for modelling suitable habitats of Ornithodoros soft ticks in the Western Palearctic region. Vet. Parasitol. 2018, 249, 2–16. [Google Scholar] [CrossRef]
- Elith, J.; Leathwick, J.R. Species Distribution Models: Ecological Explanation and Prediction Across Space and Time. Annu. Rev. Ecol. Evol. Syst. 2009, 40, 677–697. [Google Scholar] [CrossRef]
- Jacob, S.S.; Sengupta, P.P.; Paramanandham, K.; Suresh, K.P.; Chamuah, J.K.; Rudramurthy, G.R.; Roy, P. Bovine babesiosis: An insight into the global perspective on the disease distribution by systematic review and meta-analysis. Vet. Parasitol. 2020, 283, 109136. [Google Scholar] [CrossRef]
- Rashid, M.; Rashid, M.I.; Akbar, H.; Ahmad, L.; Hassan, M.A.; Ashraf, K.; Saeed, K.; Gharbi, M. A systematic review on modelling approaches for economic losses studies caused by parasites and their associated diseases in cattle. Parasitology 2019, 146, 129–141. [Google Scholar] [CrossRef]
- Bermúdez, S.E.; Castro, A.M.; Trejos, D.; García, G.G.; Gabster, A.; Miranda, R.J.; Zaldívar, Y.; Paternina, L.E. Distribution of Spotted Fever Group Rickettsiae in Hard Ticks (Ixodida: Ixodidae) from Panamanian Urban and Rural Environments (2007–2013). EcoHealth 2016, 13, 274–284. [Google Scholar] [CrossRef]
- Clarke-Crespo, E.; Moreno-Arzate, C.N.; López-González, C.A. Ecological Niche Models of Four Hard Tick Genera (Ixodidae) in Mexico. Animals 2020, 10, 649. [Google Scholar] [CrossRef] [PubMed] [Green Version]
- Estrada-Peña, A. Climate change decreases habitat suitability for some tick species (Acari: Ixodidae) in South Africa. Onderstepoort J. Vet. Res. 2003, 70, 79–93. [Google Scholar] [PubMed]
- Estrada-Peña, A.; de la Fuente, J.; Cabezas-Cruz, A. A comparison of the performance of regression models of Amblyomma americanum (L.) (Ixodidae) using life cycle or landscape data from administrative divisions. Ticks Tick-Borne Dis. 2016, 7, 624–630. [Google Scholar] [CrossRef] [PubMed] [Green Version]
- Estrada-Peña, A.; Tarragona, E.L.; Vesco, U.; Meneghi, D.D.; Mastropaolo, M.; Mangold, A.J.; Guglielmone, A.A.; Nava, S. Divergent environmental preferences and areas of sympatry of tick species in the Amblyomma cajennense complex (Ixodidae). Int. J. Parasitol. 2014, 44, 1081–1089. [Google Scholar] [CrossRef]
- Estrada-Peña, A.; Horak, I.G.; Petney, T. Climate changes and suitability for the ticks Amblyomma hebraeum and Amblyomma variegatum (Ixodidae) in Zimbabwe (1974–1999). Vet. Parasitol. 2008, 151, 256–267. [Google Scholar] [CrossRef] [Green Version]
- Ferrell, A.M.; Brinkerhoff, R.J.; Bernal, J.; Bermúdez, S.E. Ticks and tick-borne pathogens of dogs along an elevational and land-use gradient in Chiriquí province, Panamá. Exp. Appl. Acarol. 2017, 71, 371–385. [Google Scholar] [CrossRef]
- Gaff, H.D. Preliminary analysis of an agent-based model for a tick-borne disease. Math. Biosci. Eng. 2011, 8, 463–473. [Google Scholar] [CrossRef]
- Gaff, H.D.; Gross, L.J. Modeling Tick-Borne Disease: A Metapopulation Model. Bull. Math. Biol. 2007, 69, 265–288. [Google Scholar] [CrossRef]
- Kaizer, A.M.; Foré, S.A.; Kim, H.-J.; York, E.C. Modeling the biotic and abiotic factors that describe the number of active off-host Amblyomma americanum larvae. J Vector Ecol. 2015, 40, 1–10. [Google Scholar] [CrossRef]
- Lynen, G.; Zeman, P.; Bakuname, C.; Di Giulio, G.; Mtui, P.; Sanka, P.; Jongejan, F. Cattle ticks of the genera Rhipicephalus and Amblyomma of economic importance in Tanzania: Distribution assessed with GIS based on an extensive field survey. Exp. Appl. Acarol. 2007, 43, 303–319. [Google Scholar] [CrossRef] [PubMed]
- Miguel, E.; Boulinier, T.; de Garine-Wichatitsky, M.; Caron, A.; Fritz, H.; Grosbois, V. Characterising African tick communities at a wild-domestic interface using repeated sampling protocols and models. Acta Trop. 2014, 138, 5–14. [Google Scholar] [CrossRef] [Green Version]
- Oliveira, S.V.D.; Romero-Alvarez, D.; Martins, T.F.; Santos, J.P.D.; Labruna, M.B.; Gazeta, G.S.; Escobar, L.E.; Gurgel-Gonçalves, R. Amblyomma ticks and future climate: Range contraction due to climate warming. Acta Trop. 2017, 176, 340–348. [Google Scholar] [CrossRef]
- Polo, G.; Acosta, C.M.; Labruna, M.B.; Ferreira, F.; Brockmann, D. Hosts mobility and spatial spread of Rickettsia rickettsii. PLoS Comput. Biol. 2018, 14, e1006636. [Google Scholar] [CrossRef] [PubMed]
- Raghavan, R.K.; Goodin, D.G.; Hanzlicek, G.A.; Zolnerowich, G.; Dryden, M.W.; Anderson, G.A.; Ganta, R.R. Maximum entropy-based ecological niche model and bio-climatic determinants of lone star tick (Amblyomma americanum) niche. Vector Borne Zoonotic Dis. 2016, 16, 205–211. [Google Scholar] [CrossRef] [PubMed] [Green Version]
- Sagurova, I.; Ludwig, A.; Ogden, N.H.; Pelcat, Y.; Dueymes, G.; Gachon, P. Predicted Northward Expansion of the Geographic Range of the Tick Vector Amblyomma americanum in North America under Future Climate Conditions. Environ. Health Perspect. 2019, 127, 107014. [Google Scholar] [CrossRef] [Green Version]
- Simpson, D.T.; Teague, M.S.; Weeks, J.K.; Kaup, B.Z.; Kerscher, O.; Leu, M. Habitat amount, quality, and fragmentation associated with prevalence of the tick-borne pathogen Ehrlichia chaffeensis and occupancy dynamics of its vector, Amblyomma americanum. Landsc. Ecol. 2019, 34, 2435–2449. [Google Scholar] [CrossRef]
- Springer, Y.P.; Jarnevich, C.S.; Barnett, D.T.; Monaghan, A.J.; Eisen, R.J. Modeling the present and future geographic distribution of the lone star tick, amblyomma americanum (ixodida: Ixodidae), in the continental United States. Am. J. Trop. Med. Hyg. 2015, 93, 875–890. [Google Scholar] [CrossRef] [PubMed]
- Stein, K.J.; Waterman, M.; Waldon, J.L. The effects of vegetation density and habitat disturbance on the spatial distribution of ixodid ticks (acari: Ixodidae). Geospat. Health 2008, 2, 241–252. [Google Scholar] [CrossRef] [Green Version]
- Atkinson, S.F.; Sarkar, S.; Aviña, A.; Schuermann, J.A.; Williamson, P. Modelling spatial concordance between Rocky Mountain spotted fever disease incidence and habitat probability of its vector Dermacentor variabilis (American dog tick). Geospat. Health 2013, 7, 91–100. [Google Scholar] [CrossRef] [Green Version]
- Beugnet, F.; Chalvet-Monfray, K.; Loukos, H. FleaTickRisk: A meteorological model developed to monitor and predict the activity and density of three tick species and the cat flea in Europe. Geospat. Health 2009, 4, 97. [Google Scholar] [CrossRef] [PubMed] [Green Version]
- Boorgula, G.D.Y.; Peterson, A.T.; Foley, D.H.; Ganta, R.R.; Raghavan, R.K. Assessing the current and future potential geographic distribution of the American dog tick, Dermacentor variabilis (Say) (Acari: Ixodidae) in North America. PLoS ONE 2020, 15, e0237191. [Google Scholar] [CrossRef] [PubMed]
- Eisen, L.; Eisen, R.J.; Lane, R.S. Geographical distribution patterns and habitat suitability models for presence of host-seeking ixodid ticks in dense woodlands of Mendocino County, California. J. Med. Entomol. 2006, 43, 415–427. [Google Scholar] [CrossRef]
- Estrada-Peña, A.; Venzal, J.M. Climate niches of tick species in the mediterranean region: Modeling of occurrence data, distributional constraints, and impact of climate change. J. Med. Entomol. 2007, 44, 1130–1138. [Google Scholar] [CrossRef]
- Huercha; Song, R.; Ma, Y.; Hu, Z.; Li, Y.; Li, M.; Wu, L.; Li, C.; Dao, E.; Fan, X.; et al. MaxEnt Modeling of Dermacentor marginatus (Acari: Ixodidae) Distribution in Xinjiang, China. J. Med. Entomol. 2020, 57, 1659–1667. [Google Scholar] [CrossRef]
- Minigan, J.N.; Hager, H.A.; Peregrine, A.S.; Newman, J.A. Current and potential future distribution of the American dog tick (Dermacentor variabilis, Say) in North America. Ticks Tick-Borne Dis. 2018, 9, 354–362. [Google Scholar] [CrossRef] [PubMed]
- Široký, P.; Kubelová, M.; Bednář, M.; Modrý, D.; Hubálek, Z.; Tkadlec, E. The distribution and spreading pattern of Dermacentor reticulatus over its threshold area in the Czech Republic-How much is range of this vector expanding? Vet. Parasitol. 2011, 183, 130–135. [Google Scholar] [CrossRef] [PubMed]
- John, H.K.; Adams, M.L.; Masuoka, P.M.; Flyer-Adams, J.G.; Jiang, J.; Rozmajzl, P.J.; Stromdahl, E.Y.; Richards, A.L. Prevalence, Distribution, and Development of an Ecological Niche Model of Dermacentor variabilis Ticks Positive for Rickettsia montanensis. Vector Borne Zoonotic Dis. 2016, 16, 253–263. [Google Scholar] [CrossRef] [PubMed]
- Williams, H.W.; Cross, D.E.; Crump, H.L.; Drost, C.J.; Thomas, C.J. Climate suitability for European ticks: Assessing species distribution models against null models and projection under AR5 climate. Parasites Vectors 2015, 8. [Google Scholar] [CrossRef] [Green Version]
- Lawrence, K.E.; Summers, S.R.; Heath, A.C.G.; McFadden, A.M.J.; Pulford, D.J.; Tait, A.B.; Pomroy, W.E. Using a rule-based envelope model to predict the expansion of habitat suitability within New Zealand for the tick Haemaphysalis longicornis, with future projections based on two climate change scenarios. Vet. Parasitol. 2017, 243, 226–234. [Google Scholar] [CrossRef]
- Lawrence, K.E.; Summers, S.R.; Heath, A.C.G.; McFadden, A.M.J.; Pulford, D.J.; Pomroy, W.E. Predicting the potential environmental suitability for Theileria orientalis transmission in New Zealand cattle using maximum entropy niche modelling. Vet. Parasitol. 2016, 224, 82–91. [Google Scholar] [CrossRef]
- Raghavan, R.K.; Barker, S.C.; Cobos, M.E.; Barker, D.; Teo, E.J.M.; Foley, D.H.; Nakao, R.; Lawrence, K.; Heath, A.C.G.; Pe-terson, A.T. Potential Spatial Distribution of the Newly Introduced Long-horned Tick, Haemaphysalis longicornis in North America. Sci. Rep. 2019, 9, 498. [Google Scholar] [CrossRef] [PubMed]
- Bosch, J.; Muñoz, M.J.; Martínez, M.; de la Torre, A.; Estrada-Peña, A. Vector-Borne pathogen spread through ticks on migratory birds: A probabilistic spatial risk model for south-western europe. Transboundary Emer Dis. 2013, 60, 403S–415S. [Google Scholar] [CrossRef]
- Deka, M.A. Crimean-Congo Hemorrhagic Fever Geographic and Environmental Risk Assessment in the Balkan and Anatolian Peninsulas. Pap. Appl. Geogr. 2018, 4, 46–71. [Google Scholar] [CrossRef]
- Domşa, C.; Sándor, A.D.; Mihalca, A.D. Climate change and species distribution: Possible scenarios for thermophilic ticks in Romania. Geospat. Health 2016, 11, 151–156. [Google Scholar] [CrossRef]
- Estrada-Peña, A.; Alexander, N.; Wint, G.R.W. Perspectives on modelling the distribution of ticks for large areas: So far so good? Parasites Vectors 2016, 9. [Google Scholar] [CrossRef] [Green Version]
- Estrada-Peña, A.; Sánchez, N.; Estrada-Sánchez, A. An assessment of the distribution and spread of the tick hyalomma marginatum in the western palearctic under different climate scenarios. Vector Borne Zoonotic Dis. 2012, 12, 758–768. [Google Scholar] [CrossRef] [PubMed]
- Brownstein, J.S.; Holford, T.R.; Fish, D. A climate-based model predicts the spatial distribution of the Lyme disease vector Ixodes scapularis in the United States. Environ. Health Perspect. 2003, 111, 1152–1157. [Google Scholar] [CrossRef] [PubMed] [Green Version]
- Ogden, N.H. A dynamic population model to investigate effects of climate on geographic range and seasonality of the tick Ixodes scapularis. Int. J. Parasitol. 2005, 35, 375–389. [Google Scholar] [CrossRef] [PubMed]
- Dunn, J.M.; Davis, S.; Stacey, A.; Diuk-Wasser, M.A. A simple model for the establishment of tick-borne pathogens of Ixodes scapularis: A global sensitivity analysis of R0. J. Ther. Biol. 2013, 335, 213–221. [Google Scholar] [CrossRef] [PubMed] [Green Version]
- Cheng, A.; Chen, D.; Woodstock, K.; Ogden, N.H.; Wu, X.; Wu, J. Analyzing the potential risk of climate change on lyme disease in Eastern Ontario, Canada using time series remotely sensed temperature data and tick population modelling. Remote Sens. 2017, 9, 609. [Google Scholar] [CrossRef] [Green Version]
- Bolzoni, L.; Rosà, R.; Cagnacci, F.; Rizzoli, A. Effect of deer density on tick infestation of rodents and the hazard of tick-borne encephalitis. II: Population and infection models. Int. J. Parasitol. 2012, 42, 373–381. [Google Scholar] [CrossRef] [PubMed] [Green Version]
- Porretta, D.; Mastrantonio, V.; Amendolia, S.; Gaiarsa, S.; Epis, S.; Genchi, C.; Bandi, C.; Otranto, D.; Urbanelli, S. Effects of global changes on the climatic niche of the tick Ixodes ricinus inferred by species distribution modelling. Parasites Vectors 2013, 6. [Google Scholar] [CrossRef] [PubMed] [Green Version]
- Estrada-Peña, A. Effects of habitat suitability and landscape patterns on tick (Acarina) metapopulation processes. Landsc. Ecol. 2005, 20, 529–541. [Google Scholar] [CrossRef]
- Rosà, R.; Pugliese, A. Effects of tick population dynamics and host densities on the persistence of tick-borne infections. Math Biosci. 2007, 208, 216–240. [Google Scholar] [CrossRef]
- Boehnke, D.; Brugger, K.; Pfäffle, M.; Sebastian, P.; Norra, S.; Petney, T.; Oehme, R.; Littwin, N.; Lebl, K.; Raith, J.; et al. Estimating Ixodes ricinus densities on the landscape scale. Int. J. Health Geogr. 2015, 14. [Google Scholar] [CrossRef] [PubMed] [Green Version]
- Ruiz-Fons, F.; Fernández-de-Mera, I.G.; Acevedo, P.; Gortázar, C.; de la Fuente, J. Factors driving the abundance of Ixodes ricinus ticks and the prevalence of zoonotic I. ricinus-borne pathogens in natural foci. Appl. Environ. Microbiol. 2012, 78, 2669–2676. [Google Scholar] [CrossRef] [PubMed] [Green Version]
- Diuk-Wasser, M.A.; Vourc’h, G.; Cislo, P.; Hoen, A.G.; Melton, F.; Hamer, S.A.; Rowland, M.; Cortinas, R.; Hickling, G.J.; Tsao, J.I.; et al. Field and climate-based model for predicting the density of host-seeking nymphal Ixodes scapularis, an important vector of tick-borne disease agents in the eastern United States. Glob. Ecol. Biogeogr. 2010, 19, 504–514. [Google Scholar] [CrossRef]
- Johnson, T.L.; Bjork, J.K.H.; Neitzel, D.F.; Dorr, F.M.; Schiffman, E.K.; Eisen, R.J. Habitat suitability model for the distribution of Ixodes scapularis (acari: Ixodidae) in Minnesota. J. Med. Entomol. 2016, 53, 598–606. [Google Scholar] [CrossRef] [PubMed] [Green Version]
- Estrada-Peña, A.; de la Fuente, J. Host distribution does not limit the range of the tick ixodes ricinus but impacts the circulation of transmitted pathogens. Front. Cell Infect. Microbiol. 2017, 7. [Google Scholar] [CrossRef]
- Li, S.; Vanwambeke, S.O.; Licoppe, A.M.; Speybroeck, N. Impacts of deer management practices on the spatial dynamics of the tick Ixodes ricinus: A scenario analysis. Ecol. Model. 2014, 276, 1–13. [Google Scholar] [CrossRef]
- Hoch, T.; Monnet, Y.; Agoulon, A. Influence of host migration between woodland and pasture on the population dynamics of the tick Ixodes ricinus: A modelling approach. Ecol. Model. 2010, 221, 1798–1806. [Google Scholar] [CrossRef]
- Cat, J.; Beugnet, F.; Hoch, T.; Jongejan, F.; Prangé, A.; Chalvet-Monfray, K. Influence of the spatial heterogeneity in tick abundance in the modeling of the seasonal activity of Ixodes ricinus nymphs in Western Europe. Exp. Appl. Acarol. 2017, 71, 115–130. [Google Scholar] [CrossRef]
- Ogden, N.H.; Trudel, L.; Artsob, H.; Barker, I.K.; Beauchamp, G.; Charron, D.F.; Drebot, M.A.; Galloway, T.D.; O’handley, R.; Thompson, R.A.; et al. Ixodes scapularis Ticks Collected by Passive Surveillance in Canada: Analysis of Geographic Distribution and Infection with Lyme Borreliosis Agent Borrelia burgdorferi. J. Med. Entomol. 2006, 43, 600–609. [Google Scholar] [CrossRef] [Green Version]
- Estrada-Peña, A.; Estrada-Sánchez, A.; Estrada-Sánchez, D. Methodological caveats in the environmental modelling and projections of climate niche for ticks, with examples for Ixodes ricinus (Ixodidae). Vet. Parasitol. 2015, 208, 14–25. [Google Scholar] [CrossRef]
- Hahn, M.B.; Jarnevich, C.S.; Monaghan, A.J.; Eisen, R.J. Modeling the Geographic Distribution of Ixodes scapularis and Ixodes pacificus (Acari: Ixodidae) in the Contiguous United States. J. Med. Entomol. 2016, 53, 1176–1191. [Google Scholar] [CrossRef] [Green Version]
- Hoch, T.; Goebel, J.; Agoulon, A.; Malandrin, L. Modelling bovine babesiosis: A tool to simulate scenarios for pathogen spread and to test control measures for the disease. Prev. Vet. Med. 2012, 106, 136–142. [Google Scholar] [CrossRef]
- Li, S.; Gilbert, L.; Harrison, P.A.; Rounsevell, M.D.A. Modelling the seasonality of Lyme disease risk and the potential impacts of a warming climate within the heterogeneous landscapes of Scotland. J. R. Soc. Interface 2016, 13. [Google Scholar] [CrossRef] [Green Version]
- Rousseau, R.; McGrath, G.; McMahon, B.J.; Vanwambeke, S.O. Multi-criteria Decision Analysis to Model Ixodes ricinus Habitat Suitability. EcoHealth 2017, 14, 591–602. [Google Scholar] [CrossRef]
- Boeckmann, M.; Joyner, T.A. Old health risks in new places? An ecological niche model for I. ricinus tick distribution in Europe under a changing climate. Health Place 2014, 30, 70–77. [Google Scholar] [CrossRef] [PubMed]
- Leighton, P.A.; Koffi, J.K.; Pelcat, Y.; Lindsay, L.R.; Ogden, N.H. Predicting the speed of tick invasion: An empirical model of range expansion for the Lyme disease vector Ixodes scapularis in Canada. J. Appl. Ecol. 2012, 49, 457–464. [Google Scholar] [CrossRef]
- Alfredsson, M.; Olafsson, E.; Eydal, M.; Unnsteinsdottir, E.R.; Hansford, K.; Wint, W.; Alexander, N.; Medlock, J.M. Surveillance of Ixodes ricinus ticks (Acari: Ixodidae) in Iceland. Parasites Vectors 2017, 10. [Google Scholar] [CrossRef] [PubMed] [Green Version]
- Qviller, L.; Viljugrein, H.; Loe, L.E.; Meisingset, E.L.; Mysterud, A. The influence of red deer space use on the distribution of Ixodes ricinus ticks in the landscape. Parasites Vectors 2016, 9. [Google Scholar] [CrossRef] [Green Version]
- Tomkins, J.L.; Aungier, J.; Hazel, W.; Gilbert, L. Towards an evolutionary understanding of questing behaviour in the tick Ixodes ricinus. PLoS ONE 2014, 9. [Google Scholar] [CrossRef] [Green Version]
- Barrios, J.M.; Verstraeten, W.W.; Maes, P.; Aerts, J.-M.; Farifteh, J.; Coppin, P. Using the gravity model to estimate the spatial spread of vector-borne diseases. Int. J. Environ. Res. Public Health 2012, 9, 4346–4364. [Google Scholar] [CrossRef]
- Ostfeld, R.S.; Canham, C.D.; Oggenfuss, K.; Winchcombe, R.J.; Keesing, F. Climate, Deer, Rodents, and Acorns as Determinants of Variation in Lyme-Disease Risk. Dobson A, editor. PLoS Biol. 2006, 4, e145. [Google Scholar] [CrossRef] [PubMed]
- Wu, X.; Duvvuri, V.R.; Lou, Y.; Ogden, N.H.; Pelcat, Y.; Wu, J. Developing a temperature-driven map of the basic reproductive number of the emerging tick vector of Lyme disease Ixodes scapularis in Canada. J. Theor. Biol. 2013, 319, 50–61. [Google Scholar] [CrossRef]
- Lieske, D.J.; Lloyd, V.K. Combining public participatory surveillance and occupancy modelling to predict the distributional response of Ixodes scapularis to climate change. Ticks Tick-Borne Dis. 2018, 9, 695–706. [Google Scholar] [CrossRef]
- Zanet, S.; Ferroglio, E.; Battisti, E.; Tizzani, P. Ecological niche modeling of Babesia sp infection in wildlife experimentally evaluated in questing Ixodes ricinus. Geospat. Health 2020, 15. [Google Scholar] [CrossRef] [PubMed]
- Li, S.; Gilbert, L.; Vanwambeke, S.O.; Yu, J.; Purse, B.V.; Harrison, P.A. Lyme Disease Risks in Europe under Multiple Uncertain Drivers of Change. Environ. Health Perspect. 2019, 127, 67010. [Google Scholar] [CrossRef] [PubMed]
- Nguyen, A.; Mahaffy, J.; Vaidya, N.K. Modeling transmission dynamics of lyme disease: Multiple vectors, seasonality, and vector mobility. Infect. Dis. Model. 2019, 4, 28–43. [Google Scholar] [CrossRef] [PubMed]
- Kjær, L.J.; Soleng, A.; Edgar, K.S.; Lindstedt, H.E.H.; Paulsen, K.M.; Andreassen, Å.K.; Korslund, L.; Kjelland, V.; Slettan, A.; Stuen, S.; et al. Predicting and mapping human risk of exposure to Ixodes ricinus nymphs using climatic and environmental data, Denmark, Norway and Sweden, 2016. Euro Surveill. 2019, 24. [Google Scholar] [CrossRef] [PubMed] [Green Version]
- Slatculescu, A.M.; Clow, K.M.; McKay, R.; Talbot, B.; Logan, J.J.; Thickstun, C.R.; Jardine, C.M.; Ogden, N.H.; Knudby, A.J.; Kulkarni, M.A. Species distribution models for the eastern blacklegged tick, Ixodes scapularis, and the Lyme disease pathogen, Borrelia burgdorferi, in Ontario, Canada. PLoS ONE 2020, 15, e0238126. [Google Scholar] [CrossRef]
- Beugnet, F.; Kolasinski, M.; Michelangeli, P.-A.; Vienne, J.; Loukos, H. Mathematical modelling of the impact of climatic conditions in France on Rhipicephalus sanguineus tick activity and density since 1960. Geospat. Health 2011, 5, 255–263. [Google Scholar] [CrossRef] [Green Version]
- Corson, M.S.; Teel, P.D.; Grant, W.E. Microclimate influence in a physiological model of cattle-fever tick (Boophilus spp.) population dynamics. Ecol. Model. 2004, 180, 487–514. [Google Scholar] [CrossRef]
- De Clercq, E.M.; Leta, S.; Estrada-Peña, A.; Madder, M.; Adehan, S.; Vanwambeke, S.O. Species distribution modelling for Rhipicephalus microplus (Acari: Ixodidae) in Benin, West Africa: Comparing datasets and modelling algorithms. Prev. Vet. Med. 2015, 118, 8–21. [Google Scholar] [CrossRef] [Green Version]
- De Clercq, E.M.; Estrada-Peña, A.; Adehan, S.; Madder, M.; Vanwambeke, S.O. An update on distribution models for Rhipicephalus microplus in West Africa. Geospat. Health 2013, 8, 301–308. [Google Scholar] [CrossRef] [PubMed] [Green Version]
- Estrada-Peña, A.; Sánchez Acedo, C.; Quílez, J.; Del Cacho, E. A retrospective study of climatic suitability for the tick Rhipicephalus (Boophilus) microplus in the Americas. Glob. Ecol. Biogeogr. 2005, 14, 565–573. [Google Scholar] [CrossRef]
- Hadgu, M.; Menghistu, H.T.; Girma, A.; Abrha, H.; Hagos, H. Modeling the potential climate change- induced impacts on future genus Rhipicephalus (Acari: Ixodidae) tick distribution in semi-arid areas of Raya Azebo district, Northern Ethiopia. J. Ecol. Environ. 2019, 43, 43. [Google Scholar] [CrossRef] [Green Version]
- Leta, S.; De Clercq, E.M.; Madder, M. High-resolution predictive mapping for Rhipicephalus appendiculatus (Acari: Ixodidae) in the Horn of Africa. Exp. Appl. Acarol. 2013, 60, 531–542. [Google Scholar] [CrossRef]
- Lynen, G.; Zeman, P.; Bakuname, C.; Di Giulio, G.; Mtui, P.; Sanka, P.; Jongejan, F. Shifts in the distributional ranges of Boophilus ticks in Tanzania: Evidence that a parapatric boundary between Boophilus microplus and B. decoloratus follows climate gradients. Exp. Appl. Acarol. 2008, 44, 147–164. [Google Scholar] [CrossRef]
- Olwoch, J.M.; Reyers, B.; Engelbrecht, F.A.; Erasmus, B.F.N. Climate change and the tick-borne disease, Theileriosis (East Coast fever) in sub-Saharan Africa. J. Arid Environ. 2008, 72, 108–120. [Google Scholar] [CrossRef]
- Olwoch, J.M.; Van Jaarsveld, A.S.; Scholtz, C.H.; Horak, I.G. Climate change and the genus rhipicephalus (Acari: Ixodidae) in Africa. Onderstepoort J. Vet. Res. 2007, 74, 45–72. [Google Scholar] [CrossRef] [Green Version]
- Sungirai, M.; Moyo, D.Z.; De Clercq, P.; Madder, M.; Vanwambeke, S.O.; De Clercq, E.M. Modelling the distribution of Rhipicephalus microplus and R. decoloratus in Zimbabwe. Veterinary Parasitology. Reg. Stud. Rep. 2018, 14, 41–49. [Google Scholar] [CrossRef] [Green Version]
- Sutherst, R.W.; Bourne, A.S. Modelling non-equilibrium distributions of invasive species: A tale of two modelling paradigms. Biol. Invasions 2009, 11, 1231–1237. [Google Scholar] [CrossRef]
- Liu, Y.; Watson, S.C.; Gettings, J.R.; Lund, R.B.; Nordone, S.K.; Yabsley, M.J.; McMahan, C.S. A Bayesian spatio-temporal model for forecasting Anaplasma species seroprevalence in domestic dogs within the contiguous United States. PLoS ONE 2017, 12. [Google Scholar] [CrossRef] [Green Version]
- Wimberly, M.C.; Baer, A.D.; Yabsley, M.J. Enhanced spatial models for predicting the geographic distributions of tick-borne pathogens. Int. J. Health Geogr. 2008, 7, 15. [Google Scholar] [CrossRef] [Green Version]
- Kouam, M.K.; Masuoka, P.M.; Kantzoura, V.; Theodoropoulos, G. Geographic distribution modeling and spatial cluster analysis for equine piroplasms in Greece. Infec. Genet. Evol. 2010, 10, 1013–1018. [Google Scholar] [CrossRef] [PubMed]
- Delgado, J.D.; Abreu-Yanes, E.; Abreu-Acosta, N.; Flor, M.D.; Foronda, P. Vertebrate ticks distribution and their role as vectors in relation to road edges and underpasses. Vector Borne Zoonotic Dis. 2017, 17, 376–383. [Google Scholar] [CrossRef] [PubMed]
- Watson, S.C.; Liu, Y.; Lund, R.B.; Gettings, J.R.; Nordone, S.K.; McMahan, C.S.; Yabsley, M.J. A Bayesian spatio-temporal model for forecasting the prevalence of antibodies to Borrelia burgdorferi, causative agent of Lyme disease, in domestic dogs within the contiguous United States. PLoS ONE 2017, 12. [Google Scholar] [CrossRef] [PubMed] [Green Version]
- Machado, G.; Korennoy, F.; Alvarez, J.; Picasso-Risso, C.; Perez, A.; VanderWaal, K. Mapping changes in the spatiotemporal distribution of lumpy skin disease virus. Transbound. Emerg. Dis. 2019, 66, 2045–2057. [Google Scholar] [CrossRef] [PubMed]
- Nogareda, C.; Jubert, A.; Kantzoura, V.; Kouam, M.K.; Feidas, H.; Theodoropoulos, G. Geographical distribution modelling for Neospora caninum and Coxiella burnetii infections in dairy cattle farms in northeastern Spain. Epidemiol. Infect. 2013, 141, 81–90. [Google Scholar] [CrossRef] [PubMed] [Green Version]
- Raghavan, R.K.; Almes, K.; Goodin, D.G.; Harrington, J.A., Jr.; Stackhouse, P.W., Jr. Spatially heterogeneous land cover/land use and climatic risk factors of tick-borne feline cytauxzoonosis. Vector Borne Zoonotic Dis. 2014, 14, 486–495. [Google Scholar] [CrossRef] [Green Version]
- Wimberly, M.C.; Yabsley, M.J.; Baer, A.D.; Dugan, V.G.; Davidson, W.R. Spatial heterogeneity of climate and land-cover constraints on distributions of tick-borne pathogens. Glob. Ecol. Biogeogr. 2008, 17, 189–202. [Google Scholar] [CrossRef]
- Nah, K.; Magpantay, F.M.G.; Bede-Fazekas, Á.; Röst, G.; Trájer, A.J.; Wu, X.; Zhang, X.; Wu, J. Assessing systemic and non-systemic transmission risk of tick-borne encephalitis virus in Hungary. PLoS ONE 2019, 14, e0217206. [Google Scholar] [CrossRef]
- Mostafavi, E.; Chinikar, S.; Bokaei, S.; Haghdoost, A. Temporal modeling of Crimean-Congo hemorrhagic fever in eastern Iran. Int. J. Infect. Dis. 2013, 17, e524–e528. [Google Scholar] [CrossRef] [Green Version]
- Liu, Y.; Lund, R.B.; Nordone, S.K.; Yabsley, M.J.; McMahan, C.S. A Bayesian spatio-temporal model for forecasting the prevalence of antibodies to Ehrlichia species in domestic dogs within the contiguous United States. Parasites Vectors 2017, 10. [Google Scholar] [CrossRef] [Green Version]
- Gilioli, G.; Groppi, M.; Vesperoni, M.P.; Baumgärtner, J.; Gutierrez, A.P. An epidemiological model of East Coast Fever in African livestock. Ecol. Model. 2009, 220, 1652–1662. [Google Scholar] [CrossRef]
- Liu, K.; Lou, Y.; Wu, J. Analysis of an age structured model for tick populations subject to seasonal effects. J. Differ. Equ. 2017, 263, 2078–2112. [Google Scholar] [CrossRef]
- Dobson, A.D.M.; Auld, S.K.J.R. Epidemiological implications of host biodiversity and vector biology: Key insights from simple models. Am. Nat. 2016, 187, 405–422. [Google Scholar] [CrossRef] [PubMed] [Green Version]
- Cobbold, C.A.; Teng, J.; Muldowney, J.S. The influence of host competition and predation on tick densities and management implications. Theor. Ecol. 2015, 8, 349–368. [Google Scholar] [CrossRef]
- Guisan, A.; Edwards, T.C.; Hastie, T. Generalized linear and generalized additive models in studies of species distributions: Setting the scene. Ecol. Model. 2002, 157, 89–100. [Google Scholar] [CrossRef] [Green Version]
- Phillips, S.J.; Dudík, M. Modeling of species distributions with Maxent: New extensions and a comprehensive evaluation. Ecography 2008, 31, 161–175. [Google Scholar] [CrossRef]
- Phillips, S.J.; Anderson, R.P.; Schapire, R.E. Maximum entropy modeling of species geographic distributions. Ecol. Model. 2006, 190, 231–259. [Google Scholar] [CrossRef] [Green Version]
- Phillips, S.J.; Dudík, M.; Schapire, R.E. A Maximum Entropy Approach to Species Distribution Modeling; ACM: New York, NY, USA, 2004; p. 83. [Google Scholar]
- Baldwin, R.A. Use of maximum entropy modeling in wildlife research. Entropy 2009, 11, 854–866. [Google Scholar] [CrossRef]
- Baldwin, R.A.; Bender, L.C. Den-Site Characteristics of Black Bears in Rocky Mountain National Park, Colorado. J. Wildl. Manag. 2008, 72, 1717–1724. [Google Scholar] [CrossRef]
- Hoenes, B.D.; Bender, L.C. Relative habitat-and browse-use of native desert mule deer and exotic oryx in the greater San Andres Mountains, New Mexico. Hum. Wildl. Interact. 2010, 4, 12–24. [Google Scholar]
- Yost, A.C.; Petersen, S.L.; Gregg, M.; Miller, R. Predictive modeling and mapping sage grouse (Centrocercus urophasianus) nesting habitat using Maximum Entropy and a long-term dataset from Southern Oregon. Ecol. Inform. 2008, 3, 375–386. [Google Scholar] [CrossRef]
- Cheng, Z.; Nakatsugawa, M.; Hu, C.; Robertson, S.P.; Hui, X.; Moore, J.A.; Bowers, M.R.; Kiess, A.P.; Page, B.R.; Burns, L.; et al. Evaluation of classification and regression tree (CART) model in weight loss prediction following head and neck cancer radiation therapy. Adv. Radiat. Oncol. 2018, 3, 346–355. [Google Scholar] [CrossRef] [Green Version]
- Batista, G.E.A.P.A.; Monard, M.C. An analysis of four missing data treatment methods for supervised learning. Appl. Artif. Intell. 2003, 17, 519–533. [Google Scholar] [CrossRef]
- Norman, R.; Bowers, R.G.; Begon, M.; Hudson, P.J. Persistence of Tick-borne Virus in the Presence of Multiple Host Species: Tick Reservoirs and Parasite Mediated Competition. J. Theor. Biol. 1999, 200, 111–118. [Google Scholar] [CrossRef] [Green Version]
- Pugliese, A.; Rosà, R. Effect of host populations on the intensity of ticks and the prevalence of tick-borne pathogens: How to interpret the results of deer exclosure experiments. Parasitology 2008, 135, 1531. [Google Scholar] [CrossRef] [PubMed]
- Maliyoni, M.; Chirove, F.; Gaff, H.D.; Govinder, K.S. A Stochastic Tick-Borne Disease Model: Exploring the Probability of Pathogen Persistence. Bull. Math. Biol. 2017, 79, 1999–2021. [Google Scholar] [CrossRef]
- Hussain, S.; Hussain, A.; Ho, J.; Li, J.; George, D.; Rehman, A.; Zeb, J.; Sparagano, O. An Epidemiological Survey Regarding Ticks and Tick-Borne Diseases among Livestock Owners in Punjab, Pakistan: A One Health Context. Pathogens 2021, 10, 361. [Google Scholar] [CrossRef]
- Kardjadj, M.; Diallo, A.; Lancelot, R. (Eds.) Transboundary Animal Diseases in Sahelian Africa and Connected Regions; Springer International Publishing: Cham, Switzerland, 2019. [Google Scholar] [CrossRef]
- Silatsa, B.A.; Simo, G.; Githaka, N.; Mwaura, S.; Kamga, R.M.; Oumarou, F.; Keambou, C.; Bishop, R.P.; Djikeng, A.; Kuiate, J.-R.; et al. A comprehensive survey of the prevalence and spatial distribution of ticks infesting cattle in different agro-ecological zones of Cameroon. Parasites Vectors 2019, 12, 489. [Google Scholar] [CrossRef] [PubMed] [Green Version]
- Gustafson, R.; Jaenson, T.G.T.; Gardulf, A.; Mejlon, H.; Svenungsson, B. Prevalence of Borrelia burgdorferi sensu lato Infection in Ixodes ricinus in Sweden. Scand. J. Infect. Dis. 1995, 27, 597–601. [Google Scholar] [CrossRef] [PubMed]
- TaLleklint, L.; Jaenson, T.G.T. Relationship Between Ixodes ricinus Density and Prevalence of Infection with Borrelia-Like Spirochetes and Density of Infected Ticks. J. Med. Entomol. 1996, 33, 805–811. [Google Scholar] [CrossRef]
- Mejlon, H.A.; Jaenson, T.G. Seasonal prevalence of Borrelia burgdorferi in Ixodes ricinus in different vegetation types in Sweden. Scand. J. Infect. Dis. 1993, 25, 449–456. [Google Scholar] [CrossRef]
- Randolph, S.E.; Rogers, D.J. A generic population model for the African tick Rhipicephalus appendiculatus. Parasitology 1997, 115, 265–279. [Google Scholar] [CrossRef] [Green Version]
- Perry, B.D.; Kruska, R.; Lessard, P.; Norval, R.A.I.; Kundert, K. Estimating the distribution and abundance of Rhipicephalus appendiculatus in Africa. Prev. Vet. Med. 1991, 11, 261–268. [Google Scholar] [CrossRef]
- Adakal, H.; Biguezoton, A.; Zoungrana, S.; Courtin, F.; De Clercq, E.M.; Madder, M. Alarming spread of the Asian cattle tick Rhipicephalus microplus in West Africa—another three countries are affected: Burkina Faso, Mali and Togo. Exp. Appl. Acarol. 2013, 61, 383–386. [Google Scholar] [CrossRef] [PubMed]
- Tuppurainen, E.S.M.; Oura, C.A.L. Review: Lumpy Skin Disease: An Emerging Threat to Europe, the Middle East and Asia: Emerging Lumpy Skin Disease. Transbound. Emerg. Dis. 2012, 59, 40–48. [Google Scholar] [CrossRef]
- Walker, A.; Bouattour, A.; Camicas, J.-L. Ticks of Domestic Animals in Africa: A Guide to Identification of Species; Bioscience Reports: Edinburgh, UK, 2003. [Google Scholar]
- Deem, S.L.; Perry, B.D.; Katende, J.M.; McDermott, J.J.; Mahan, S.M.; Maloo, S.H.; Morzaria, S.P.; Musoke, A.J.; Rowlands, G.J. Variations in prevalence rates of tick-borne diseases in Zebu cattle by agroecological zone: Implications for East Coast fever immunization. Prev. Vet. Med. 1993, 16, 171–187. [Google Scholar] [CrossRef]
- Perry, B.D. Economic impacts of tick-borne diseases in Africa. Onderstepoort J. Vet. Res. 2009, 76, 49. [Google Scholar] [CrossRef] [Green Version]
- Fielding, A.H.; Bell, J.F. A review of methods for the assessment of prediction errors in conservation presence/absence models. Environ. Conserv. 1997, 24, 38–49. [Google Scholar] [CrossRef]
- Swets, J. Measuring the accuracy of diagnostic systems. Science 1988, 240, 1285–1293. [Google Scholar] [CrossRef] [PubMed] [Green Version]
- Guisan, A.; Graham, C.H.; Elith, J.; Huettmann, F. The NCEAS Species Distribution Modelling Group. Sensitivity of predictive species distribution models to change in grain size. Divers. Distrib. 2007, 13, 332–340. [Google Scholar] [CrossRef]
- Deeks, J.J. Systematic reviews of evaluations of diagnostic and screening tests. BMJ 2001, 323, 157–162. [Google Scholar] [CrossRef] [PubMed]
- Higgins, J.P.T.; Thompson, S.G. Controlling the risk of spurious findings from meta-regression. Stat. Med. 2004, 23, 1663–1682. [Google Scholar] [CrossRef] [PubMed]
- Higgins, J.P.T. Measuring inconsistency in meta-analyses. BMJ 2003, 327, 557–560. [Google Scholar] [CrossRef] [PubMed] [Green Version]
- Field, A.P.; Gillett, R. How to do a meta-analysis. Br. J. Math. Stat. Psychol. 2010, 63, 665–694. [Google Scholar] [CrossRef] [PubMed]
- Borenstein, M.; Higgins, J.P.T. Meta-Analysis and Subgroups. Prev. Sci. 2013, 14, 134–143. [Google Scholar] [CrossRef] [PubMed]


| Category | Model | Objective |
|---|---|---|
| Regression models | Generalized linear models (GLM) | Investigate the levels of tick aggregation at different spatial ranges, determine and disaggregate the drivers of tick density and probability of presence, and provide robust estimates of tick densities between landscape segments. Study the effect of environmental conditions on the prevalence of different stages of ticks and in the epidemiology of the tick-borne disease (TBD). |
| Species distribution modeling | Maximum entropy (MaxEnt) | Explore the limits of the potential distribution by extrapolating the environmental requirements of ticks. Analyze the possible spatial range of tick species, to explore how climate changes can shape the distribution of these species. |
| Classification and regression tree (CART) | Review data on tick distribution and prevalence of TBD for a national TBD management approach using the current ecological and epidemiological information on ticks and the related diseases they transmit. | |
| Species distribution modeling (SDM) | Discuss and illustrate the precise boundaries of the present range of ticks based on computational map modeling and demonstrate the way in which local populations of these ticks differ in abundance towards the boundaries of the range. | |
| Ecological niche factor analysis (ENFA) | Measuring the extent to which the requirements of a given species deviate from average conditions and the extent to which the species is selective over the range of environmental conditions available in a country. Develop a rigorous definition of the climatic niche of a set of relevant tick species in a geographical area. |
| Ticks Studied | Country or Continent of Interest | References |
|---|---|---|
| Amblyomma spp. | Africa, Brazil, Central and Southern America and USA. | [16,17,18,19,20,21,22,23,24,25,26,27,28,29,30,31,32,33,34] |
| Dermacentor spp. | Europe, Czech Republic, Mediterranean region, Panama and USA. | [16,17,34,35,36,37,38,39,40,41,42,43,44] |
| Haemaphysalis spp. | Europe, New Zealand and USA. | [38,44,45,46,47] |
| Hyalomma spp. | Europe, Mediterranean region, Romania, South Africa, Spain and Western Palearctic. | [18,39,44,48,49,50,51,52] |
| Ixodes spp. | Belgium, Canada, Europe, France, Germany, Iceland, Ireland, Italy, Netherlands, Norway, Panama, Scotland, Slovakia, Spain, UK, USA and Western Palearctic. | [17,22,36,38,44,51,53,54,55,56,57,58,59,60,61,62,63,64,65,66,67,68,69,70,71,72,73,74,75,76,77,78,79,80,81,82,83,84,85,86,87,88] |
| Ornithodoros spp. | Africa, Asia and Europe. | [12] |
| Rhipicephalus spp. | Africa, America, Republic of Benin, Djibouti, Eritrea, Ethiopia, Europe, France, Mediterranean region, Panama, Romania, Somalia, South Africa, Tanzania, USA, Zimbabwe. | [16,17,18,22,26,27,36,39,44,50,89,90,91,92,93,94,95,96,97,98,99,100] |
| Pathogen | Country or Continent of Interest | References |
|---|---|---|
| Anaplasma spp. | USA | [62,101,102] |
| Babesia spp. | Europe | [72,84,103] |
| Borrelia spp. | Canada, Italy, Scotland, Slovakia, Spain, USA and Western Palearctic | [55,56,60,62,65,73,80,81,83,85,88,104,105] |
| Capripoxvirus | Asia and Europe | [106] |
| Coxiella spp. | Spain | [107] |
| Cytauxzoon spp. | USA | [108] |
| Ehrlichia spp. | Australia and USA | [24,32,102,105,109] |
| Flavivirus | Europe, Italy and Scotland | [57,110] |
| Orthonairovirus | Iran, Turkey | [111] |
| Rickettsia spp. | Brazil, Panama and USA | [16,22,29,35,43] |
| Theileria spp. | Africa, Djibouti, Eritrea, Ethiopia, Greece, New Zealand and Somalia | [45,46,95,97,103] |
| Type of Model | References | Sensitivity (%) | Specificity (%) | Youden Index |
|---|---|---|---|---|
| Classification and regression tree (CART) | [71] | 75 | 78 | 0.53 |
| Classification and regression tree (CART) | [91] | 89 | 96 | 0.86 |
| Classification and regression tree (CART) | [33] | 87 | - | ND |
| Generalized linear model (GLM) | [53] | 100 | 80 | 0.80 |
| Generalized linear model (GLM) | [59] | 91.3 | 96.4 | 0.87 |
| Generalized linear model (GLM) | [63] | 89 | 82 | 0.71 |
| Generalized linear model (GLM) | [91] | 90 | 95 | 0.85 |
| Generalized linear model (GLM) | [33] | 88.5 | - | ND |
| Linear discriminant analysis (LDA) | [91] | 85 | 98 | 0.84 |
| Maximum entropy (MaxEnt) | [16] | 95.76 | 76 | 0.72 |
| Maximum entropy (MaxEnt) | [71] | 79 | 78 | 0.57 |
| Maximum entropy (MaxEnt) | [64] | 79.5 | - | ND |
| Maximum entropy (MaxEnt) | [33] | 84 | - | ND |
| Bayesian hierarchical models | [102] | >90 | <60 | ND |
| Model | Reference |
|---|---|
| Agent-based model | [23,73,85] |
| Bayesian hierarchical models | [32,101,105,106,112] |
| Cellular automata model | [66] |
| Classification and regression tree (CART) | [26,87,96] |
| Deterministic model | [48,54,72,90] |
| Differential equation model | [24,56] |
| Digital elevation raster model (DEM) | [78] |
| Ecological niche factor analysis (ENFA) | [18,26,39,96] |
| Environmental niche model (ENM) | [93,106] |
| Epidemiological model | [113] |
| Generalized linear model (GLM) | [19,22,25,27,31,34,57,61,62,68,69,78,79,80,100,104,111] |
| Leslie models | [114,115,116] |
| Markov model | [110] |
| Maximum entropy (MaxEnt) | [20,28,37,44,45,47,50,58,65,92] |
| Multi-criteria decision analysis (MCDA) | [74] |
| Multi-habitat model | [67] |
| Next generation matrix (NGM) model | [55,60] |
| Process-driven model | [52] |
| Reaction-diffusion model | [29] |
| Species distribution modeling (SDM) | [42,51,78,97,98] |
| Weather research and forecasting (WRF) model | [36,89] |
| Weights-of-evidence method (WofE) | [26] |
| Year | Country | Models | References |
|---|---|---|---|
| 2008 | Tanzania | Ecological niche factor analysis (ENFA) Classification and regression tree (CART) | [96] |
| 2009 | Africa | Logistic regression | [100] |
| 2013 | Republic of Benin | Maximum entropy (MaxEnt) | [92] |
| 2015 | Republic of Benin | Generalized linear model (GLM) Linear discriminant analysis (LDA) Classification regression tree (CART) | [91] |
| 2018 | Zimbabwe | Generalized linear model (GLM) | [99] |
| Inclusion Criteria | Exclusion Criteria |
|---|---|
|
|
Publisher’s Note: MDPI stays neutral with regard to jurisdictional claims in published maps and institutional affiliations. |
© 2021 by the authors. Licensee MDPI, Basel, Switzerland. This article is an open access article distributed under the terms and conditions of the Creative Commons Attribution (CC BY) license (https://creativecommons.org/licenses/by/4.0/).
Share and Cite
Zannou, O.M.; Ouedraogo, A.S.; Biguezoton, A.S.; Abatih, E.; Coral-Almeida, M.; Farougou, S.; Yao, K.P.; Lempereur, L.; Saegerman, C. Models for Studying the Distribution of Ticks and Tick-Borne Diseases in Animals: A Systematic Review and a Meta-Analysis with a Focus on Africa. Pathogens 2021, 10, 893. https://doi.org/10.3390/pathogens10070893
Zannou OM, Ouedraogo AS, Biguezoton AS, Abatih E, Coral-Almeida M, Farougou S, Yao KP, Lempereur L, Saegerman C. Models for Studying the Distribution of Ticks and Tick-Borne Diseases in Animals: A Systematic Review and a Meta-Analysis with a Focus on Africa. Pathogens. 2021; 10(7):893. https://doi.org/10.3390/pathogens10070893
Chicago/Turabian StyleZannou, Olivier M., Achille S. Ouedraogo, Abel S. Biguezoton, Emmanuel Abatih, Marco Coral-Almeida, Souaïbou Farougou, Kouassi Patrick Yao, Laetitia Lempereur, and Claude Saegerman. 2021. "Models for Studying the Distribution of Ticks and Tick-Borne Diseases in Animals: A Systematic Review and a Meta-Analysis with a Focus on Africa" Pathogens 10, no. 7: 893. https://doi.org/10.3390/pathogens10070893