
Reduced Level of Tear Antimicrobial and Immunomodulatory Proteins as a Possible Reason for Higher Ocular Infections in Diabetic Patients

 , ,
, ,
Abstract
: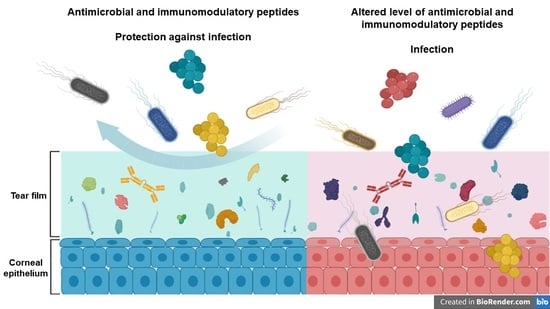
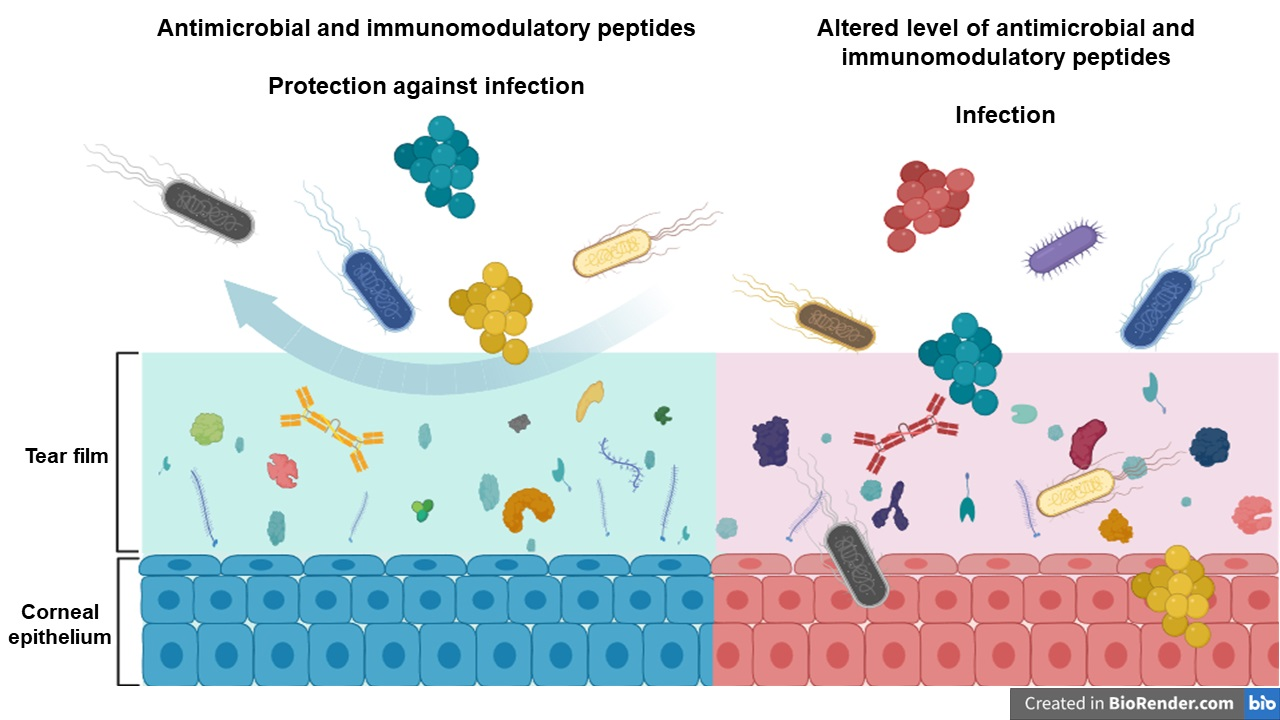
1. Introduction
2. Results
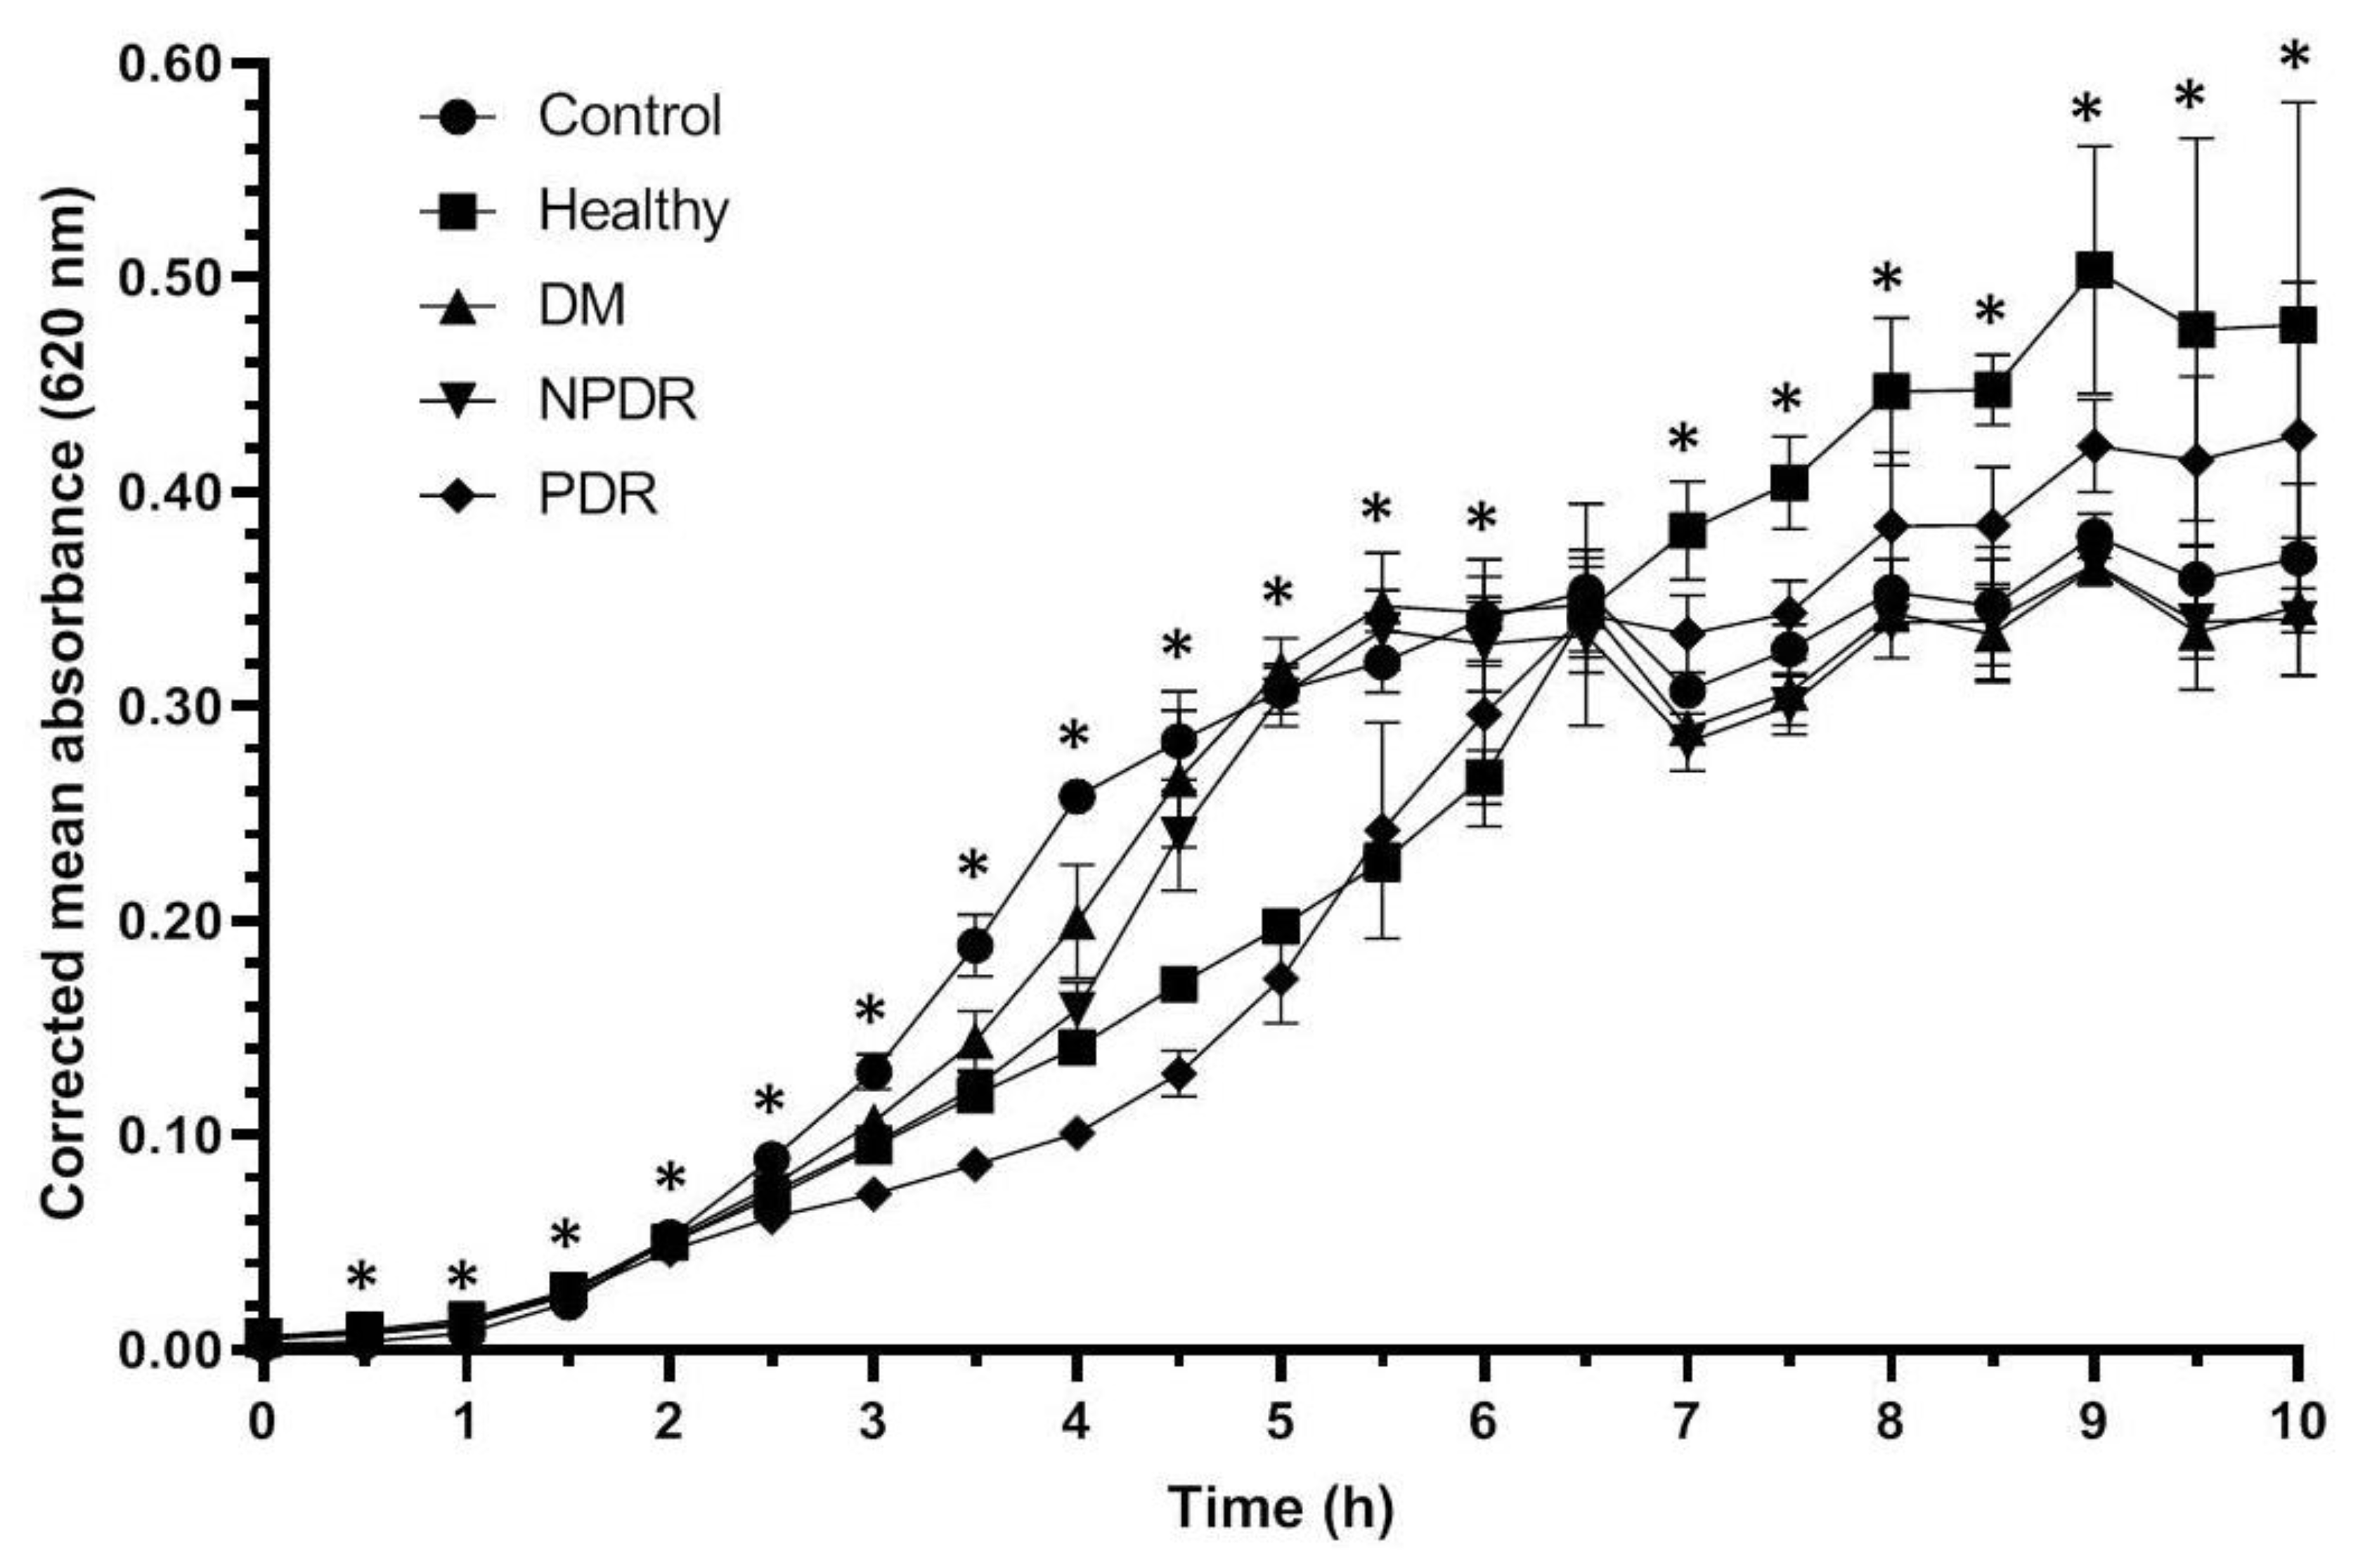
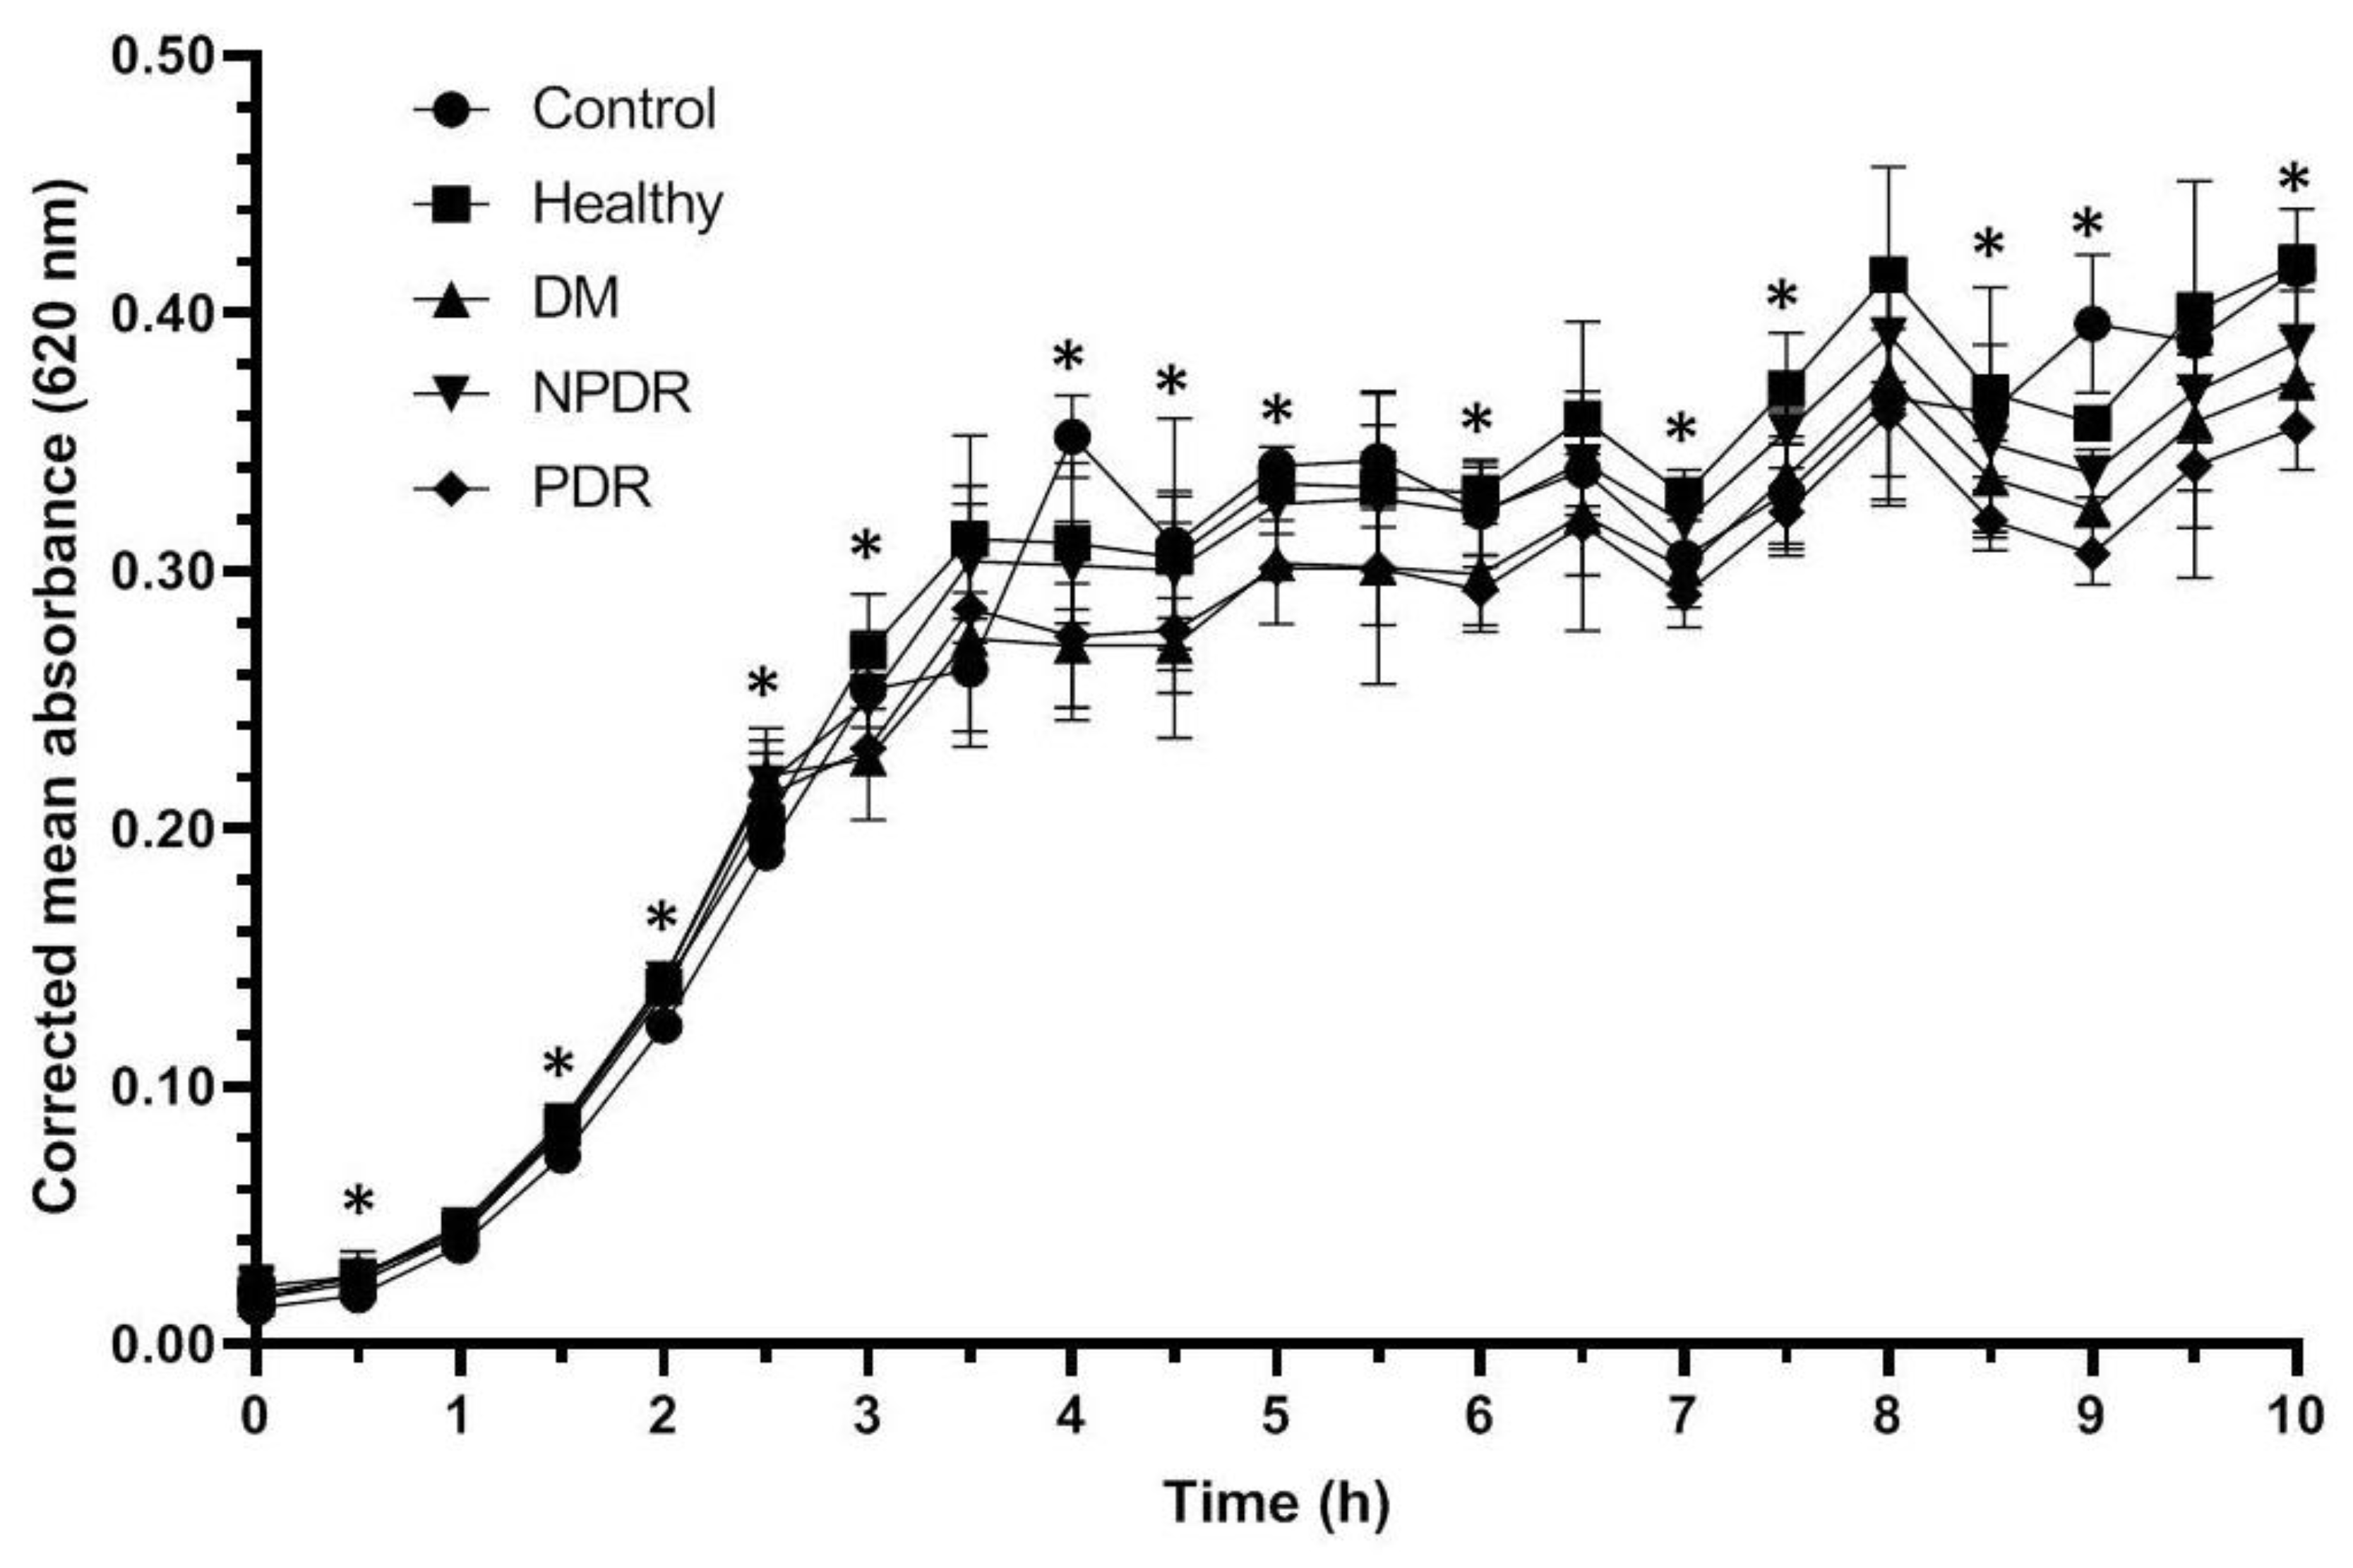
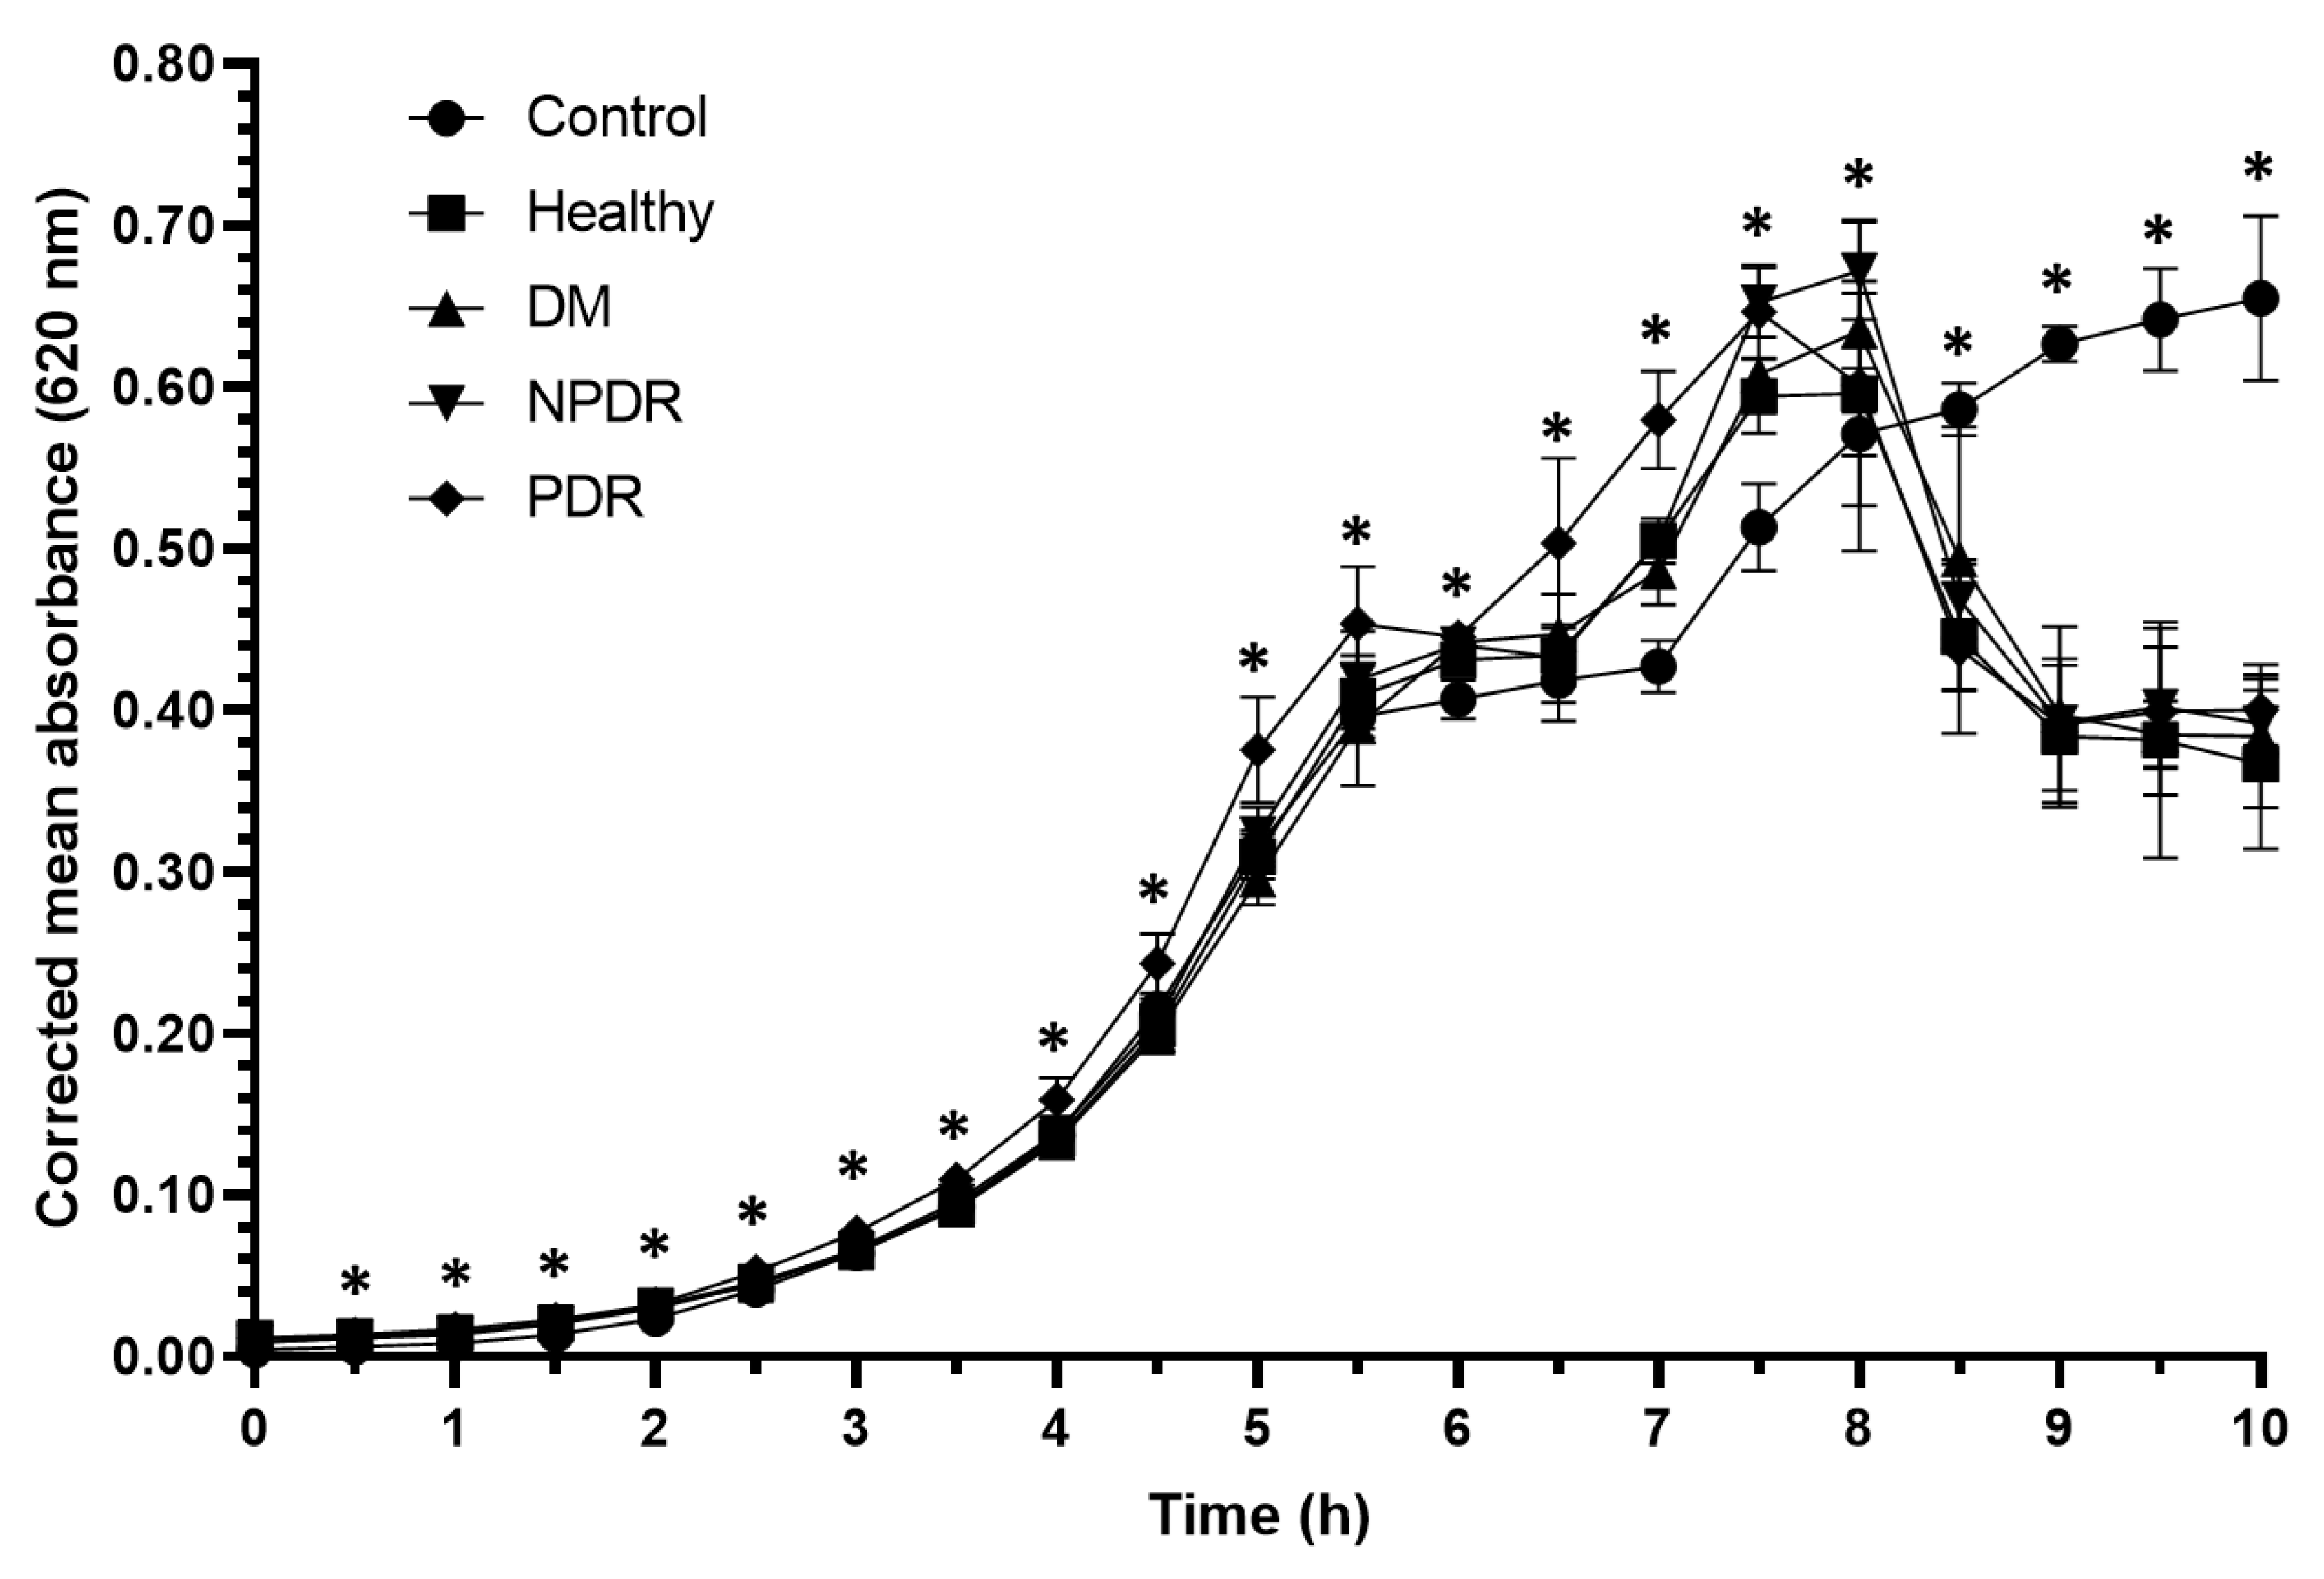
2.1. Antibacterial Activity of Tears
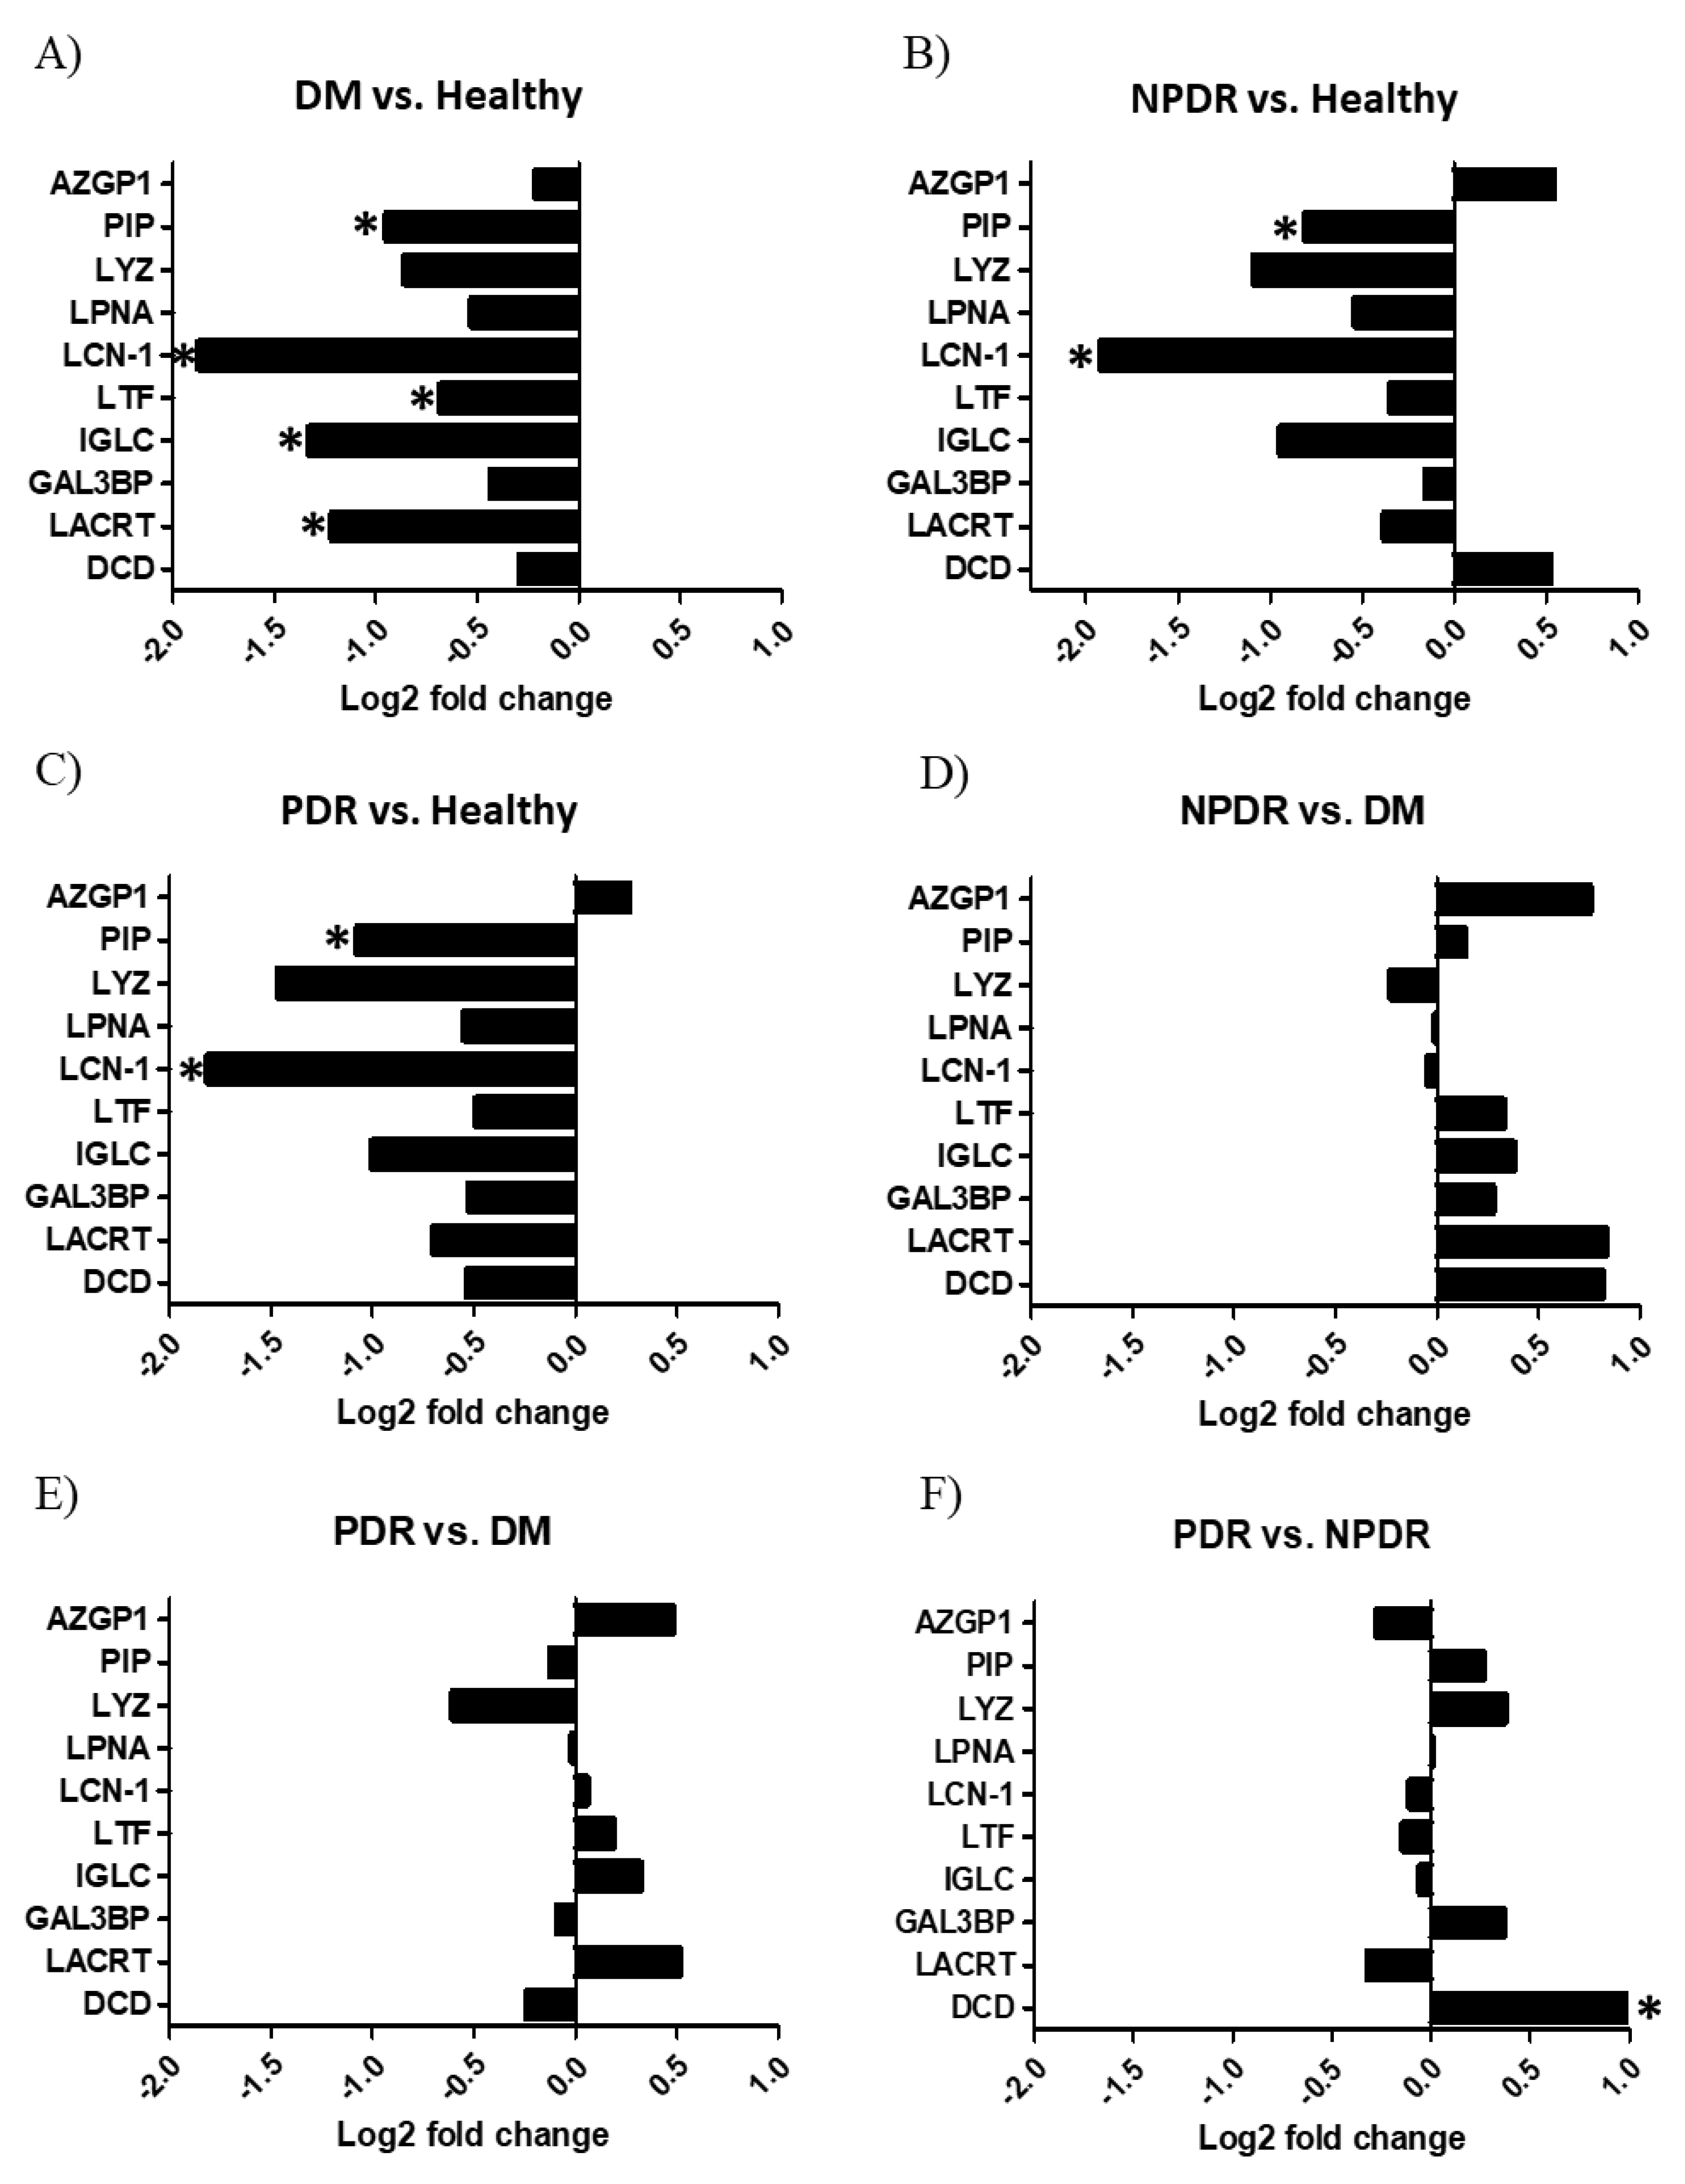
2.2. Changes in the Chemical Barrier Composition of Tears Collected from Patients with Diabetes Mellitus
3. Discussion
4. Materials and Methods
4.1. Collection of Tear Samples
4.2. Antibacterial Activity Analysis
4.3. Sample Preparation for Mass Spectrometry
4.4. SRM-Based Targeted Mass Spectrometry Analysis
4.5. Data and Statistical Analysis
5. Conclusions
Supplementary Materials
Author Contributions
Funding
Institutional Review Board Statement
Informed Consent Statement
Data Availability Statement
Acknowledgments
Conflicts of Interest
References
- Wild, S.; Roglic, G.; Green, A.; Sicree, R.; King, H. Global Prevalence of Diabetes: Estimates for the year 2000 and projections for 2030. Diabetes Care 2004, 27, 1047–1053. [Google Scholar] [CrossRef] [Green Version]
- Aring, A.M.; Jones, D.E.; Falko, J.M. Evaluation and prevention of diabetic neuropathy. Am. Fam. Physician 2005, 71, 2123–2128. [Google Scholar] [PubMed]
- Cheung, N.; Mitchell, P.; Wong, T.Y. Diabetic retinopathy. Lancet 2010, 376, 124–136. [Google Scholar] [CrossRef]
- Keenan, T.D.L.; Johnston, R.L.; Donachie, P.H.J.; Sparrow, J.M.; Stratton, I.M.; Scanlon, P. United Kingdom National Ophthalmology Database Study: Diabetic Retinopathy; Report 1: Prevalence of centre-involving diabetic macular oedema and other grades of maculopathy and retinopathy in hospital eye services. Eye 2013, 27, 1397–1404. [Google Scholar] [CrossRef] [Green Version]
- Klonoff, D.C.; Schwartz, D.M. An economic analysis of interventions for diabetes. Diabetes Care 2000, 23, 390–404. [Google Scholar] [CrossRef] [Green Version]
- Al-Mujaini, A.; Al-Kharusi, N.; Thakral, A.; Wali, U.K. Bacterial keratitis: Perspective on epidemiology, Clinico-Pathogenesis, diagnosis and treatment. Sultan Qaboos Univ. Med. J. 2009, 9, 184–195. [Google Scholar] [PubMed]
- Skarbez, K.; Priestley, Y.; Hoepf, M.; Koevary, S.B. Comprehensive review of the effects of diabetes on ocular health. Expert Rev. Ophthalmol. 2010, 5, 557–577. [Google Scholar] [CrossRef] [Green Version]
- Seifart, U.; Strempel, I. The dry eye and diabetes mellitus. Ophthalmologe 1994, 91, 235–239. [Google Scholar] [PubMed]
- Ljubimov, A.V.; Huang, Z.; Huang, G.H.; Burgeson, R.E.; Miner, J.H.; Gullberg, D.; Ninomiya, Y.; Sado, Y.; Kenney, M.C. Human Corneal Epithelial Basement Membrane and Integrin Alterations in Diabetes and Diabetic Retinopathy. J. Histochem. Cytochem. 1998, 46, 1033–1041. [Google Scholar] [CrossRef] [PubMed] [Green Version]
- Dogru, M.; Katakami, C.; Inoue, M. Tear function and ocular surface changes in noninsulin-dependent diabetes mellitus. Ophthalmology 2001, 108, 586–592. [Google Scholar] [CrossRef]
- Yoon, K.C.; Im, S.K.; Seo, M.S. Changes of tear film and ocular surface in diabetes mellitus. Korean J. Ophthalmol. 2004, 18, 168–174. [Google Scholar] [CrossRef] [Green Version]
- Owen, C.G.; Newsom, R.S.B.; Rudnicka, A.R.; Barman, S.A.; Woodward, E.G.; Ellis, T.J. Diabetes and the Tortuosity of Vessels of the Bulbar Conjunctiva. Ophthalmology 2008, 115, e27–e32. [Google Scholar] [CrossRef] [PubMed]
- Owen, C.G.; Newsom, R.S.B.; Rudnicka, A.R.; Ellis, T.J.; Woodward, E.G. Vascular response of the bulbar conjunctiva to diabetes and elevated blood pressure. Ophthalmology 2005, 112, 1801–1808. [Google Scholar] [CrossRef] [PubMed]
- Csősz, É.; Boross, P.; Csutak, A.; Berta, A.; Tóth, F.; Póliska, S.; Török, Z.; Tőzsér, J. Quantitative analysis of proteins in the tear fluid of patients with diabetic retinopathy. J. Proteomics 2012, 75, 2196–2204. [Google Scholar] [CrossRef]
- Kalló, G.; Emri, M.; Varga, Z.; Ujhelyi, B.; Tőzsér, J.; Csutak, A.; Csősz, É. Changes in the Chemical Barrier Composition of Tears in Alzheimer’s Disease Reveal Potential Tear Diagnostic Biomarkers. PLoS ONE 2016, 11, e0158000. [Google Scholar] [CrossRef] [PubMed] [Green Version]
- Radek, K.; Gallo, R. Antimicrobial peptides: Natural effectors of the innate immune system. Semin. Immunopathol. 2007, 29, 27–43. [Google Scholar] [CrossRef] [PubMed]
- Grus, F.H.; Sabuncuo, P.; Dick, H.B.; Augustin, A.J.; Pfeiffer, N. Changes in the tear proteins of diabetic patients. BMC Ophthalmol. 2002, 2, 4. [Google Scholar] [CrossRef] [PubMed] [Green Version]
- Zhou, L.; Beuerman, R.W. Tear analysis in ocular surface diseases. Prog. Retin. Eye Res. 2012, 31, 527–550. [Google Scholar] [CrossRef]
- Torok, Z.; Peto, T.; Csosz, E.; Tukacs, E.; Molnar, A.; Maros-Szabo, Z.; Berta, A.; Tozser, J.; Hajdu, A.; Nagy, V.; et al. Tear fluid proteomics multimarkers for diabetic retinopathy screening. BMC Ophthalmol. 2013, 13, 40. [Google Scholar] [CrossRef] [PubMed]
- de Souza, G.A.; de Godoy, L.M.F.; Mann, M. Identification of 491 proteins in the tear fluid proteome reveals a large number of proteases and protease inhibitors. Genome Biol. 2006, 7, R72. [Google Scholar] [CrossRef] [PubMed] [Green Version]
- Li, N.; Wang, N.; Zheng, J.; Liu, X.M.; Lever, O.W.; Erickson, P.M.; Li, L. Characterization of human tear proteome using multiple proteomic analysis techniques. J. Proteome Res. 2005, 4, 2052–2061. [Google Scholar] [CrossRef] [PubMed]
- Zhou, L.; Zhao, S.Z.; Koh, S.K.; Chen, L.; Vaz, C.; Tanavde, V.; Li, X.R.; Beuerman, R.W. In-depth analysis of the human tear proteome. J. Proteomics 2012, 75, 3877–3885. [Google Scholar] [CrossRef] [PubMed]
- Park, K.S.; Kim, S.S.; Kim, J.C.; Kim, H.C.; Im, Y.S.; Ahn, C.W.; Lee, H.K. Serum and tear levels of nerve growth factor in diabetic retinopathy patients. Am. J. Ophthalmol. 2008, 145, 432–437. [Google Scholar] [CrossRef] [PubMed]
- Kawai, S.; Nakajima, T.; Hokari, S.; Komoda, T.; Kawai, K. Apolipoprotein A-I concentration in tears in diabetic retinopathy. Ann. Clin. Biochem. 2002, 39, 56–61. [Google Scholar] [CrossRef] [PubMed]
- Kim, H.-J.; Kim, P.-K.; Yoo, H.-S.; Kim, C.-W. Comparison of tear proteins between healthy and early diabetic retinopathy patients. Clin. Biochem. 2012, 45, 60–67. [Google Scholar] [CrossRef]
- Tsybikov, N.N.; Shovdra, O.L.; Prutkina, E. V The levels of endothelin, neuron-specific enolase, and their autoantibodies in the serum and tear fluid of patients with type 2 diabetes mellitus. Vestn. Oftalmol. 2010, 126, 14–16. [Google Scholar]
- Boja, E.S.; Rodriguez, H. Mass spectrometry-based targeted quantitative proteomics: Achieving sensitive and reproducible detection of proteins. Proteomics 2012, 12, 1093–1110. [Google Scholar] [CrossRef]
- Picotti, P.; Aebersold, R. Selected reaction monitoring-based proteomics: Workflows, potential, pitfalls and future directions. Nat. Methods 2012, 9, 555–566. [Google Scholar] [CrossRef]
- Csősz, É.; Kalló, G.; Márkus, B.; Deák, E.; Csutak, A.; Tőzsér, J. Quantitative body fluid proteomics in medicine—A focus on minimal invasiveness. J. Proteomics 2016, 1874–3919, 30364–30365. [Google Scholar] [CrossRef] [Green Version]
- Lange, V.; Picotti, P.; Domon, B.; Aebersold, R. Selected reaction monitoring for quantitative proteomics: A tutorial. Mol. Syst. Biol. 2008, 4, 222. [Google Scholar] [CrossRef]
- Tiffany, J.M. Tears in health and disease. Eye 2003, 17, 923–926. [Google Scholar] [CrossRef] [PubMed]
- Charles, A.; Janeway, J.; Travers, P.; Walport, M.; Shlomchik, M.J. Immunobiology: The Immune System in Health and Disease, 5th ed.; Garland Science: New York, NY, USA, 2001. [Google Scholar]
- Ondusko, D.S.; Nolt, D. Staphylococcus aureus. Pediatr. Rev. 2018, 39, 287–298. [Google Scholar] [CrossRef] [PubMed] [Green Version]
- O’Callaghan, R.J. The pathogenesis of staphylococcus aureus eye infections. Pathogens 2018, 7, 9. [Google Scholar] [CrossRef] [PubMed] [Green Version]
- Kaper, J.B.; Nataro, J.P.; Mobley, H.L.T. Pathogenic Escherichia coli. Nat. Rev. Microbiol. 2004, 2, 123–140. [Google Scholar] [CrossRef] [PubMed]
- Teweldemedhin, M.; Gebreyesus, H.; Atsbaha, A.H.; Asgedom, S.W.; Saravanan, M. Bacterial profile of ocular infections: A systematic review. BMC Ophthalmol. 2017, 17, 212. [Google Scholar] [CrossRef] [PubMed] [Green Version]
- Moradali, M.F.; Ghods, S.; Rehm, B.H.A. Pseudomonas aeruginosa lifestyle: A paradigm for adaptation, survival, and persistence. Front. Cell. Infect. Microbiol. 2017, 7, 39. [Google Scholar] [CrossRef] [Green Version]
- Mason, M.M. A Comparison of the Maximal Growth Rates of Various Bacteria under Optimal Conditions. J. Bacteriol. 1935, 29, 103–110. [Google Scholar] [CrossRef] [Green Version]
- Wiesner, J.; Vilcinskas, A. Antimicrobial peptides: The ancient arm of the human immune system. Virulence 2010, 1, 440–464. [Google Scholar] [CrossRef]
- Flo, T.H.; Smith, K.D.; Sato, S.; Rodriguez, D.J.; Holmes, M.A.; Strong, R.K.; Akira, S.; Aderem, A. Lipocalin 2 mediates an innate immune response to bacterial infection by sequestrating iron. Nature 2004, 432, 917–921. [Google Scholar] [CrossRef]
- Yang, J.; Goetz, D.; Li, J.Y.; Wang, W.; Mori, K.; Setlik, D.; Du, T.; Erdjument-Bromage, H.; Tempst, P.; Strong, R.; et al. An iron delivery pathway mediated by a lipocalin. Mol. Cell 2002, 10, 1045–1056. [Google Scholar] [CrossRef]
- McKown, R.L.; Wang, N.; Raab, R.W.; Karnati, R.; Zhang, Y.; Williams, P.B.; Laurie, G.W. Lacritin and other new proteins of the lacrimal functional unit. Exp. Eye Res. 2009, 88, 848–858. [Google Scholar] [CrossRef] [Green Version]
- Wang, J.; Wang, N.; Xie, J.; Walton, S.C.; McKown, R.L.; Raab, R.W.; Ma, P.; Beck, S.L.; Coffman, G.L.; Hussaini, I.M.; et al. Restricted epithelial proliferation by lacritin via PKCalpha-dependent NFAT and mTOR pathways. J. Cell Biol. 2006, 174, 689–700. [Google Scholar] [CrossRef]
- Wang, W.; Despanie, J.; Shi, P.; Edman-Woolcott, M.C.; Lin, Y.-A.; Cui, H.; Heur, J.M.; Fini, M.E.; Hamm-Alvarez, S.F.; MacKay, J.A. Lacritin-mediated regeneration of the corneal epithelia by protein polymer nanoparticles. J. Mater. Chem. B. Mater. Biol. Med. 2014, 2, 8131–8141. [Google Scholar] [CrossRef] [Green Version]
- McKown, R.L.; Coleman Frazier, E.V.; Zadrozny, K.K.; Deleault, A.M.; Raab, R.W.; Ryan, D.S.; Sia, R.K.; Lee, J.K.; Laurie, G.W. A cleavage-potentiated fragment of tear lacritin is bactericidal. J. Biol. Chem. 2014, 289, 22172–22182. [Google Scholar] [CrossRef] [Green Version]
- Caputo, E.; Camarca, A.; Moharram, R.; Tornatore, P.; Thatcher, B.; Guardiola, J.; Martin, B.M. Structural study of GCDFP-15/gp17 in disease versus physiological conditions using a proteomic approach. Biochemistry 2003, 42, 6169–6178. [Google Scholar] [CrossRef] [PubMed]
- Chiu, W.W.-C.; Chamley, L.W. Human seminal plasma prolactin-inducible protein is an immunoglobulin G-binding protein. J. Reprod. Immunol. 2003, 60, 97–111. [Google Scholar] [CrossRef]
- Hassan, M.I.; Waheed, A.; Yadav, S.; Singh, T.P.; Ahmad, F. Prolactin inducible protein in cancer, fertility and immunoregulation: Structure, function and its clinical implications. Cell. Mol. Life Sci. 2009, 66, 447–459. [Google Scholar] [CrossRef] [PubMed]
- Petrakis, N.L.; Lowenstein, J.M.; Wiencke, J.K.; Lee, M.M.; Wrensch, M.R.; King, E.B.; Hilton, J.F.; Miike, R. Gross cystic disease fluid protein in nipple aspirates of breast fluid of Asian and non-Asian women. Cancer Epidemiol. Biomark. Prev. 1993, 2, 573–579. [Google Scholar]
- Oyinloye, B.E.; Adenowo, A.F.; Kappo, A.P. Reactive oxygen species, apoptosis, antimicrobial peptides and human inflammatory diseases. Pharmaceuticals 2015, 8, 151–175. [Google Scholar] [CrossRef] [PubMed]
- Donato, L.; Abdalla, E.M.; Scimone, C.; Alibrandi, S.; Rinaldi, C.; Nabil, K.M.; D’angelo, R.; Sidoti, A. Impairments of photoreceptor outer segments renewal and phototransduction due to a peripherin rare haplotype variant: Insights from molecular modeling. Int. J. Mol. Sci. 2021, 22, 3484. [Google Scholar] [CrossRef] [PubMed]
- Scimone, C.; Donato, L.; Alibrandi, S.; Vadalà, M.; Giglia, G.; Sidoti, A.; D’Angelo, R. N-retinylidene-N-retinylethanolamine adduct induces expression of chronic inflammation cytokines in retinal pigment epithelium cells. Exp. Eye Res. 2021, 209, 108641. [Google Scholar] [CrossRef]
- You, J.; Fitzgerald, A.; Cozzi, P.J.; Zhao, Z.; Graham, P.; Russell, P.J.; Walsh, B.J.; Willcox, M.; Zhong, L.; Wasinger, V.; et al. Post-translation modification of proteins in tears. Electrophoresis 2010, 31, 1853–1861. [Google Scholar] [CrossRef]
- Rieg, S.; Garbe, C.; Sauer, B.; Kalbacher, H.; Schittek, B. Dermcidin is constitutively produced by eccrine sweat glands and is not induced in epidermal cells under inflammatory skin conditions. Br. J. Dermatol. 2004, 151, 534–539. [Google Scholar] [CrossRef]
- Chang, W.C.; Huang, M.S.; Yang, C.J.; Wang, W.Y.; Lai, T.C.; Hsiao, M.; Chen, C.H. Dermcidin identification from exhaled air for lung cancer diagnosis. Eur. Respir. J. 2010, 35, 1182–1185. [Google Scholar] [CrossRef] [PubMed]
- Stewart, G.D.; Skipworth, R.J.E.; Pennington, C.J.; Lowrie, A.G.; Deans, D.A.C.; Edwards, D.R.; Habib, F.K.; Riddick, A.C.P.; Fearon, K.C.H.; Ross, J.A. Variation in dermcidin expression in a range of primary human tumours and in hypoxic/oxidatively stressed human cell lines. Br. J. Cancer 2008, 99, 126–132. [Google Scholar] [CrossRef] [Green Version]
- Berta, A. Collection of tear samples with or without stimulation. Am. J. Ophthalmol. 1983, 96, 115–116. [Google Scholar] [CrossRef]
- Csősz, É.; Tóth, N.; Deák, E.; Csutak, A.; Tőzsér, J. Wound-Healing Markers Revealed by Proximity Extension Assay in Tears of Patients following Glaucoma Surgery. Int. J. Mol. Sci. 2018, 19, 4096. [Google Scholar] [CrossRef] [Green Version]
- Bradford, M.M. A rapid and sensitive methode for the quantitation of microgram quantites of proiteins utilizing the principle of protein-dye binding. Anal. Biochem. 1976, 72, 248–254. [Google Scholar] [CrossRef]
- Oberg, A.L.; Vitek, O. Statistical design of quantitative mass spectrometry-based proteomic experiments. J. Proteome Res. 2009, 8, 2144–2156. [Google Scholar] [CrossRef]
- MacLean, B.; Tomazela, D.M.; Shulman, N.; Chambers, M.; Finney, G.L.; Frewen, B.; Kern, R.; Tabb, D.L.; Liebler, D.C.; MacCoss, M.J. Skyline: An open source document editor for creating and analyzing targeted proteomics experiments. Bioinformatics 2010, 26, 966–968. [Google Scholar] [CrossRef] [Green Version]
- Choi, M.; Chang, C.-Y.; Clough, T.; Broudy, D.; Killeen, T.; MacLean, B.; Vitek, O. MSstats: An R package for statistical analysis of quantitative mass spectrometry-based proteomic experiments. Bioinformatics 2014, 30, 2524–2526. [Google Scholar] [CrossRef] [PubMed] [Green Version]


| Time (h) | Control vs. Healthy | Control vs. DM | Control vs. NPDR | Control vs. PDR | Healthy vs. DM | Healthy vs. NPDR | Healthy vs. PDR | DM vs. NPDR | DM vs. PDR | NPDR vs. PDR |
|---|---|---|---|---|---|---|---|---|---|---|
| 0 | 0.099 | 0.268 | 0.099 | 0.099 | 0.369 | 1.000 | 1.000 | 0.369 | 0.369 | 1.000 |
| 0.5 | 0.049 | 0.049 | 0.077 | 0.046 | 0.261 | 0.261 | 0.346 | 0.822 | 0.637 | 0.637 |
| 1 | 0.046 | 0.046 | 0.046 | 0.049 | 0.099 | 0.099 | 0.105 | 0.361 | 0.637 | 0.637 |
| 1.5 | 0.043 | 0.043 | 0.043 | 0.043 | 0.796 | 0.099 | 0.043 | 0.361 | 0.068 | 0.068 |
| 2 | 0.268 | 0.653 | 0.105 | 0.049 | 0.197 | 0.500 | 0.121 | 0.043 | 0.046 | 0.046 |
| 2.5 | 0.049 | 0.049 | 0.049 | 0.049 | 0.049 | 0.184 | 0.049 | 0.184 | 0.049 | 0.049 |
| 3 | 0.049 | 0.049 | 0.049 | 0.046 | 0.049 | 0.658 | 0.046 | 0.127 | 0.046 | 0.046 |
| 3.5 | 0.046 | 0.046 | 0.046 | 0.046 | 0.049 | 0.658 | 0.049 | 0.077 | 0.049 | 0.049 |
| 4 | 0.046 | 0.046 | 0.046 | 0.046 | 0.049 | 0.049 | 0.049 | 0.077 | 0.049 | 0.049 |
| 4.5 | 0.049 | 0.275 | 0.127 | 0.049 | 0.049 | 0.049 | 0.049 | 0.275 | 0.049 | 0.049 |
| 5 | 0.049 | 0.275 | 0.827 | 0.049 | 0.049 | 0.049 | 0.127 | 0.275 | 0.049 | 0.049 |
| 5.5 | 0.049 | 0.275 | 0.275 | 0.049 | 0.049 | 0.049 | 0.827 | 0.376 | 0.049 | 0.049 |
| 6 | 0.049 | 0.827 | 0.275 | 0.275 | 0.049 | 0.049 | 0.513 | 0.275 | 0.275 | 0.275 |
| 6.5 | 0.827 | 0.827 | 0.127 | 0.513 | 0.827 | 0.513 | 0.513 | 0.513 | 0.513 | 0.513 |
| 7 | 0.049 | 0.049 | 0.049 | 0.049 | 0.049 | 0.049 | 0.049 | 0.513 | 0.049 | 0.049 |
| 7.5 | 0.049 | 0.275 | 0.049 | 0.275 | 0.049 | 0.049 | 0.049 | 0.513 | 0.049 | 0.049 |
| 8 | 0.049 | 0.275 | 0.275 | 0.127 | 0.049 | 0.049 | 0.127 | 0.513 | 0.127 | 0.127 |
| 8.5 | 0.049 | 0.268 | 0.376 | 0.127 | 0.049 | 0.049 | 0.049 | 0.507 | 0.046 | 0.049 |
| 9 | 0.049 | 0.127 | 0.127 | 0.049 | 0.049 | 0.049 | 0.049 | 0.827 | 0.049 | 0.049 |
| 9.5 | 0.049 | 0.275 | 0.275 | 0.049 | 0.049 | 0.049 | 0.275 | 0.513 | 0.049 | 0.049 |
| 10 | 0.268 | 0.268 | 0.268 | 0.268 | 0.127 | 0.049 | 0.275 | 0.658 | 0.275 | 0.275 |
| Time (h) | Control vs. Healthy | Control vs. DM | Control vs. NPDR | Control vs. PDR | Healthy vs. DM | Healthy vs. NPDR | Healthy vs. PDR | DM vs. NPDR | DM vs. PDR | NPDR vs. PDR |
|---|---|---|---|---|---|---|---|---|---|---|
| 0 | 0.046 | 0.197 | 0.268 | 0.369 | 0.369 | 0.513 | 0.513 | 0.507 | 0.825 | 0.275 |
| 0.5 | 0.049 | 0.046 | 0.077 | 0.127 | 0.105 | 0.513 | 0.658 | 0.507 | 0.507 | 0.827 |
| 1 | 0.077 | 0.127 | 0.072 | 0.268 | 0.275 | 0.369 | 0.121 | 0.268 | 0.637 | 0.116 |
| 1.5 | 0.046 | 0.046 | 0.046 | 0.046 | 0.513 | 0.827 | 0.513 | 0.658 | 0.376 | 0.184 |
| 2 | 0.049 | 0.049 | 0.049 | 0.049 | 0.376 | 0.658 | 0.513 | 0.827 | 0.127 | 0.077 |
| 2.5 | 0.049 | 0.049 | 0.049 | 0.049 | 0.127 | 0.275 | 0.513 | 0.827 | 0.513 | 0.658 |
| 3 | 0.275 | 0.127 | 0.513 | 0.268 | 0.049 | 0.275 | 0.268 | 0.049 | 0.507 | 0.268 |
| 3.5 | 0.275 | 0.827 | 0.127 | 0.275 | 0.275 | 0.513 | 0.275 | 0.127 | 0.513 | 0.827 |
| 4 | 0.127 | 0.049 | 0.049 | 0.049 | 0.184 | 0.658 | 0.275 | 0.184 | 0.827 | 0.275 |
| 4.5 | 0.513 | 0.275 | 0.827 | 0.275 | 0.049 | 0.827 | 0.275 | 0.184 | 0.827 | 0.275 |
| 5 | 0.658 | 0.049 | 0.127 | 0.049 | 0.127 | 0.658 | 0.049 | 0.275 | 0.827 | 0.049 |
| 5.5 | 0.827 | 0.127 | 0.827 | 0.275 | 0.275 | 0.827 | 0.376 | 0.184 | 0.827 | 0.275 |
| 6 | 0.275 | 0.127 | 1.000 | 0.127 | 0.127 | 0.275 | 0.049 | 0.127 | 0.827 | 0.127 |
| 6.5 | 0.513 | 0.275 | 0.827 | 0.513 | 0.127 | 0.513 | 0.261 | 0.275 | 0.827 | 0.513 |
| 7 | 0.127 | 0.827 | 0.513 | 0.268 | 0.049 | 0.127 | 0.046 | 0.049 | 0.046 | 0.046 |
| 7.5 | 0.127 | 0.658 | 0.275 | 0.275 | 0.127 | 0.275 | 0.049 | 0.275 | 0.275 | 0.275 |
| 8 | 0.127 | 0.827 | 0.513 | 0.827 | 0.275 | 0.275 | 0.275 | 0.275 | 0.275 | 0.275 |
| 8.5 | 0.513 | 0.827 | 0.827 | 0.127 | 0.127 | 0.275 | 0.049 | 0.275 | 0.275 | 0.049 |
| 9 | 0.046 | 0.049 | 0.049 | 0.049 | 0.046 | 0.046 | 0.046 | 0.049 | 0.049 | 0.049 |
| 9.5 | 0.827 | 0.275 | 0.513 | 0.275 | 0.513 | 0.513 | 0.127 | 0.658 | 0.513 | 0.275 |
| 10 | 0.827 | 0.049 | 0.127 | 0.049 | 0.049 | 0.049 | 0.049 | 0.184 | 0.184 | 0.077 |
| Time (h) | Control vs. Healthy | Control vs. DM | Control vs. NPDR | Control vs. PDR | Healthy vs. DM | Healthy vs. NPDR | Healthy vs. PDR | DM vs. NPDR | DM vs. PDR | NPDR vs. PDR |
|---|---|---|---|---|---|---|---|---|---|---|
| 0 | 0.046 | 0.127 | 0.127 | 0.046 | 0.487 | 0.268 | 0.500 | 1.000 | 0.507 | 0.507 |
| 0.5 | 0.046 | 0.046 | 0.046 | 0.046 | 1.000 | 0.513 | 0.513 | 0.827 | 0.261 | 0.376 |
| 1 | 0.046 | 0.046 | 0.046 | 0.034 | 0.658 | 0.658 | 0.121 | 0.261 | 0.037 | 0.037 |
| 1.5 | 0.049 | 0.046 | 0.049 | 0.046 | 0.817 | 0.822 | 0.369 | 0.487 | 0.099 | 0.046 |
| 2 | 0.049 | 0.049 | 0.046 | 0.049 | 0.658 | 0.637 | 0.513 | 0.105 | 0.261 | 0.046 |
| 2.5 | 0.077 | 0.184 | 0.077 | 0.049 | 0.500 | 0.500 | 0.049 | 0.658 | 0.049 | 0.049 |
| 3 | 0.376 | 0.658 | 0.658 | 0.049 | 0.827 | 1.000 | 0.049 | 0.658 | 0.049 | 0.049 |
| 3.5 | 1.000 | 0.513 | 0.827 | 0.049 | 1.000 | 0.658 | 0.049 | 0.275 | 0.049 | 0.049 |
| 4 | 0.822 | 0.513 | 0.658 | 0.049 | 0.827 | 0.827 | 0.049 | 0.275 | 0.049 | 0.077 |
| 4.5 | 0.105 | 0.127 | 0.513 | 0.049 | 0.825 | 0.825 | 0.046 | 0.275 | 0.049 | 0.049 |
| 5 | 0.827 | 0.275 | 0.275 | 0.046 | 0.275 | 0.513 | 0.046 | 0.127 | 0.046 | 0.121 |
| 5.5 | 0.513 | 0.827 | 0.275 | 0.049 | 0.827 | 0.513 | 0.275 | 0.513 | 0.049 | 0.275 |
| 6 | 0.049 | 0.049 | 0.049 | 0.049 | 0.275 | 0.275 | 0.077 | 0.658 | 0.658 | 0.658 |
| 6.5 | 0.513 | 0.049 | 0.827 | 0.049 | 0.513 | 0.513 | 0.049 | 0.513 | 0.049 | 0.275 |
| 7 | 0.049 | 0.049 | 0.049 | 0.049 | 0.275 | 0.827 | 0.049 | 0.275 | 0.049 | 0.049 |
| 7.5 | 0.049 | 0.049 | 0.049 | 0.049 | 0.513 | 0.049 | 0.127 | 0.049 | 0.077 | 0.827 |
| 8 | 0.513 | 0.049 | 0.049 | 0.513 | 0.827 | 0.127 | 0.513 | 0.127 | 0.827 | 0.275 |
| 8.5 | 0.049 | 0.049 | 0.049 | 0.049 | 0.513 | 0.827 | 0.827 | 0.513 | 0.275 | 0.513 |
| 9 | 0.049 | 0.049 | 0.049 | 0.049 | 0.827 | 0.513 | 0.827 | 0.827 | 0.827 | 0.513 |
| 9.5 | 0.049 | 0.049 | 0.049 | 0.049 | 0.513 | 0.513 | 0.827 | 0.513 | 0.513 | 0.827 |
| 10 | 0.049 | 0.049 | 0.049 | 0.049 | 0.827 | 0.513 | 0.513 | 0.827 | 0.827 | 0.658 |
Publisher’s Note: MDPI stays neutral with regard to jurisdictional claims in published maps and institutional affiliations. |
© 2021 by the authors. Licensee MDPI, Basel, Switzerland. This article is an open access article distributed under the terms and conditions of the Creative Commons Attribution (CC BY) license (https://creativecommons.org/licenses/by/4.0/).
Share and Cite
Kalló, G.; Varga, A.K.; Szabó, J.; Emri, M.; Tőzsér, J.; Csutak, A.; Csősz, É. Reduced Level of Tear Antimicrobial and Immunomodulatory Proteins as a Possible Reason for Higher Ocular Infections in Diabetic Patients. Pathogens 2021, 10, 883. https://doi.org/10.3390/pathogens10070883
Kalló G, Varga AK, Szabó J, Emri M, Tőzsér J, Csutak A, Csősz É. Reduced Level of Tear Antimicrobial and Immunomodulatory Proteins as a Possible Reason for Higher Ocular Infections in Diabetic Patients. Pathogens. 2021; 10(7):883. https://doi.org/10.3390/pathogens10070883
Chicago/Turabian StyleKalló, Gergő, Anita Katalin Varga, Judit Szabó, Miklós Emri, József Tőzsér, Adrienne Csutak, and Éva Csősz. 2021. "Reduced Level of Tear Antimicrobial and Immunomodulatory Proteins as a Possible Reason for Higher Ocular Infections in Diabetic Patients" Pathogens 10, no. 7: 883. https://doi.org/10.3390/pathogens10070883