
The Role of Lactic Acid on Wound Healing, Cell Growth, Cell Cycle Kinetics, and Gene Expression of Cultured Junctional Epithelium Cells in the Pathophysiology of Periodontal Disease

 , and
, and 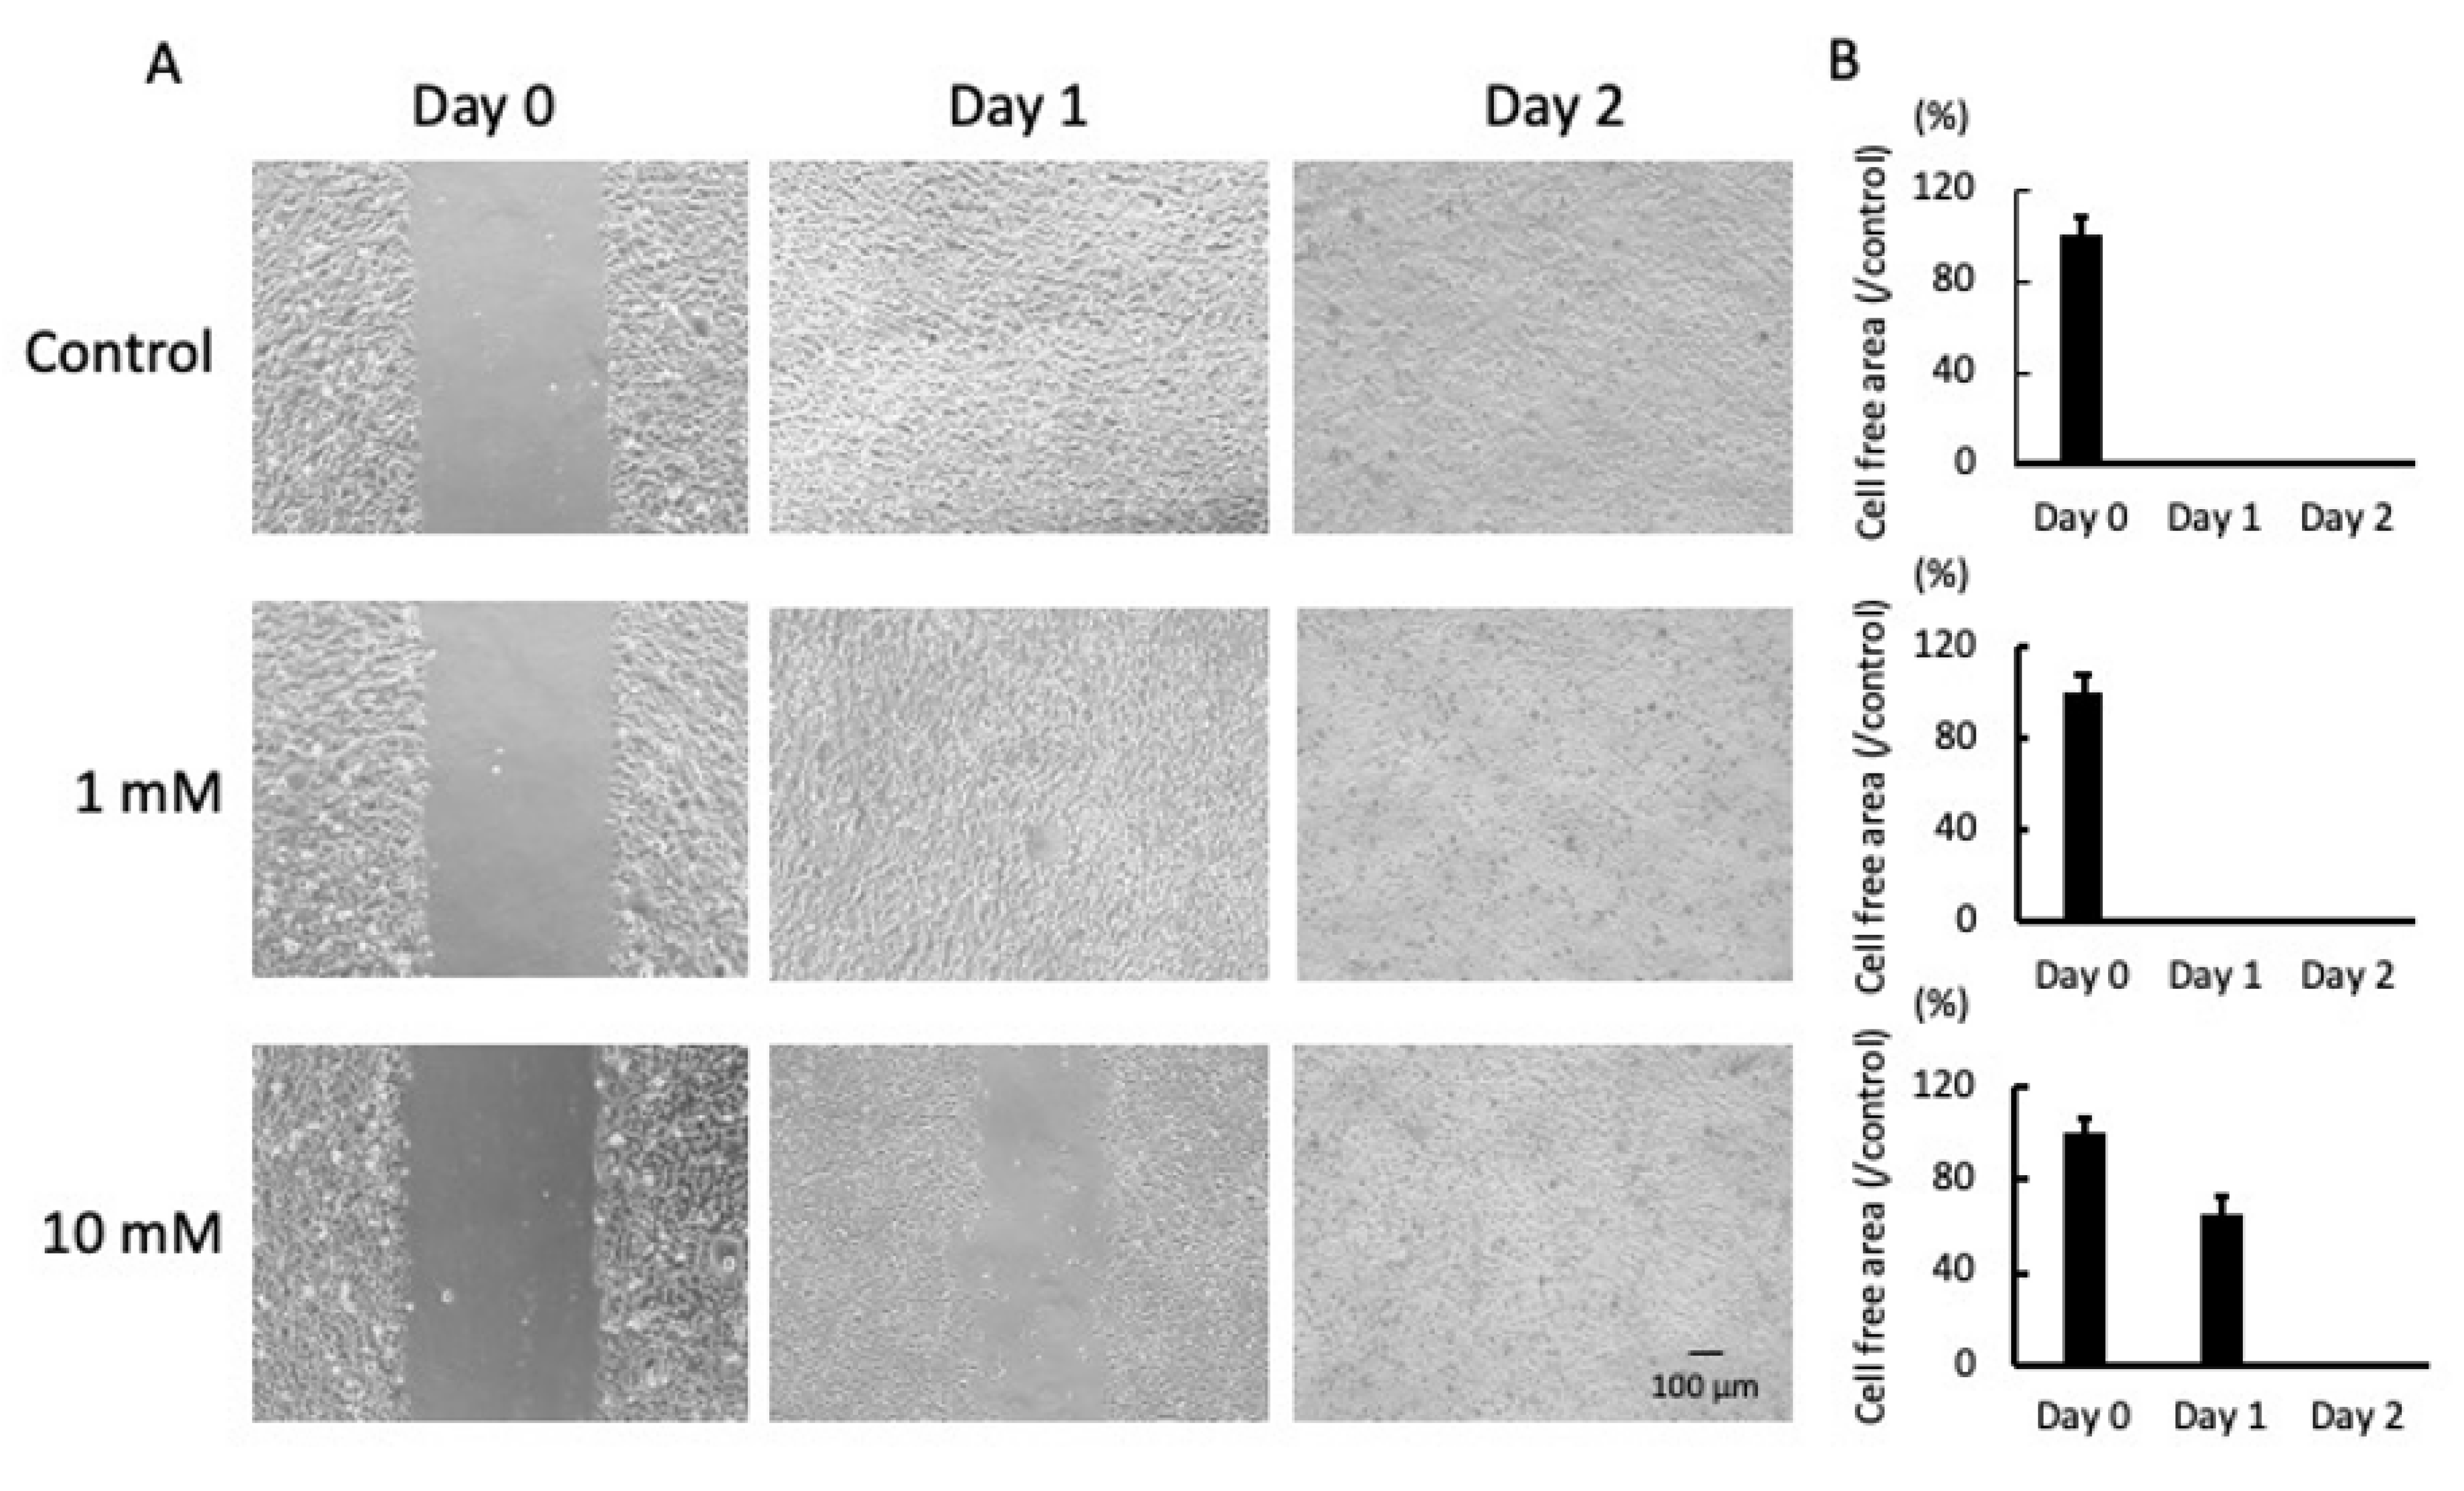
Abstract
:1. Introduction
2. Results
2.1. LA Inhibited Cell Mobility and Proliferation
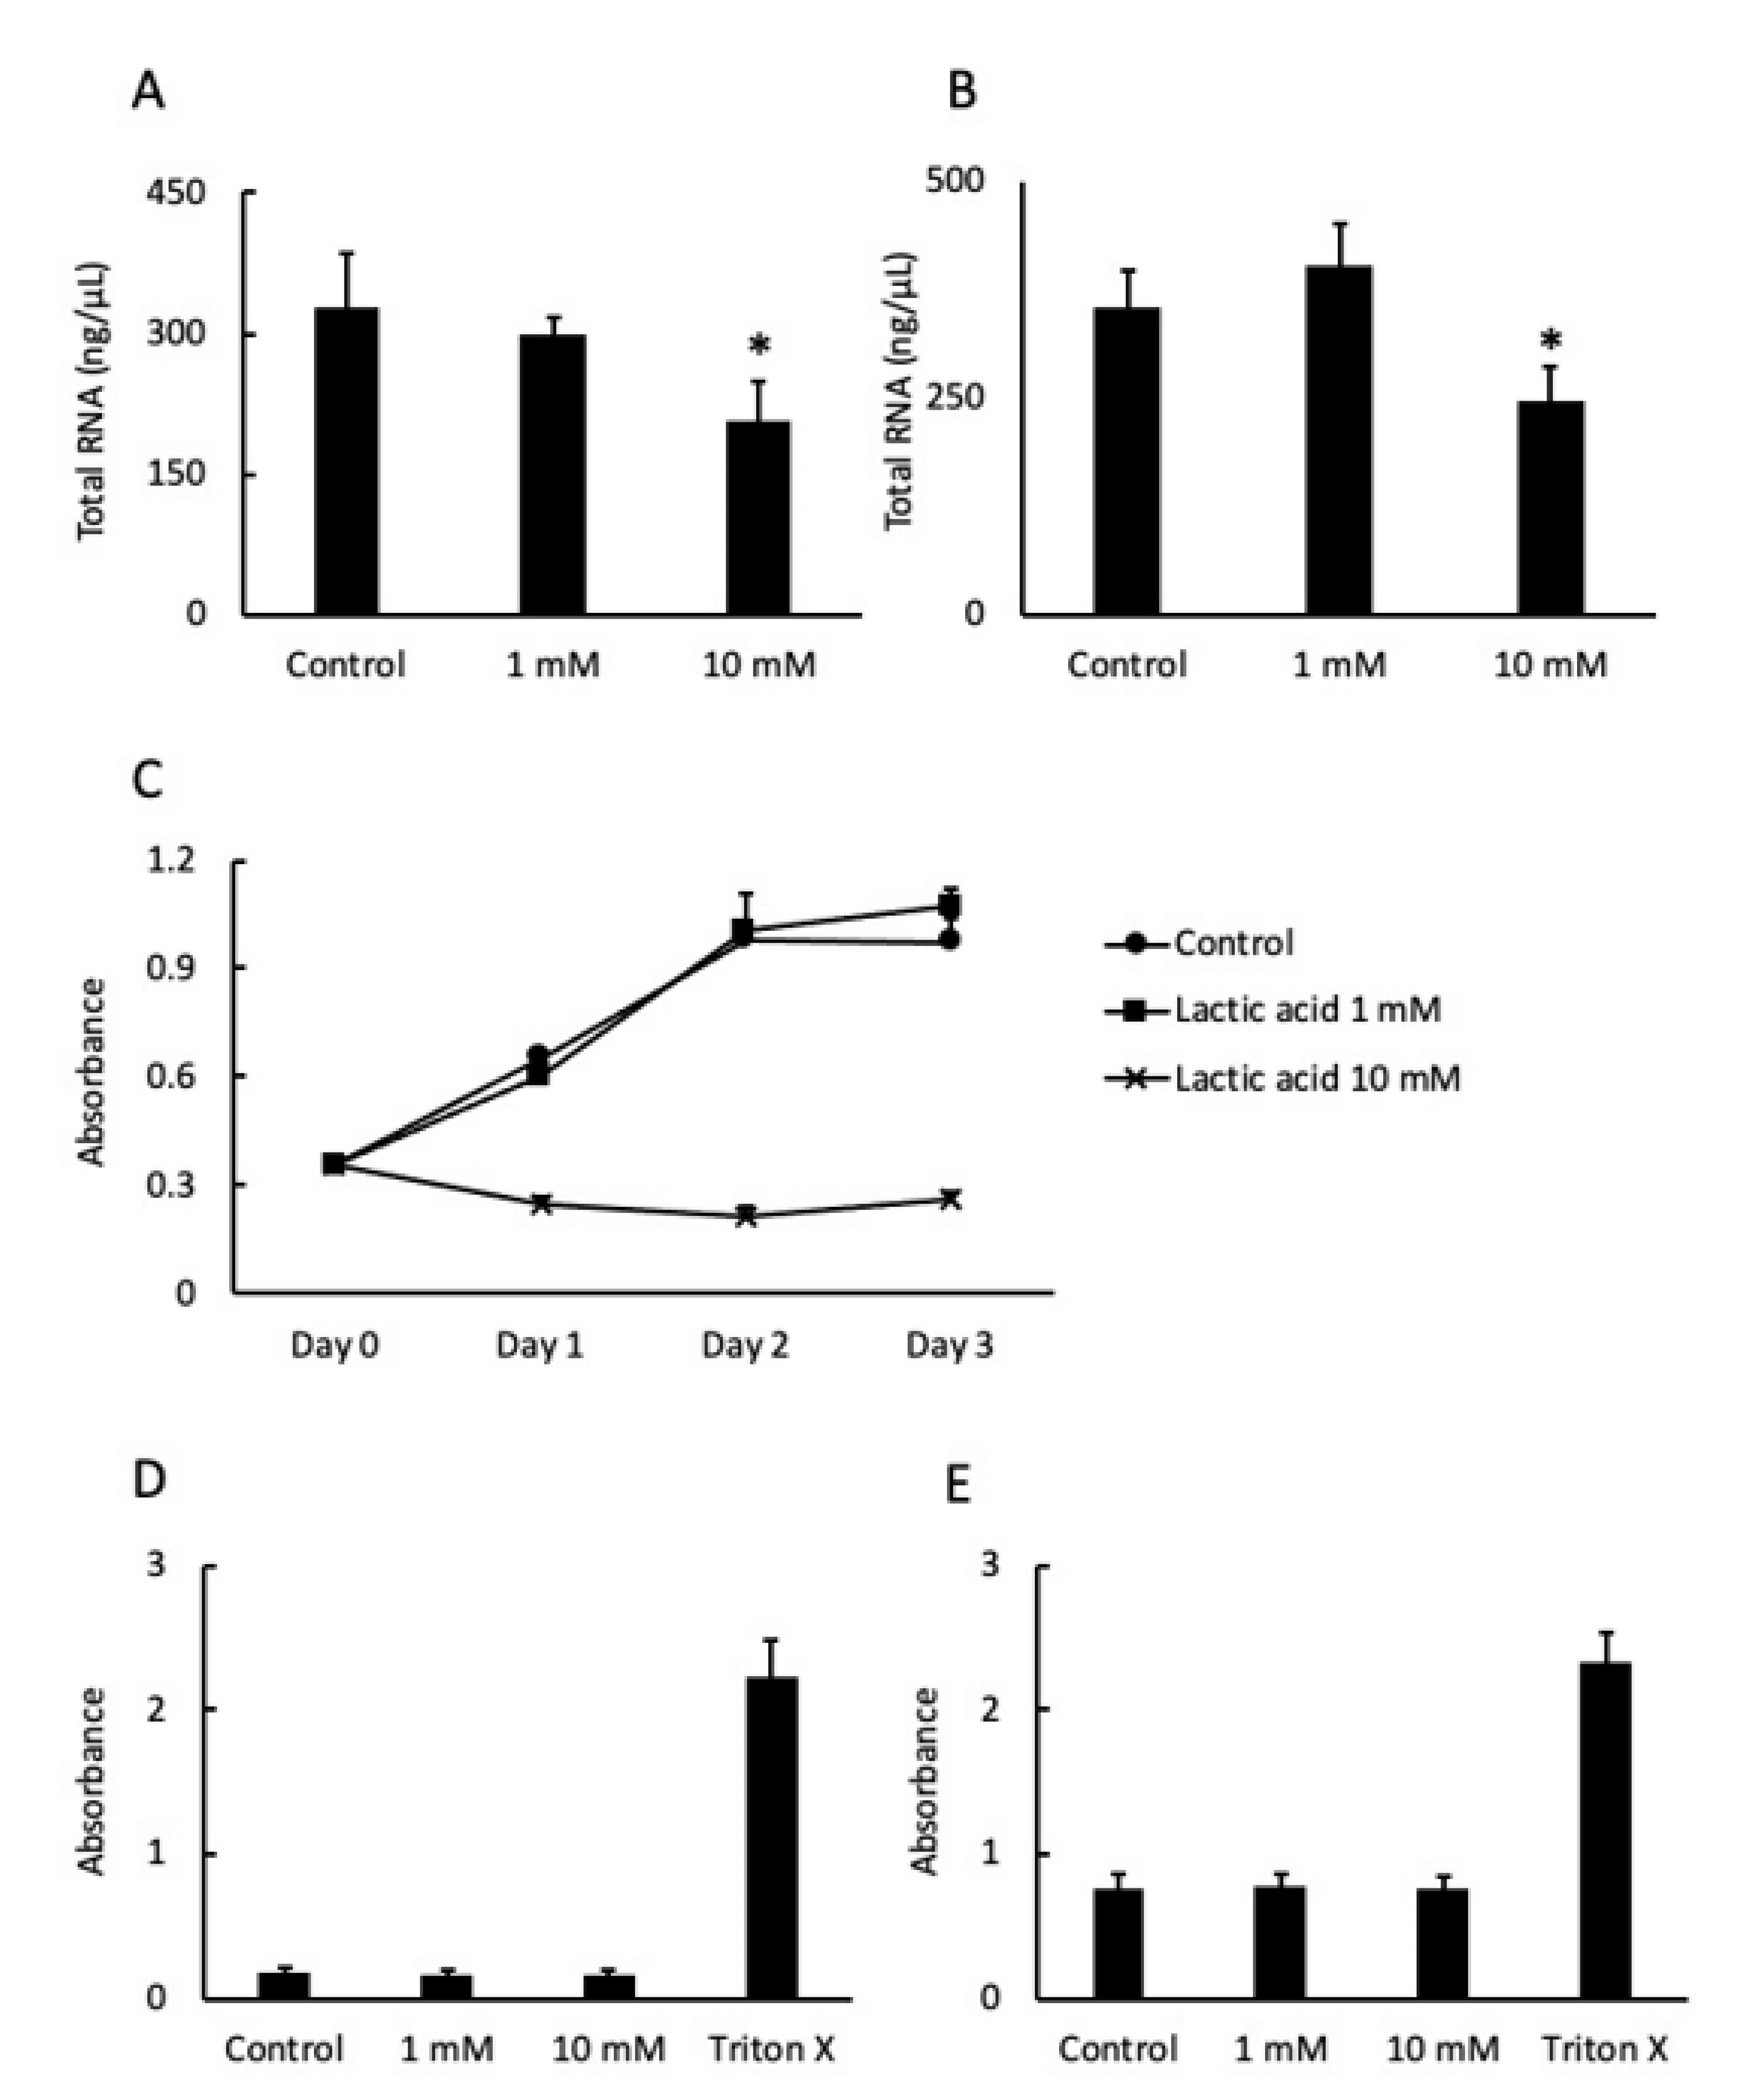
2.2. LA Affected Cell Proliferation
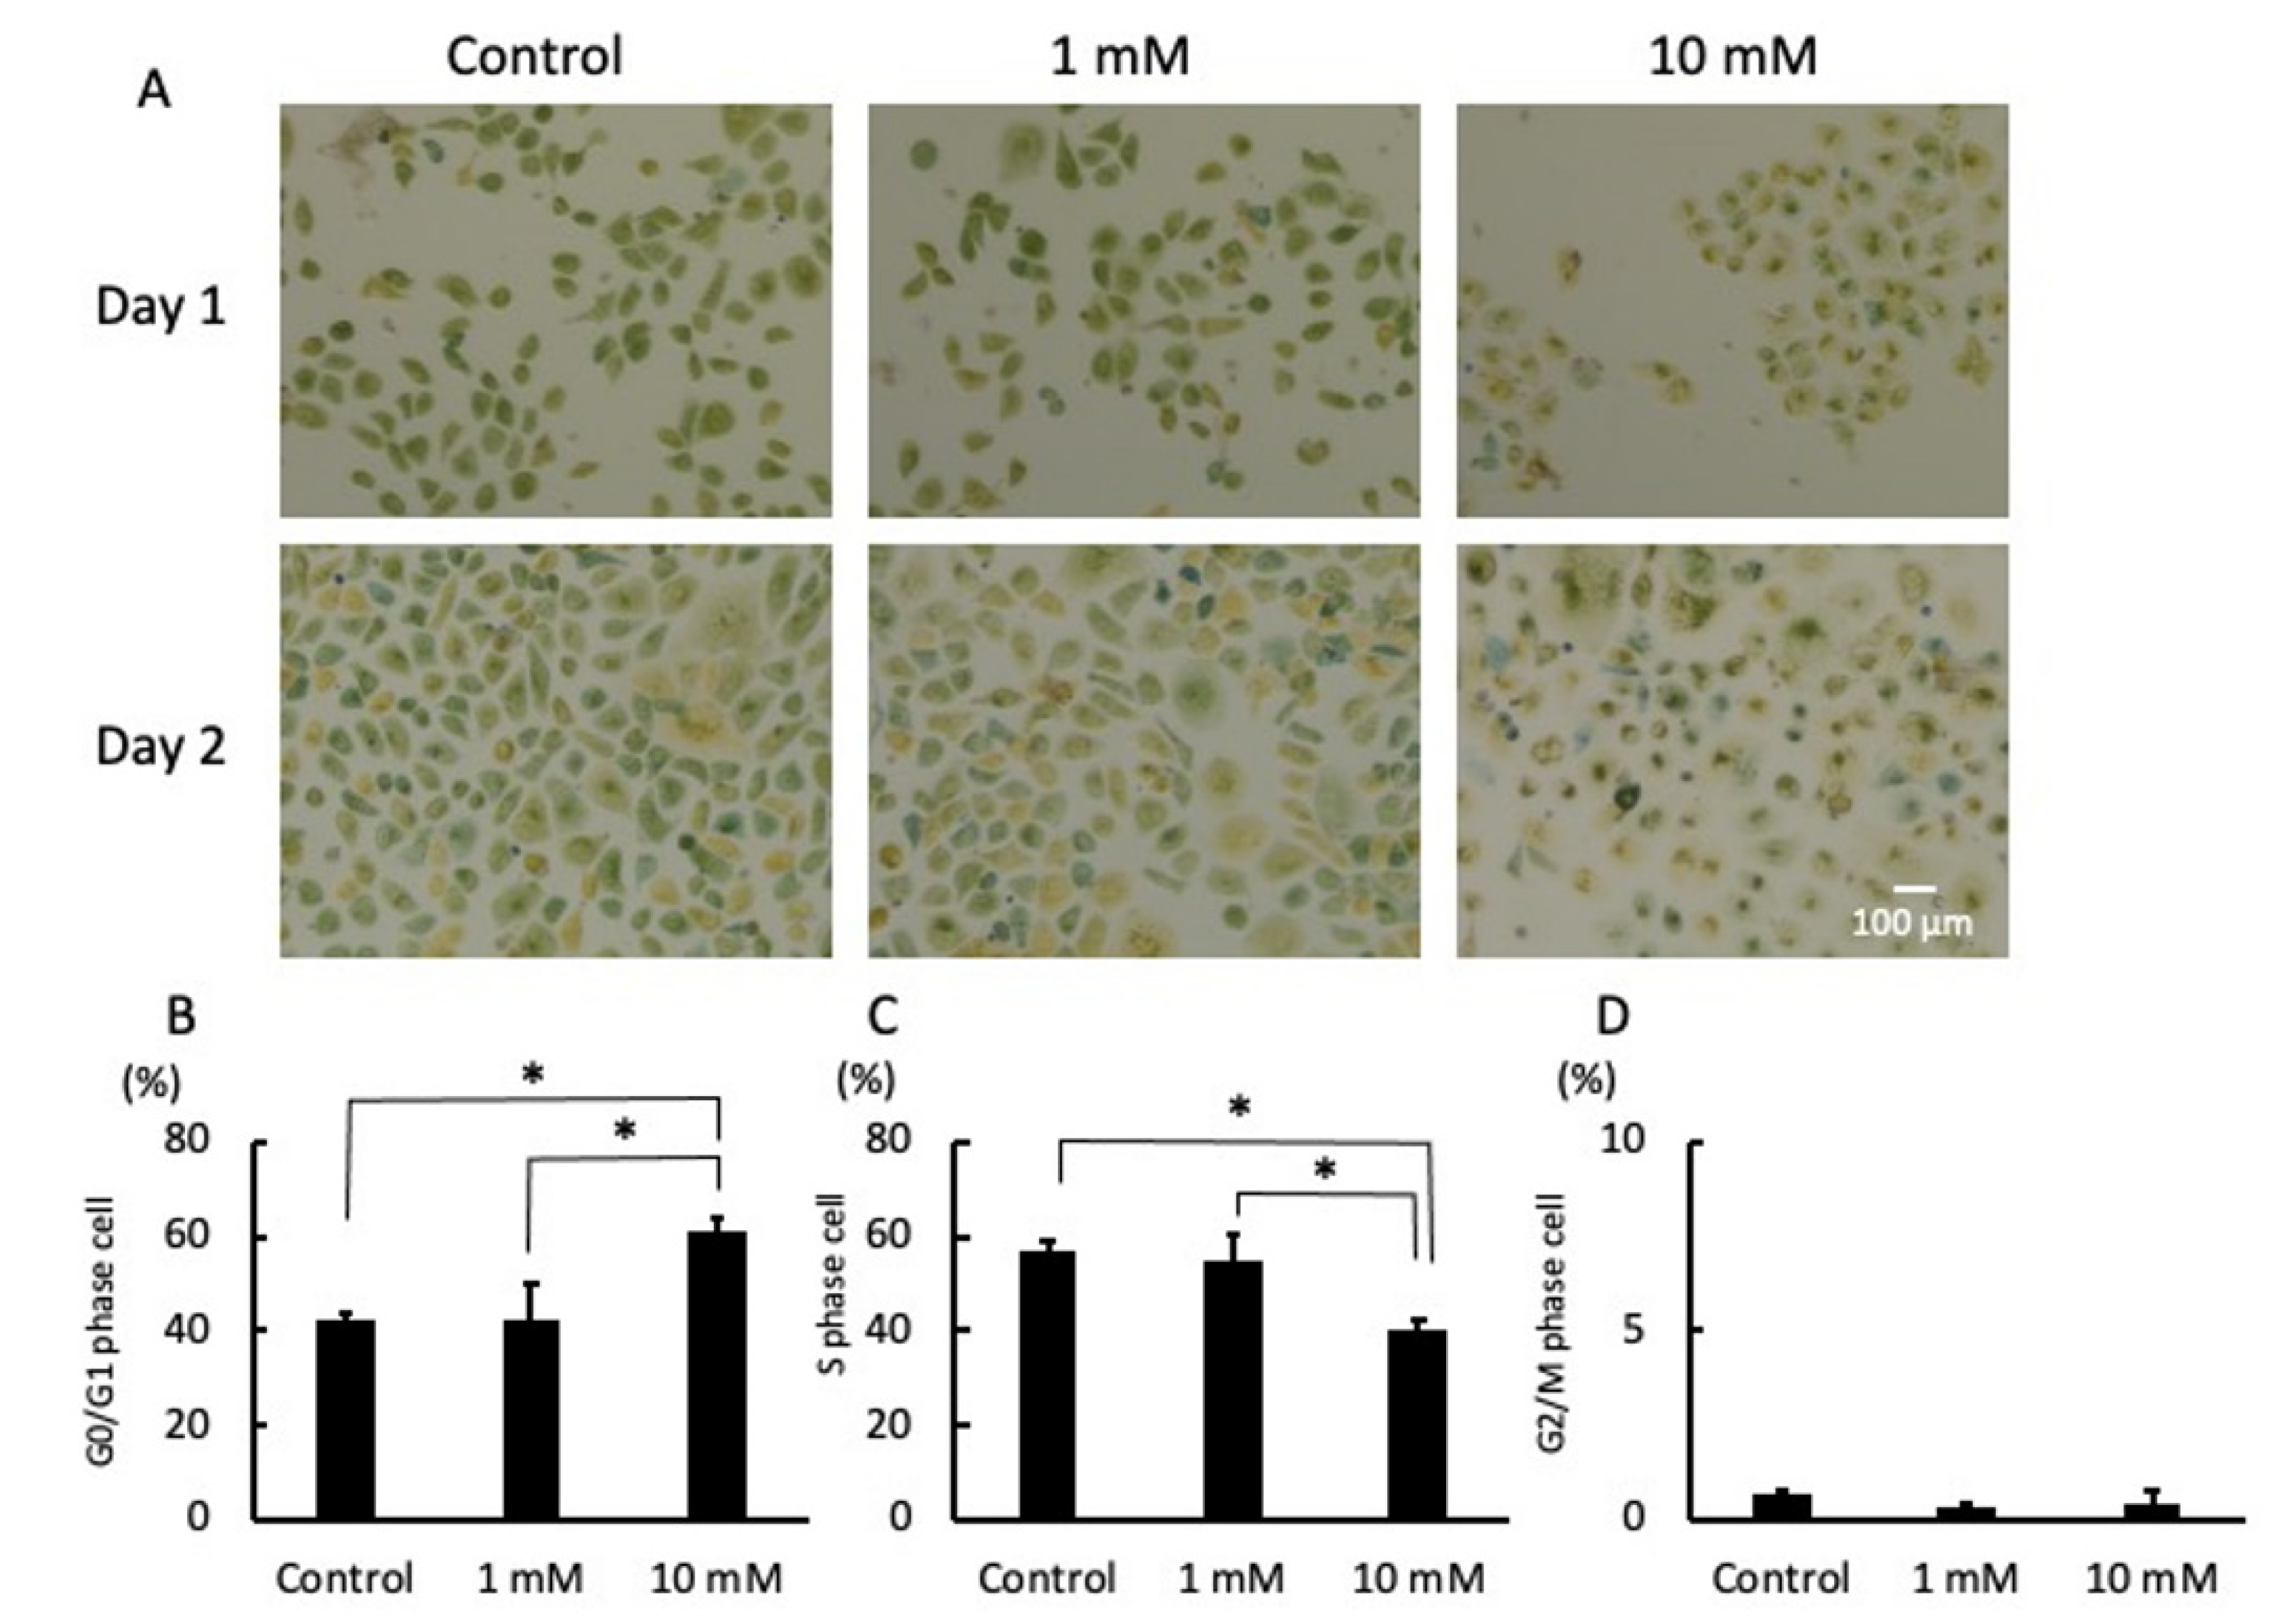
2.3. LA Interrupted Progression of the Cell Cycle
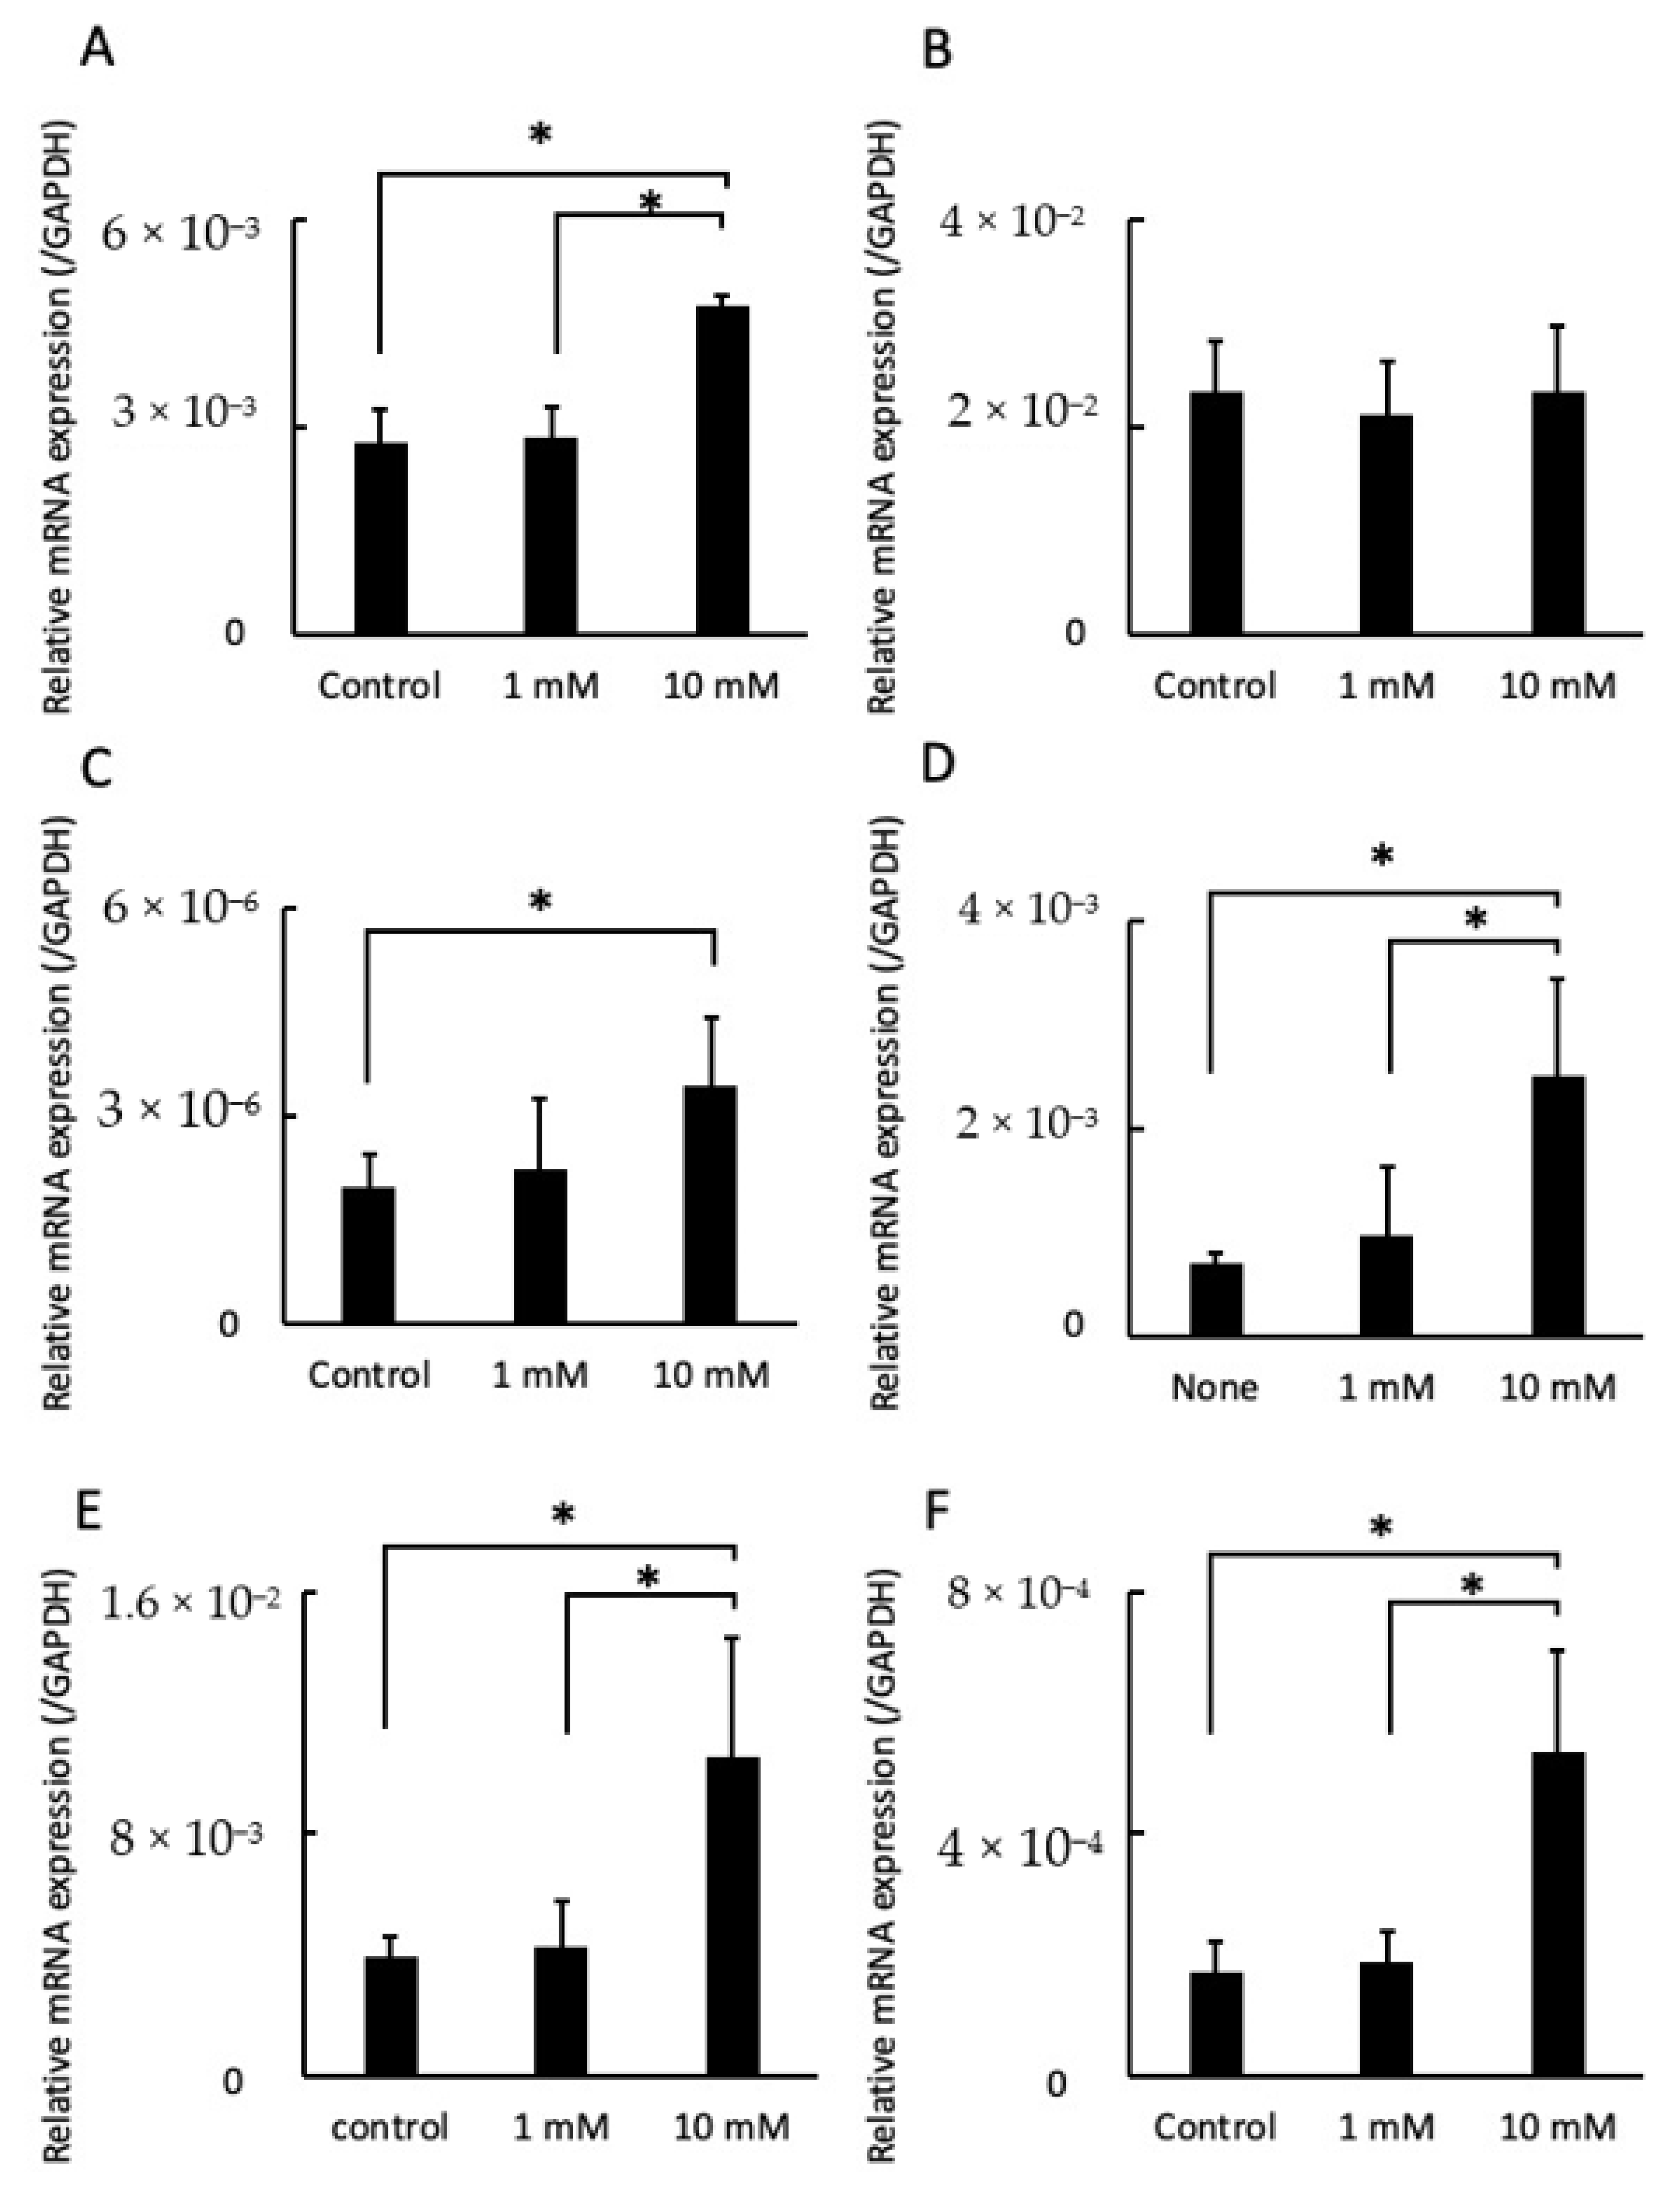
2.4. LA Influenced Gene Expression
3. Discussion
4. Materials and Methods
4.1. Cell Treatment
4.2. Scratch Assay
4.3. RNA Extraction
4.4. Cell Proliferation Assay
4.5. Cell Viability Assay
4.6. Cell Cycle Assay
4.7. Real-Time Quantitative Reverse-Transcription Polymerase Chain Reaction (qRT-PCR)
4.8. Statistical Analysis
Author Contributions
Funding
Institutional Review Board Statement
Informed Consent Statement
Data Availability Statement
Acknowledgments
Conflicts of Interest
References
- Masood, M.I.; Qadir, M.I.; Shirazi, J.H.; Khan, I.U. Beneficial effects of lactic acid bacteria on human beings. Crit. Rev. Microbiol. 2010, 37, 91–98. [Google Scholar] [CrossRef] [PubMed]
- Zielińska, D.; Kolożyn-Krajewska, D. Food-Origin Lactic Acid Bacteria May Exhibit Probiotic Properties: Review. BioMed Res. Int. 2018, 2018, 5063185. [Google Scholar] [CrossRef] [PubMed] [Green Version]
- Rajoka, M.S.R.; Shi, J.; Zhu, J.; Shao, D.; Huang, Q.; Yang, H.; Jin, M. Capacity of lactic acid bacteria in immunity enhancement and cancer prevention. Appl. Microbiol. Biotechnol. 2017, 101, 35–45. [Google Scholar] [CrossRef]
- Lai, W.-K.; Lu, Y.-C.; Hsieh, C.-R.; Wei, C.-K.; Tsai, Y.-H.; Chang, F.-R.; Chan, Y. Developing Lactic Acid Bacteria as an Oral Healthy Food. Life 2021, 11, 268. [Google Scholar] [CrossRef]
- Tap, J.; Mondot, S.; Levenez, F.; Pelletier, E.; Caron, C.; Furet, J.-P.; Ugarte, E.; Muñoz-Tamayo, R.; Paslier, D.L.; Nalin, R.; et al. Towards the human intestinal microbiota phylogenetic core. Environ. Microbiol. 2009, 11, 2574–2584. [Google Scholar] [CrossRef]
- Niederman, R.; Zhang, J.; Kashket, S. Short-Chain Carboxylic-Acid-Stimulated, PMN-Mediated Gingival Inflammation. Crit. Rev. Oral Biol. Med. 1997, 8, 269–290. [Google Scholar] [CrossRef]
- Dung, S.-Z.; Gregory, R.; Li, Y.; Stookey, G. Effect of Lactic Acid and Proteolytic Enzymes on the Release of Organic Matrix Components from Human Root Dentin. Caries Res. 1995, 29, 483–489. [Google Scholar] [CrossRef]
- Andersen, L.W.; Mackenhauer, J.; Roberts, J.C.; Berg, K.M.; Cocchi, M.N.; Donnino, M.W. Etiology and therapeutic approach to elevated lactate levels. Mayo Clin. Proc. 2013, 88, 1127–1140. [Google Scholar] [CrossRef] [Green Version]
- Kraut, J.A.; Madias, N.E. Lactic acidosis. N. Engl. J. Med. 2014, 371, 2309–2319. [Google Scholar] [CrossRef]
- Kalimo, H.; Rehncrona, S.; Söderfeldt, B.; Olsson, Y.; Siesjö, B.K. Brain Lactic Acidosis and Ischemic Cell Damage: 2. Histopathology. Br. J. Pharmacol. 1981, 1, 313–327. [Google Scholar] [CrossRef] [PubMed] [Green Version]
- Luo, Y.; Li, L.; Chen, X.; Gou, H.; Yan, K.; Xu, Y. Effects of lactate in immunosuppression and inflammation: Progress and prospects. Int. Rev. Immunol. 2021. [Google Scholar] [CrossRef]
- Kashket, S.; Zhang, J.; Niederman, R. Gingival Inflammation Induced by Food and Short-chain Carboxylic Acids. J. Dent. Res. 1998, 77, 412–417. [Google Scholar] [CrossRef] [PubMed]
- Jeng, J.-H.; Chan, C.-P.; Ho, Y.-S.; Lan, W.-H.; Hsieh, C.-C.; Chang, M.-C. Effects of Butyrate and Propionate on the Adhesion, Growth, Cell Cycle Kinetics, and Protein Synthesis of Cultured Human Gingival Fibroblasts. J. Periodontol. 1999, 70, 1435–1442. [Google Scholar] [CrossRef]
- Stehle, H.W.; Leblebicioglu, B.; Walters, J.D. Short-Chain Carboxylic Acids Produced by Gram-Negative Anaerobic Bacteria Can Accelerate or Delay Polymorphonuclear Leukocyte Apoptosis in Vitro. J. Periodontol. 2001, 72, 1059–1063. [Google Scholar] [CrossRef] [PubMed]
- Shirasugi, M.; Nakagawa, M.; Nishioka, K.; Yamamoto, T.; Nakaya, T.; Kanamura, N. Relationship between periodontal disease and butyric acid produced by periodontopathic bacteria. Inflamm. Regen. 2018, 38, 23. [Google Scholar] [CrossRef] [PubMed]
- Takigawa, S.; Sugano, N.; Nishihara, R.; Koshi, R.; Murai, M.; Yoshinuma, N.; Ochiai, K.; Ito, K. The effect of butyric acid on adhesion molecule expression by human gingival epithelial cells. J. Periodontal Res. 2008, 43, 386–390. [Google Scholar] [CrossRef] [PubMed]
- Ishikawa, T.; Sasaki, D.; Aizawa, R.; Shimoyama, Y.; Yamamoto, M.; Irié, T.; Sasaki, M. Effect of Butyric Acid in the Proliferation and Migration of Junctional Epithelium in the Progression of Periodontitis: An In Vitro Study. Dent. J. 2021, 9, 44. [Google Scholar] [CrossRef] [PubMed]
- Zhou, D.; Pan, Q.; Liu, X.; Yang, R.; Chen, Y.; Liu, C.; Fan, J. Clostridium butyricumB1 alleviates high-fat diet-induced steatohepatitis in mice via enterohepatic immunoregulation. J. Gastroenterol. Hepatol. 2017, 32, 1640–1648. [Google Scholar] [CrossRef]
- Furusawa, Y.; Obata, Y.; Fukuda, S.; Endo, T.A.; Nakato, G.; Takahashi, D.; Nakanishi, Y.; Uetake, C.; Kato, K.; Kato, T.; et al. Commensal microbe-derived butyrate induces the differentiation of colonic regulatory T cells. Nature 2013, 504, 446–450. [Google Scholar] [CrossRef]
- Shah, H.; Gharbia, S.; O’Toole, C. Assessment of the Relative Cytotoxicity ofPorphyromonas gingivalisCells, Products, and Components on Human Epithelial Cell Lines. J. Periodontol. 1992, 63, 44–51. [Google Scholar] [CrossRef]
- Xu, W.; Zhou, W.; Wang, H.; Liang, S. Roles of Porphyromonas gingivalis and its virulence factors in periodontitis. Adv. Protein Chem. Struct. Biol. 2020, 120, 45–84. [Google Scholar] [CrossRef]
- Hajishengallis, G.; Korostoff, J.M. Revisiting the Page & Schroeder model: The good, the bad and the unknowns in the periodontal host response 40 years later. Periodontol. 2000 2017, 75, 116–151. [Google Scholar] [CrossRef] [PubMed]
- Kinane, D.F. Causation and pathogenesis of periodontal disease. Periodontol. 2000 2001, 25, 8–20. [Google Scholar] [CrossRef] [PubMed]
- Lu, R.; Meng, H.; Gao, X.; Xu, L.; Feng, X. Effect of non-surgical periodontal treatment on short chain fatty acid levels in gingival crevicular fluid of patients with generalized aggressive periodontitis. J. Periodontal Res. 2014, 49, 574–583. [Google Scholar] [CrossRef] [PubMed]
- Qiqiang, L.; Huanxin, M.; Xuejun, G. Longitudinal study of volatile fatty acids in the gingival crevicular fluid of patients with periodontitis before and after nonsurgical therapy. J. Periodontal Res. 2012, 47, 740–749. [Google Scholar] [CrossRef] [PubMed]
- Schroeder, H.E.; Listgarten, M.A. The Junctional Epithelium: From Strength to Defense. J. Dent. Res. 2003, 82, 158–161. [Google Scholar] [CrossRef] [PubMed]
- Yajima-Himuro, S.; Oshima, M.; Yamamoto, G.; Ogawa, M.; Furuya, M.; Tanaka, J.; Nishii, K.; Mishima, K.; Tachikawa, T.; Tsuji, T.; et al. The junctional epithelium originates from the odontogenic epithelium of an erupted tooth. Sci. Rep. 2015, 4, 4867. [Google Scholar] [CrossRef]
- Seki, T.; Aizawa, R.; Tanaka, J.; Yajima-Himuro, S.; Kato, M.; Tanaka, K.; Mishima, K.; Yamamoto, M. Establishment of mouse gingival junctional epithelial cell line using a bioengineered tooth system. Biochem. Biophys. Res. Commun. 2018, 497, 167–172. [Google Scholar] [CrossRef]
- Dzink, J.L.; Tanner, A.C.R.; Haffajee, A.D.; Socransky, S.S. Gram negative species associated with active destructive periodontal lesions. J. Clin. Periodontol. 1985, 12, 648–659. [Google Scholar] [CrossRef]
- Socransky, S.S.; Haffajee, A.D.; Cugini, M.A.; Smith, C.; Kent, R.L., Jr. Microbial complexes in subgingival plaque. J. Clin. Periodontol. 1998, 25, 134–144. [Google Scholar] [CrossRef]
- Naruishi, K.; Nagata, T. Biological effects of interleukin-6 on Gingival Fibroblasts: Cytokine regulation in periodontitis. J. Cell. Physiol. 2018, 233, 6393–6400. [Google Scholar] [CrossRef]
- Bickel, M. The role of interleukin-8 in inflammation and mechanisms of regulation. J. Periodontol. 1993, 64, 456–460. [Google Scholar] [PubMed]
- Mlachkova, A.; Popova, C.; Doseva, V. Presence of IL-8 Gene Polymorphism and IL-8 Serum Levels in Patients with Chronic Periodontitis - Literature Review. Folia Medica 2020, 62, 253–257. [Google Scholar] [CrossRef] [PubMed]
- Wang, L.; Li, X.-H.; Ning, W.-C. Evaluation of ICAM-1 and VCAM-1 Gene Polymorphisms in Patients with Periodontal Disease. Med. Sci. Monit. 2016, 22, 2386–2391. [Google Scholar] [CrossRef] [PubMed] [Green Version]
- Tsukasaki, M.; Takayanagi, H. Osteoimmunology: Evolving concepts in bone–immune interactions in health and disease. Nat. Rev. Immunol. 2019, 19, 626–642. [Google Scholar] [CrossRef] [PubMed]
- Tsukasaki, M. RANKL and osteoimmunology in periodontitis. J. Bone Miner. Metab. 2021, 39, 82–90. [Google Scholar] [CrossRef]


Publisher’s Note: MDPI stays neutral with regard to jurisdictional claims in published maps and institutional affiliations. |
© 2021 by the authors. Licensee MDPI, Basel, Switzerland. This article is an open access article distributed under the terms and conditions of the Creative Commons Attribution (CC BY) license (https://creativecommons.org/licenses/by/4.0/).
Share and Cite
Ishikawa, T.; Sasaki, D.; Aizawa, R.; Yamamoto, M.; Yaegashi, T.; Irié, T.; Sasaki, M. The Role of Lactic Acid on Wound Healing, Cell Growth, Cell Cycle Kinetics, and Gene Expression of Cultured Junctional Epithelium Cells in the Pathophysiology of Periodontal Disease. Pathogens 2021, 10, 1507. https://doi.org/10.3390/pathogens10111507
Ishikawa T, Sasaki D, Aizawa R, Yamamoto M, Yaegashi T, Irié T, Sasaki M. The Role of Lactic Acid on Wound Healing, Cell Growth, Cell Cycle Kinetics, and Gene Expression of Cultured Junctional Epithelium Cells in the Pathophysiology of Periodontal Disease. Pathogens. 2021; 10(11):1507. https://doi.org/10.3390/pathogens10111507
Chicago/Turabian StyleIshikawa, Taichi, Daisuke Sasaki, Ryo Aizawa, Matsuo Yamamoto, Takashi Yaegashi, Tarou Irié, and Minoru Sasaki. 2021. "The Role of Lactic Acid on Wound Healing, Cell Growth, Cell Cycle Kinetics, and Gene Expression of Cultured Junctional Epithelium Cells in the Pathophysiology of Periodontal Disease" Pathogens 10, no. 11: 1507. https://doi.org/10.3390/pathogens10111507