A New Approach to Teaching Emotional Design

School of Knowledge Science, Japan Advanced Institute of Science and Technology, Nomi 923-1292, Japan
*
Author to whom correspondence should be addressed.
Soc. Sci. 2020, 9(11), 210; https://doi.org/10.3390/socsci9110210
Submission received: 4 August 2020
/
Revised: 7 October 2020
/
Accepted: 12 November 2020
/
Published: 18 November 2020
Abstract
:Emotional design focuses on providing intended users with a positive emotional experience. Thus far, the concept of emotional design has primarily been restricted to the fields of research and industry. Most professionals using emotional design slowly acquired the required skills by experience and without direct education. Teaching emotional design to design students has been overlooked due to its difficulty. This research introduces a new approach to teaching emotional design, which aims to prevent negative influences from being added to the products created by design students. A systematic method is introduced to make it easier for inexperienced design students to grasp emotional design. Students are first taught proper methods of data collection to determine users’ emotional requirements. Students are then taught how to summarize the data, as well as develop feasibility testing strategies to obtain promising ideas. The proposed teaching approach for emotional design has been proven efficient in the case study course conducted in this research. Graduate-level design students learned how to design products according to users’ emotional requirements. The students successfully produced several designs that clearly provided positive user experiences.
1. Introduction
In 2004, emotional design emerged as a product design concept for making products that would give their intended users a positive emotional experience (Norman 2004). In 2006, emotional design became the focus of interest of both designers and researchers (Denton and McDonagh 2006). “Emotion-focused design” was the term used in the first conference of design and emotion (Desmet and Hekkert 2009; Cupchik 1999). Several research groups have attempted to develop tools and techniques to improve emotion-focused design (Sacharin et al. 2012; Cowie et al. 2000; Watson et al. 1988). Van Gorp and Adams (2012) stated that emotions can deeply influence the overall user experience. Sáenz et al. (2019) added that understanding the users’ feelings and emotions is vital in the design process. Recently, seeking to achieve a positive emotional experience for users has been recognized as a crucial component of product design (Violante et al. 2019).
There has been limited research into methods of teaching emotional design for the purpose of achieving a positive emotional experience for users. Most of the historic research in this area did not include the teaching of emotional design to students. Some current academic design courses briefly introduce the concept of emotional design to students without training them sufficiently in emotional design methods. The Interaction Design Foundation provides such a course online: “Emotional Design—How to Make Products People Will Love” is based on Norman’s three levels of emotional design theory (visceral, behavioral, and reflective design). The course aims to provide information to students that will enable them to embed positive emotional experiences in their design. The contents of the course are not publicly available for a more detailed analysis.
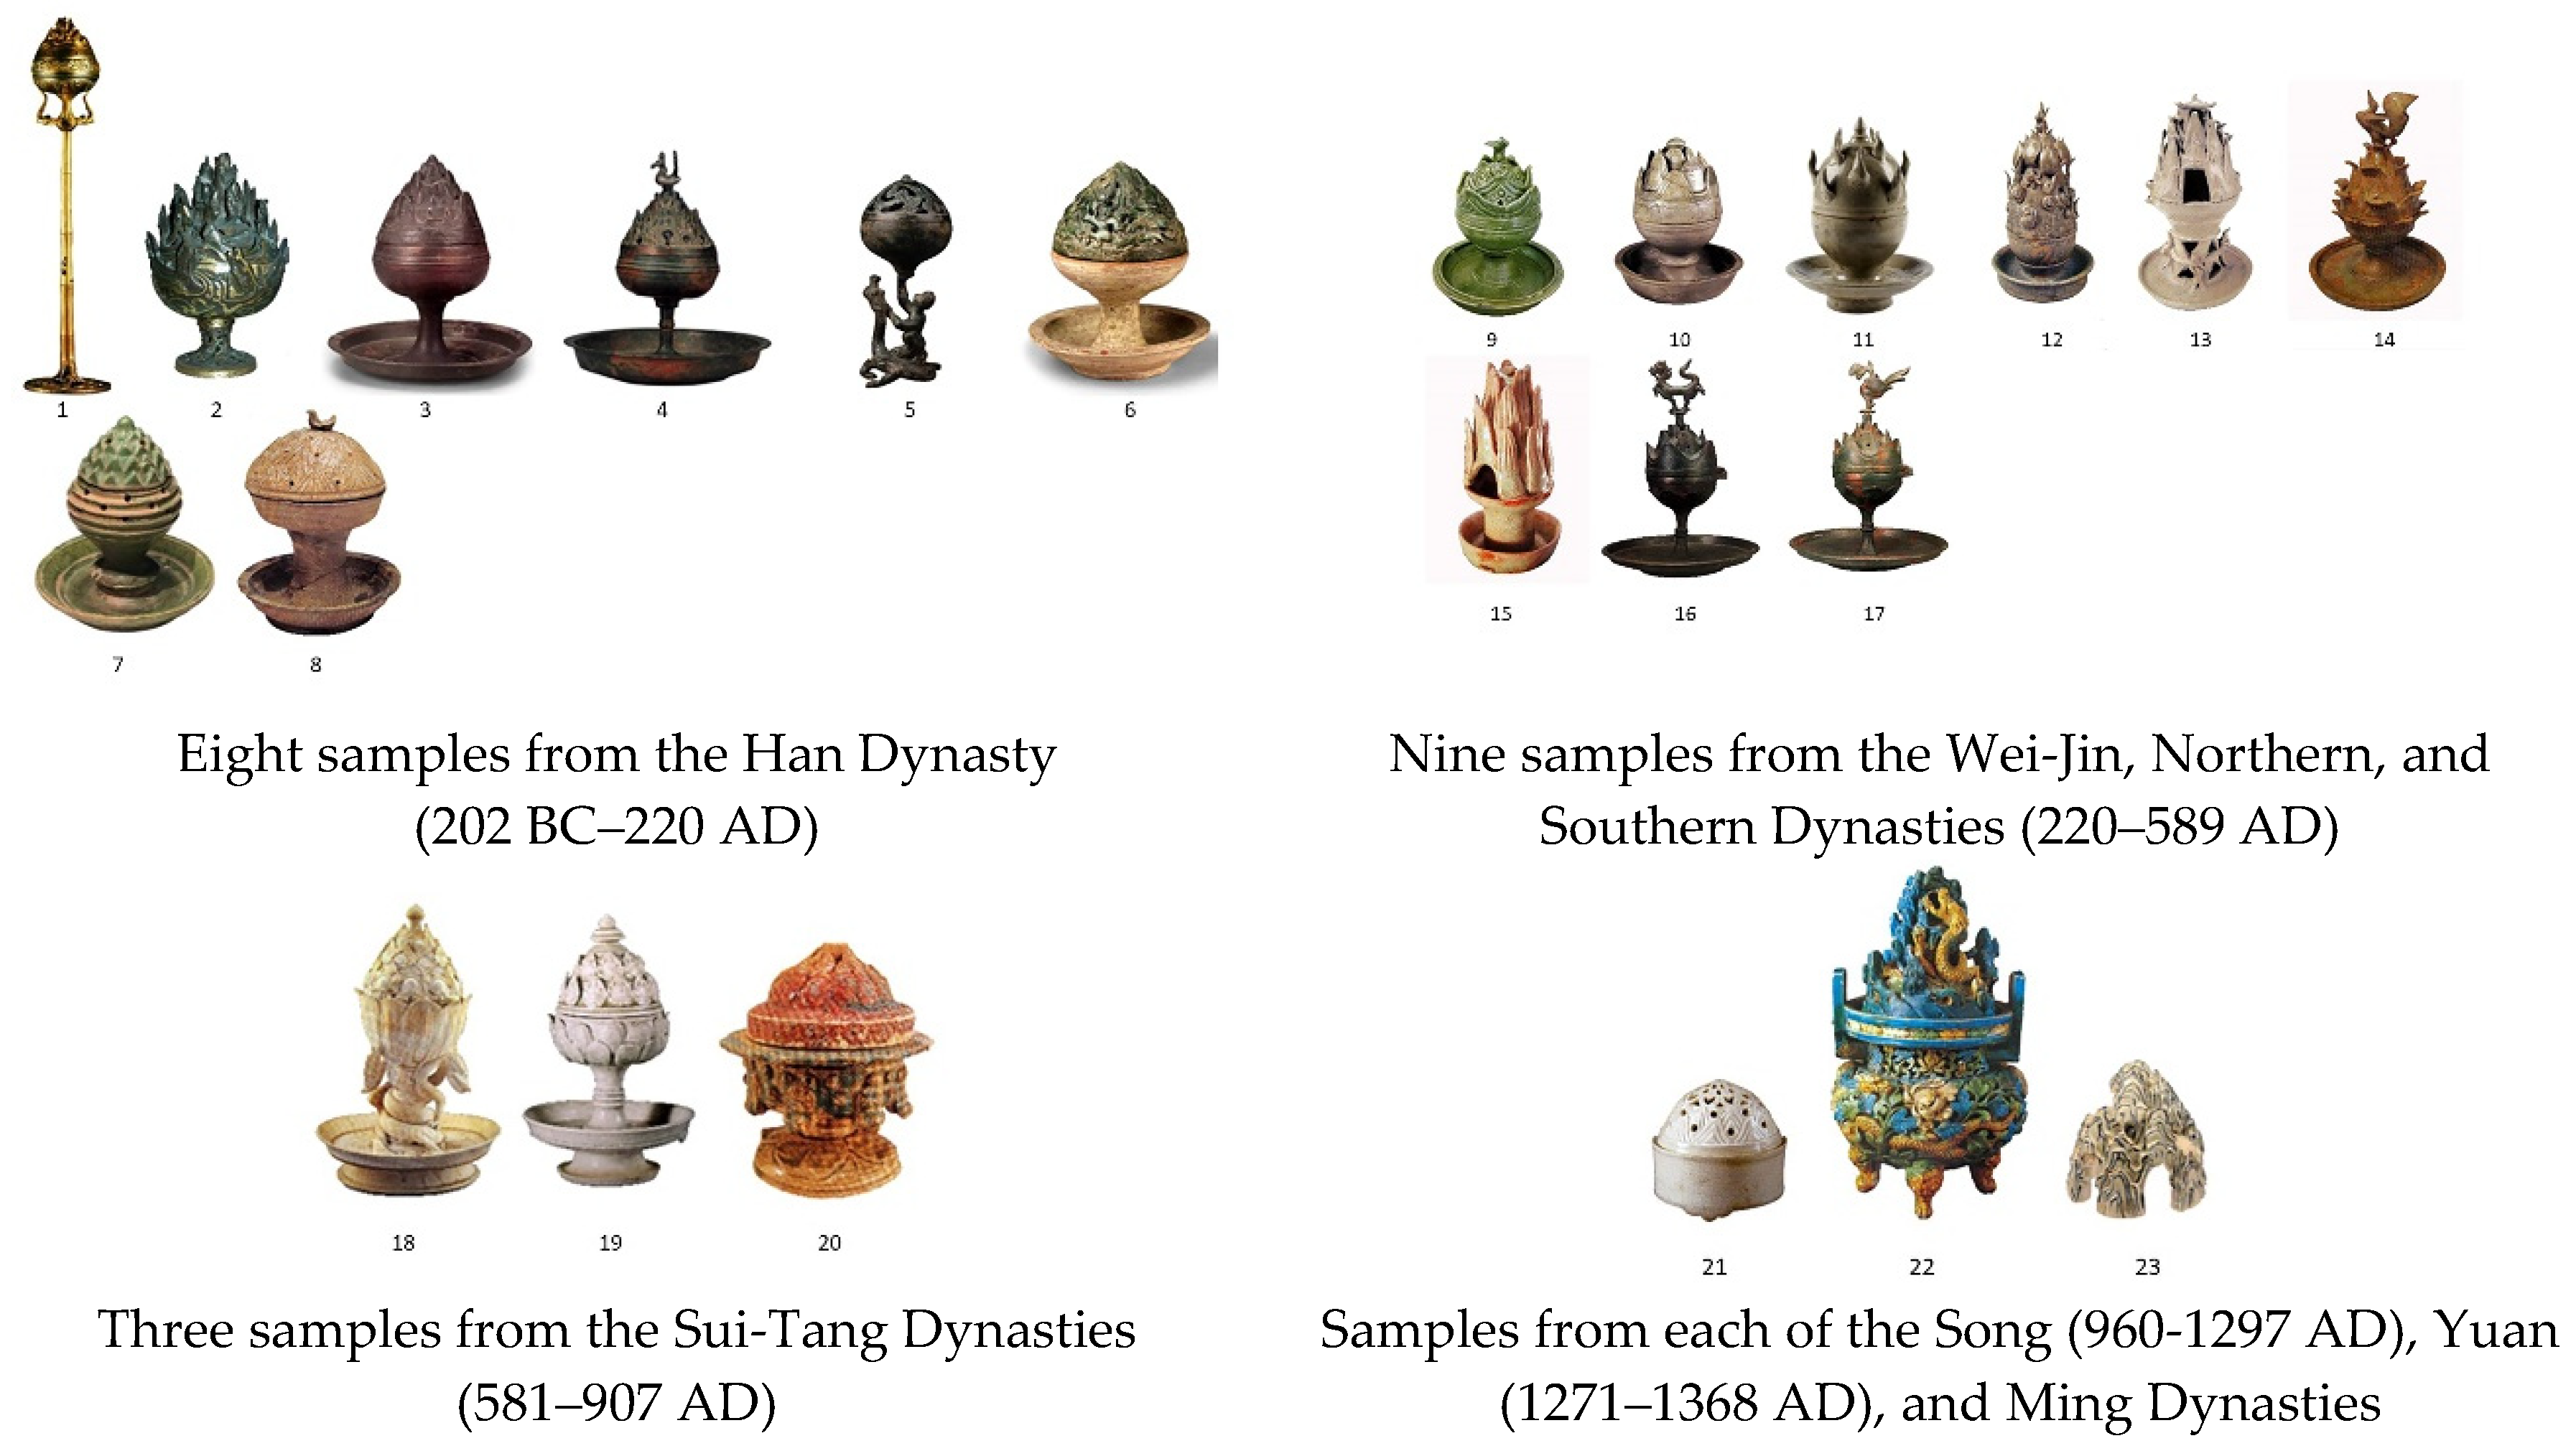
The case study in this research was an online product design course taken by 10 graduate students from the Jingdezhen Ceramic Institute (JCI) in 20201. We selected the boshanlu as the product to be studied during the course. A boshanlu is a kind of hill-shaped censer; it represents an evident variation in the history of incense burners worldwide, which notably prevailed during the Han Dynasty (202 BC–220 AD). H. Wu (2010) noted that the boshanlus that were popular in the Western Han Dynasty were more than just hill-shaped censers carved with auspicious patterns. Boshanlus projected ancient Chinese views of the universe, creation, and aesthetics (Erickson 1992; Rawson 2006). In this research, experts selected 23 historical samples for study, spanning from the Han to the Ming Dynasty (1368–1644 AD), as shown in Figure 1.
In the proposed teaching approach, the case study course was conducted in two phases, i.e., research and analysis (RA) and design and evaluation (DE). In the first step of the RA phase, the students learned and applied multiple data collection methods. At the beginning of the course, they co-created with the teacher to prepare for interviews with selected regular product users. The aim of that step was to determine what the users thought of the selected product samples. In the second step of the RA phase, the teacher taught the students to apply content analysis and semantic networks to the interview transcripts. The students and the teacher extracted codes and generalized themes from the interview transcripts. In the last step of the RA phase, the teacher collaborated with students to summarize the design strategies developed from the results of the content analysis step.
In the first step of the DE phase, the students used the design strategies developed in the first phase to design hill censers. In the second step, the students’ designs were evaluated using emotional metrics to identify the positive emotional influences on the users.
The remainder of this paper is organized as follows: this section presents the significance of this research and its purpose, with a brief introduction into the case study and some historical background. Section 2 discusses the research methods utilized in the case study, namely content analysis, semantic networks, and methodological triangulation. Section 3 presents the data collection step of the RA phase used in this research. Section 4 discusses the findings obtained from the content and semantic network analyses of the case study. Section 5 summarizes the design strategies developed in the third step of the RA phase. The DE phase of the case study is also presented, during which the new designs were evaluated. Section 6 presents the conclusions of the research.
2. Methodology
2.1. Content Analysis
After the concept of content analysis was introduced in the 18th century (Rosengren 1981), it took some time before it began to be used as an analytical tool (Barcus 1959). Initially, researchers used content analysis either as a qualitative or a quantitative method (Berelson 1952; Morgan 1993; Graneheim and Lundman 2004). Later, it was primarily utilized as a quantitative tool for coding textual data into categories before these were analyzed using statistical approaches (Hsieh and Shannon 2005).
Content analysis is a systematic, flexible, and replicable method. It is mainly used to condense many words from texts into fewer categories based on predefined explicit rules of coding (Berelson 1952; Weber 1990; Cavanagh 1997; Stemler 2001). Weber noted that content analysis can be a useful method for discovering and describing the focus of an individual, group, institution, or society. “It also allows inferences to be made, which can then be corroborated using other data collection methods” (Stemler 2001).
In this research, qualitative content analysis was used as a teaching tool in the case study course. The transcripts from each interview were first read carefully to discover the manifest and latent meanings within them. According to Graneheim and Lundman’s approach, the meaning units, condensed meaning units, and codes can be extracted and then sorted into types under higher-order code headings. Finally, the information is formulated into a general theme based on summarizing or abstracting the categories.
2.2. Semantic Network
Since the concept of the semantic network was introduced decades ago, it has been utilized in sociology, psychology, information science, and computer science (Quillian and Minsky 1968). The semantic network is a basis for knowledge modeling and representation (Helbig 2006), offering an operable framework for the development of scientific applications (Drieger 2013). Recently, several studies using semantic networks have focused on products, services, or branding (Han et al. 2017; Lee and Lim 2019). A semantic network presents highly connected nodes constructed using a tree of subgraphs with some degree thresholds (Drieger 2013).
A semantic network filters and counts high-frequency words based on the interrelations between those words. Further numeric processing of the relations between the words reveals structural relations. A semantic network structure diagram is then generated showing the hierarchical relations and the degrees of closeness of high-frequency words. Finally, the diagram can be analyzed intuitively.
ROST CM 6.0 (ROST Content System, ROST CM is developed by Wuhan University, China) is a well-developed and proven content analysis package. It can analyze a series of texts from offline or online sources. Its features include word segmentation, word frequency statistics, cluster analysis, and emotional analysis. In this research, we built a semantic network using ROST CM 6.0 to study the relationships between the vocabularies. The obtained relations helped designers to determine users’ emotional requirements when studying their emotional experiences from textual data.
2.3. Methodological Triangulation
Triangulation is a mathematical method used to determine the location of a fixed point based on trigonometric laws (Hales 2010). In the 1970s, triangulation went beyond the boundaries of mathematics and was used as a social science method. Triangulation now refers to the combination of multiple methodologies to study the same phenomenon to enhance confidence in results and develop a better research design (Goertz 2016; Denzin 1970; Mathison 1988; Park et al. 2016).
Denzin (1970) defined the following four basic types of triangulation: data, investigator, theory, and methodological. That research utilized methodological triangulation, which has also been given other names: multimethod, mixed-method and methods triangulation (Greene and Caracelli 1997). By using multimethod triangulation, the biases that are usually attributed to a single method can be eliminated (Tonkin-Crine et al. 2016). According to Tonkin-Crine et al. (2016), methodological triangulation can easily combine qualitative and quantitative approaches in the same study (Lincoln and Guba 2000; Mitchell 1986).
For the case study course in this research, we used qualitative content analysis to analyze data. We also employed ROST CM 6.0 software to analyze the same data to generate semantic networks. Using the methodological triangulation approach to combine both analysis methods increased the reliability of the analysis results.
3. Data Collection
3.1. Participants
The subjects to be interviewed were chosen carefully to ensure they had sufficient previous experience with the product being designed (censers in the case study described here). Designers or design professionals conducted interviews in person with the participants for an adequate time duration with well-prepared questions to determine the emotional experiences of the participants. In our case study, the teacher joined the 10 graduate students in interviewing 76 subjects and each interview lasted 45–60 min.
Eight of the students had a background in industrial design and two of the students had an engineering background. All students were registered in regular JCI graduate programs and had to take the course for credit. The students joined the graduate program right after finishing their bachelor’s degrees. Seven of them were female.
The students went through searching online to choose their subjects. The subjects were chosen based on their having had regular long-term experience with using censers. The subjects’ age range was 20–60 years. Out of 76 subjects, 51 were female. In the RA phase, the subjects were first interviewed and then answered questionnaires. The interviews were conducted online or face-to-face depending on the situation. The subjects also helped to evaluate the new designs produced by the students in the DE phase. During the DE phase, more subjects joined the evaluation and they were chosen using the same criteria as for the original 76 subjects.
Five experts with an industrial design background were also invited to participate in this case study. All five were from the JCI product design department (three associate professors and two professors). The experts first picked the 23 boshanlu samples used in the RA phase. The experts chose them based on the classical form and historical influence of the samples. Later in the RA phase, they participated with the students in step two of the content analysis.
3.2. Questionnaire
In this step, designers or design researchers employed a sub-structured interview technique to collect data about the product to be designed. Based on emotional experiences, two kinds of questions were asked during the interviews; the first was related to pleasant emotional experiences and the second was related to unpleasant experiences.
The questions shown in Table 1 are an example of the type of sub-structured interview carried out. The questions were prepared through group discussion with designers and professionals according to two basic emotional dimensions, i.e., like/dislike and pleasant/unpleasant. Questions in each group should first determine whether or not the subjects like each sample. The questions also check whether the sample is perceived as pleasant or unpleasant. Questions should further target the reasons for the subjects’ emotional responses.
In the case study course, the 10 students prepared three similar primary questions for each of four possibilities in the two-dimensional emotional space. The questions were used to guide the conducted interviews with each of the 76 subjects about every product sample from the 23 selected samples. The interviewers tried to persuade the subjects to detail their emotional responses to the samples, ultimately obtaining 76 interview records.
4. Data Analysis
4.1. Meaning Units, Condensed Meaning Units, and Codes
In the first step of the RA phase, the records obtained from the interviews were summarized into one condensed transcript. In the second step, meaning units were extracted by co-creation with professionals (designers and professors). Content analysis was performed to extract the meaning units, condensed meaning units, and codes from the condensed transcript.
In the case study course, the five invited design professors took the role of professional experts and conducted extended discussions. The condensed text was generalized into 31 and 20 meaning units from the like/pleasant and dislike/unpleasant categories, respectively. After further discussion, the condensed meaning units and codes were agreed upon. The most frequently mentioned meaning units chosen by the 76 interviewed subjects are shown in Table 2 and Table 3. Both tables show the summarized meaning units and the corresponding condensed meaning units as well as the codes for both like/pleasant and dislike/unpleasant. Table 2 shows the results of the above analysis of pleasant features in hill censers, whereas Table 3 shows the analysis results for unpleasant features.
4.2. Codes, Categories, and Themes
After generalizing the codes from the condensed meaning units, those codes were classified into code types (Code type is equivalent to sub-category), then into categories and themes. The designers again co-created with professionals to determine the codes and generalize them into themes. This analysis process was also carried out using content analysis, similar to the process followed in the previous step for obtaining condensed meaning units and codes from meaning units.
The code types were chosen from the codes already obtained, then those codes were divided according to the chosen types. The codes were listed under the assigned code type in a descending order according to the frequency of their appearance in the collected data. There was no specific column-wise ordering. For example, in Table 4, the first column of code types, “emotional experience”, shows that the code “elegant” has the highest frequency over the other codes in the same column.
Next, the code types were used to determine generalized categories. The important generalized categories were chosen and combined into the main theme that described the data collected. This was used as the main guide for providing innovative design ideas. Group discussion was used as the basis of this step. A similar content analysis process was used to build a table similar to the one shown in Table 4. Such tables are used to clearly guide designers seeking innovative ideas for new products.
In the case study course, the teacher organized discussions with the five invited professors and the 10 students about the codes for both the pleasant and unpleasant categories. After a three-hour discussion, each code was divided into seven types as follows: “emotional experience”, “craft”, “usability”, “style”, “form”, “color”, and “decoration”. The code types are shown at the top of Table 4. The seven code types were generalized into four categories: “emotional experience”, “craft”, “usability”, and “design style”. Out of these four categories, “emotional experience”, “craft”, and “usability” were given the same titles as their corresponding code types. The other code types (style, form, color, and decoration) were combined into the “design style” category. The four categories obtained are shown in the middle of Table 4. “Emotional experience” and “design style” were the essential categories chosen to form the theme “Emotional experience and design style” for this case study (bottom of Table 4).
The design students in the case study course used Table 4 to guide them when seeking ideas for the designs of their new products. They focused on the important categories forming the obtained theme, i.e., emotional experience and design style. The two code types with high frequencies mentioned by subjects were then chosen, namely emotional experience and form. Thirteen codes fell into the “emotional experience” category, including “elegant” and “artistic conception”2, both of which had the highest frequency vocabularies. Accordingly, the hill censers with these features could easily elicit pleasant feelings, thus the future designs should adhere to those factors. Similarly, under the “form” code type, the frequencies of the codes show that hill and lotus shapes elicit pleasant feelings. As for other code types, bright color, light hue, modern, fashionable, or traditional were characteristics that could increase pleasant feelings.
Similarly, Table 5 was used for the characteristics of the censers with unpleasant features. For both the categories and the theme, the results with respect to unpleasant features in hill censers were the same as those for the pleasant features. Under the code type “emotional experience”, shabby form could easily elicit unpleasant feelings. Additionally, under the code type “form”, irregular or spinous shapes could result in unpleasant (unsafe) feelings. The “non-hill-shaped” code under the “form” code type showed low approval levels for non–hill-shaped censers. Under the “craft” code type, it is understandable that “rough” is present, as this typically represents low quality.
4.3. Semantic Network Analysis
This part of the research analyzed the data collected from interview transcripts using tools such as ROST CM 6.0 to determine the semantic network structures for both the positive and negative emotional aspects. Nodes having a strong positive emotional sense are associated with the likelihood of offering a positive emotional experience to future users of the product being designed, whereas nodes having a strong negative emotional sense are associated with inducing negative feelings.
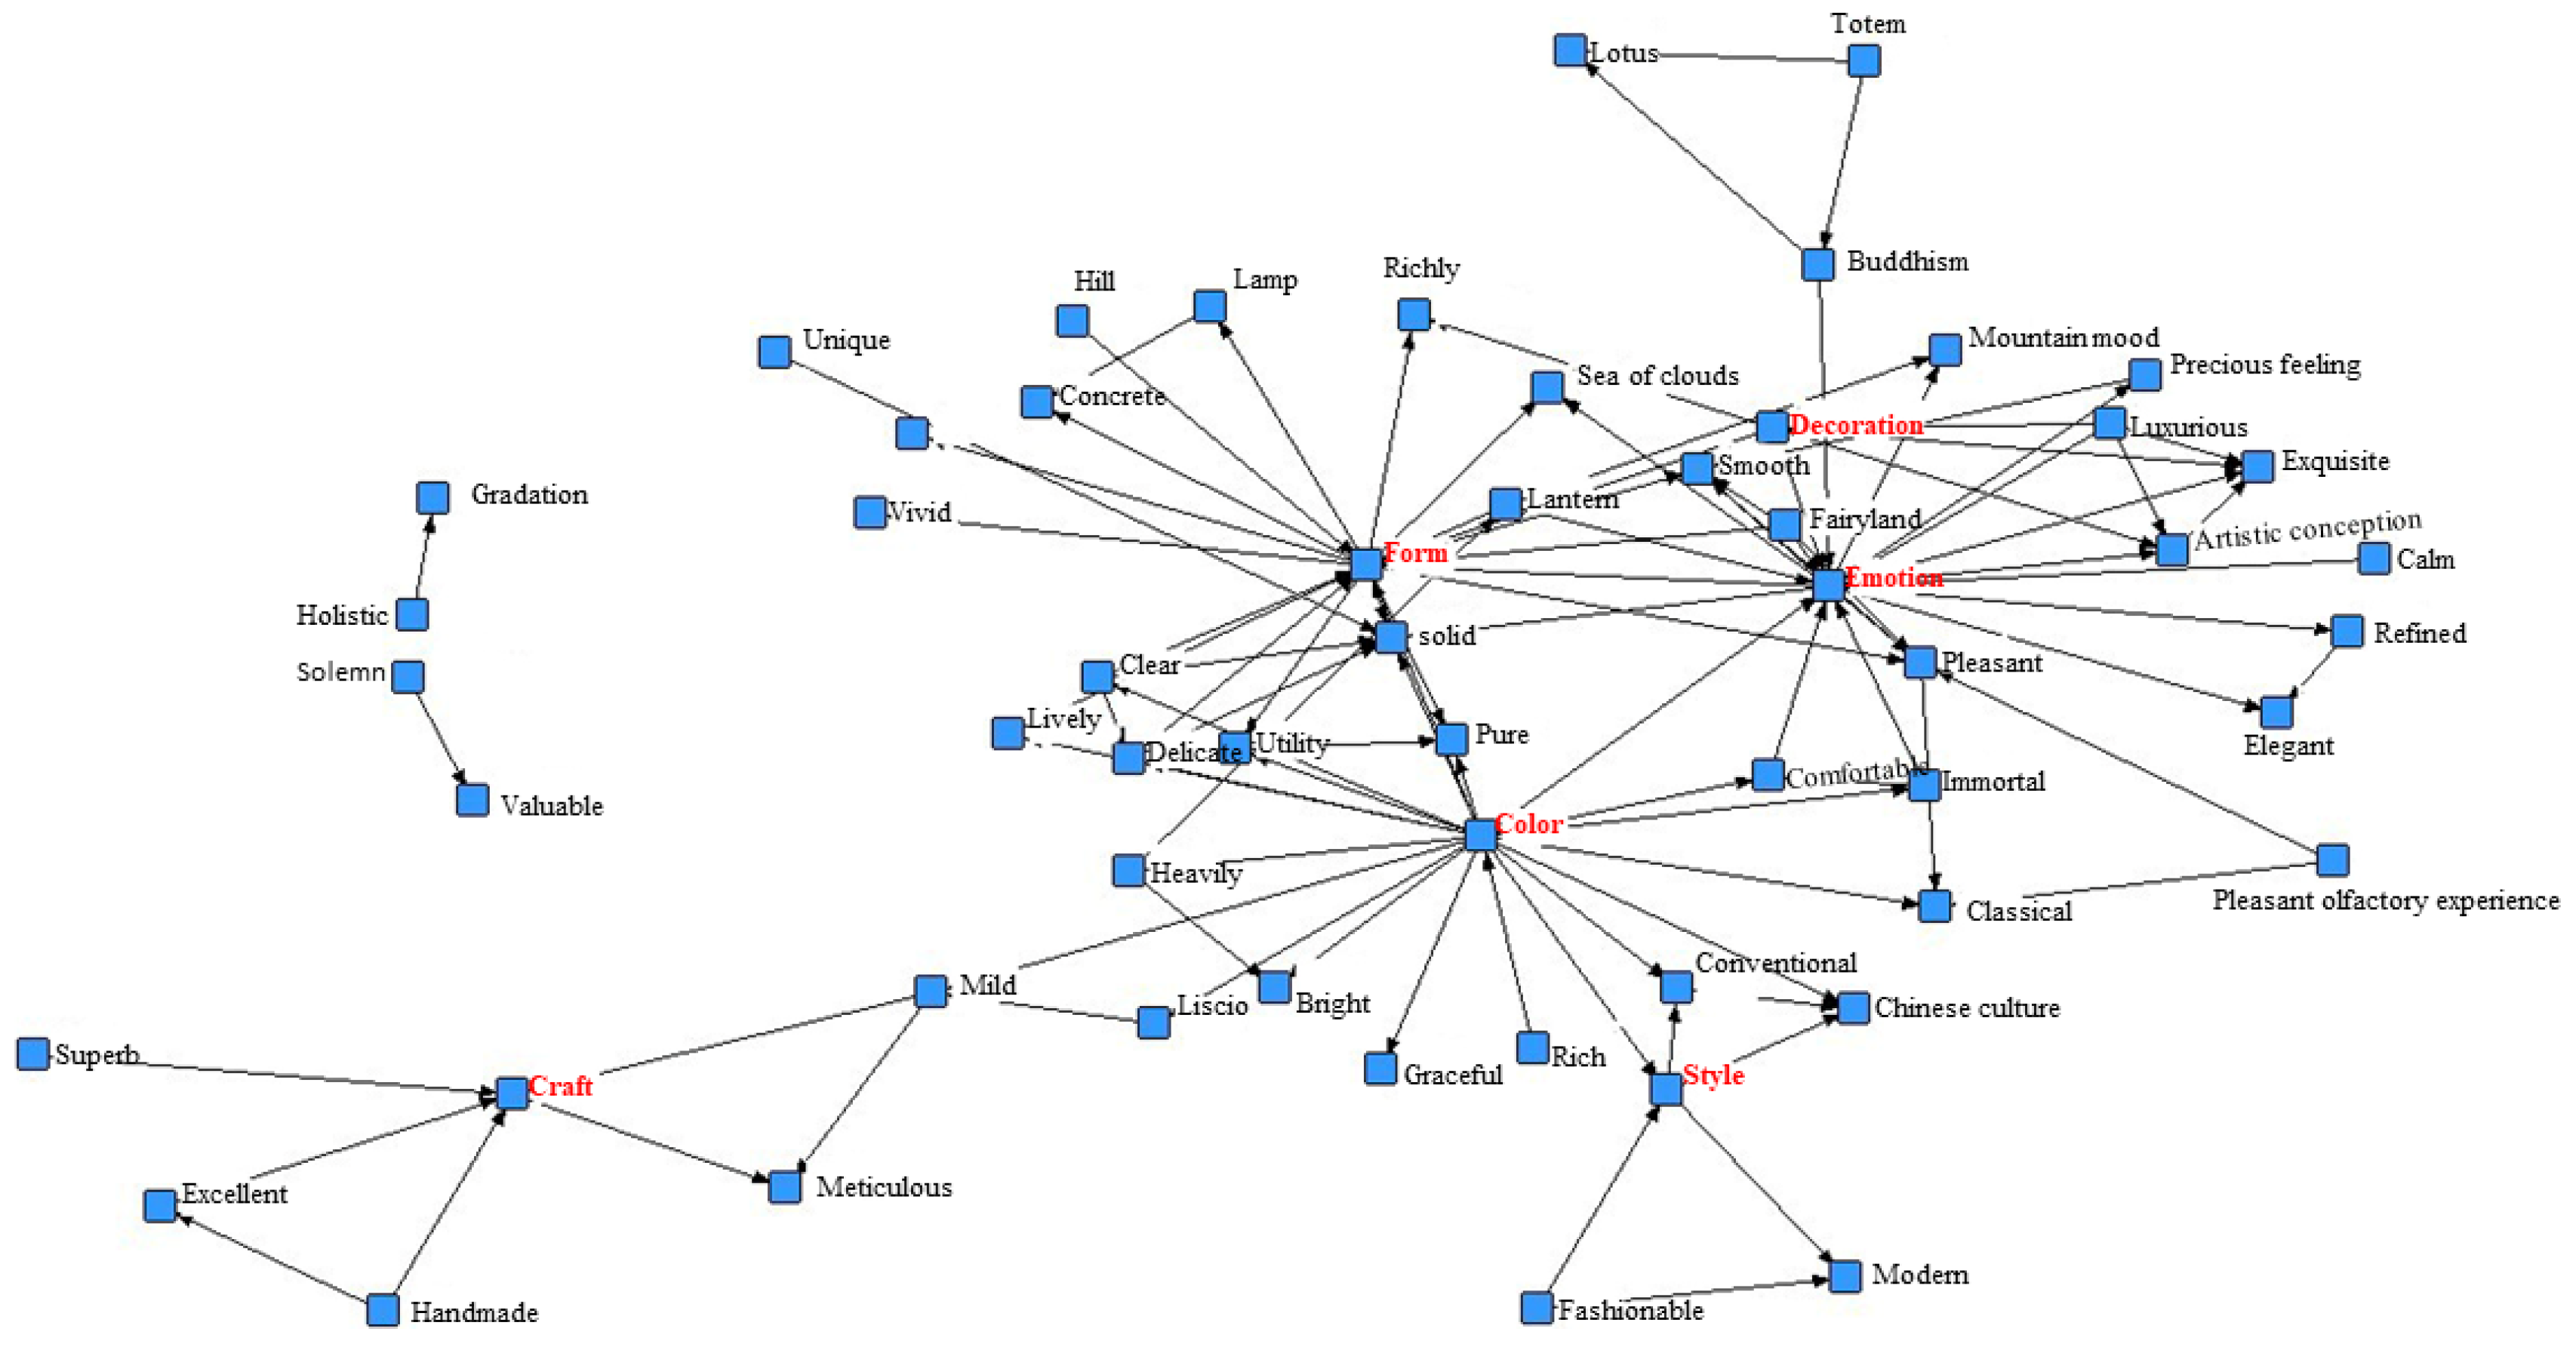
The semantic network shows the relationships between the high-frequency vocabulary words. Those words are shown in the network as nodes connected by lines. The thickness of the lines reflects the co-occurrence frequency of the corresponding vocabularies. The thicker the line, the closer the relation between those two words. The density of the arrows around words shows that those words have high frequencies in the collected data.
Designers are advised to adhere to the nodes relating to positive feelings and avoid nodes relating to unpleasant feelings when designing future products. This is a key principle in emotional design. In this case study, Figure 2 and Figure 3 show positive and negative emotional aspects, respectively. In both figures, the subjects focused on the nodes “form”, “decoration”, “emotion”, “color”, and “craft”. In Figure 2, the central node structure is “emotion”, which is directly connected with the nodes “form”, “color”, and “decoration”. The “color” node is tightly connected to the nodes “style” and “craft”. The node “emotion” is additionally linked to other nodes, e.g., “comfortable”, “exquisite”, “elegant”, etc.
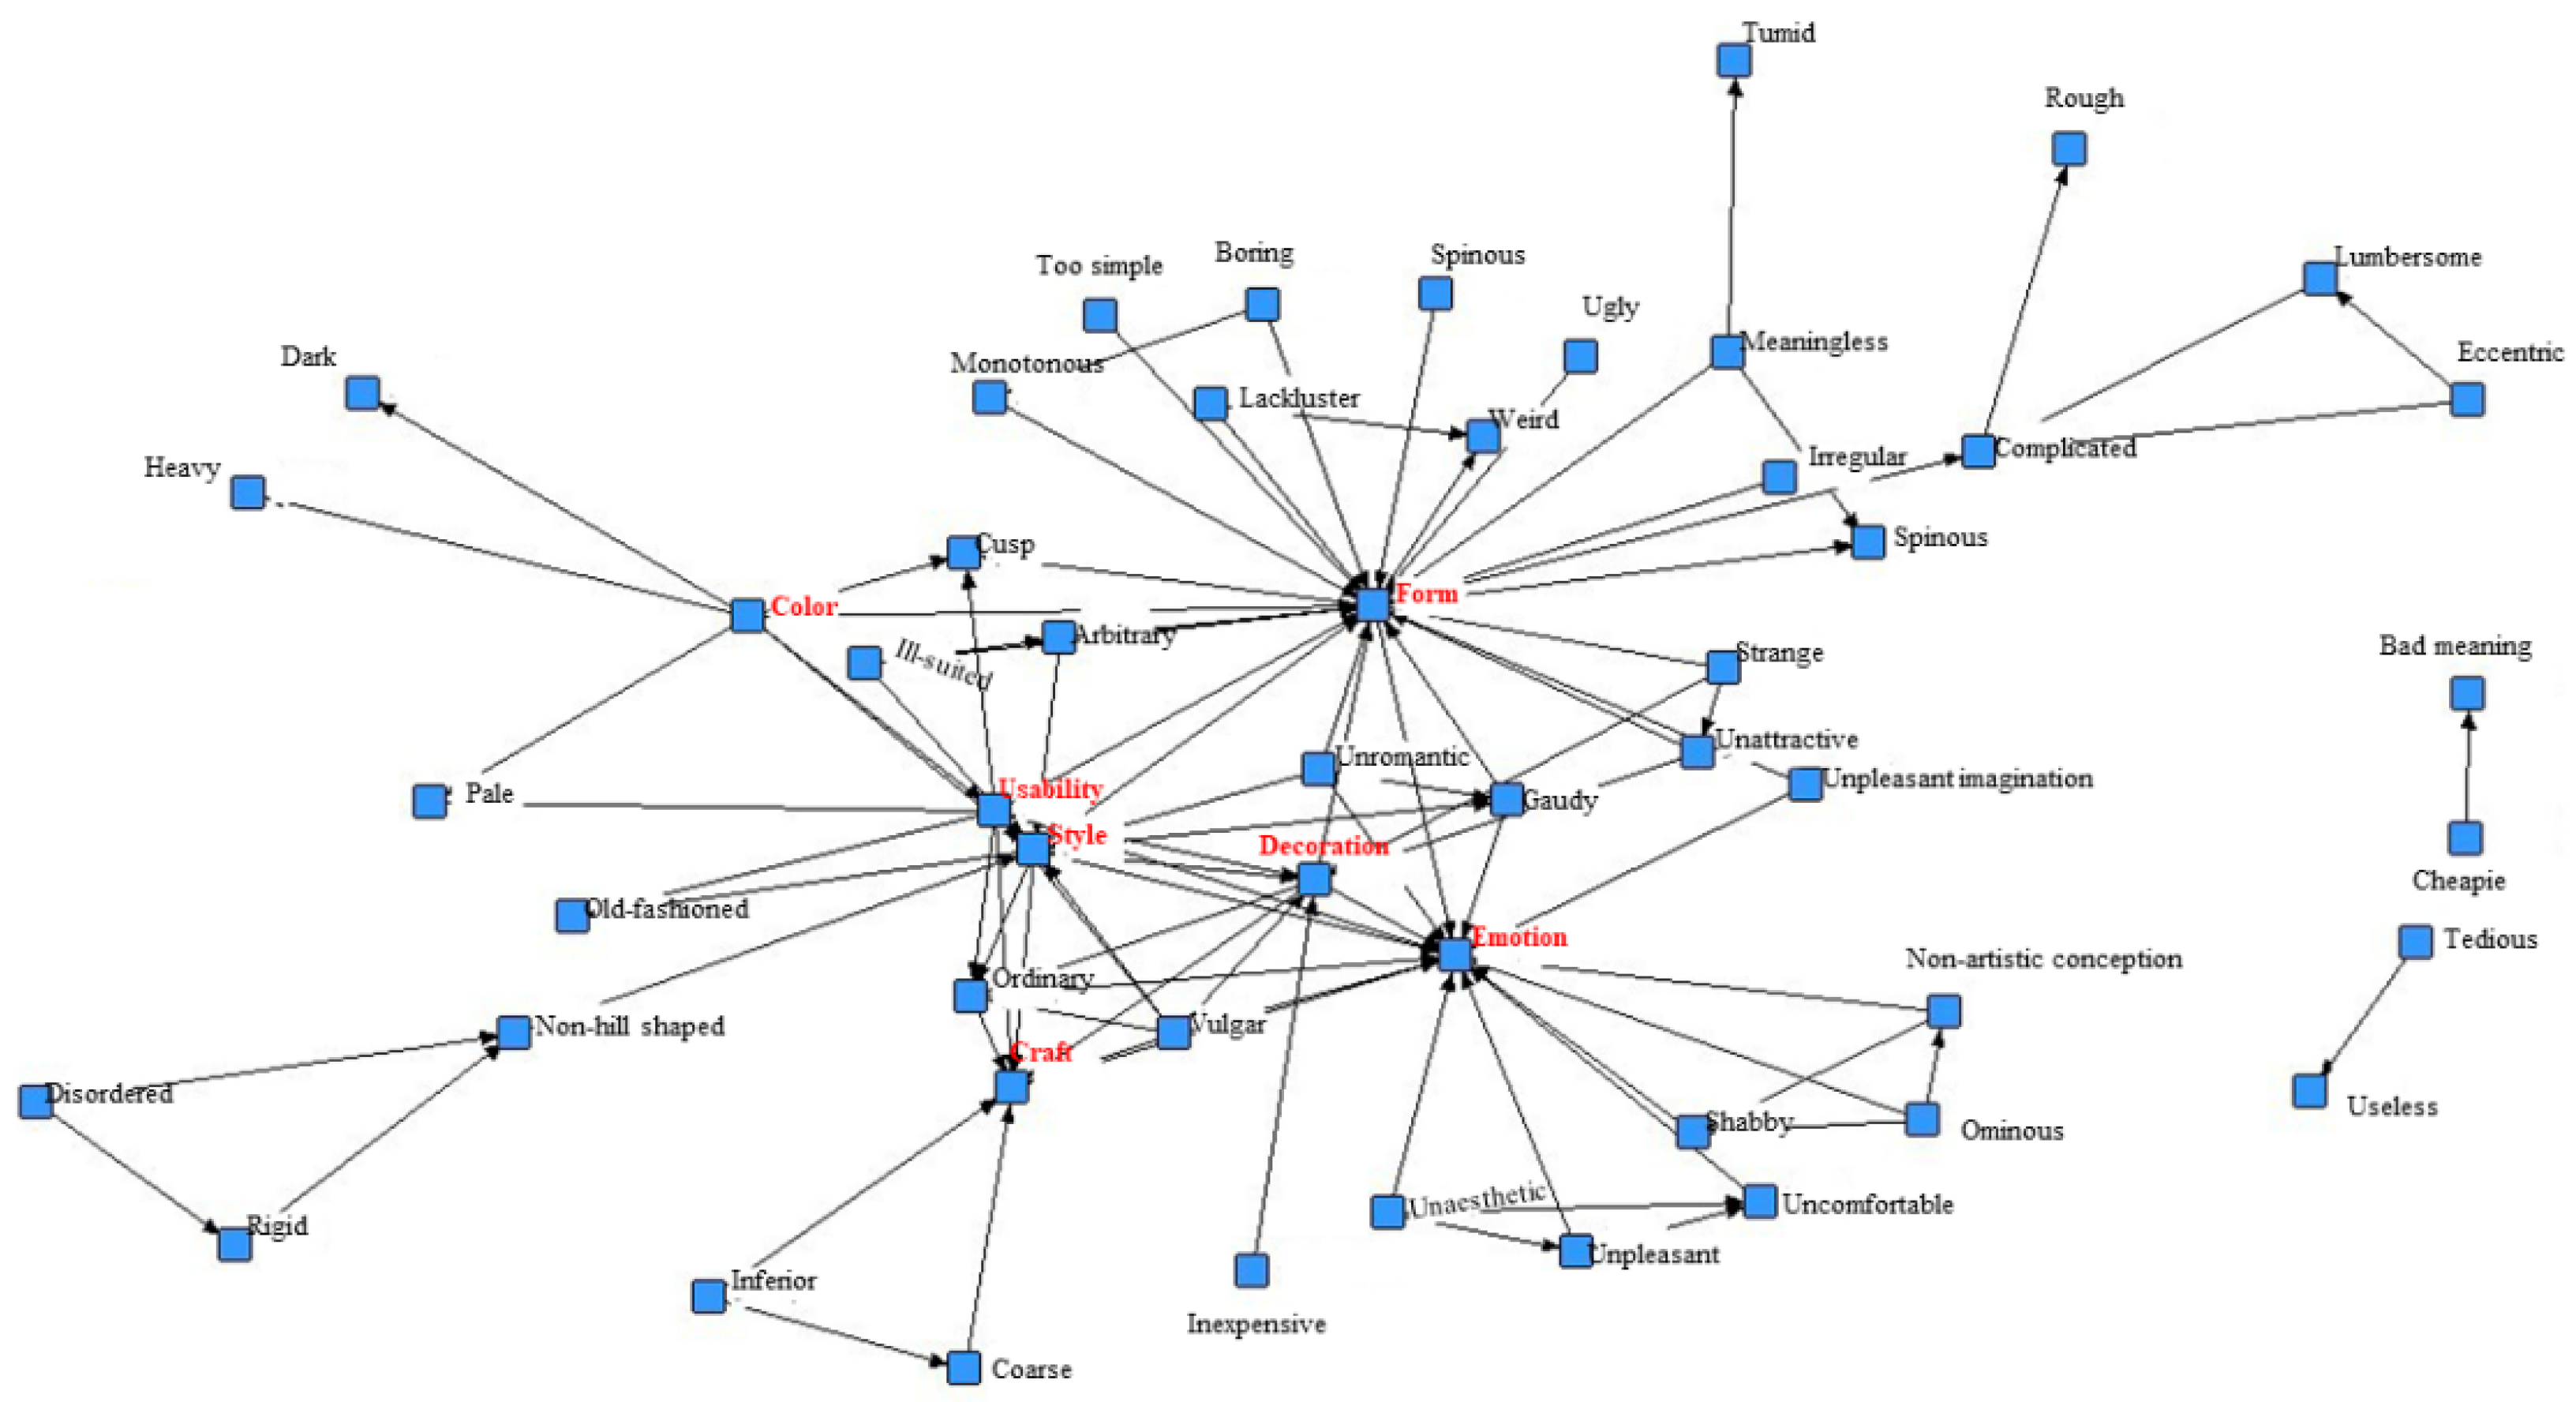
Figure 3 shows the semantic network associated with negative aspects, with the node “form” in the center, unlike its position in the semantic network for the positive vocabulary. The central node is joined to other nodes, e.g., “vivid”, “irregular”, “rough”, “weird”, etc. Dark, heavy colors were found to have a negative influence on the subjects in the case study. Designers should therefore be careful to avoid such color combinations. Additionally, designers were advised to refrain from evoking uncomfortable, unpleasant, or shabby feelings in their designs for future products.
The design students were frequently reminded to keep in mind the nodes from Figure 2 when developing ideas for their new designs. They also used nodes from Figure 3 to filter and eliminate ideas. They followed the key principles of emotional design.
To verify the findings obtained here, methodological triangulation was utilized. The results from both the content analysis and the semantic networks were compared according to methodological triangulation.
The findings were reliable enough in the case study. The high-frequency codes associated with the theme obtained from the content analysis were found to be very similar to the central node structures in the semantic network. From the content analysis, the code type “emotional experience” had 13 codes. Among these, “elegant” and “artistic conception” had the highest vocabulary frequency. In the semantic network, the central node (emotion) was linked with thick lines to both the “elegant” and “artistic conception” nodes on the right side of the network.
5. Design Strategies and Evaluation
5.1. Design Strategies
The last step of the RA phase involved developing general design strategies based on the theme obtained from the data analysis. An inductive approach is suitable for studying the users’ emotional experiences at this point.
The theme obtained from the case study content analysis was “emotional experience and design style”. A three-hour group discussion was organized by the course teacher to facilitate co-creation with the design students. The six design strategies proposed are set out below.
- The most important design strategy is to learn in depth about traditional culture.This finding is based on the high-frequency codes associated with the code types “style” and “decoration” in the pleasant features. Both samples 18 and 19 were found to be highly influenced by the Buddhist culture; both were made in the Sui–Tang dynasties in the form of a lotus, which elicits positive emotions. The lotus has always been used as a decorative element in Buddhism.
- Artistic conception is the second general design strategy obtained in this research.On some of the samples used in the data collection (e.g., sample 1), there are images of incense being used in the form of a poetic scene (artistic conception). For the hill censers, artistic conception refers to the poetic space in which the hills and incense mist blend. Hence, the designer should consider using operation environments to complete the design.
- Being fashionable is often important for products, but not necessarily for historic products.Sometimes good designs can still appear to be fashionable even after a century. Samples 1 and 23 are old censers but still retain a fashionable look.
- The censer should be hill-shaped and avoid sharp edges.Both samples 11 and 12 have pointed protrusions on the lid, which made the subjects feel unsafe. Future products should make users feel safe. A round form was more likely to provoke a positive emotional association, unlike shapes with sharp edges.
- Bright colors evoke positive feelings in users.Samples 18 and 19 elicited positive comments for their pastel color. Samples 2, 5, 8, and 11 all have a dark tone, and evoked unpleasant images.
- The minimalist form is a geometrical aesthetic design method that is influenced by Modernism (1920s). Censer samples with a simplistic form are preferred according to the analysis results.
5.2. Evaluating Designs
This research utilized systematic analysis methods to obtain the design strategies above. The design students used these strategies to design hill censers. The users’ emotional responses to the new designs were tested in the DE phase. The purpose was to identify and confirm the positive influences of the obtained design strategies on users.
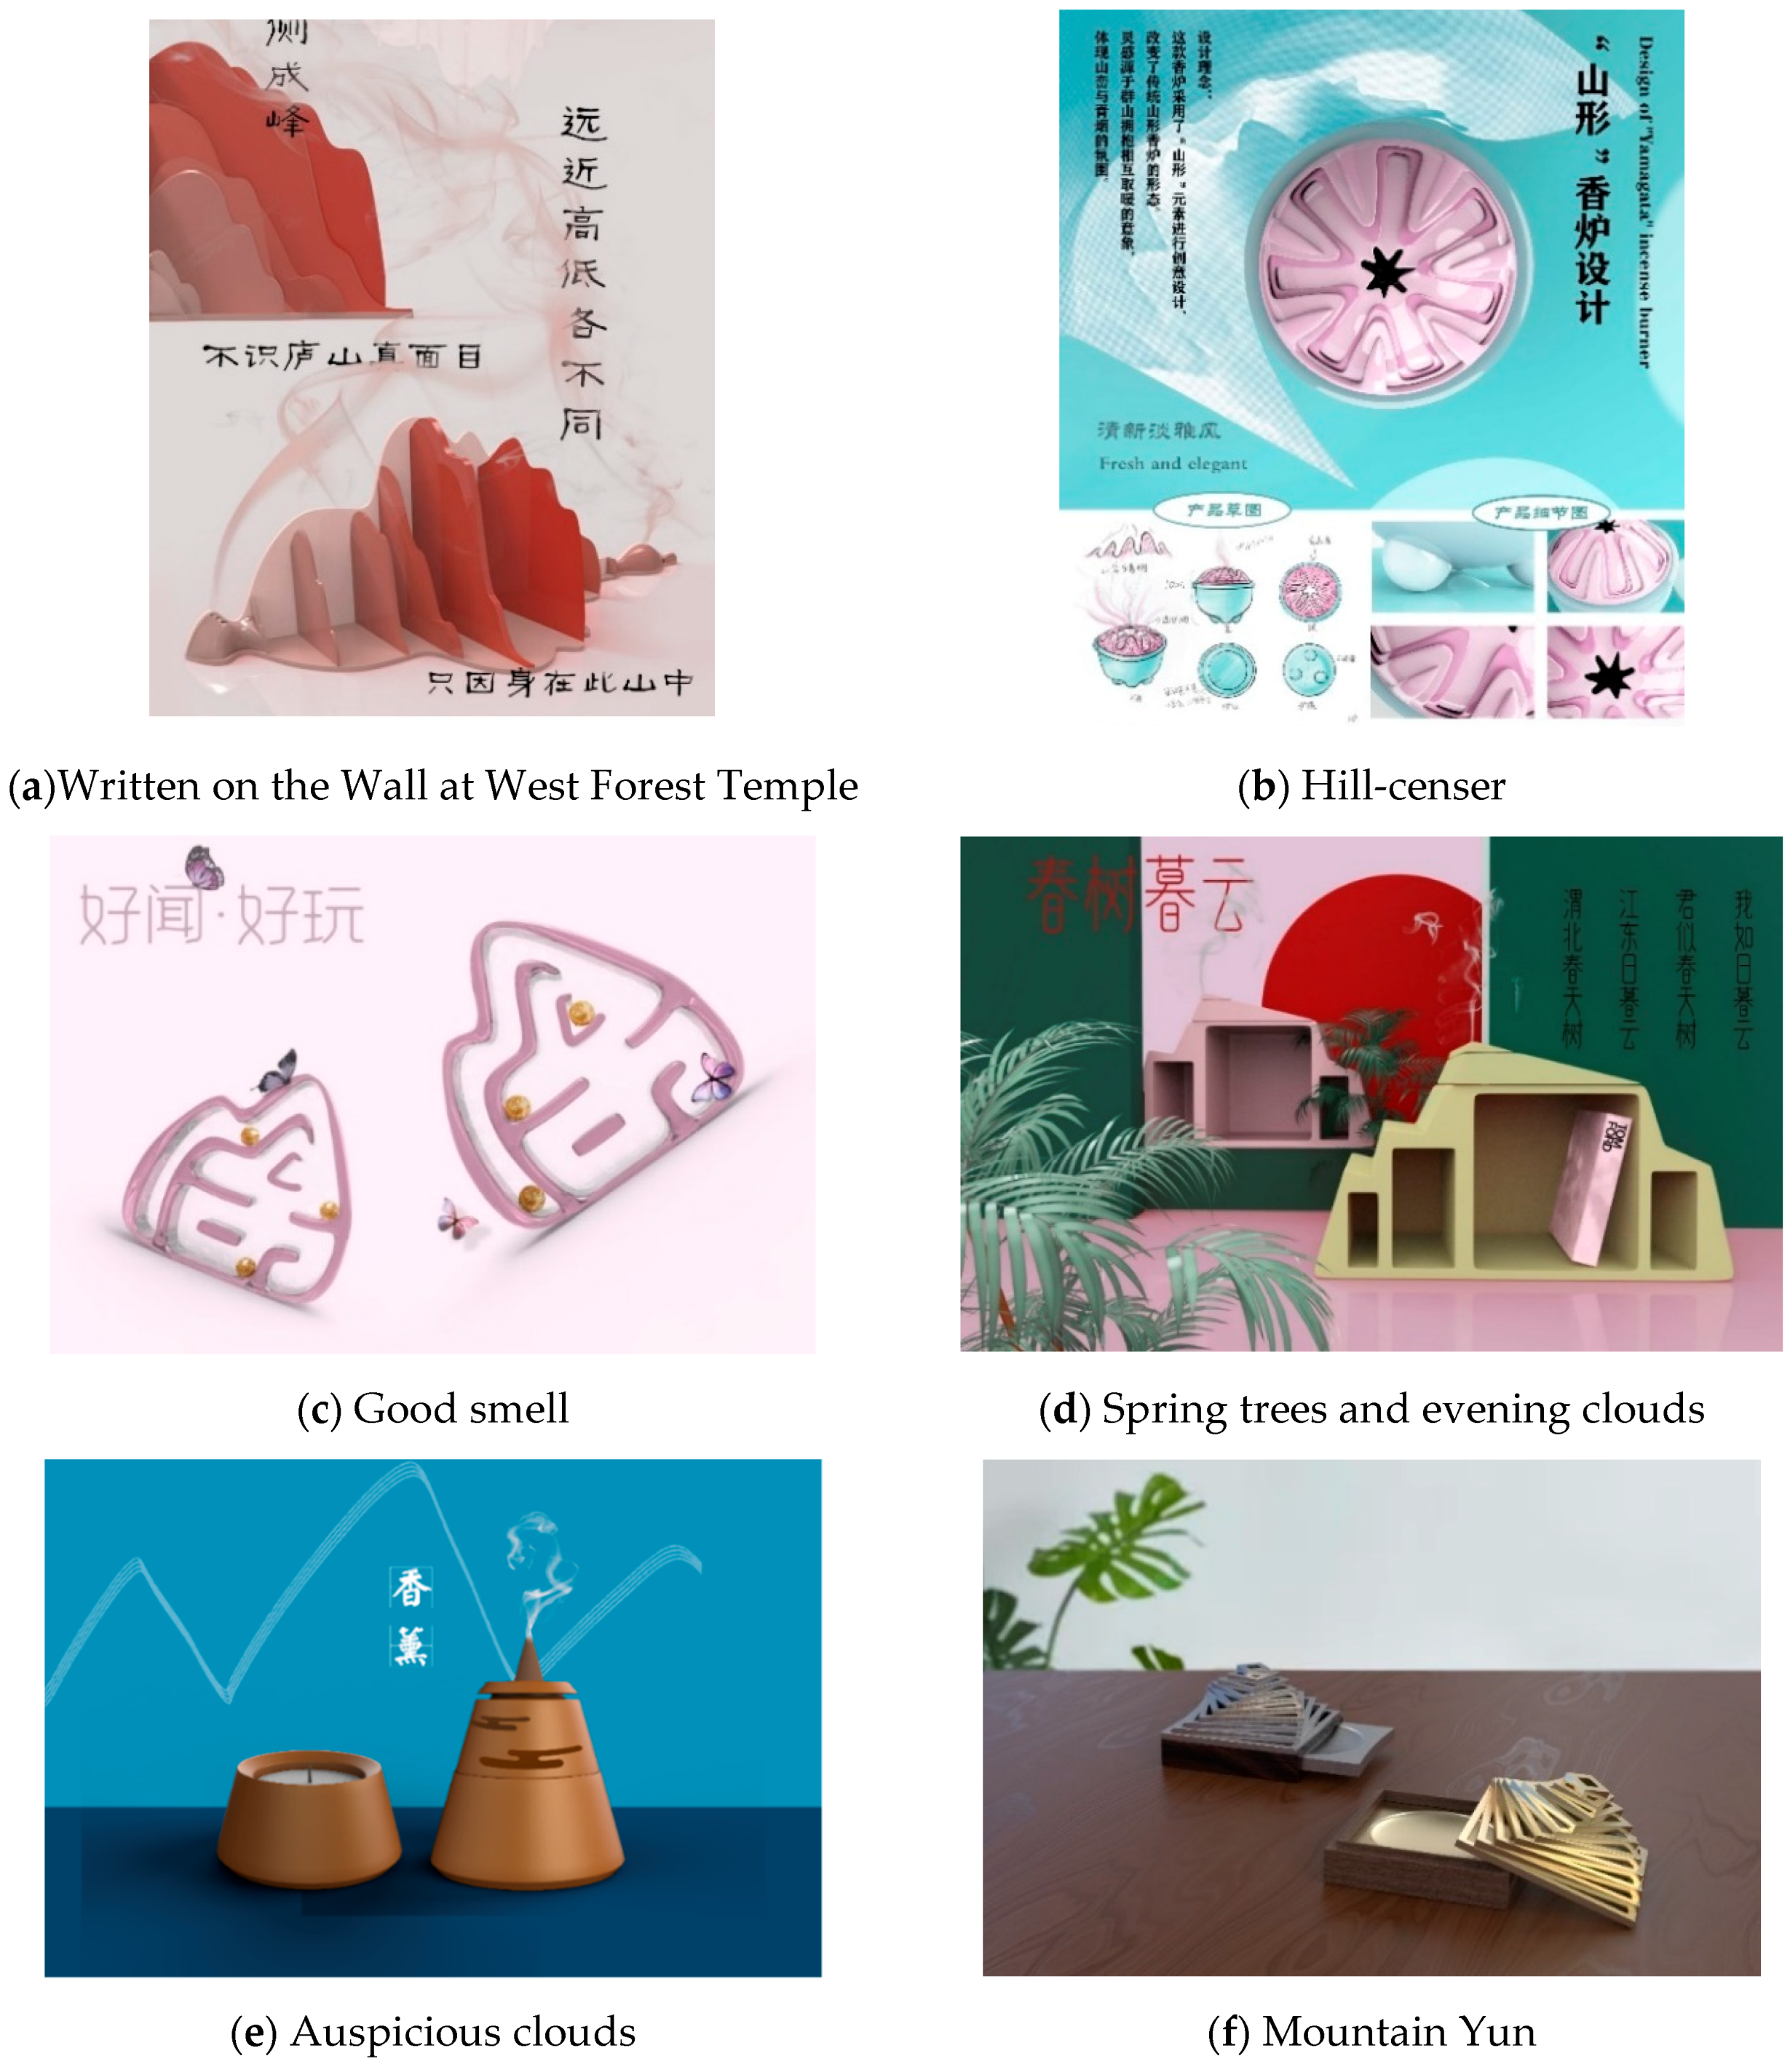
In the DE phase, the design process started after obtaining the design strategies. The students drew sketches based on the users’ emotional requirements, which were represented by the analysis results as well as the design strategies. The design sketches were fixed several times after discussion with the teacher. Six designs were finally chosen from 32 drafts from which to build models and were rendered using software (Rhinoceros 6, a commercial 3D computer graphics and computer-aided design application package). The six designs are shown in Figure 4, along with their names as given by the students and the main design strategy utilized in each design.
- (a)
- Written on the Wall at West Forest Temple/Artistic conceptionA scene involving the use of incense can evoke the feeling of a poetic space for users. This design utilized a Chinese poem as its inspiration to express an artistic conception of censer use. The poem illustrates a poetic mountain.
- (b)
- Hill-censer/Hill shapeThe censer should look like a hill, according to the fourth design strategy. Hill-shaped censers are found to give a sense of pleasure. This design used the hill shape in the censer’s lid, which was surrounded by four layers of hills to create the scene.
- (c)
- Good smell/Bright colorAll the subjects liked bright colors and thought bright colors could elicit pleasant feelings. The design color was bright pink and the designers used glass to create an even brighter feeling.
- (d)
- Spring trees and evening clouds/FashionableUsing a fashionable design style is one of the significant design strategies suggested in this case study. This design depicted the living of a slow lifestyle, which is fashionable in modern society.
- (e)
- Auspicious clouds/Simple form and traditional cultureThis design used a simplistic hill shape to express the characteristics of geometrical aesthetics. A traditional boshanlu was used and engraved with auspicious patterns (clouds). The design idea was inspired by the traditional Chinese pattern of auspicious clouds; those clouds were abstracted in the design.
- (f)
- Mountain Yun/Simple form and hill shapeThe last design had a simple hill shape; the brass lid had a geometrical form; the design idea was based on Mountain Yun, a famous Chinese mountain.
In this research, we evaluated the six designs based on the emotional code words obtained during the content analysis step. During a group discussion, the teacher and the design students evaluated the code words for both the pleasant and unpleasant aspects. The code words were selected based on the following two rules:
- Code words from the emotional experience code type, since this research is about the emotional design.
- High-frequency code words found in the collected data.
Table 6 shows the 30 code words that were chosen to evaluate the designs. The left three columns show the positive code words, whereas the right three show the negative words. These code words were used by the evaluating subjects to express their feelings towards the new designs.
A total of 202 evaluating subjects (131 females and 71 males ranging from 20 to 60 years of age) were asked to fill in questionnaires. The 76 subjects who joined the RA phase were among them. In total, 194 valid questionnaire answers were collected. Each subject was asked to use only 15 code words out of the 30 originally prepared in the questionnaire to describe the six new design samples collectively rather than individually. The eight most frequently used words are shown in Table 7; all were positive words. This further proves that utilizing these design strategies can provide users with a positive emotional experience.
6. Conclusions
A systematic approach was introduced in a design course to help students easily grasp the concept of emotional design. The course was designed to teach and train the students in relation to the development of new ideas that would provide positive experiences to users. A case study was conducted to evaluate the new approach in designing such courses. The effective use of systematic data collection and analysis was taught in this course. Students were taught to prepare and use questionnaires and to conduct interviews for data collection. They mastered the interview skills by practicing several times. For analyzing the collected data, methodological triangulation was also taught and used in the course to increase the reliability of the analysis results. Accordingly, both content analysis and semantic network techniques were taught and used to summarize and generalize the collected data.
The analysis results show that emotion is the most important factor in product design from the users’ perspective. Six design strategies related to the users’ expected positive emotional experiences were developed in the RA phase. These were used by the students in their designs, which were evaluated using 30 emotional words. The results identified that the six strategies could help the students design products that create positive emotional experiences for the users.
The students and teacher prepared a questionnaire in the DE phase to evaluate the user experience in relation to the new designs. The results of the evaluation show that the new designs fulfilled the expected positive emotional requirements of the product users. This shows that the proposed systematic teaching approach for emotional design succeeded in making the students understand the concept enough to utilize it successfully in developing new designs that satisfied the users.
Author Contributions
Conceptualization, Q.Y.; methodology, Q.Y.; software, Q.Y.; validation, Q.Y. and Y.N.; formal analysis, Q.Y.; investigation, Q.Y.; data curation, data curation; writing—original draft preparation, Q.Y.; writing—review and editing, Q.Y.; supervision, Y.N. All authors have read and agreed to the published version of the manuscript.
Funding
This research received no external funding.
Conflicts of Interest
The authors declare no conflict of interest.
References
- Barcus, Francis Earle. 1959. Communications Content: Analysis of the Research 1900–1958 (A Content Analysis of Content Analysis). Unpublished Doctoral dissertation, University of Illinois, Urbana-Champaign, IL, USA. [Google Scholar]
- Berelson, Bernard. 1952. Content Analysis in Communication Research. Glenoce: Free Press. [Google Scholar]
- Cavanagh, Stephen. 1997. Content analysis: Concepts, methods and applications. Nurse Researcher 4: 5–16. [Google Scholar] [CrossRef]
- Cowie, Roddy, Ellen Douglas-Cowie, Susie Savvidou, Edelle McMahon, Martin Sawey, and Marc Schröder. 2000. “Feeltrace”: An instrument for recording perceived emotion in real time. ISCA Workshop Speech Emotion, 19–24. Available online: https://doi.org/citeulike-article-id:3721917 (accessed on 11 October 2020).
- Cupchik, Gerald C. 1999. Emotion and industrial design: Reconciling meanings and feelings. Paper presented at 1st International Conference on Design and Emotion, Delft University of Technology, Delft, The Netherlands, November 3–5. [Google Scholar]
- Denton, Howard, and Deana McDonagh. 2006. Products loved by users: Developing a tool to assist designers’ awareness of user emotional responses to products. Paper presented at 5th Conference on Design and Emotion 2006, Design and Emotion, Chalmers University of Technology, Department of Product and Production Development, Göteborg, Sweden, September 27–29. [Google Scholar]
- Denzin, Norman. 1970. Strategies of Multiple Triangulation. The Research Act in Sociology: A Theoretical Introduction to Sociological Method. New York: Routledge, vol. 297, p. 313. [Google Scholar]
- Desmet, Pieter M. A., and Paul Hekkert. 2009. Special issue editorial: Design & emotion. International Journal of Design 3: 1–6. [Google Scholar]
- Drieger, Philipp. 2013. Semantic Network Analysis as a Method for Visual Text Analytics. Procedia—Social and Behavioral Sciences 79: 4–17. [Google Scholar] [CrossRef] [Green Version]
- Erickson, Susan N. 1992. Boshanlu: Mountain censers of the western Han period: A typological and iconological analysis. Archives of Asian Art 45: 6–28. [Google Scholar]
- Goertz, Gary. 2016. Multimethod Research. Security Studies 25: 3–24. [Google Scholar] [CrossRef]
- Graneheim, Ulla H., and Berit Lundman. 2004. Qualitative content analysis in nursing research: Concepts, procedures and measures to achieve trustworthiness. Nurse Education Today 24: 105–12. [Google Scholar] [CrossRef]
- Greene, Jennifer C., and Valerie J. Caracelli. 1997. Defining and describing the paradigm issue in mixed-method evaluation. New Directions for Evaluation 74: 5–17. [Google Scholar] [CrossRef]
- Hales, David. 2010. An Introduction to Triangulation. pp. 1–79. Available online: http://www.unaids.org/en/media/unaids/contentassets/documents/document/2010/10_4-Intro-to-triangulation-MEF.pdf (accessed on 10 October 2020).
- Han, Seunghee, Ki Joon Kim, and Jang Hyun Kim. 2017. Understanding nomophobia: Structural equation modeling and semantic network analysis of smartphone separation anxiety. Cyberpsychology, Behavior, and Social Networking 20: 419–27. [Google Scholar] [CrossRef]
- Helbig, Hermann. 2006. Knowledge Representation and the Semantics of Natural Language. Berlin/Heidelberg: Springer. [Google Scholar]
- Hsieh, Hsiu-Fang, and Sarah E. Shannon. 2005. Three approaches to qualitative content analysis. Qualitative Health Research 15: 1277–88. [Google Scholar] [CrossRef]
- Lee, Shin Haeng, and Tae Yun Lim. 2019. Connective action and affective language: Computational text analysis of Facebook comments on social movements in South Korea. International Journal of Communication 13: 24. [Google Scholar]
- Lincoln, Yvonna S., and Egon G. Guba. 2000. The only generalization is: There is no generalization. Case Study Method, 27–44. [Google Scholar]
- Mathison, Sandra. 1988. Why triangulate? Educational Researcher 17: 13–17. [Google Scholar] [CrossRef]
- Mitchell, Ellen S. 1986. Multiple triangulation: A methodology for nursing science. Advances in nursing science. Advances in Nursing Science 8: 18–26. [Google Scholar] [CrossRef] [PubMed]
- Morgan, David L. 1993. Qualitative Content Analysis: A Guide to Paths not Taken. Qualitative Health Research 3: 112–21. [Google Scholar] [CrossRef] [PubMed]
- Norman, Donald A. 2004. Emotional Design: Why We Love (or Hate) Everyday Things. New York: Basic Civitas Books. [Google Scholar]
- Park, Namgyoo K., Monica Youngshin Chun, and Jinju Lee. 2016. Revisiting Individual Creativity Assessment: Triangulation in Subjective and Objective Assessment Methods. Creativity Research Journal 28: 1–10. [Google Scholar] [CrossRef] [Green Version]
- Quillian, M. Ross, and Marvin Minsky. 1968. Semantic Information Processing. Edited by M. Minsky. Cambridge: The MIT Press, pp. 227–70. [Google Scholar]
- Rawson, Jessica. 2006. The Chinese hill censer, boshan Iu: A note on origins, influences and meanings. Arts Asiatiques 61: 75–86. [Google Scholar] [CrossRef]
- Rosengren, Karl Erik, ed. 1981. Advances in Content Analysis. Thousand Oaks: SAGE Publications, Incorporated, vol. 9. [Google Scholar]
- Sacharin, Vera, Katja Schlegel, and Klaus R. Scherer. 2012. Geneva emotion wheel rating study. In Center for Person, Kommunikation, Aalborg University, NCCR Affective Sciences. Aalborg: Aalborg University. [Google Scholar]
- Sáenz, David Cortés, Carlos Eduardo Díaz Domínguez, Pere Llorach-Massana, Ainoa Abella García, and Juan Luis Hernández Arellano. 2019. A series of recommendations for industrial design conceptualizing based on emotional design. In Managing Innovation in Highly Restrictive Environments. Cham: Springer, pp. 167–85. [Google Scholar]
- Stemler, S. 2001. An overview of content analysis. Practical Assessment Research and Evaluation 7: 479–98. [Google Scholar] [CrossRef]
- Tonkin-Crine, Sarah, Sibyl Anthierens, Kerenza Hood, Lucy Yardley, Jochen W. L. Cals, Nick A. Francis, Samuel Coenen, Alike W. van der Velden, Maciek Godycki-Cwirko, Carl Llor, and et al. 2016. Discrepancies between qualitative and quantitative evaluation of randomised controlled trial results: Achieving clarity through mixed methods triangulation. Implementation Science 11: 1–8. [Google Scholar] [CrossRef] [Green Version]
- Van Gorp, Trevorvan, and Edie Adams. 2012. Why Design for Emotion? Design for Emotion. [Google Scholar] [CrossRef]
- Violante, Maria Grazia, Federica Marcolin, Enrico Vezzetti, Luca Ulrich, Gianluca Billia, and Luca Di Grazia. 2019. 3D facial expression recognition for defining users’ inner requirements-An emotional design case study. Applied Sciences 9: 2218. [Google Scholar] [CrossRef] [Green Version]
- Watson, David, Lee Anna Clark, and Auke Tellegen. 1988. Development and Validation of Brief Measures of Positive and Negative Affect: The PANAS Scales. Journal of Personality and Social Psychology 54: 1063–70. [Google Scholar] [CrossRef] [PubMed]
- Weber, Robert Philip. 1990. Basic content analysis (No. 49). Los Angeles: Sage. [Google Scholar]
- Wu, H. 2010. Art in Etiquette—Chinese Ancient art History. Translated by Y. Zheng. Beijing: Shenghuo—Dushu—Xinzhi, Sanlian Press. [Google Scholar]
| 1 | In that year, all courses were held online due to the impact of COVID-19. |
| 2 | This term refers to a scene being described in a literary or artistic work that reflects the sense and sensibility intended. The artistic conception is one of the basic categories of dialectics of art and is an important issue to study in aesthetics. |
Figure 1.
The 23 Boshanlu samples chosen for this case study.

Figure 2.
The semantic network of positive vocabulary.

Figure 3.
The semantic network of negative vocabulary.

Figure 4.
The six evaluated designs.


Table 1.
Example Interview Questions.
| Emotion | No. | Questions |
|---|---|---|
| Like | Q 1 | Which samples do you like? |
| Q 2 | Why do you like them? | |
| Q 3 | Could you talk more about each of these samples? | |
| Dislike | Q 4 | Which samples don’t you like? |
| Q 5 | Why don’t you like them? | |
| Q 6 | Could you talk more about each of these samples? | |
| Pleasant | Q 7 | Do these samples give you a pleasant sensation? |
| Q 8 | What kind of positive feelings do you receive from these samples? | |
| Q 9 | Could you explain in detail why you feel that when you see these samples? | |
| Unpleasant | Q 10 | Do these samples give you an unpleasant sensation? |
| Q 11 | What kind of negative feelings do you receive from these samples? | |
| Q 12 | Could you explain in detail why you feel that when you see these samples? |
Table 2.
Analysis of Pleasant Features in Hill Censers.
| No. | Meaning Units | Condensed Meaning Units | Codes |
|---|---|---|---|
| 1 | This incense burner looks like a lantern or a lamp. | resembles lantern or lamp | lantern lamp |
| 2 | The hill shape of the incense burner is the most prominent; it should look like the hill. | resembles hill | hill-shaped |
| 3 | The incense burner has rich decoration and bright color, which provides a pleasant experience. | rich decoration and bright color, provides a pleasant experience | rich bright pleasant experience |
| 4 | Although this censer was made thousands of years ago, it still feels modern and fashionable. | historic items with a modern feel | modern fashion |
| 5 | The incense mist rises from the censer when I use the incense burner; I feel like I am in a fairyland. | feel like in a fairyland | fairyland |
| 6 | The incense burner has a fairy sculpture; I like the totem decoration of the god bird. | the totem decoration of the god bird | totem |
| 7 | The censer has an elegant color with Buddhist decorative elements. | elegant color with Buddhist decorative elements | elegant Buddhism |
| 8 | I like the lotus form of the censer; the censer with a light hue makes it look nice. | lotus-shaped censer with a light hue | lotus light hue |
Table 3.
Analysis of Unpleasant Features in Hill Censers.
| No. | Meaning Units | Condensed Meaning Units | Codes |
|---|---|---|---|
| 1 | The form of the censer’s lid is a bit irregular; the color is also too dark. | boring form and dark color | irregular dark |
| 2 | The censer looks like a plant pot. | plant pot | old fashioned |
| 3 | The form is too simple. | simple form | too simple |
| 4 | The surface is rough; it does not look like a censer and feels shabby. | rough surface and shabby feeling | rough shabby |
| 5 | The form is weird, cusps of the censer’s lid make me feel uncomfortable. | weird and shape of the cusps create an uncomfortable feeling | weird uncomfortable |
| 6 | The craft is rough; the lid resembles a cave creating unpleasant ideas. | strange shaped lid creates unpleasant ideas | strange unpleasant |
| 7 | Styling of the censer looks like a sad person; it makes me feel depressed. | strange styling with a depressing feeling | depressive |
| 8 | The form does not look like a hill at all. | it doesn’t resemble hills | non-hill-shaped |
Table 4.
The Codes, Categories, and Themes Associated with Pleasant Features of the Hill Censers.
| Code Types | |||||||
|---|---|---|---|---|---|---|---|
| Emotional Experience | Craft | Usability | Style | Form | Color | Decoration | |
| Codes | Elegant | Superb | Practicability | Modern | Lantern | Bright | Rich |
| Artistic conception | Excellent | Valuable | Fashionable | Lotus | Rich | Totem | |
| Calm | Handmade | Solid | Solemn | Hill | Light hue | Meticulous | |
| Exquisite | Meticulous | Smooth | Conventional | Concrete | Pure | Lotus | |
| Luxurious | Traditional culture | Unique | Lively | Buddhism | |||
| Precious | Holistic | Vivid | Gradation | Clouds | |||
| Pleasant olfactory experience | Classical | ||||||
| Immortal | |||||||
| Fairyland | |||||||
| Comfortable | |||||||
| Mild | |||||||
| Graceful | |||||||
| Categories | |||||||
| Emotional experience | Craft | Usability | Design style | ||||
| Theme | |||||||
| Emotional experience and design style | |||||||
Table 5.
The Codes, Categories, and Themes Associated with Unpleasant Features of the Hill Censers.
| Code Types | |||||||
|---|---|---|---|---|---|---|---|
| Emotional Experience | Craft | Usability | Style | Form | Color | Decoration | |
| Codes | Shabby | Inferior | Ill-suited | Old-fashioned | Irregular | Dark | Unattractive |
| Unpleasant | Rough | Useless | Rigid | Spinous | Pale | Gaudy | |
| Unaesthetic | Messy | Non-hill-shaped | Heavy | Lackluster | |||
| Ordinary | Meaningless | Not romantic | |||||
| Uncomfortable | Ugly | Inexpensive | |||||
| Strange | Heavy | ||||||
| Restlessness | Arbitrary | ||||||
| Non-artistic conception | Complicated | ||||||
| Ominous | Too simple | ||||||
| Depressive | |||||||
| Tedious | |||||||
| Eccentric | |||||||
| Categories | |||||||
| Emotional experience | Craft | Usability | Design style | ||||
| Theme | |||||||
| Emotional experience and design style | |||||||
Table 6.
The 30 Emotional Words.
| Positive | Negative | ||||
|---|---|---|---|---|---|
| Elegant | Pleasant | Exquisite | Shabby | Unpleasant | Strange |
| Fairyland | Smooth | Classical | Uncomfortable | Ominous | Depressive |
| Comfortable | Bright | Vivid | Old-fashioned | Dark | Rigid |
| Fashionable | Conventional | Solemn | Complicated | Messy | Pale |
| Unique | Mild | Lively | Rough | Arbitrary | Tedious |
Table 7.
Vocabulary Ranking.
| Word Ranking | |||
|---|---|---|---|
| Fashionable 181 | Pleasant 172 | Bright 162 | Vivid 158 |
| Unique 150 | Comfortable 141 | Fairyland 136 | Lively 130 |
Publisher’s Note: MDPI stays neutral with regard to jurisdictional claims in published maps and institutional affiliations. |
© 2020 by the authors. Licensee MDPI, Basel, Switzerland. This article is an open access article distributed under the terms and conditions of the Creative Commons Attribution (CC BY) license (http://creativecommons.org/licenses/by/4.0/).
Share and Cite
MDPI and ACS Style
Yu, Q.; Nagai, Y. A New Approach to Teaching Emotional Design. Soc. Sci. 2020, 9, 210. https://doi.org/10.3390/socsci9110210
AMA Style
Yu Q, Nagai Y. A New Approach to Teaching Emotional Design. Social Sciences. 2020; 9(11):210. https://doi.org/10.3390/socsci9110210
Chicago/Turabian StyleYu, Qinghua, and Yukari Nagai. 2020. "A New Approach to Teaching Emotional Design" Social Sciences 9, no. 11: 210. https://doi.org/10.3390/socsci9110210
Note that from the first issue of 2016, this journal uses article numbers instead of page numbers. See further details here.