Article

The Influence of Sociodemographic Variables on Audiovisual Consumption: The Case of Spain

by
Noelia Araújo Vila
1,*,
Jose Antonio Fraiz Brea
2 and
Lucília Cardoso
3
1
Department of Financial Economics and Accounting, University of Vigo, 32004 Ourense, Spain
2
Department of Business Management and Marketing, University of Vigo, 32004 Ourense, Spain
3
Centro de Investigação, Desenvolvimento e Inovação em Turismo, 2520-641 Leiria, Portugal
*
Author to whom correspondence should be addressed.
Soc. Sci. 2019, 8(8), 239; https://doi.org/10.3390/socsci8080239
Submission received: 13 June 2019 / Revised: 24 July 2019 / Accepted: 9 August 2019 / Published: 13 August 2019

Abstract

:
Different spectators have distinct patterns of audiovisual product consumption. These patterns may be influenced by a range of factors. In this context, the present study analyzes how audiovisual consumption is influenced by sociodemographic variables. To this end, primary data was collected through a survey with 484 Spanish spectators. The collected data was subjected to a descriptive analysis and a non-parametric Pearson’s chi-square test, in order to establish consumption patterns and potentially link them to demographic variables. Results show that consumption patterns vary according to gender, age, and formal education.

1. Introduction

Advances in information technology and new means of communication have led to increasingly significant changes in consumers’ behavior (Serra and Salvi 2014). The internet has given consumers the freedom to watch what they want, when they want, which has led to a myriad of possibilities for media consumption (Paús and Molina 2014). These changes, in turn, have led to different approaches to marketing and business administration.
Analogous to the consumer goods industry, changes in the audiovisual sector have been significant. In this context, changes in consumers’ behavior, habits, and preferences have led the audiovisual sector to evolve through new marketing methods and strategies (García 2017). Therefore, the offer has constantly diversified in order to keep consumers’ interest, which has led to new market trends such as the increased popularity of TV series (Rodríguez et al. 2005), which are consumed not only through traditional television, but through various devices and formats. Television, however, is still the main entertainment activity in many countries. In Spain, for instance, 21% of internet users watch television while browsing the web (AIMC 2017).
The internet, on the other hand, offers numerous benefits as an alternative to traditional distribution channels, as it reaches a greater number of users at a lower cost. Moreover, consumers can now watch films, series and other audiovisual contents through mobile devices, which bring up new forms of multi-channel (for example, via Netflix, Amazon Prime …) and schedule-free media consumption, and consequently, more critical consumers (García and María 2014). These changes have also led to different business models, which have strengthened the sector’s economic impact. Such impact is further enhanced by the industry’s connection with other technology sectors, such as information technology and telecommunications. In this context, the audiovisual industry encourages the development of these sectors and vice-versa (Martí and Yebra 2001).
The present study further investigates audiovisual consumption, as well as its relationship with sociodemographic characteristics. In this context, the main goal is to verify whether audiovisual consumption patterns are significantly related to sociodemographic variables. Additionally, the research identifies which media and audiovisual products are currently most successful. To this end, a structured survey was applied to a sample of 484 Spanish TV spectators. Results show that consumption patterns vary according to gender, age, and formal education.

2. Theoretical Review: Audiovisual Products’ Consumption Behavior

The consumption of audiovisual products (series, news, programs, and others) is a common leisure practice. This behavior is more popular among the younger segments, even though they make less use of traditional television. Nevertheless, they use other means and supports to access television contents. In regard to the types of media consumption, for the younger population, information is second to entertainment and gambling (Vidales et al. 2012). In turn, the extent and variety of audiovisual content distribution channels and devices, have led to the so-called “second screen” (or social television), which refers to a more proactive and participative audiovisual consumption (Mateos and Pérez 2015). Such is the interest in audiovisual products, and especially in TV series, that a study carried out by an online marketing consultant for large series’ producers in China revealed a growth of 47% in 2015, compared to 2014, for online series’ reproduction (Vlinkage 2016). The same study also showed that the highest numbers were those of 2014, with an increase of 64.95%.
Another factor that contributed to the growing interest in these products is the web 2.0. Through the web, it is possible to contact not only with friends and family, but to get involved in events and contact groups of interest, companies, brands, and other entities (Rainie and Wellman 2012). Besides, distrust towards companies is increasing. Chiu et al. (2012) conclude in their study that 66% of Chinese consumers use friends and family recommendations as a basis to make decisions, and in the USA, this ratio is 38%. That is why, in the case of series, social media allow viewers to communicate and comment in real time on what they are viewing (Wang and García 2017). In addition, the programs and series themselves publish opinions in social media. They echo audience conversations which come on Twitter or other networks to recommend audiovisual content (Harrington et al. 2012). The concept of audience involvement has been researched as it is an important factor for audiovisual media uses and effects (Kim 2012; Kim and Rubin 1997), especially in those proactive audiences that seek to experience audiovisual media to meet expectations and needs. Kim and Rubin (1997) and Perse (1990) adopted a cognitive “elaboration scale” to evaluate audience participation in soap operas and television news, respectively. In the 1950s, the concept of “parasocial interaction”, was defined as “an imaginary sense of intimacy by an individual audience member with a media figure” (Horton and Wohl 1956, p. 217). From here, the concept was studied in soap opera characters (Papa et al. 2000; Sood 2002), television newscasters (Perse 1990), and for favorite television performers (Rubin and McHugh 1987). Based on these studies, the continuous interaction with audiovisual media characters, especially soap operas or television plots, can create feelings of intimacy with the actors’ characters as if they were friends (Kim 2012). Riley et al. (1998) showed the importance of the emotional bond between spectators and recorded places, which is associated with familiarity, empathy, identification, and reflection. Against this background, audiences of audiovisual products go from being mere consumers to prosumers (Zaccone 2011), understood as those who are simultaneously involved in production and consumption (Ritzer and Jurgenson 2010). They make decisions influenced by the relationship with audiovisual products, considered as “love markers” (Roberts 2006), that is, as products or brands for which consumers feel “loyalty beyond reason”. It is widely known that, at present, fiction series and other audiovisual products represent an important part of leisure time.
What has changed is consumer access to content, enabling audiences to choose access through platforms providers called video-on-demand (VoD) (Kupferschmitt 2015). Mikos’s (2016) research, conducted in Germany, to find about the motivation to watch movies and other television shows, revealed that Netflix and Amazon Prime Video are the most used platforms within the sample size. Nowadays, the growing preference for fictions series is such that new concepts are emerging such as “binge watching”. As both words indicate, this is an intensive form of series’ consumption (Mikos 2016). Brunsdon (2012, p. 65) defines it as “domestic viewing of multiple episodes sequentially”. In general terms, unlimited viewing of two or more episodes in a single session can be understood as binge (Perks 2014). Within the VoD industry this nomenclature is used as a marketing tool, thus exploiting the sale of series as a single delivery of the whole season (Tryon 2015). It is an audiovisual consumption that can mostly avoid commercial breaks (Jacobs 2011) possible due to the technological and commercial advances that have been applied to this sector (Mikos 2016). Kranz’s (2015) study on binge-watching showed that all respondents of the study sample have carried out binge-watching at least once. In addition, there were groups who had watched complete series in a few weeks or even days. Viewers continue to watch episodes because they become used to it and because they identify strongly with the characters. Some viewers even show sadness on the death of characters or the end of the series (Kranz 2015). Linked to this growing demand for audiovisual products, complex concepts such as the previously mentioned “audience involvement” emerge.
Literature has defined how spectators react to audiovisual products and how changes are generated in their behavior. The level of viewers’ involvement with content and how it reflects the viewers’ personality has also been studied (Fu et al. 2016; Sood 2002). Besides, spectators can start feeling affection and thinking that fictional characters are their friends (Horton and Wohl 1956). Another concept related and researched by many scholars is that of consumer involvement (Mittal 1995; Muncy and Hunt 1984). Muncy and Hunt (1984) defined five types of involvement: ego involvement, commitment, communication involvement, purchase importance, and response involvement. In the case of audiovisual media, communication involvement is especially important, understood as the number of connections an individual makes between an audiovisual product and his life content while he visualizes it. Namely when individuals make transference of episodes or programs they are viewing into their daily life (Krugman 1966; Fu et al. 2016). Meaning that we are living in a time when audiovisual consumption plays an essential role in leisure time. Regardless of gender, age or occupation, individuals consume more and more audiovisual products and use different media or platforms for it. What really varies is the type of product consumed and the means used. In the case of younger groups, they are more likely to use streaming platforms (such as Netflix or Amazon prime), while men prefer the consumption of sports programs. In addition, there are specific products that have gained many followers in all groups, as the case of the audiovisual series. A good example is the series Game of Thrones, whose eighth and last season is reaching record viewings and downloads worldwide. The first episode of this last season reached the 17.4 million audience on HBO (HBO 2019).

3. Research Objectives, Sample and Methodology

3.1. Research Objectives

The main purpose of the present research is to understand the influence of sociodemographic variables in media and audiovisual products consumption. Additionally, the study also aims to determine the rank of audiovisual series. To this end, the specific objectives proposed for the present study are:
-
RO1. To verify if sociodemographic variables significantly influence the choice of audiovisual media (H1).
-
RO2. To verify if sociodemographic variables significantly influence the choice of audiovisual products consumed (H2).
-
RO3. To know which are the most consumed audio-visual products and to verify if series are among them.

3.2. Sample and Methodology

To respond to the adopted specific objectives, the primary data was collected through a survey. According to Malhotra (2004, p. 168), a survey “includes a structured questionnaire that is given to the respondents and which is designed to obtain specific information”. The questionnaire was designed using 5-point Likert-type scales, through which respondents were asked about their choices of audiovisual media and audiovisual products, as well as their consumption of TV series. Additionally, sociodemographic data about the respondents was also collected (see Appendix A). Table 1 summarizes the dependent and independent variables assessed by the questionnaire. Before conducting the survey, the researchers verified whether the questionnaire was in accordance with all legal and IRB protocols.
The study’s target population consisted of Spanish spectators. To this end, spectators were understood as individuals who consume any type of audiovisual media (television, cinema, TV on demand, streaming, etc.). Although a consensus has not yet been reached in this regard, the Spanish National institute of Statistics (INE) considers that every Spanish person is a spectator, since 99.2% of households own a television (INE 2017). Therefore, the study’s research universe consists of an infinite population (>100,000 individuals). In this context, in order to maximize geographical representation, the survey was conducted face to face in several cities within different autonomous communities. More specifically, the survey was administered in Madrid, Pedraza, Llanes, Briones, and Toledo, which were chosen as representatives of the autonomous communities of Madrid, Asturias, La Rioja, and Castilla La Mancha.
The surveying procedures were carried out by qualified researchers. To avoid bias, a random sampling technique, namely systematic sample, was adopted, as “it allows a simple selection of the elements that make up the sample” (Vivanco 2005, p. 171). The technique is suitable for large populations, as the list of all the sampling units, in this case, the spectators, is unknown (Anderson et al. 2001). After selecting a first individual at random, a constant amplitude jump (3) was applied, which renders a more representative sample than simple random sampling (Vivanco 2005).
A total of 484 valid questionnaires was collected (resulting in a sampling error of ±4.5% for a confidence level of 95% in an infinite population). This figure was obtained by using the sample size determination formula shown below, considering the technical data summarized in Table 2.
n = Z 2 p q d 2
where:
Z2 = 1.96 (since confidence is 95%)
p = q = 0.5
d = accuracy (in this case, 4.5%)
The questionnaires were filled in on paper and later tabulated into IMB SPSS v.23, which was used for the statistical analyses.

4. Results

In order to achieve the adopted research objectives, the collected data was analyzed by crossing respondents’ consumption of different audiovisual media and audiovisual products with demographic variables through Pearson’s chi-square nonparametric tests.
A basic condition for carrying out Pearson’s chi-square test is that “frequencies lower than 5, should not exceed 20% of the total expected frequencies”. The initial data tabulation made it clear that such a condition was not fulfilled, as the frequencies lower than 5 considered exceeded 20%.
To correct that, the data was recoded. The variable age, which originally included seven categories, was regrouped to include only three: 14 to 24 years old, 25 to 44 years old, and over 44 years old. Accordingly, education was recoded into three categories: up to secondary studies, professional education, and higher education (bachelor, master’s or doctorate degree). Regarding occupation, the sample was grouped into three categories: employed, students, and unemployed. Monthly income was grouped into just two groups: less than 3000 euros and more than 3000. Lastly, two groups were defined for the number of family members: 3 or fewer members and more than 3 members. Table 3 summarizes the sample’s sociodemographic characteristics already recoded into the described groups.
After the recoding procedures, Pearson’s chi-square tests were applied to each combination between sociodemographic variables and the means of accessing audio-visual content, in order to explore possible relationships. During the tests, the null hypothesis that the demographic variable had no statistically significant relationship with the means of accessing audiovisual content was accepted when the p-value was higher than 0.05. The tests’ results are summarized in Table 4 and addressed in more detail as follows.
-
Gender: The null hypothesis is accepted for most cases, as most p-values are higher than 0.05. In other words, the media through which consumers access audiovisual contents is generally unrelated to their gender. Only two media showed a statically significant relationship (p < 0.05) with gender. In this context, women consume less multimedia (p = 0.002) media and more television/DTT (p = 0.014).
-
Age: The consumption of five types of media showed a statistically significant relationship (p < 0.05) with age: cinema, paid TV, video/DVD, multimedia, and radio, which all had p-values of 0.000. Consumption of cinema, paid TV, video/DVD, and multimedia is higher amongst younger consumers. Radio, on the other hand, has significantly lower consumption by this demographic. Results regarding age and media consumption are summarized in Table 5.
-
Education: Three of the six media analyzed (paid TV, multimedia and radio) showed no statically significant relationship (p < 0.05) with the respondents’ level of formal education. On the other hand, a positive relationship was found on the other three: TV/DTT, cinema, and video/DVD. More specifically, respondents with higher education degrees (first and second level, respectively) consumed more cinema and video/DVD. In the case of television/DTT, the groups with the highest consumption were those with the lowest and highest levels of education, as summarized in Table 6.
-
Occupation: The consumption of three types of audiovisual media showed a statistically significant relationship (p < 0.05) with occupation: Cinema, video/DVD, and multimedia, as their p-values range from 0.000 to 0.003. In all three cases, students consumed significantly more than workers and unemployed people, as summarized in Table 7.
-
Monthly income: All media platforms showed statistically significant relationships (p <0.05) with family monthly income. In the case of cinema, paid television and video/DVD, the higher the income, the greater was the frequency of consumption. In the case of TV/DTT, radio and multimedia, the relationship was negative. Results regarding the relationship between monthly income and media consumption are summarized in Table 8.
-
Number of family members. None of the analyzed audiovisual media showed a statistically significant relationship (p < 0.05) with the number of members on respondents’ family units. Consequently, the null hypothesis of independence was accepted for all categories.
In the face of the addressed results, H1 (first objective) was only partially supported, as some sociodemographic variables do influence the choice of audiovisual consumption medium, especially age and income (which are related to the choice of 5 of the 6 proposed media). On the other hand, the number of family members did not influence such choice at all. Table 9 summarizes the results regarding the relationships between the consumption of different audiovisual content media and sociodemographic variables.
Pearson’s chi-square tests were also applied to each combination between sociodemographic variables and audiovisual products, in order to explore possible relationships. Results are summarized in Table 10.
-
Gender: the consumption of five audiovisual products showed a statically significant relationship (p < 0.05) with gender: series, reality shows, sports, gossip shows, and entertainment shows. In this context, women consume more reality shows, tv series, gossip shows and entertainment shows. Meanwhile, men watch more sports. The consumption of the remaining audiovisual products was shown to be unrelated to gender. Results on gender and audiovisual product consumption are summarized in Table 11.
-
Age: The consumption of eight types of audiovisual products showed a statistically significant relationship (p < 0.05) with age: films, TV series, documentaries, reality shows, news programs, mini-series, gossip shows and entertainment shows. In this context, documentaries, mini-series and films were consumed more frequently by people between 25 and 44 years old; reality shows were mostly watched by adolescents and young adults (14–24 years); and finally, TV series, news programs, gossip shows, and entertainment shows were more frequently consumed by the more mature group (more than 44 years old). Results regarding age and audiovisual products’ consumption are summarized in Table 12.
-
Education: The consumption of four audiovisual products showed a statistically significant relationship (p < 0.05) with respondents’ level of formal education: TV series, mini-series, sports, and gossip shows. In this context, sports and gossip shows had a negative relationship with consumers’ education level, that is, people with only secondary school degrees consumed these products the most, meanwhile those with higher education degrees watched them the least. TV series and mini-series, however, were favored by people with professional training. Results regarding choice of audiovisual products and education are summarized in Table 13.
-
Occupation: The consumption of six audiovisual products showed a statistically significant relationship (p < 0.05) with individuals’ occupations: films, mini-series, documentaries, reality shows, gossip shows, and entertainment shows. Unemployed people consumed films, gossip shows, entertainment shows and mini-series more frequently. Meanwhile, students showed the highest consumption frequency of documentaries and reality shows. Results regarding audiovisual products’ consumption and occupation are summarized in Table 14.
-
Monthly income: The consumption of most audiovisual products was shown to be unrelated to respondents’ family income, since most p-values exceeded the level of significance (0.05). One type of audiovisual product, however, did present a statistically significant relationship (p < 0.05). In this context, news shows were consumed significantly more by consumers with lower monthly incomes (less than 3000 €).
-
Number of family members: Analogous to monthly income, the number of family members is mostly unrelated to the choice of audiovisual products (p-value > 0.05 in 8 of the cases). The consumption of one audiovisual product, however, did show a statistically significant relationship (p < 0.05) with this demographic variable. More specifically, reality shows were consumed significantly more by members of family units with less than three individuals.
In the face of the addressed results regarding the consumption of different types of audiovisual products and its relationship with sociodemographic variables, which are summarized in Table 15, H2 (objective 2) is also only partially supported. Certain sociodemographic variables do have a statistically significant relationship with the type of audiovisual product respondents consume, especially gender, age, and occupation. On the other hand, family monthly income and number of family members was shown to be mostly unrelated with the type of audiovisual products consumed.
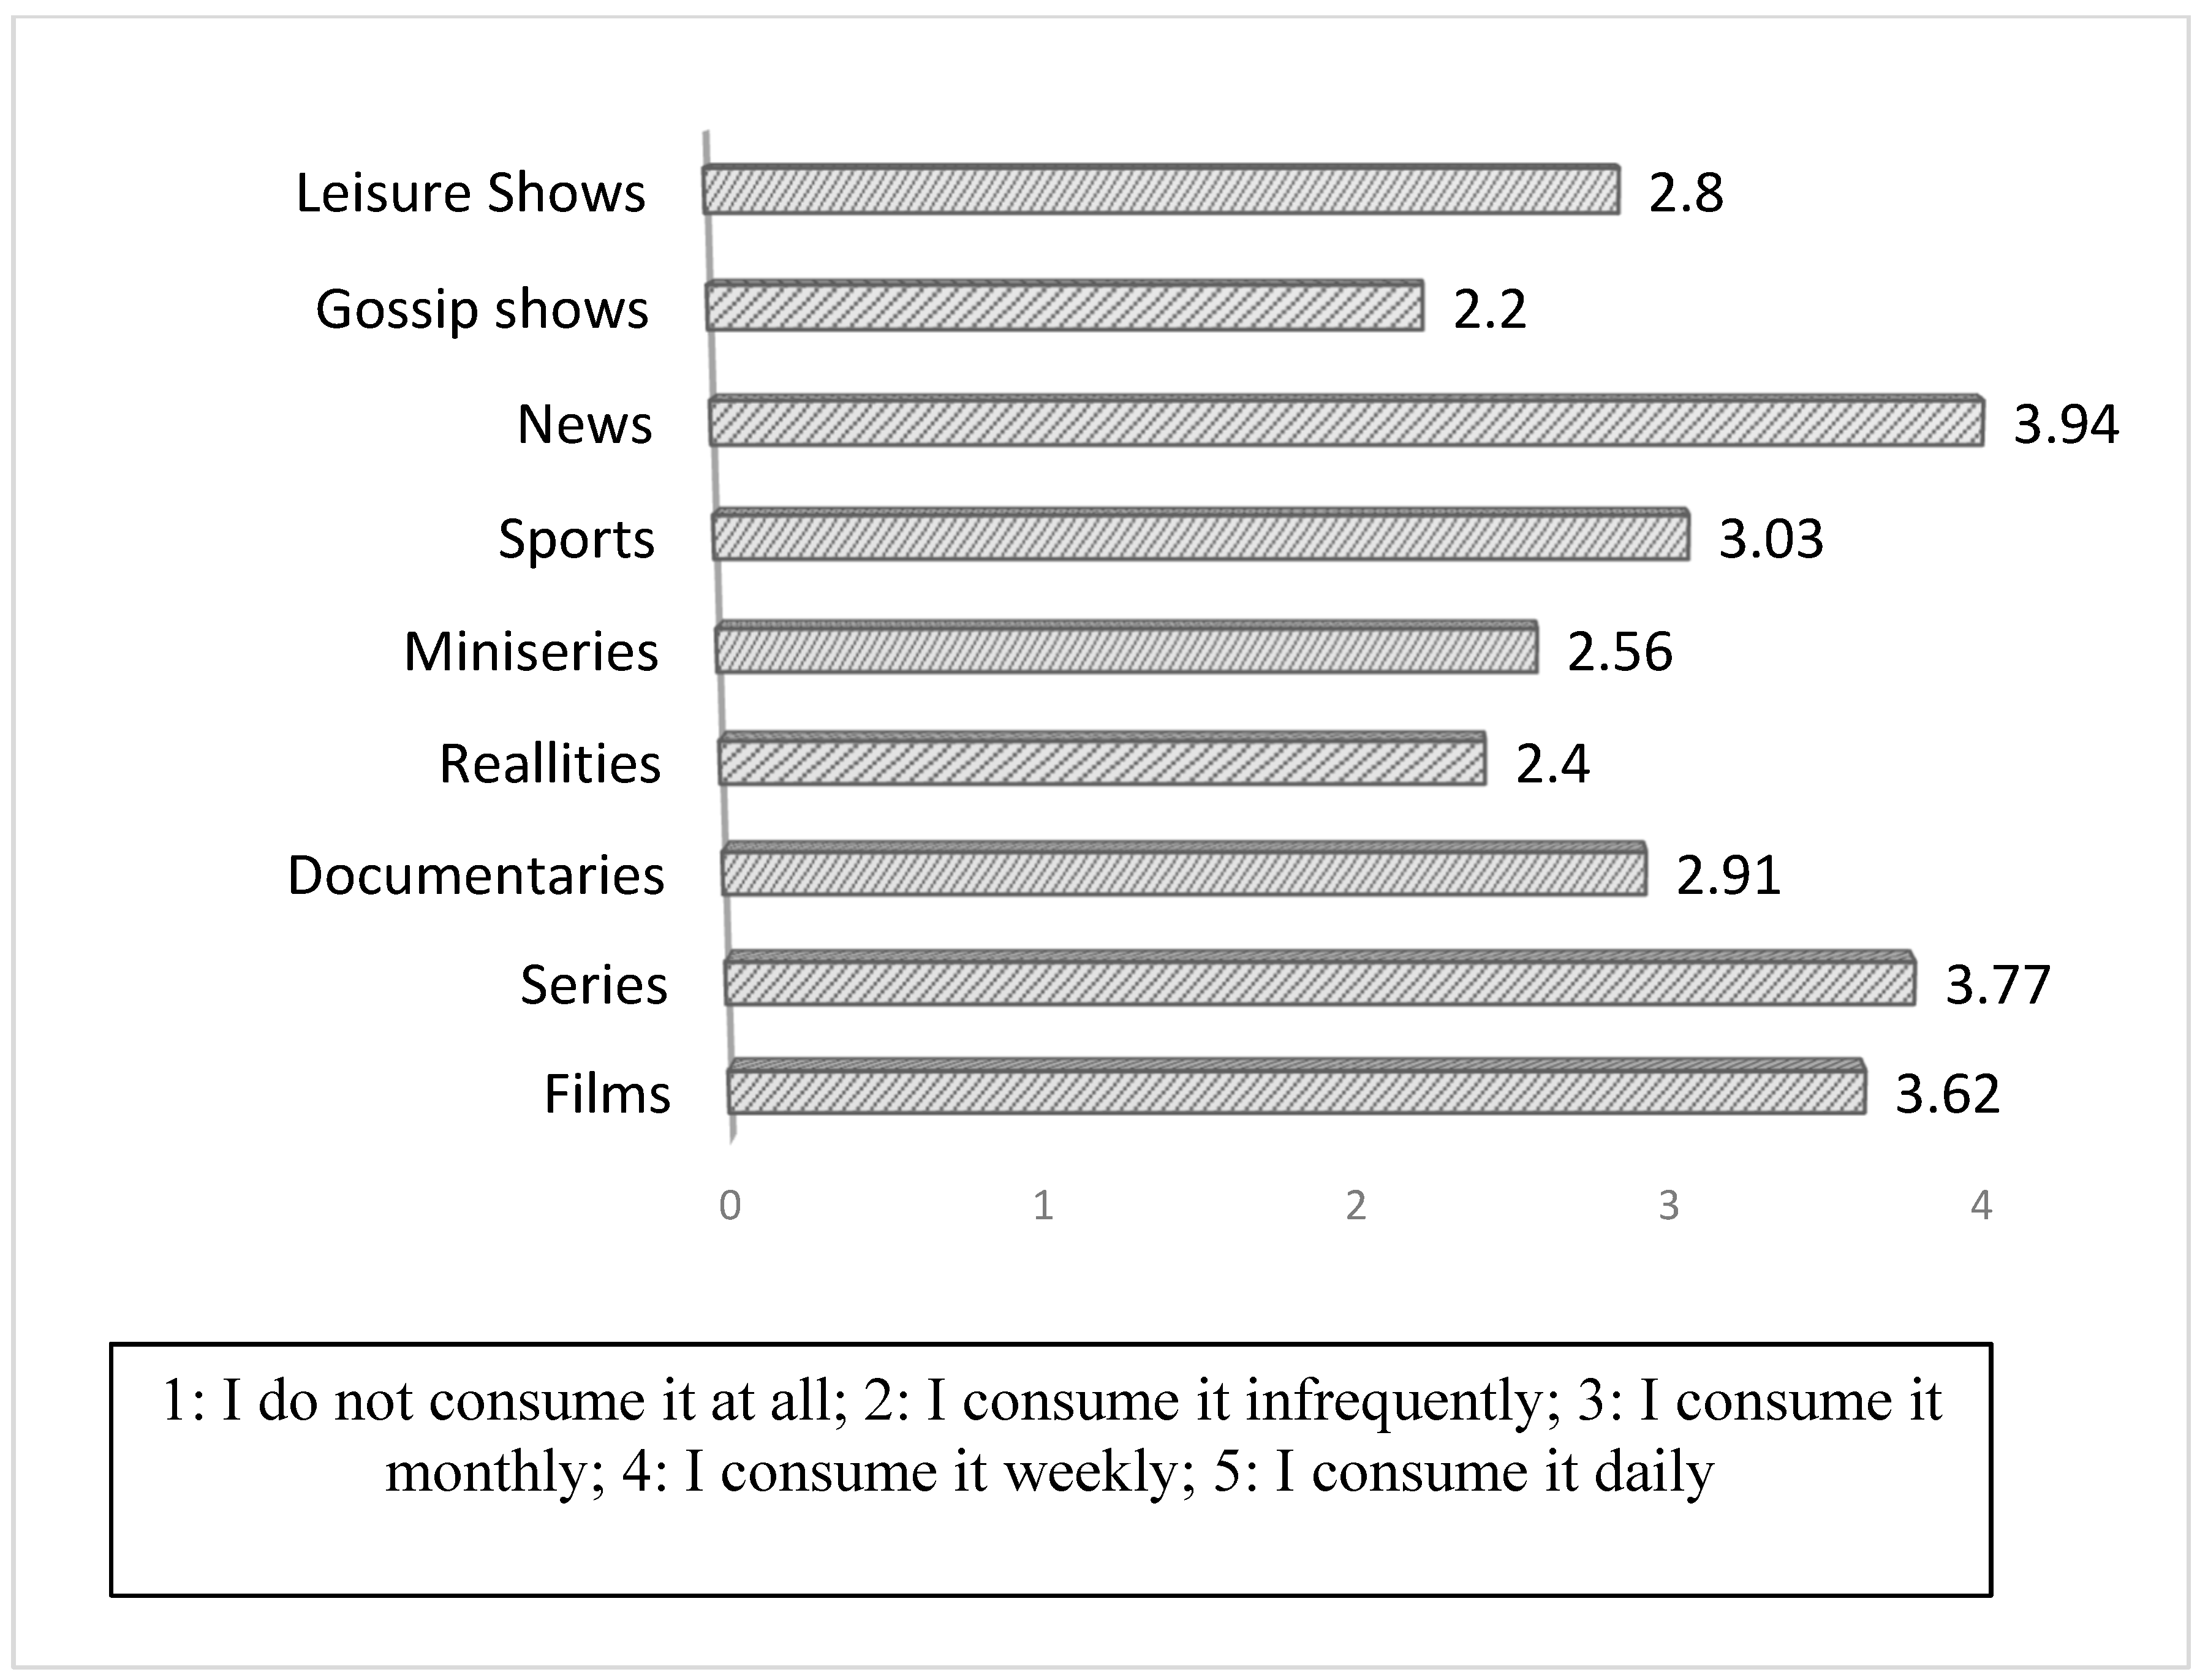
The TV series consumption presented an average of 3.77 (close to 4, which implies weekly consumption, as addressed in Figure 1) and a mode of 4 (selected by 39.9% of respondents) in the adopted Likert scale. Therefore, it is second only to news within the study’s sample. In summary, viewers mostly consumed TV series and films in their leisure time, at least monthly, and some groups even weekly.
Finally, as shown in Table 16, the typical spectators who consumed series weekly were women, between 25 and 44 years old, with higher education degrees, who earn less than 3000 euros per month and with a family unit of three individuals or less. In addition, the mode within all demographic groups was 4, which implies a weekly consumption. The exception was the group of people with higher education degrees, who consumed TV-series even more frequently, as they had a mode of 5, indicating a daily consumption.

5. Discussion

Offering unique experiences tailored to each customer’s taste, is a strong trend in the current economy (Paús and Molina 2014), especially in industries related to leisure and entertainment. Such a trend is particularly relevant for the audiovisual industry, which has experienced a significant growth since 2005 (Rodríguez et al. 2005). In this context, the industry has differentiated its offer both through enhanced products (feature films, series, sports, documentaries …) and by allowing customers to view them through multiple platforms (e.g., TV, smartphone, Tablet …).
Additionally, different genres are constantly offered in order to suit different market segments. For example, in the case of series, there is comedy, drama, action, thriller, etc. This diversification is the result of different customer needs, which in turn, are a consequence of a diverse and heterogeneous society. As shown by the present study’s findings, for example, younger customers watch more feature films, series, and reality-shows, which corroborates the previous results of Vidales et al. (2012), according to which younger people prefer entertainment over information. Additionally, previous investigations predicted that audio-visual consumption would increasingly take place through different platforms, especially on demand ones (Kupferschmitt 2015; Mikos 2016). This is also corroborated by the present work, again, particularly with younger spectators.
The findings also point to new opportunities for this sector, which can be financed by using its products (series, feature films, programs …) as a means of disseminating other products and brands. More specifically, advertisers can use the knowledge provided by the present work regarding the demographics that are more interested in each type of audiovisual product to make more informed decisions within their advertising strategies. In certain countries, such as China, for instance, audio- visual consumption is increasing substantially (Vlinkage 2016). Moreover, streaming platforms use series as marketing tools by selling whole seasons (Tryon 2015). In this context, these platforms allow for a continued consumption, which in turn, leads spectators to create stronger bonds with the series, and even identify with characters, actors and plots (Fu et al. 2016; Horton and Wohl 1956). This whole new way of consuming TV series makes such products significantly more attractive (Kranz 2015) and accessible for bigger audiences, which has a huge contribution to their current increased popularity.

6. Conclusions

6.1. The Audiovisual Profile

The current consumer is more interested in having more leisure time than in earning extra money. This is implied in a series of changes in their needs, and consequently, in their consuming habits. In this context, as pointed out by Serra and Salvi (2014), culture and entertainment, and more specifically, TV shows, become staples of contempory leisure. Therefore, the audio-visual industry plays an important role in the so-called new era, or leisure society.
More recently, with the advent of new information technologies, audio-visual consumption gained new dimensions, as contents can now be accessed through different devices and in very diverse circumstances (García and María 2014). In parallel, TV series gained extraordinary popularity, and are currently the most frequently consumed audio-visual product after news. TV series are mostly watched via DTT television, streamed on different devices (tablets, smartphones or portable computers). Online TV series consumption (including downloaded episodes and streaming, either through television networks’ websites or through dedicated platforms) is expected to increase even further in the coming years. New technologies also allow for new ways of interacting with TV shows and fellow spectators, for instance, as observed by Harrington et al. (2012), through online comments and discussions.
The results of the present investigation showed that audio-visual consumption is significantly related to sociodemographic variables, particularly in terms of choice of audio-visual media and products. In this context, corroborating the results obtained by Vidales et al. (2012), the younger audience consume more audio-visual products. Moreover, the findings also point out that men consume more than women. Regarding income, wealthier people consume more cinema and TV, and are more likely to pay for it. Inversely, those who have lower incomes consume more DTT TV, radio, and multimedia applications. Regarding the products consumed, in relation to gender, women prefer reality-shows, TV series, heart1 and leisure programs, while men prefer sports. Reality-shows are mostly consumed by young students, while documentaries, mini-series, and feature films are preferred by seniors.
The present investigation contributes to understanding the audio-visual consumer. In this context, film and TV producers can use the achieved findings as a basis for their marketing strategies. Moreover, results can also orientate the choice of advertisers regarding which audio-visual product to be associated with, depending on their target audience.

6.2. Implications for the Audiovisual Sector

The results of the present study bring about some relevant implications for the Spanish audiovisual sector. Knowing which demographic groups are the most interested in each product, executives can make more informed decisions about which types of products to create or broadcast in order to attract a higher number of viewers. As an example, the results suggest that producers should broadcast more reality-shows and mini-series on TV channels and online platforms aimed at younger audiences, as they show a higher demand for these types of products. In the case of TV channels, these products should be broadcast in times that better suit the audience. Accordingly, documentaries should be broadcast in times when seniors most watch TV. Additionally, advertisers can use this knowledge to decide which programs’ audience best matches their target markets.

6.3. Limitations of the Study and Future Lines of Research

The main limitation of the present study is with regard to its setting, which was limited to Spain. Hence the results cannot be extrapolated to other countries. As audiovisual consumption varies according to the socio-demographic profile, it can also do so according to the geographical area in which consumers live, since it implies different habits and culture. In this context, future studies should expand the findings obtained in the present investigation by exploring the relationship between audiovisual consumption patterns and sociodemographic variables in other countries, as well as by carrying out cross-cultural comparisons.

Author Contributions

Conceptualization, N.A.V., J.A.F.B. and L.C.; Formal analysis, N.A.V. and L.C.; Investigation, N.A.V. and J.A.F.B.; Methodology, N.A.V. and J.A.F.B.; Project administration, N.A.V.; Resources, N.A.V.; Supervision, N.A.V.; Validation, N.A.V.; Writing—original draft, N.A.V. and L.C.; Writing—review & editing, N.A.V. and L.C.

Funding

This research received no external funding.

Conflicts of Interest

The authors declare no conflict of interest.

Appendix A. Survey

Number………………………  Date………………………
Socsci 08 00239 i001
PRESENTATION: Good morning/afternoon. We are conducting research on the habits of consumption of the viewer (from the University of Vigo). We would appreciate if you could dedicate a few moments of your time to fill out the questionnaire. The data will be confidential and treated only globally. Thank you very much in advance for your time.
PART A: Audiovisual sector. Habits.
1. 
Within the audiovisual sector, which of the following media/subsectors do you usually consume? (Mark from 1 to 5, being 1: I do not use it at all, 2: I consume it infrequently, 3: all month, 4: all week, 5: daily).
Cinema12345
TV/DTT12345
Pay TV12345
Video/DVD12345
Multimedia        12345
Radio12345
2. 
Regardless of the subsector in which it is consumed, what are the products that you consume the most in these media? (Mark from 1 to 5, being 1: I do not use it at all, 2: I consume it infrequently, 3: all month, 4: all week, 5: daily).
Films12345
Series 12345
Documentaries12345
Realities12345
Mini-series12345
Sports12345
News12345
Gossip shows12345
Leisure and entertainment shows    12345
PART B: Profile
INDICATE TO US NOW THE FOLLOWING INFORMATION, PLEASE
3. Gender
Man
Woman
4. Age
From 14 to 19 years old
From 20 to 24 years old
From 25 to 34 years old
From 35 to 44 years old
From 45 to 54 years old
From 55 to 64 years old
Over 65 years old
5. Qualifications
No studies
Primary studies
Secondary studies
Professional training
Bachelor
University degree
PhD or Postgraduate
6. Occupation
Employed worker
Official
Autonomous
Housekeeper
Student
In unemployment
Retired
7. Income
1501–3000 €
3001–4500 €
4501–6000 €
More of 6000 €
8. No. of family members ________________
THANK YOU FOR YOUR COLLABORATION!!

References

  1. AIMC (Asociación para la Investigación de Medios y Comunicación). 2017. Estudio Realizado a Través de su Propio Panel Online AIMC Q Panel. Madrid: AIMC Q Panel. [Google Scholar]
  2. Anderson, David, Dennis J. Sweeney, Thomas A. Williams, Ma. del Carmen Hano Roa, and Dra. Teresa López Álvarez. 2001. Estadística para Administración y Economía. No. 311 A54Y. Mexico: International Thomson. [Google Scholar]
  3. Brunsdon, Charlotte. 2012. Bingeing on box-sets: The national and the digital in television crime drama. In Relocating Television. New York: Routledge, pp. 85–97. [Google Scholar]
  4. Chiu, Cindy, Chris Ip, and Ari Silverman. 2012. Understanding social media in China. McKinsey Quarterly 2: 78–81. [Google Scholar]
  5. Fu, Hui, Ben Ye, and Junzhi Xiang. 2016. Reality TV, audience travel intentions, and destination image. Tourism Management 55: 37–48. [Google Scholar] [CrossRef]
  6. García, Joaquín. 2017. El cambio audiovisual. La TDT sustituye a la televisión analógica en España. Hologramática 3: 87–98. [Google Scholar]
  7. García, Benito, and José María. 2014. El nuevo escenario del mercado audiovisual: Un análisis prospectivo de un sector en crecimiento. Revista Mediterránea de Comunicación 5: 123–35. [Google Scholar] [CrossRef]
  8. Harrington, Stephen, Tim Highfiel, and Axel Bruns. 2012. More than a backchannel: Twitter and television. Audience Interactivity and Participation 10: 13–17. [Google Scholar]
  9. HBO. 2019. Available online: https://es.hboespana.com/ (accessed on 14 April 2019).
  10. Horton, Dondal, and R. Richard Wohl. 1956. Mass communication and para-social interaction: Observations on intimacy at a distance. Psychiatry 19: 215–29. [Google Scholar] [CrossRef] [PubMed]
  11. INE (Instituto Nacional de Estadística). 2017. Encuesta sobre Equipamiento y Uso de Tecnologías de Información y Comunicación en los Hogares. Madrid: INE. [Google Scholar]
  12. Jacobs, Steven. 2011. Hitchcock, the holocaust, and the long take: Memory of the camps. Arcadia-International Journal for Literary Studies 45: 265–76. [Google Scholar] [CrossRef]
  13. Kim, Sangkyun. 2012. Audience involvement and film tourism experiences: Emotional places, emotional experiences. Tourism Management 33: 387–96. [Google Scholar] [CrossRef]
  14. Kim, Jungkee, and Alan M. Rubin. 1997. The variable influence of audience activity on media effects. Communication Research 24: 107–35. [Google Scholar] [CrossRef]
  15. Kranz, Julian. 2015. Binge Watching. Die neue Attraktivität von Serien im Internet. TV Diskurs 19: 76–81. [Google Scholar]
  16. Krugman, Herbert E. 1966. The measurement of advertising involvement. Public Opinion Quarterly 30: 583–96. [Google Scholar] [CrossRef]
  17. Kupferschmitt, Thomas. 2015. Bewegtbildnutzung nimmt weiter zu–Habitualisierung bei 14-bis 29-Jährigen. Media Perspektiven 9: 383–91. [Google Scholar]
  18. Malhotra, Naresh. 2004. Investigación de Mercados: Un Enfoque Aplicado. Mexico: Pearson Education. [Google Scholar]
  19. Martí, Federico Pablo, and Carlos Muñoz Yebra. 2001. Economía del cine y del sector audiovisual en España. ICE, Revista de Economía 792: 124–38. [Google Scholar]
  20. Mateos, David Rodríguez, and Tony Hernández Pérez. 2015. Televisión social en series de ficción y nuevos roles del documentalista audiovisual: El caso de ‘El Ministerio del Tiempo’. Index. Comunicación: Revista Científica en el Ámbito de la Comunicación Aplicada 5: 95–120. [Google Scholar]
  21. Mikos, Lothar. 2016. Digital media platforms and the use of TV content: Binge watching and video-on-demand in Germany. Media and Communication 4: 154–61. [Google Scholar] [CrossRef]
  22. Mittal, Banwari. 1995. A comparative analysis of four scales of consumer involvement. Psychology & Marketing 12: 663–82. [Google Scholar]
  23. Muncy, James A., and Shelby Hunt. 1984. Consumer involvement: Definitional issues and research directions. ACR North American Advances 11: 193–96. [Google Scholar]
  24. Papa, Michael J., Arvind Singhal, Sweety Law, Saumya Pant, Suruchi Sood, Everett M. Rogers, and Corinne L. Shefner-Rogers. 2000. Entertainment-education and social change: An analysis of parasocial interaction, social learning, collective efficacy, and paradoxical communication. Journal of Communication 50: 31–55. [Google Scholar] [CrossRef]
  25. Paús, Fermín, and Marín Fernández Molina. 2014. Caso de éxito” Mamá Lucchetti”: Entendiendo al consumidor de hoy. Ciencias Administrativas 3: 53–65. Available online: https://www.redalyc.org/pdf/5116/511651379006.pdf (accessed on 14 April 2019).
  26. Perks, Lisa Glebatis. 2014. Media Marathoning: Immersions in Morality. London: Lexington Books. [Google Scholar]
  27. Perse, Elizabeth M. 1990. Involvement with local television news: Cognitive and emotional dimensions. Human Communication Research 16: 556–81. [Google Scholar] [CrossRef]
  28. Rainie, Lee, and Barry Wellman. 2012. Networked: The New Social Operating System. Massachusetts: MIT Press. [Google Scholar]
  29. Riley, Roger, Dwayne Baker, and Carlton Van Doren. 1998. Movie induced tourism. Annals of Tourism Research 25: 919–35. [Google Scholar] [CrossRef]
  30. Ritzer, Georgel, and Nathan Jurgenson. 2010. Production, consumption, prosumption: The nature of capitalism in the age of the digital ‘prosumer’. Journal of Consumer Culture 10: 13–36. [Google Scholar] [CrossRef]
  31. Roberts, Kevin. 2006. The Lovemarks Effect: Winning in the Consumer Revolution. London: Mountaineers Books. [Google Scholar]
  32. Rodríguez, Lorena, Valentín Alejandro Martínez, and Óscar Juanatey-Boga. 2005. Evolución en las preferencias de los consumidores de productos audiovisuales. Comunicar: Revista Científica Iberoamericana de Comunicación y Educación 25: 50. [Google Scholar]
  33. Rubin, Rebecca B., and Michael P. McHugh. 1987. Development of Parasocial Interaction Relationships. Journal of Broadcasting & Electronic Media 31: 279–92. [Google Scholar]
  34. Serra, Antoni, and Fabiana Salvi. 2014. New consumer behavior: A review of research on eWOM and hotels. International Journal of Hospitality Management 36: 41–51. [Google Scholar] [CrossRef]
  35. Sood, Suruchi. 2002. Audience involvement and entertainment—Education. Communication Theory 12: 153–72. [Google Scholar]
  36. Tryon, Chuck. 2015. TV got better: Netflix’s original programming strategies and the on-demand television transition. Media Industries Journal 2. [Google Scholar] [CrossRef]
  37. Vidales, Nereida López, Patricia González Aldea, and Elena Medina de la Viña. 2012. Jóvenes y televisión en 2010: Un cambio de hábitos. Zer-Revista de Estudios de Comunicación 16: 97–113. [Google Scholar]
  38. Vivanco, Manuel. 2005. Muestreo Estadístico. Diseño y Aplicaciones. Santiago de Chile: Editorial Universitaria. [Google Scholar]
  39. Vlinkage. 2016. Private System Data. Available online: http://vbk.vlinkage.com/ (accessed on 22 April 2019).
  40. Wang, Danqing, and Juan García. 2017. Popularity and Activity in Social Networks: An analysis of their impact on chinese online series. International Journal of Marketing, Communication and New Media 5: 84–103. [Google Scholar]
  41. Zaccone, Emanuela. 2011. TV series and Social Network marketing: The Audiovisual Text as a Wider Experience. In Previously On: Interdisciplinary Studies on TV Series in the Third Golden Age of Television. Sevilla: Biblioteca de la Facultad de Comunicación de la Universidad de Sevilla, pp. 387–403. [Google Scholar]
1
In Spain they are a type of usual program within television programming, also called the pink press. Their content consists mostly of news about the lives of celebrities, which might include socialites, artists, and reality-show participants.
Figure 1. Consumptions’ average of audiovisual products.
Socsci 08 00239 g001
Table 1. Analyzed variables.
Dependent VariablesIndependent Variables
Choice of audiovisual mediaGender
The choice of audiovisual products consumedAge
Qualifications
Occupation
Income
No. family members
Table 2. Technical data of the study.
FeaturesSurvey
UniverseSpectators from Spain
Geographical scopeSpain
Sample size484 valid questionnaires
Sample error±4.5%
Confidence level95% Z = 1.96; p = q = 0.5
Sample designSystematic random sampling
Method of collecting informationPersonal survey
Table 3. Recoding sociodemographic variables and profile of the sample.
VARIABLEFreq%VARIABLEFreq%
GENDER AGE
 Men20843% From 14 to 24 years old8417.4%
 Women27657% From 25 to 44 years old27156%
 Over 44 years old13226.6%
EDUCATIONFreq%OCCUPATIONFreq%
 Secondary school17035.1% Employed30863.6%
 Professional education17436% Students7816.1%
 Higher education14028.9% Unemployed9820.3%
MONTHLY INCOMEFreq%NUMBER OF FAMILY MEMBERSFreq%
 Less than 3000 per month34970.9% 3 or fewer members33970.1%
 More than 3000 per month14120.1% More than 3 members14529.9%
Table 4. Pearson’s chi-square tests between means of accessing audio-visual content and sociodemographic variables.
MediaBilateral Asymptotic Significance
GenderAgeEducationOccupationMonthly IncomeNumber of Family Members
Cinema0.5290.0000.0000.0010.0000.393
TV/DTT0.0140.3230.0080.5320.0010.125
Paid TV0.0540.0000.1180.4040.0010.411
Video/DVD0.9880.0000.0000.0030.0000.478
Multimedia0.0020.0000.0690.0000.0430.191
Radio0.5830.0000.3790.0670.0020.258
Table 5. Choice of audio-visual media outlet according to age (averages).
MediumAverage
From 14 to 24 Years OldFrom 25 to 44 Years OldMore than 44 Years Old
Cinema2.812.642.25
Pay TV2.392.131.80
Video/DVD2.832.652.40
Multimedia 3.332.331.78
Radio3.053.703.64
1: I do not consume it at all; 5: I consume it daily
Table 6. Cinema, TV, and video/DVD consumption according to education (averages).
MediumAverage
Secondary SchoolProfessional EducationHigher University Studies
TV/DTT4.364.194.38
Cinema2.462.662.58
Video/DVD2.562.542.78
1: I do not consume it at all; 5: I consume it daily
Table 7. Cinema, video/DVD, and multimedia consumption according to occupation (averages).
MediumAverage
EmployedStudentsUnemployed
Cinema2.622.762.55
Video/DVD2.652.812.36
Multimedia2.203.332.08
1: I do not consume it at all; 5: I consume it daily
Table 8. Audiovisual consumption according to monthly income (averages).
MediumAverage
Less Than 3000 EurosMore Than 3000 Euros
Cinema2.432.91
TV/DTT4.404.10
Paid TV1.982.34
Video/DVD2.612.64
Radio3.653.45
Multimedia2.402.24
1: I do not consume it at all; 5: I consume it daily
Table 9. Sociodemographic variables that influence audiovisual media consumption.
VariableRelated Media Choice
GenderMultimedia
TV/DTT
AgeCinema
Paid TV
Video/DVD
Multimedia
Radio
EducationCinema
Video/DVD
TV/DTT
OccupationCinema
Video/DVD
Multimedia
Monthly IncomeCinema
TV/DTT
Paid TV
Video/DVD
Radio
Multimedia
Table 10. Pearson’s chi-square test between audiovisual products and profile variables.
Audiovisual ProductBilateral Asymptotic Significance
GenderAgeEducationOccupationMonthly IncomeNumber of Family Members
Films0.3200.0240.8380.0070.1210.528
TV series 0.0160.0090.0070.4170.3000.163
Documentaries0.2580.0000.1080.0000.5350.289
Reality shows0.0000.0000.2550.0000.2490.055
Miniseries0.5520.0290.0020.0240.1040.552
Sports0.0000.2810.0000.7910.0840.198
News0.6130.0000.1870.0870.0410.912
Gossip shows0.0000.0000.1030.0000.6150.013
Entertainment shows0.0000.0000.0000.0030.6090.080
Table 11. Audiovisual product consumption according to gender (averages).
Average
GenderSeriesReality ShowsSportsGossip ShowsEntertainment Shows
Men3.662.133.821.782.46
Women3.862.612.442.523.05
1: I do not consume it at all; 5: I consume it daily
Table 12. Audiovisual products consumption according to age (averages).
Audiovisual ProductAverage
14 to 24 Years Old25 to 44 Years OldMore Than 44 Years Old
Films3.623.903.61
TV series3.323.653.73
Documentaries2.423.042.95
Reality shows3.032.292.24
Mini-series2.512.662.40
News3.263.924.21
Gossip shows2.302.052.45
Entertainment shows2.712.772.91
1: I do not consume it at all; 5: I consume it daily
Table 13. Audiovisual products consumption according to education (averages).
Audiovisual ProductAverage
Secondary SchoolProfessional EducationHigher Education
Series3.723.833.76
Mini-series2.522.642.51
Sports3.193.172.66
Gossip shows2.432.112.03
1: I do not consume it at all; 5: I consume it daily
Table 14. Audiovisual products consumption according to occupation (averages).
Audiovisual ProductAverage
EmployedStudentsUnemployed
Films3.673.273.71
Mini-series2.602.412.55
Documentaries3.055.522.78
Reality shows2.152.952.77
Gossip shows1.962.422.78
Entertainment shows2.702.663.22
1: I do not consume it at all; 5: I consume it daily
Table 15. Sociodemographic variables that influence audiovisual products consumption.
VariableRelated Choice of Audiovisual Products
GenderSeries
Reality shows
Sports
Gossip shows
Entertainment shows
AgeFilms
TV series
Documentaries
Reality shows
Mini-series
News
Gossip shows
Entertainment shows
EducationTV series
Mini-series
Sports
Entertainment shows
OccupationFilms
Mini-series
Documentaries
Reality shows
Gossip shows
Entertainment shows
Monthly incomeNews
Number of family membersGossip shows
Table 16. Series consumption according to demographic variables.
VariablesConsumption (%)
I Do Not ConsumeLow FrequencyEvery MonthEvery WeekEvery Day
GenderMen5.778.1721.6343.2721.15
Women1.8110.5118.8437.3231.52
Age14 to 24 years old8.3310.7115.4841.6723.81
25 to 44 years old2.218.8618.4537.6432.84
More than 44 years old3.1010.0826.3643.4117.05
QualificationsSecondary school2.3510.5920.0046.4720.59
Professional education 2.878.6217.2444.8326.44
Higher education5.719.2923.5725.7135.71
OccupationEmployed2.608.4419.8142.2126.95
Student7.6911.5416.6734.6229.49
Unemployed3.0611.2223.4736.7325.51
Monthly Income (euros)Less than 3000 2.6210.2018.6641.1127.41
More than 30005.677.8023.4036.8826.24
Number of family members3 or less2.9510.9119.7637.7628.61
More than 34.965.6721.2843.9724.11

