1. Introduction
Three decades ago, some European Union Member States started to encourage and protect some specific food products according to their principles that in some case, some of them were quite disparate. Against this background, the European Union was forced to find a convincing solution (inspired by existing national systems) with the sole objective of establishing uniform and fair conditions of competition to protect food products. In the earlies 1990s, the European Union set this quality system with a twofold objective: On the one hand, to ensure any consumer of any EU State Member that the production or processing of agri-food products is strictly controlled with the highest standards or connected with a particular territory and, on the other hand, to protect regional producers and provide them with a powerful tool to benefit the commercialization of those quality products with a significant comparative advantage (
European Commission (
2006) and
Dimara et al. (
2004)).
In this regulatory framework, European food policies have met consumers’ preferences, which are more and more focused on products whose characteristics may be differentiated from the rest of products, due to a greater certified quality. In this sense, the European program of label/certification schemes for quality production is designed to ensure the future of agriculture and assist rural development, as well as providing consumers with better information for purchasing decisions (
European Commission (
2006)). Moreover, the constant search of a more environmentally-friendly from both producers and consumers in the European Union (EU) along with the economic, environmental and social issues of conventional procedures has led into a greater boost of the quality products especially, those organic or under an official quality specification at the expense of conventional products.
The result is a new quality certified marketing chain whose structural characteristics deserve to be analyzed, in particular, the dynamics of prices in both the long-run and short-run so as to assess the performance of such schemes in reducing the price volatility, as well as satisfying the needs of a growing number of interested agents (producers, consumers, institutions). Food quality policy has attracted the growing interest of agricultural economists from different perspectives, especially from consumers’ (inter alia,
Bonnet and Simioni (
2001);
McCluskey and Loureiro (
2003);
Angulo and Gil (
2007);
Vecchio and Annunziata (
2011);
Verbeke et al. (
2012);
Rousseau and Vranken (
2013) and
Sckokai et al. (
2013)) or or food industry (see
McCorriston et al. (
2001);
Bouamra-Mechemache and Chaaban (
2010);
Carbone et al. (
2014) for instance), but it seems that the analysis of the price transmission mechanism within the supply chain has been rarely conducted for FQS products, which, in our view, should be needed to have a complete knowledge of the effects of such food policy along the whole marketing chain, especially, after the oil price increases of 2007 and 2008.
As opposed to conventional food sectors, for which the literature offers a large body of empirical studies in price transmission and market integration (recent surveys of
Meyer and Von Cramon-Taubadel (
2004);
Listorti and Esposti (
2012) and
Esposti and Listorti (
2013) to name a few of the most recent,
Goodwin and Harper (
2000) for pork;
Ben Kaabia et al. (
2005) for poultry; Lloyd et al. (2006) for beef;
Ben Kaabia and Gil (
2007) for lamb;
Ahn and Lee (
2015) for fresh fruits), the gap for quality food products linked to terroir has not been fulfilled yet as no published works have addressed this approach to date, though the recent study of
Antonioli et al. (
2018) for organic milk is a close attempt for quality-differentiated products. On this point, we should point out the difficulty of accessing data prices of these kinds of protected quality products because the information available from the statistical services of government agencies and respective regulatory councils is normally limited and when it exists normally is incomplete. This fact may be one reason behind the lack of empirical studies.
Despite the vast literature on price transmission analysis along food supply chains and in the recent context of the increasing complexity of food supply chains, no comparisons between quality and non-quality designated food products can be made so far. So, our paper is hence the first attempt to fill this gap in the literature. In particular, we explore the price transmission process along the supply chain (from farm to retail levels) for a protected designation of origin (PDO) dairy product in Italy. Especially, we focus on the PDO Parmigiano Reggiano cheese and the generic Caciotta cheese.
As the number of farmers producing the PDO product is significantly lower than in the case of the conventional counterpart and retailers are not able to buy these products in geographically separated markets, this is expected to result in a reduction in the market power at the retail level. As a consequence, we hypothesize that price fluctuations in the PDO cheese, due to unexpected supply and demand changing conditions, will be of the same magnitude both at the farm and retail levels. Moreover, we expect a quicker price transmission mechanism along the food supply chain in relation to the conventional product. To test this hypothesis, we perform a vector error correction model and compute impulse response functions to analyze the long-run and short-run dynamics respectively. The obtained results allow us to determine potential explanations for the differences between both markets and to assess whether the price transmission may be benefited from being under such a European quality label. Results from this study can be of interest for policy makers in the sense that if our hypothesis of a reduction of retailers’ market power in PDO products holds, this could be a good argument for maintaining the promotion of differentiated Quality Schemes in the EU food sector.
To this end, we organize this paper as follows. In
Section 2, we provide a sound description of the PDO Parmigiano Reggiano cheese in Italy. In
Section 3, we describe the methodological approach used. In
Section 4, we present the data set, report and discuss the results.
Section 5 concludes the paper.
2. Protected Designation of Origin Parmigiano Reggiano in Italy
In Italy, the milk supply chain is strongly conditioned by the high production of PDO cheeses. In 2016 (last year available) 47% of the cow milk produced was used to produce PDO cheeses (
Assolatte 2017). In particular, two cheeses alone use about 40% of the available milk (23% for Grana Padano PDO and 16% for Parmigiano Reggiano PDO), while the others PDO cheeses from cow milk represent the 0.09% of the national milk production. Despite Parmigiano Reggiano is the second cheese produced (in volume), it is the most famous Italian cheese in the world. Its reputation is strictly linked to the production system that reflects the social economic structure of the dairies in the Parmigiano-Reggiano area. Nowadays the quality level of the cheese and the agent behavior is strongly oriented by the PDO Inter-branch Organization (Parmigiano Reggiano Consortia) (
Giacomini et al. 2012).
As a PDO product, milk and cheese production must coincide in the same territory defined by the code of specification and represented by the provinces of Parma, Reggio Emilia, Modena, part of Bologna (left the province of the Rhine River) and part of the Mantua province (south of the river Po). Moreover, the hay used to feed the cows must be produced mainly in the territory of production, while the seasoning of the cheese (up to 12 months). The supply chain of this famous cheese collects about 15% of Italian milk production. However, the consumption of Parmigiano Reggiano is not confined within the typical area, indeed, most of the cheese produced is sold in the national and European market. It can be said that the Parmigiano Reggiano system has its roots in the typical area, but has important commercial relationships also with other regions, while the value chain extends widely the boundary outlined by the typical area (
Arfini and Mancini 2013).
The structure, organization and its strategies for the production and marketing of Parmigiano Reggiano can be considered the result of a process where different actors with various interests, found a functional balance. In productive and structural terms Parmigiano-Reggiano it is characterized by an overall production of cheese slightly higher than three million forms obtained in 393 dairies, of which 257 managed in cooperative form, which in turn collect the milk of 3000 farms. (Production year of 2017). The value chain is therefore made up of breeders, dairies, traders, and the distribution network. While the farmers and dairies act exclusively within the territory, traders can perform their curing action (12 months of seasoning) even outside the typical area moving into warehouses in other regions.
The production of Reggiano-Parmesan cheese starts from the stables of milk producers, whose production takes place in compliance with the production specification, which obtains a high dairy milk attitude in tune with a handicraft production process. Milk production is then delivered to dairies. Within the supply chain there are three categories of breeders: (i) Farmers who give milk to cooperative dairies and therefore members of the same cooperatives; (ii) dairy farmers who donate milk to non-cooperative dairies classified as artisanal or industrial (based on the volume of processed milk); (iii) dairy farmers self-conferring milk in their own dairy. This feature is very important, because it is the productive decisions of the agricultural companies that influence the trend of the milk supply and, therefore, of cheese. As a consequence, the behavior and strategies of the farms are of fundamental importance, since they influence, in turn, the strategies of the dairies. The production strategies and control of the offer, however, are decided by breeders who, according to EU Regulation 1151/2012, own a “cheese quota”, which in fact coincides with the milk produced. The exceeding of the quota involves the payment of a fine to the Consortium, which will use it to promote cheese in the markets.
The dairies of the Parmigiano-Reggiano system have the main characteristic of being a single-product company represented by Parmigiano Reggiano cheese and its derivatives (cream, butter, whey, ricotta). Moreover, in this case there are three different types of dairies: (i) Cooperatives; (ii) non-cooperative; (iii) artisanal. The cooperative dairies represent the main productive component of the Parmigiano-Reggiano system. This type of firms represents about 60% of dairies. Their commercial strategy is to season the cheese for up to 12 months and then sell all the production to seasonal-wholesalers, who in turn, age the cheese until 24 months. Then, the cheese is sold directly to the commercial distribution (
Arfini et al. 2006).
In the functioning of the value chain of Parmigiano Reggiano, the role of seasoning by tradres (12, 18 or 24 months of maturing is crucial in defining the price. Their commercial action is placed between dairies and distribution channels. The cheese is purchased in large homogeneous batches from dairies (usually three times of the year) and is sold in smaller volumes (in forms or packaged under vacuum) to the commercial distribution. Wholesalers, on one side set the price of cheese with dairies, but on the other hand, become “price taker” when they sell cheese to retailers.
Overall, the value chain of Parmigiano-Reggiano has some characteristics that influence its operation and efficiency: (i) It is a chain with a high level of information asymmetry. Prices of cheese lots sold by dairies are not known, is known only the “average price” of transactions made by the chambers of commerce after a negotiation between the agents that make up the commission. (ii) the wholesale market is characterized by the presence of oligopolists able to influence the price; (iii) the quality of the cheese does not affect the wholesale price. In this respect, even if it is a famous PDO, the Parmigiano-Reggiano has a similar trend to commodity goods; (iv) the retail strategy is unfair: Under the umbrella brand of the Parmigiano Reggiano there are no strong dairy or industrial brands and retailers often sell the cheese below cost to attract and retain customers. This behavior, even if it debatable, is allowed since there are not internal rules governing the issue of minimum prices or the setting of retail prices; the analysis of market trend at retail level is complex, since prices are collected by retail companies through Iri Infoscan or Nielsen and sell privately to stakeholders interested to know price evolution. All these aspects make the market of Parmigiano Reggiano a “black-box” where is very hard to know the dynamics of the agents and the distribution of value along the chain.
3. Methodological Approach
Understanding the price transmission process along the food supply chain maintains the interest among agricultural researchers because of its relevant implications for social and policy levels. Though the usual theoretical model underlying this sort of empirical studies assumes symmetric behavior in the transmission process which may be considered as clear evidence of an efficient market, recent works found the presence of significant asymmetries for which the debate on the underlying causes still continues to linger (see, for instance,
Antonioli et al. 2018 for a brief review). What is common in this debate is the presence of a threshold value that becomes a crucial figure in current alternative models used in this sort of empirical studies.
Our approach may be summarized by the following stages: In the first stage, we test the integration order of the price series considered in our models and if the unit root null is non-rejected then we test for cointegration. In the second stage, we test for asymmetries in the price transmission process. In the last stage, we estimate the corresponding model based on the decision made in the second stage to assess how prices are transmitted along chain actors of the food supply chain and explain the differences or similarities that exist between the quality protected and non-quality protected product.
That being so, this study employs some of the most recent contributions to the unit root literature. In particular, we consider some unit root tests (namely, the modified Sargan and Bargava test, hereafter, MSB test) proposed by the influential paper of
Ng and Perron (
2001) instead of the standard DF-type or PP tests. However, the decision made based on this test is not valid when a structural break exists in the time series because it is well known that their outcome is biased towards the non-rejection of the null. To deal with this problem, we apply the proposal by
Carrion-i-Silvestre et al. (
2009) to test for the presence of multiple unknown structural breaks in the level, intercept or intercept and slope of the series. Moreover, we test the null of stationarity against the alternative of the existence of a unit root in the series for confirmation purposes by means of the popular stationarity test of
Kwiatkowski et al. (
1992), hereafter, KPSS test.
As claimed by
Myers (
1994), normally many commodity prices are characterized as co-integrated which implies that nonstationary price time series share a trend in the long-run, and there are no incentives to deviate from this situation. But, if any unanticipated shock appears, there is a tendency to revert to the equilibrium. In this sense, the literature offers two widely used approaches: On the one hand, the approach developed by
Engle and Granger (
1987) which relies on a two-step estimator to test the parameters of a bivariate single-equation model; and, on the other hand, the
Johansen (
1988) approach, which consists of a maximum likelihood ratio test to test multiple co-integrating vectors. In this study, we follow the latter and apply the Bartlett corrected trace test to ensure reduced size distortions in the trace tests, due to the short-run effects of the VAR model (
Johansen 2002).
Once the presence of a long-term equilibrium relationship between the two-price series in each market, we test whether nonlinearities exist in the adjustment process. To do so, we follow
Lo and Zivot (
2001) the null of linearity against multivariate threshold vector error correction model (TVECM) by means of LR tests. Thus, in the first place we test for the null of a linear VECM against a two-regime TVECM considering the cointegration relationship as the threshold variable, and then we test for the null of a linear VECM against a three-regime TVECM, again considering the cointegration relationship as the threshold variable. If the null can be rejected, the threshold model is more appropriate to characterize the nonlinear dynamic adjustments of prices in the market. Otherwise, the linear model may be the best fit.
After the estimation of the dynamic price relationships in the long-term, we will explore the dynamics in the short-run by computing orthogonalized impulse response functions, henceforth IRFs, to measure how the deviations from the equilibrium adjust. This is of great interest to deepen the understanding of the dynamic relationships between prices along chain actors as they provide useful information about the size and persistence of the response of a specific variable to an unanticipated change in the other variable over time.
4. Empirical Results and Discussion
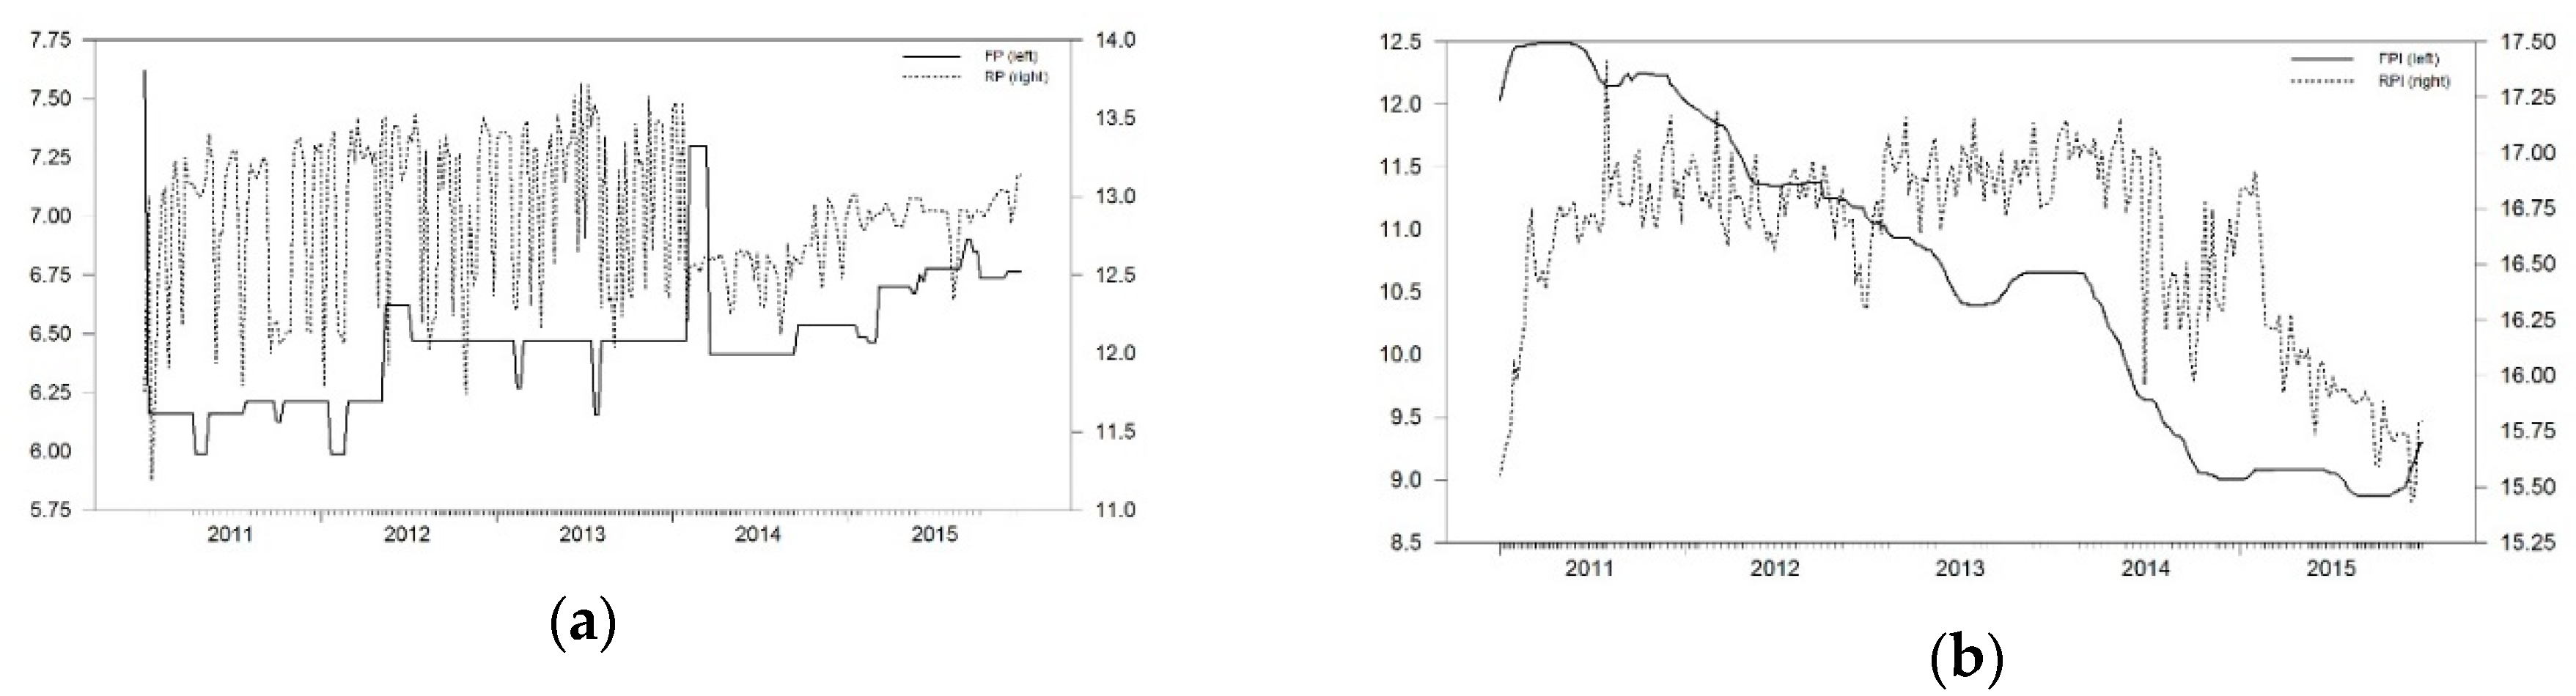
In this section, we present the results of the empirical analysis. Our dataset
1 contains the usual farm-retail pairwise prices, measured in €/kg, for the PDO Parmigiano Reggiano cheese and the generic Caciotta cheese covering the period from 2011 to 2015, and observed with weekly frequency, as shown in
Figure 1. In total, 260 observations per series. Looking at this figure, one may observe each pair of prices sharing a relationship in the long-term, being retail prices much more volatile than farm prices with limited responses of the latter. Also, all the prices exhibit visible fluctuations along with a decreasing trend for the quality cheese and a positive trend for the non-quality cheese.
Now, we report
Table 1, which contains a summary of some basic descriptive statistics along with some preliminary tests. All price series were transformed into logs to reduce the potential fluctuations according, for instance, to
Hamilton (
1994). According to the results obtained, we can exclude for three out of four series the presence of a linear trend. Unit root and stationary tests were applied to the series accordingly (
Table 2). Also, we tested for the presence of multiple structural changes under the null and the alternative hypotheses as in
Carrion-i-Silvestre (
2009) to avoid the bias of standard unit root tests towards non-rejection of the unit root null when a change is present (
Table 3). Results confirm that all the series considered are integrated of order 1.
Cointegration may exist when nonstationary variables, in our case, prices, shows a tendency to move together in the long-run and deviations from this equilibrium, due to unexpected shocks tend to revert eventually. In this case, we apply the maximum likelihood ratio test of
Johansen (
1988) to test multiple cointegrating vectors, which is based on the correct specification of a vector autoregressive model VAR(k) being k the optimal lag length (e.g.,
Juselius 2006;
Enders 2010).
Then, prior to testing for cointegration we select the number of lags of the unrestricted VAR model. Thus, the implementation of usual information criteria reports 2 lags and 3 lags for the quality and non-quality markets, respectively.
Once the lag order has been determined for each system, we test for cointegration and select the cointegration rank using the Bartlett corrected trace test
as in
Johansen (
2002). Results are presented in
Table 4 and
Table 5. As prices were considered in logs, we can interpret the cointegration parameters as price elasticities. In fact, the error correction term captures deviations from the long-run relations among prices considered. Thus, for the protected system, we found that farm prices exert higher influence on retail prices with a price elasticity of 11% whereas for the conventional system, that influence is not significant.
After having identified the presence of a stationary relationship in the long-run, now we explore whether the adjustment mechanism exhibit nonlinearities following
Lo and Zivot (
2001).
Table 6 reports the obtained results for both markets, the quality and non-quality. In particular, the LR tests indicate for the two markets that the null of the TVECM
2 against a TVECM
3 is rejected at the 1% level (LR
2,3), and that null of linearity cannot be rejected at the 5% significance level in favor of the linear VECM model against the TVECM
3 (LR
1,3). Hence, the results confirm the absence of nonlinearities in the model specification for the two markets
2. Consequently, we estimated a VECM for the non-quality and quality markets, respectively.
Table 7 and
Table 8 reports these results, which also ensure the absence of remaining residual autocorrelation.
Thus, we analyze the estimated coefficients, as they are relevant to describe which prices adjust to equilibrium and which do not. The results derived from the two markets indicate that only RP and FP responds in the non-quality and quality markets respectively, while that is true that the response in the quality market is low (0.09%).
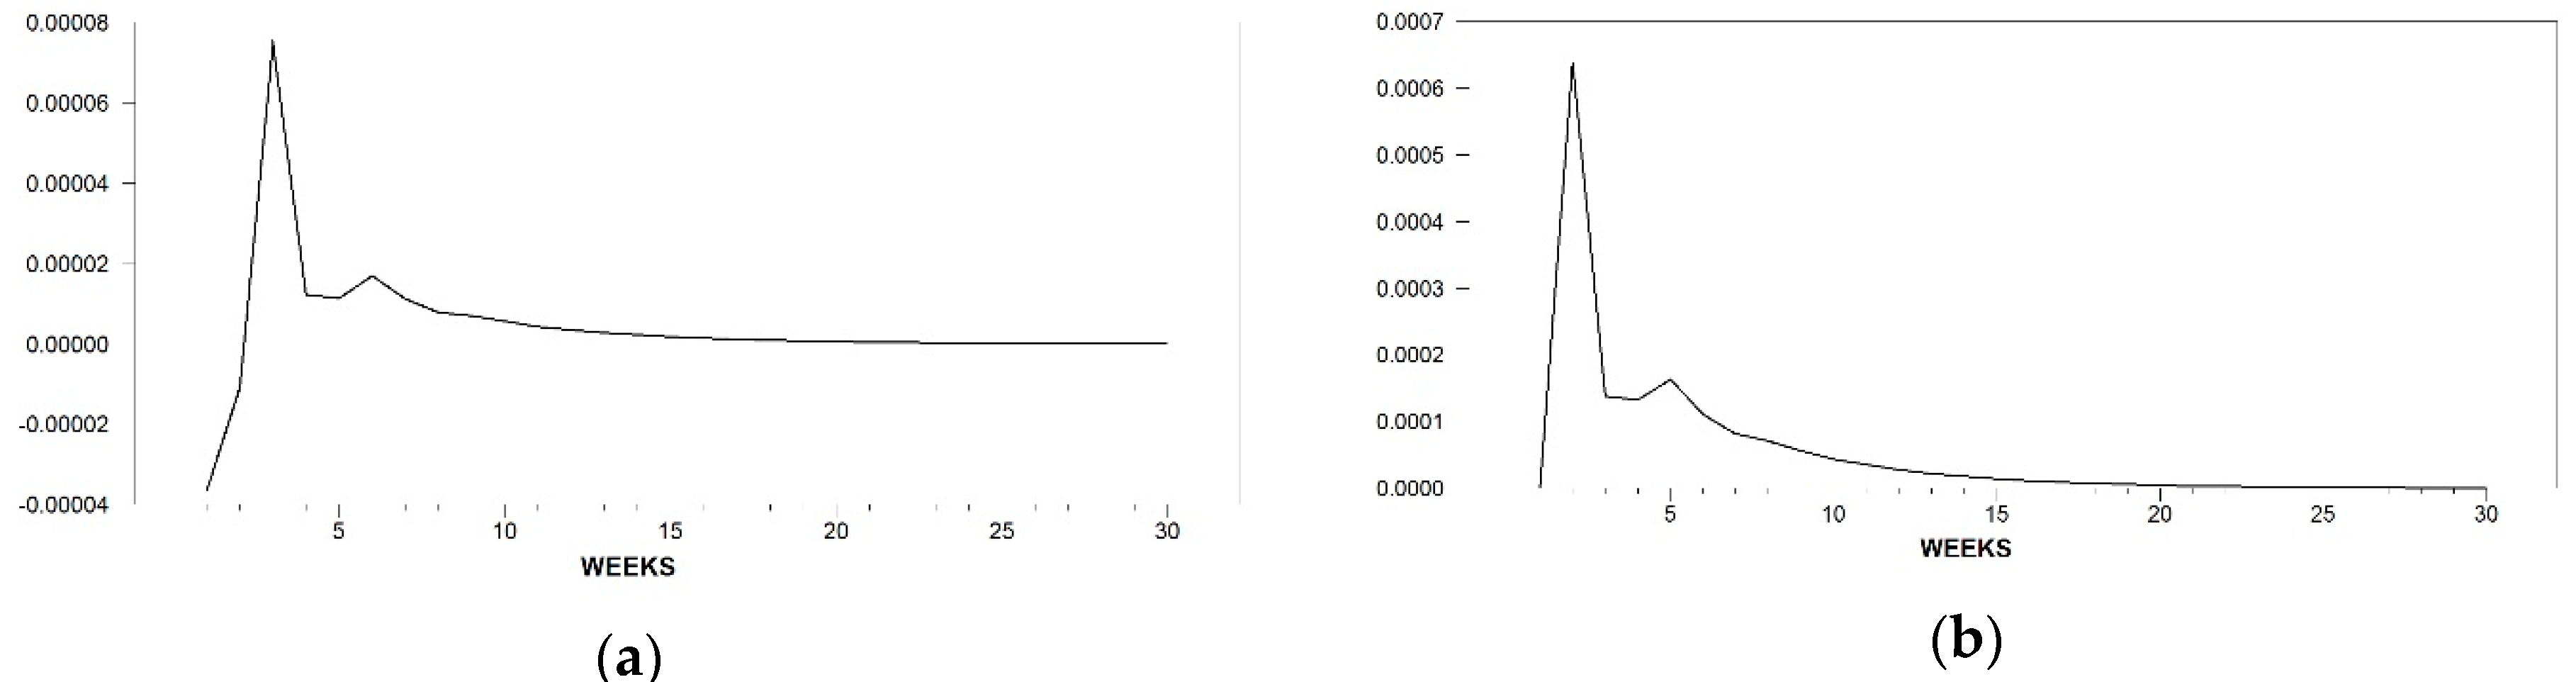
Now, to better understand the interpretation of the estimated VECMs we compute the impulse response functions (IRFs) because they give information about the characterization of the estimated dynamics of the VECMs by means of measuring the effects of price shocks evolving over time. So, the short-run dynamics are examined by computing the orthogonalized impulse response functions. In this case,
Figure 2 and
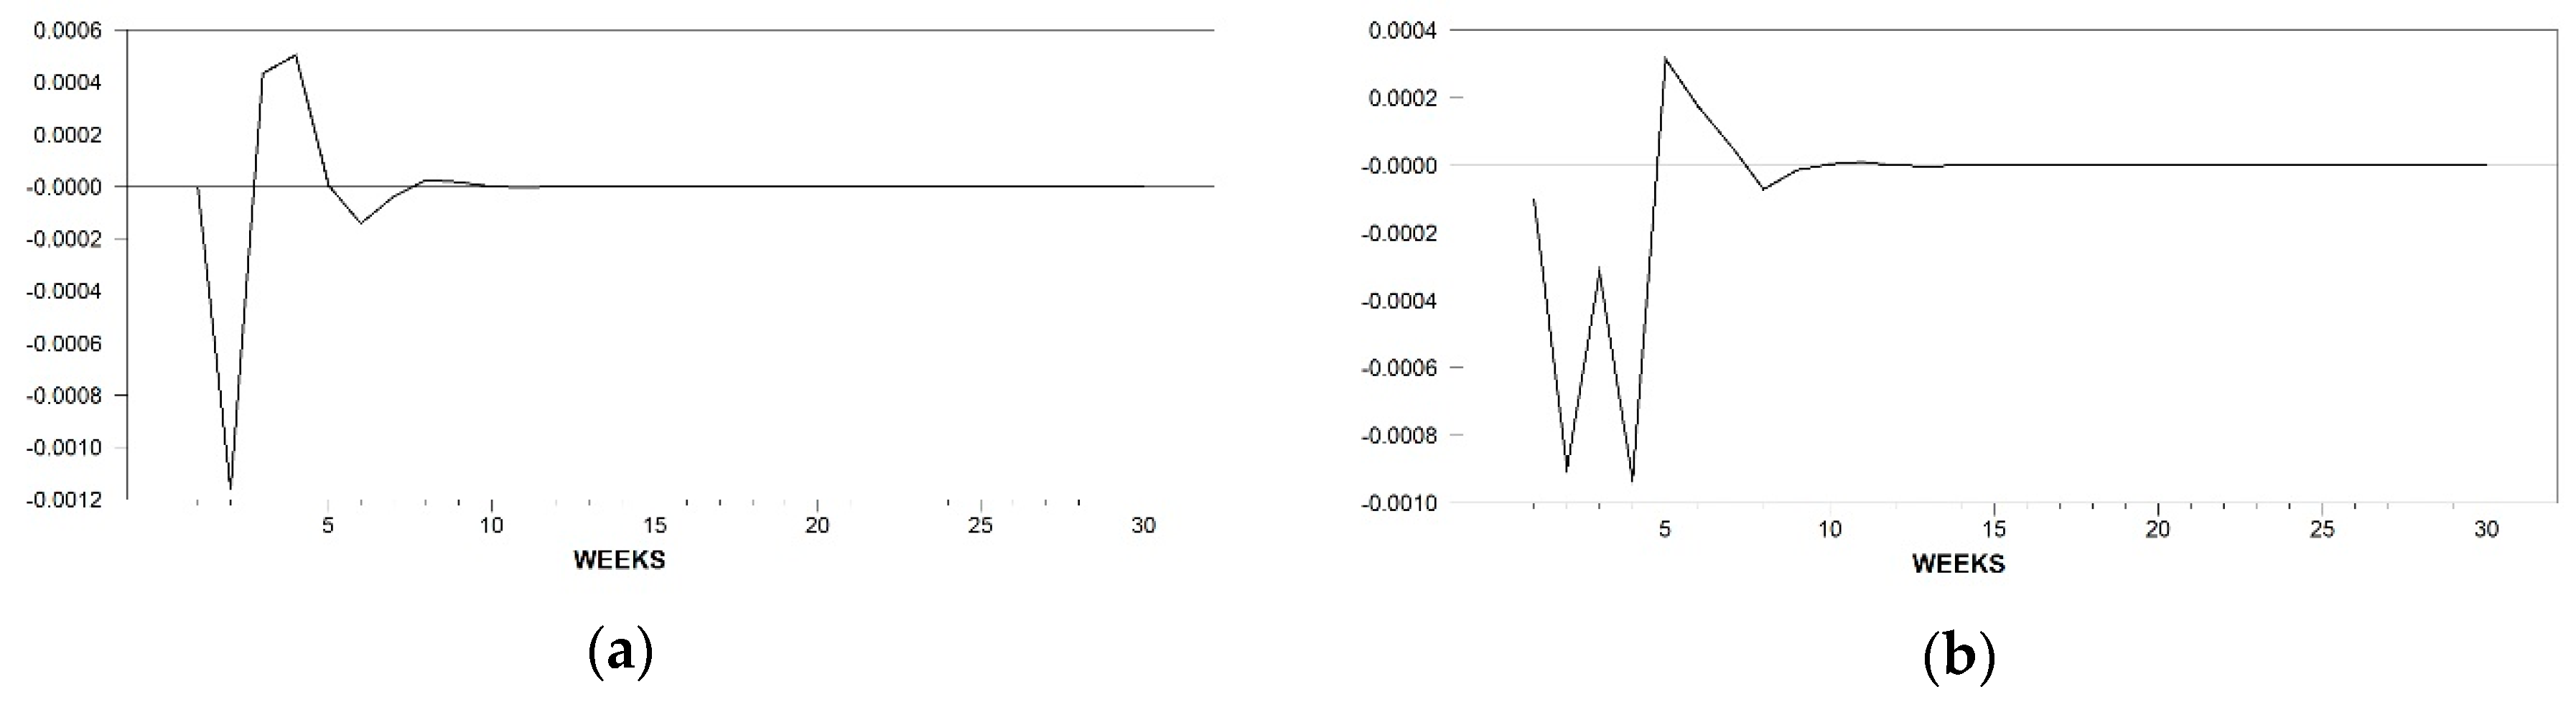
Figure 3 plot the IRFs for the quality and the non-quality product, respectively. Here, we only show the cross responses to any given shock. Figures follow the same structure: In the left panel (a), we show the retail price reaction to a shock in the downstream level and, the right panel (b) shows the farm price level response to a shock in the upstream level.
In
Figure 2, for the quality cheese, the RPI response is immediate negative and small in magnitude for the first two weeks where it reverts to positive and shows a detrending pattern that collapses to the equilibrium around week 16. The FPI reaction plotted in (b) is immediate too but slightly higher and positive at each time responsive period, which benefits the farmer for the responsive period by squeezing the margin. The value reaches the equilibrium with some delay, that is, by week 19.
As we can see in
Figure 3, the RP reaction to a shock in FP is not immediate, and for the first three weeks is negative before reverting to positive and briefly fluctuate around the zero-line until the equilibrium is achieved by week 10. Note that the magnitude in the positive response is less than half of the negative one. Similarly, the response of FP to a shock in RP is immediate and negative until the fifth week where it reverts to positive until the eighth week before reverting again to negative for two more weeks before reaching the equilibrium in week 10. Again, the responsive period as a negative reaction is more significant and longer than being positive, which may imply that when retail prices go up the farmer is quite affected as their prices decrease and hence the margin increases benefiting the retailer.
In this case, data shows that responses in the conventional system indicate that retailers may be benefited when prices increase, and that responses in the quality system suggest that farmers may not be too affected when retail prices go up as they react positively for a long significant period in which the margin is relatively squeezed.
Discussion
The aim of this study has been to assess the price transmission process within the supply chain of the PDO Parmigiano Reggiano cheese, one of the most famous Italian quality cheeses worldwide. Moreover, this investigation has also offered a comparison with the results of another Italian cheese, the Generic Caciotta, which is not designated with a European food quality label to study whether the two markets behave differently as the two cheeses have different characteristics, as well as differences in the structure of their respective supply chain.
Comparison of empirical findings with earlier empirical studies on the price linkages is generally difficult, due to the different characteristics of the dairy products and the perspectives adopted. In this case, this comparison exercise should be carried out with care. Keeping this in mind, we will try to compare our results with those of some relevant applied works that have dealt with the asymmetric price transmission on the dairy sector.
Thus, the obtained empirical results suggest that the farm-retail prices for the two cheese products (quality and conventional) are cointegrated sharing a tendency to move together in the long-term and hence, unexpected shocks will tend to revert in the end to the equilibrium. Also, the results for the two markets do not support the hypothesis of nonlinearities and hence indicate that prices are not subject to asymmetric price transmission. That is, prices do not tend to adjust more quickly when prices decrease that increase. The evidence of no asymmetries for the two cheeses could be somehow consistent with the idea of market power and symmetric price dynamics from
McCorriston et al. (
2001). Further, they could be sided with mixed evidence found by
Awokuse and Wang (
2009) who estimated price transmission for US dairy prices (whole milk and Cheddar cheese) using an error correction type model approach. However, it could be said that these results do not support the asymmetries found in the US dairy sector for example by
Kinnucan and Forker (
1987) or by
Serra and Goodwin (
2003) for the Spanish dairy sector.
5. Conclusions
Given the increasing complexity in modern agrifood supply chains and the wide diversity of products operating in relevant markets, the study of price transmission process along the supply chain has renewed the interest among agricultural economists. This paper provides new insights on the analysis of price transmission mechanism along the marketing chain of food products protected under a European Food Quality Scheme. The focus on food quality products is as a response of the growing interest of consumers, producers and food policy makers in the potential of these labels to augment competitiveness in domestic and international markets, as well as to maintain territorial and social cohesion.
The vast literature on the analysis of price relationships in the agricultural and food markets has mainly focused on how the pricing information is transmitted between chain actors for non-quality products. Hence, there is a gap in the literature because food quality schemes have not been explored yet. Our study contributes to filling this gap and provides novel results on price transmission analysis within the food supply chain under a quality scheme to provide an improved understanding of the performance of quality markets, as well as to compare the differences in the price transmission process among chain actors of their non-quality counterparts.
Our study examines the PDO Parmigiano Reggiano in Italy and considers the generic Caciotta as its non-quality counterpart. Weekly prices were observed for the two products at two levels of the food supply chain for each system, farm and retail. Datasets comprise a relevant period after the rise in prices by the end of 2007 and the relapse by 2011.
To achieve our main aim, we have used a multivariate vector error correction type approach. Our results reveal a long-run equilibrium relationship between farm and retail prices in the two markets. The relationship in the former is not significant, but that in the latter is quite stronger and statistically significant. Non-quality retail prices are characterized by a faster adjustment compared to farm prices, which were characterized by slow adjustments to deviations from the equilibrium, suggesting some degree of retail market power. Conversely, for the Parmigiano Reggiano cheese, farm prices have been characterized by a low adjustment. In this case, retail prices do not show statistically significant responses. As to the dynamics in the short-run, we computed linear impulse response functions. Asymmetries do not appear in both markets. These IRFs suggest that retailers in the non-quality market may benefit when prices go up and that responses for the quality market indicate that farmers may not be too affected when retail prices increase because the positive response is for a quite long significant period in which the margin is reduced.
In conclusion, this paper provides novel empirical results on the analysis of the vertical price transmission mechanism along the food supply chain of products designated under a European quality scheme. This is a relevant topic not only for chain actors, but also for policy makers, because it offers useful comparisons of the derived results from the quality products with those of their conventional counterparts to assess the extent to which the transmission mechanism differs along each chain, that is, to measure the differences of the magnitude of the response of prices at different levels of the marketing chain to a shock originating at one particular level of this chain; the speed, direction and nature of the response.
Finally, results should be interpreted with caution. Further research is needed before generalizing the results across the food product portfolio under a European quality scheme and countries. Efforts made by European agents to increase market transparency along the food supply chain have apparently not included food quality schemes. There has not been any systematic data collection for this kind of products, even when the EU is giving some significant support for promotion. We hope transparency will also arrive at FQS and more studies will be carried out to check if these schemes have been a useful tool to increase farmers’ market power and to improve the functioning of markets allowing prices to be quickly and fully transmitted along the food supply chain. In any case, this paper may encourage future researches on the price behavior along the supply chain under food quality schemes, as well as the implementation of further methodological refinements.


